Embed Size (px)
Citation preview
EIS 2014
Presenter: Dr. Zalilah Sharer
© 2014 UTM-MPRC Institute for Oil & Gas
Universiti Teknologi Malaysia
24 April 2014
013-7048889
Electrochemical Impedance
Spectroscopy
Contents
EIS
Principle
Overview of the technique
Equivalent circuit analysis
Circuit Elements
Common Equivalent Circuit Models
Extracting Model Parameter from
Impedance Data
Case study
EIS
Electrochemical impedance spectroscopy is a tool
in corrosion and solid state laboratories that is
slowly making its way into the service
environment as units are decreased in size and
become portable.
Impedance Spectroscopy is also called AC
Impedance or just Impedance Spectroscopy.
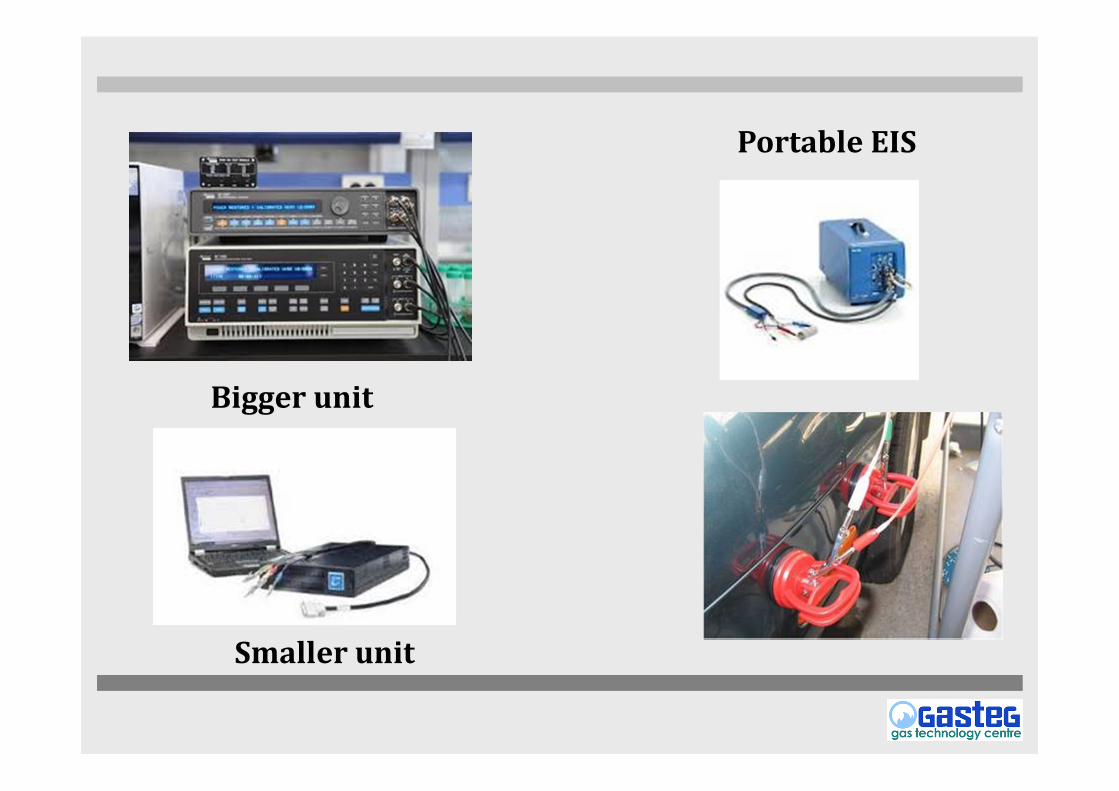
Portable EIS
Smaller unit
Bigger unit
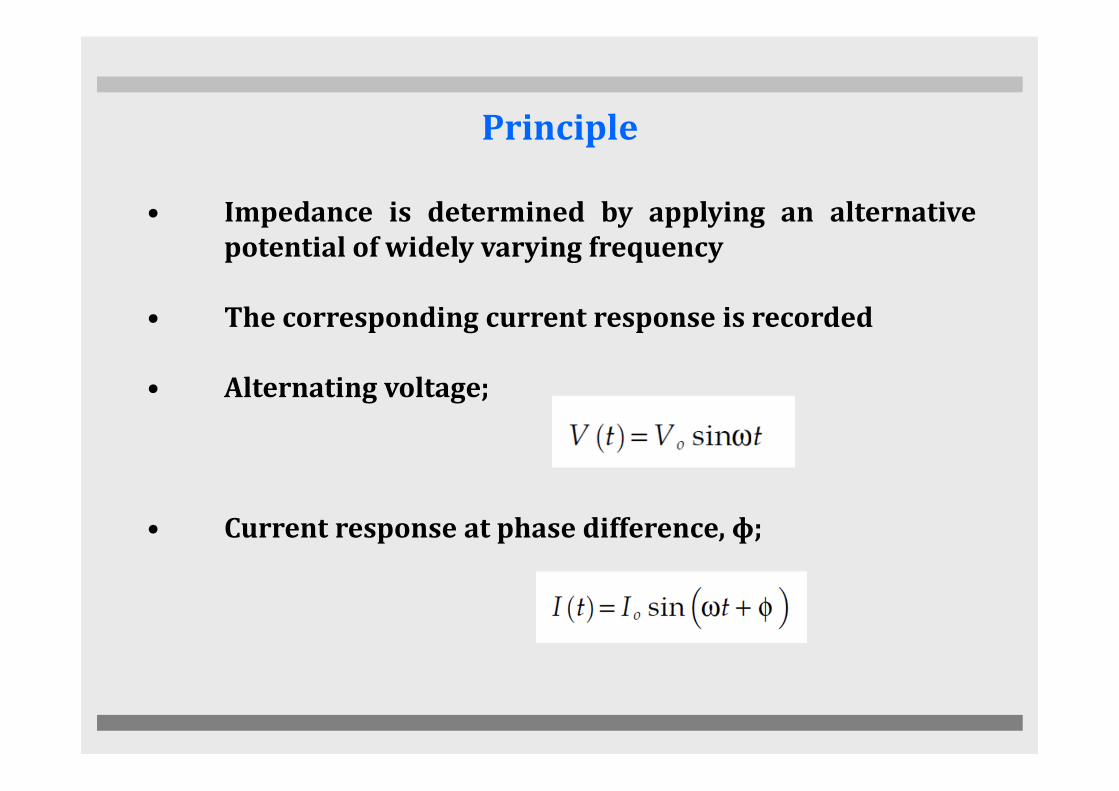
Principle
• Impedance is determined by applying an alternative
potential of widely varying frequency
• The corresponding current response is recorded
• Alternating voltage;
• Current response at phase difference, ɸ;
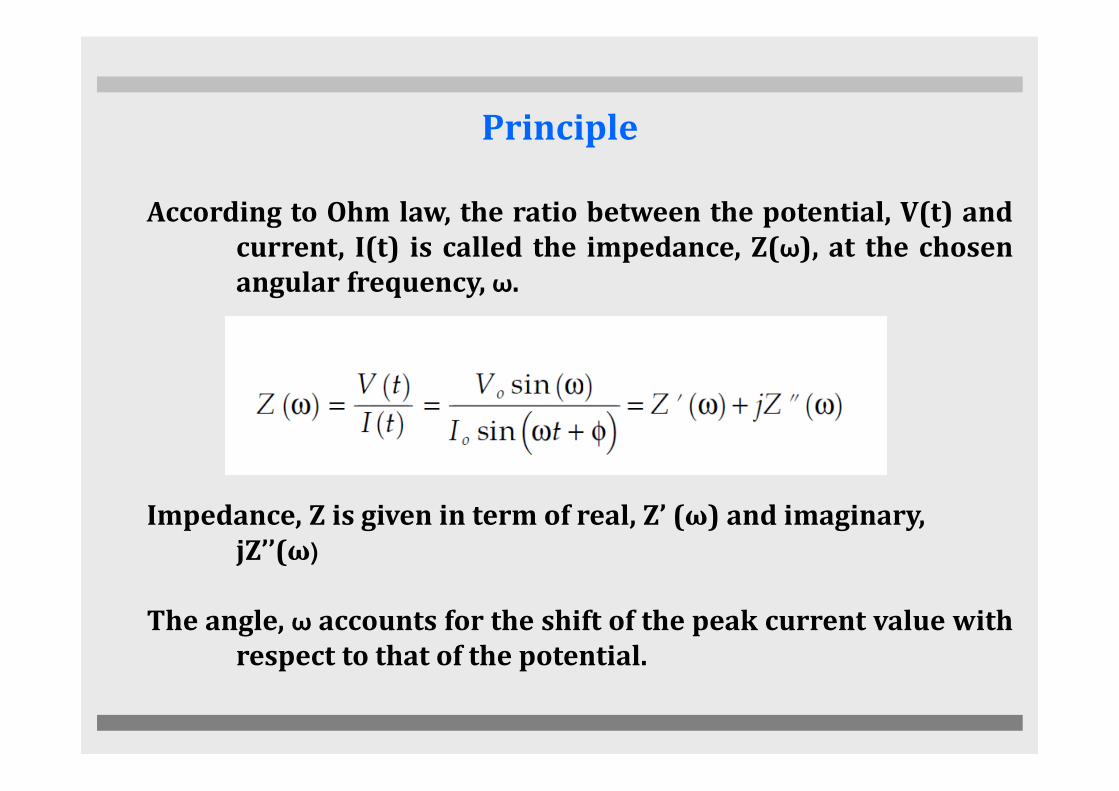
Principle
According to Ohm law, the ratio between the potential, V(t) and
current, I(t) is called the impedance, Z(ω), at the chosen
angular frequency, ω.
Impedance, Z is given in term of real, Z’ (ω) and imaginary,
jZ’’(ω)
The angle, ω accounts for the shift of the peak current value with
respect to that of the potential.
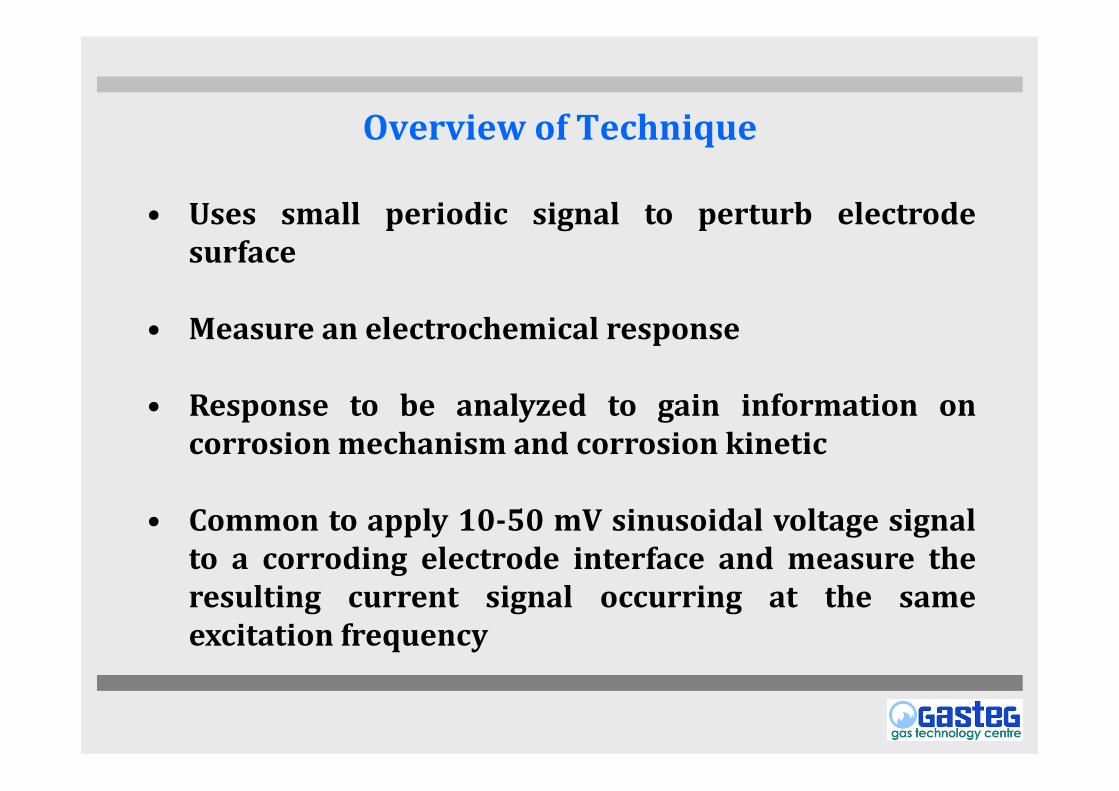
Overview of Technique
• Uses small periodic signal to perturb electrode
surface
• Measure an electrochemical response
• Response to be analyzed to gain information on
corrosion mechanism and corrosion kinetic
• Common to apply 10-50 mV sinusoidal voltage signal
to a corroding electrode interface and measure the
resulting current signal occurring at the same
excitation frequency
Overview of Technique
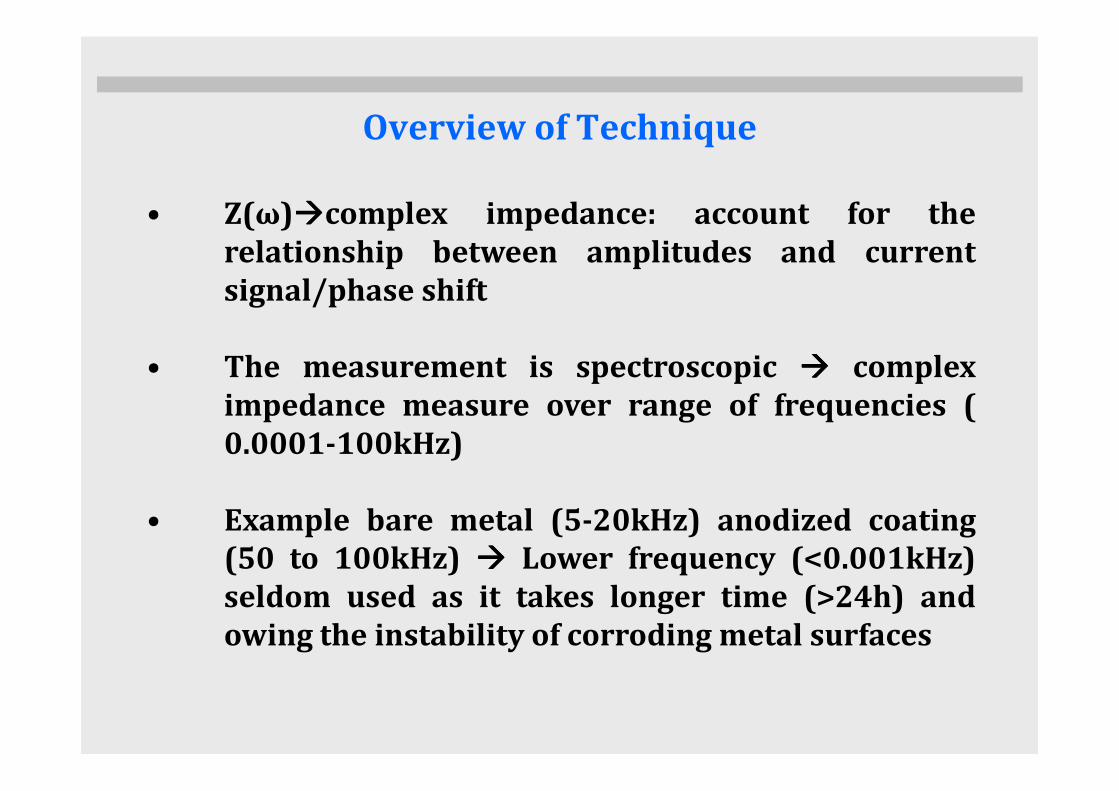
• Z(ω)complex impedance: account for the
relationship between amplitudes and current
signal/phase shift
• The measurement is spectroscopic complex
impedance measure over range of frequencies (
0.0001-100kHz)
• Example bare metal (5-20kHz) anodized coating
(50 to 100kHz) Lower frequency (<0.001kHz)
seldom used as it takes longer time (>24h) and
owing the instability of corroding metal surfaces
Overview of Technique
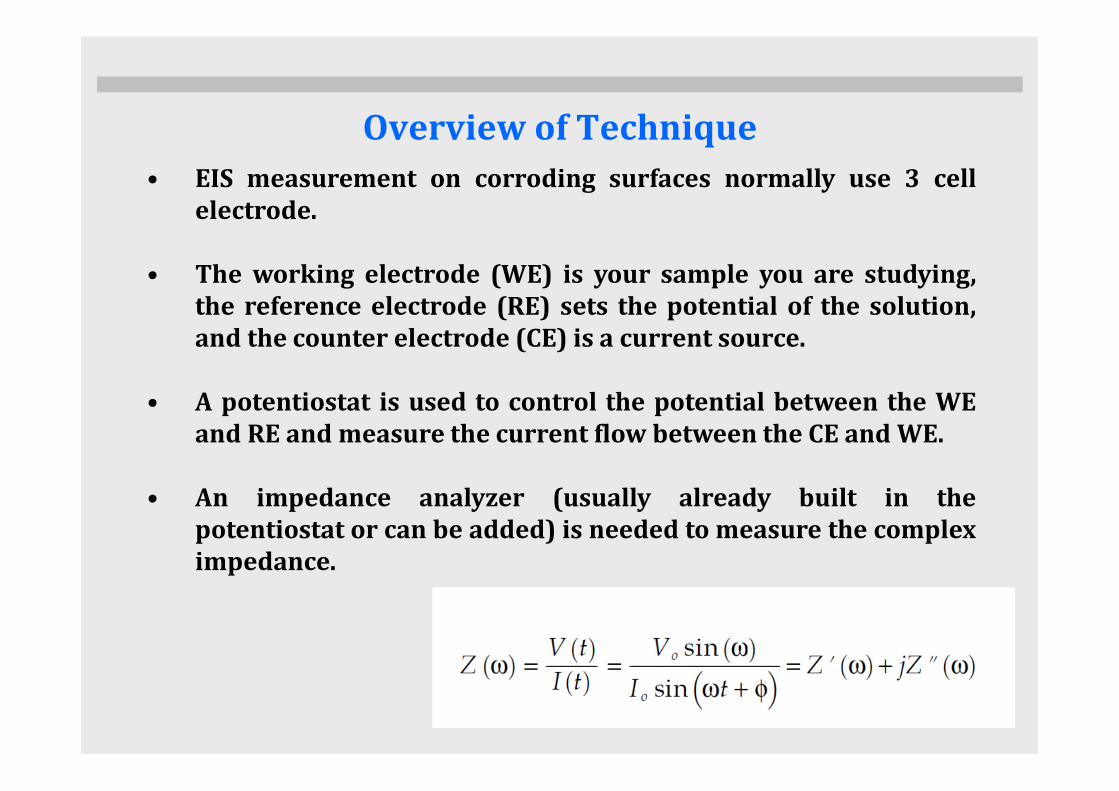
• EIS measurement on corroding surfaces normally use 3 cell
electrode.
• The working electrode (WE) is your sample you are studying,
the reference electrode (RE) sets the potential of the solution,
and the counter electrode (CE) is a current source. • A potentiostat is used to control the potential between the WE
and RE and measure the current flow between the CE and WE.
• An impedance analyzer (usually already built in the
potentiostat or can be added) is needed to measure the complex
impedance.
Overview of Technique
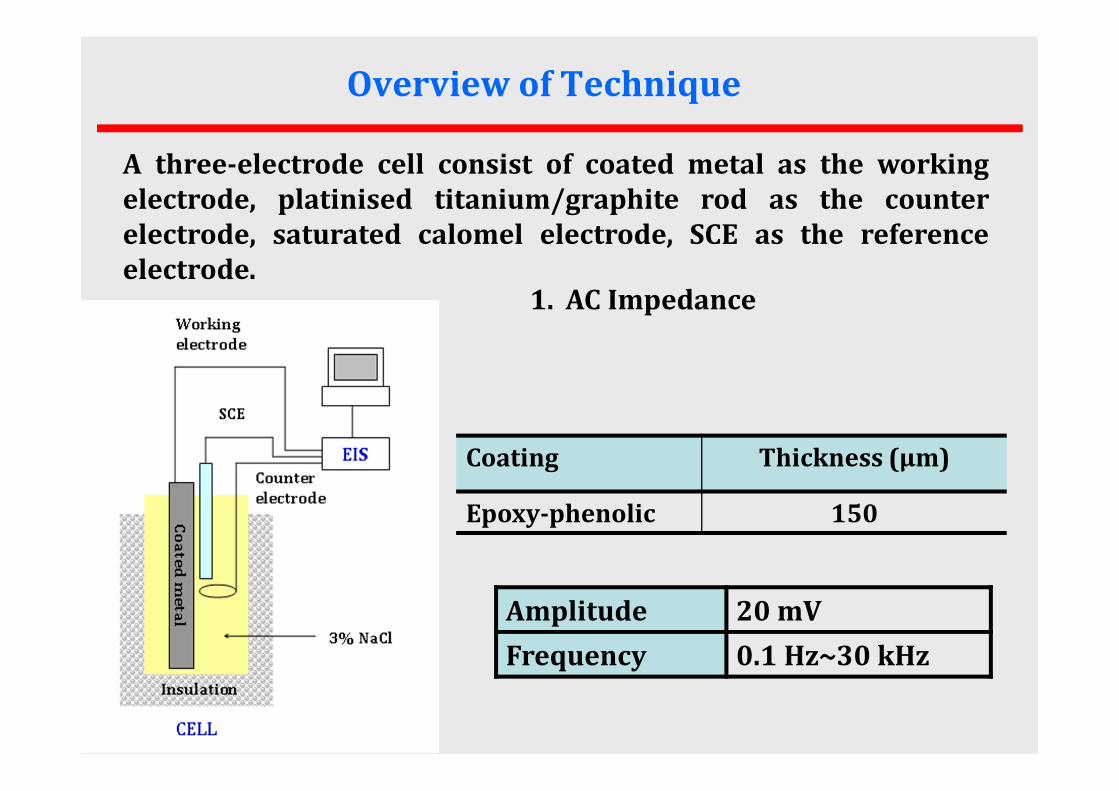
Amplitude 20 mV
Frequency 0.1 Hz~30 kHz
A three-electrode cell consist of coated metal as the working
electrode, platinised titanium/graphite rod as the counter
electrode, saturated calomel electrode, SCE as the reference
electrode.
Coating Thickness (μm)
Epoxy-phenolic 150
1. AC Impedance
Overview of Technique
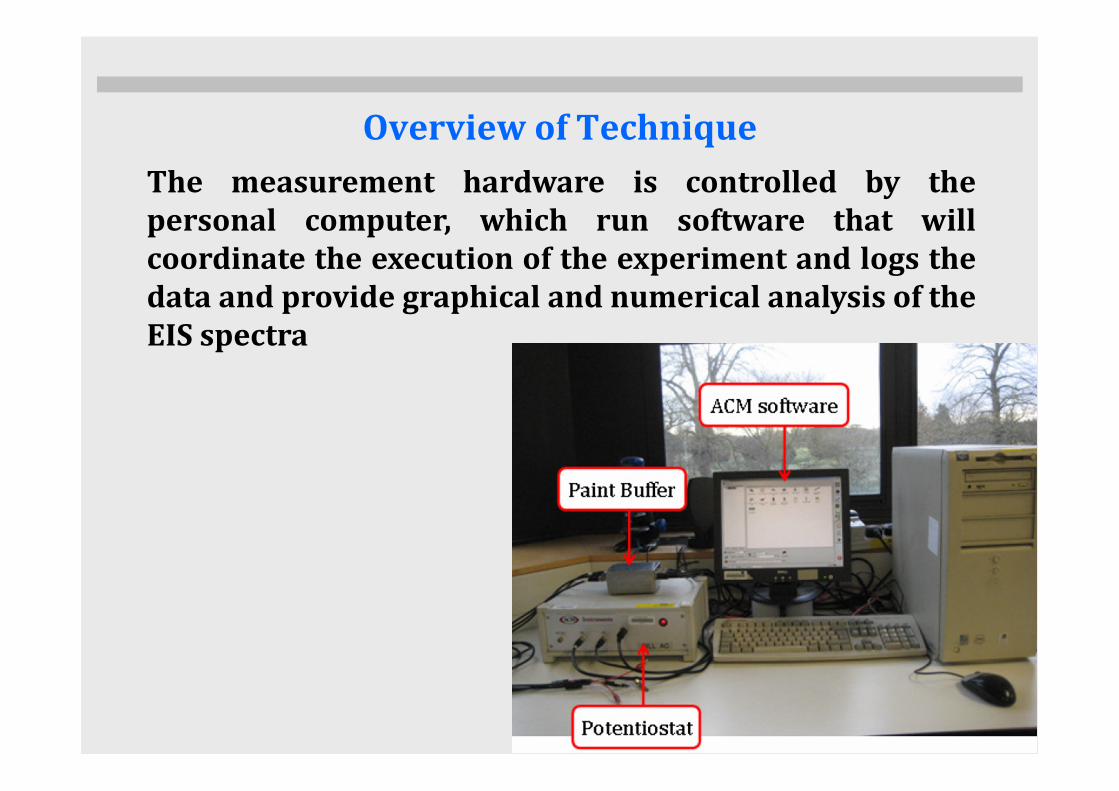
The measurement hardware is controlled by the
personal computer, which run software that will
coordinate the execution of the experiment and logs the
data and provide graphical and numerical analysis of the
EIS spectra
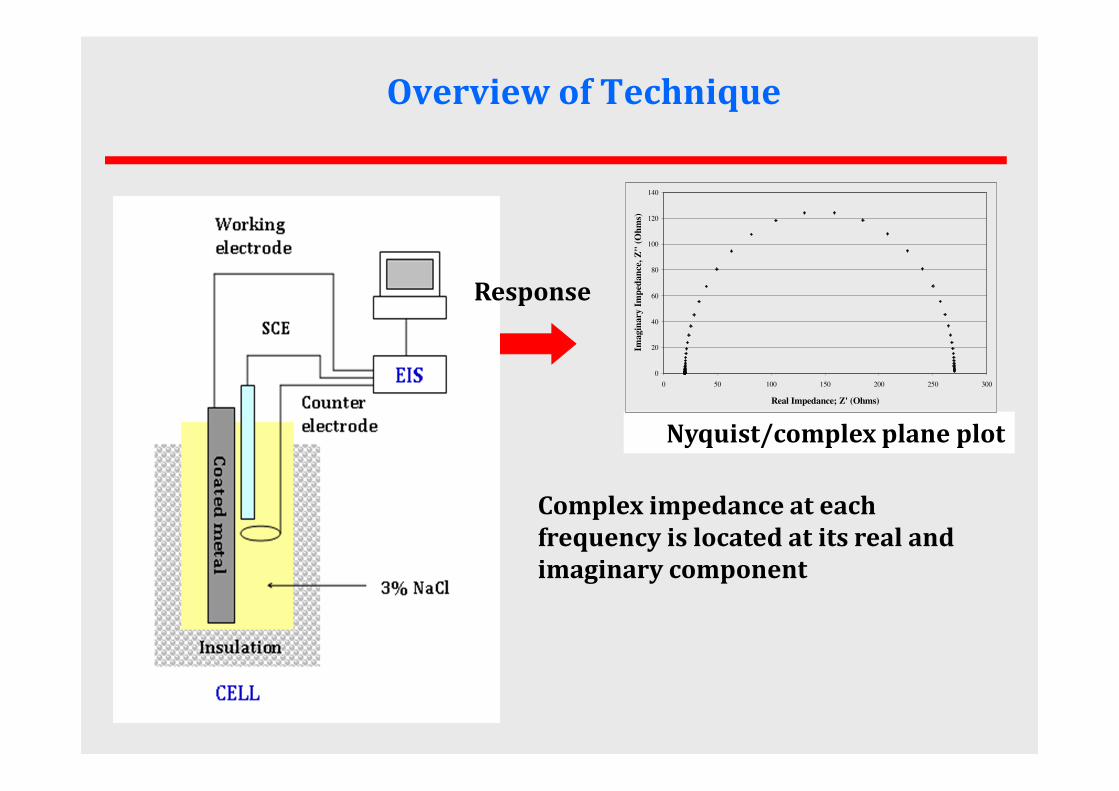
Overview of Technique
Complex impedance at each
frequency is located at its real and
imaginary component
Nyquist/complex plane plot
0
20
40
60
80
100
120
140
0 50 100 150 200 250 300
Real Impedance; Z' (Ohms)
Imagin
ary
Im
ped
an
ce,
Z"
(O
hm
s)
Response
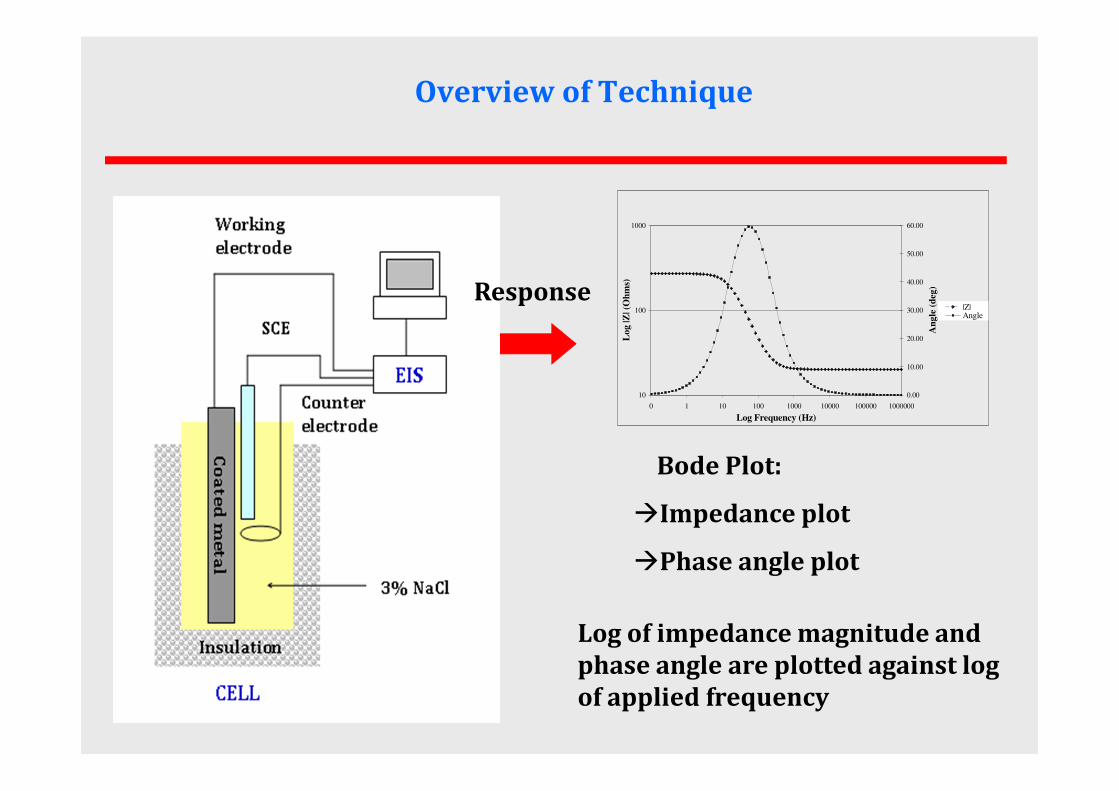
Overview of Technique
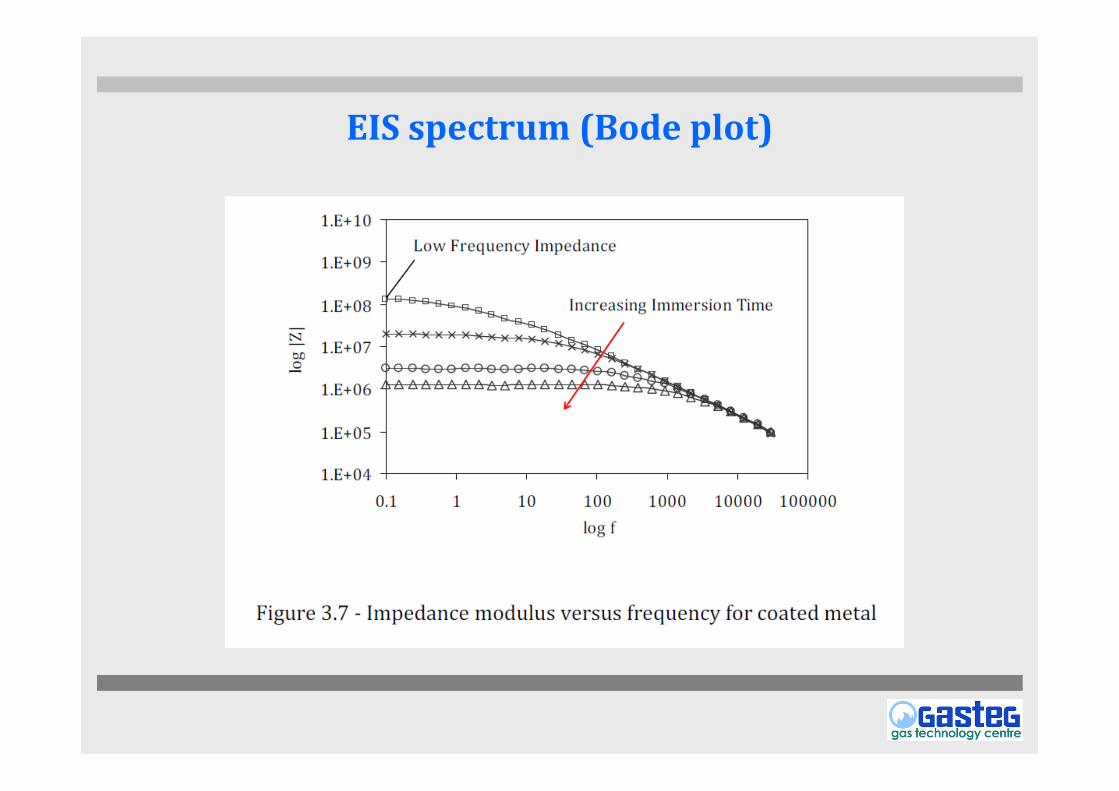
Bode Plot:
Impedance plot
Phase angle plot
10
100
1000
0 1 10 100 1000 10000 100000 1000000
Log Frequency (Hz)
Lo
g |Z
| (O
hm
s)
0.00
10.00
20.00
30.00
40.00
50.00
60.00
An
gle
(d
eg
)
|Z|Angle
Response
Log of impedance magnitude and
phase angle are plotted against log
of applied frequency
Overview of Technique
Advantages.
1. It uses very small excitation amplitudes cause only
minimal pertubation to the electrochemical testing system
2. It is possible to take measurements as a function of
frequency and the analysis of the response can provide
important information regarding the corrosion process
occurring
Disadvantages.
1. Expensive.
2. Massive complex data analysis for quantification.
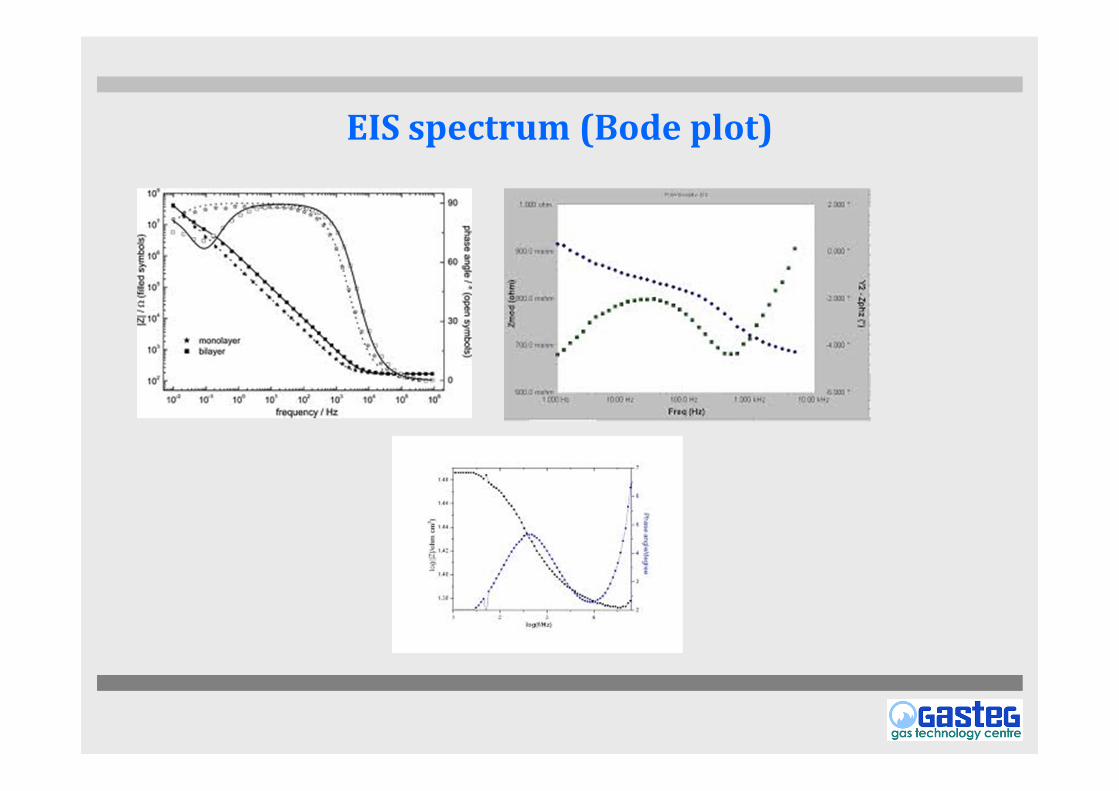
EIS spectrum (Bode plot)
EIS spectrum (Bode plot)
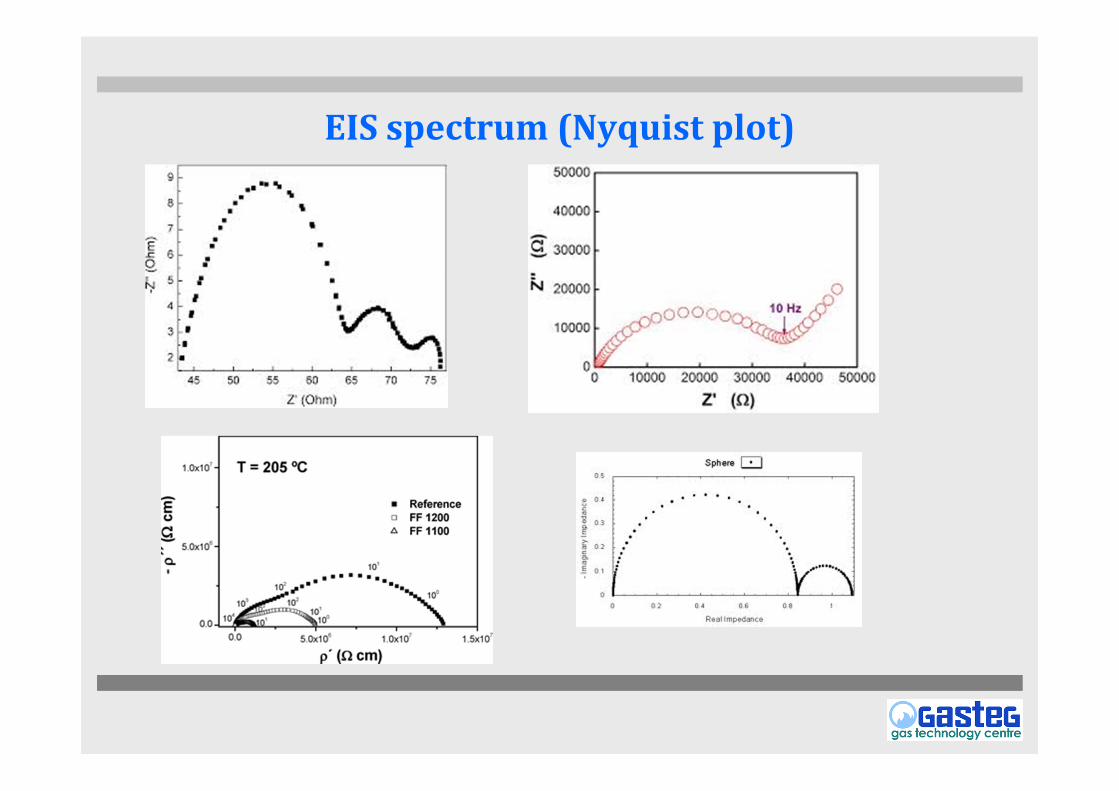
EIS spectrum (Nyquist plot)
Electrical Circuit Elements
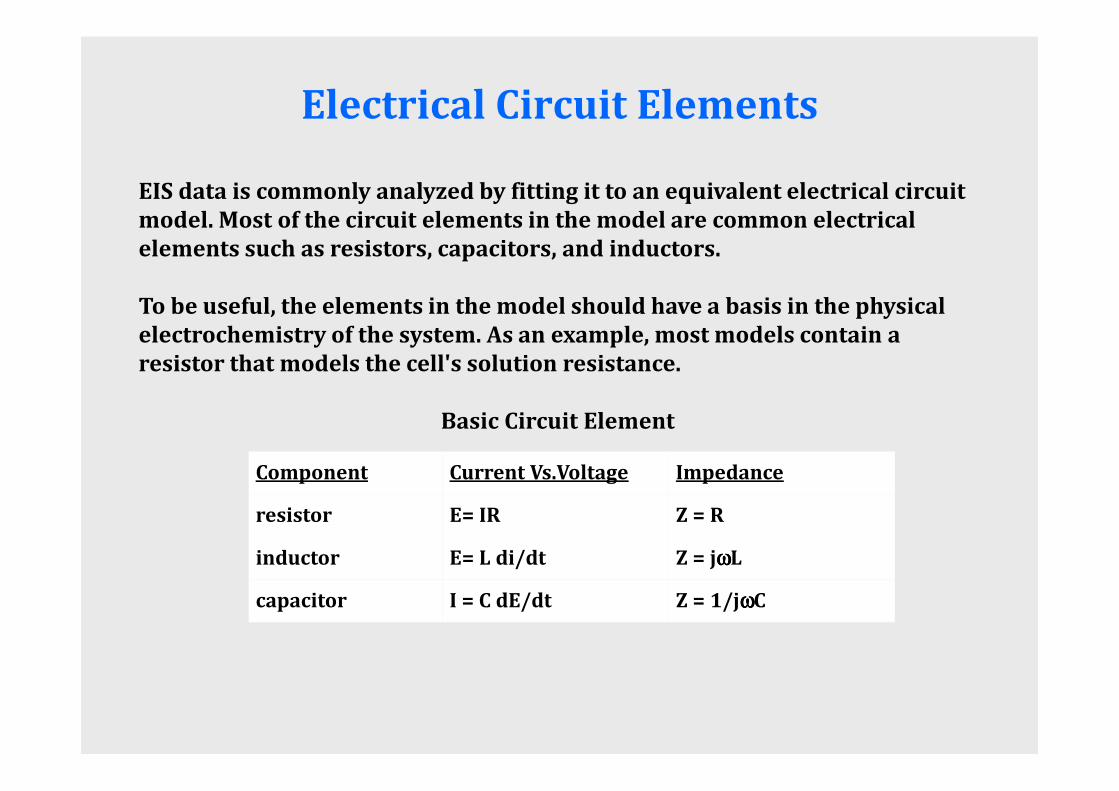
EIS data is commonly analyzed by fitting it to an equivalent electrical circuit
model. Most of the circuit elements in the model are common electrical
elements such as resistors, capacitors, and inductors.
To be useful, the elements in the model should have a basis in the physical
electrochemistry of the system. As an example, most models contain a
resistor that models the cell's solution resistance.
Basic Circuit Element
Component Current Vs.Voltage Impedance
resistor E= IR Z = R
inductor E= L di/dt Z = jωωωωL
capacitor I = C dE/dt Z = 1/jωωωωC
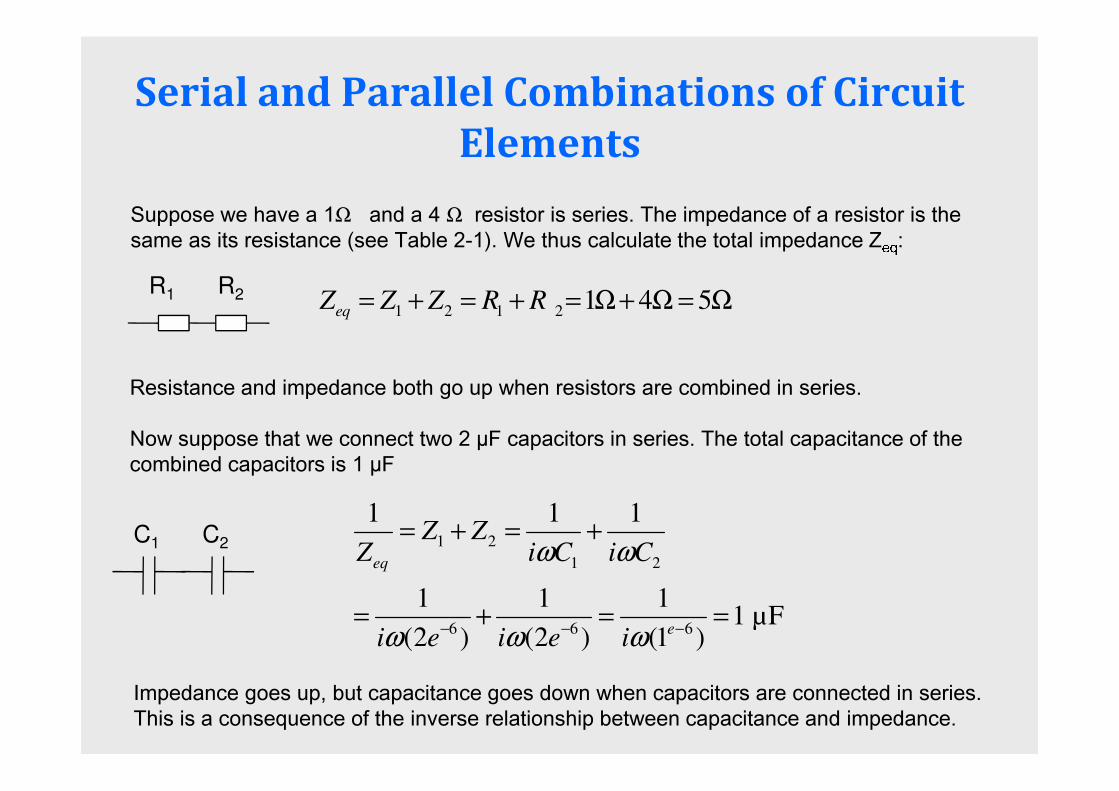
Serial and Parallel Combinations of Circuit
Elements
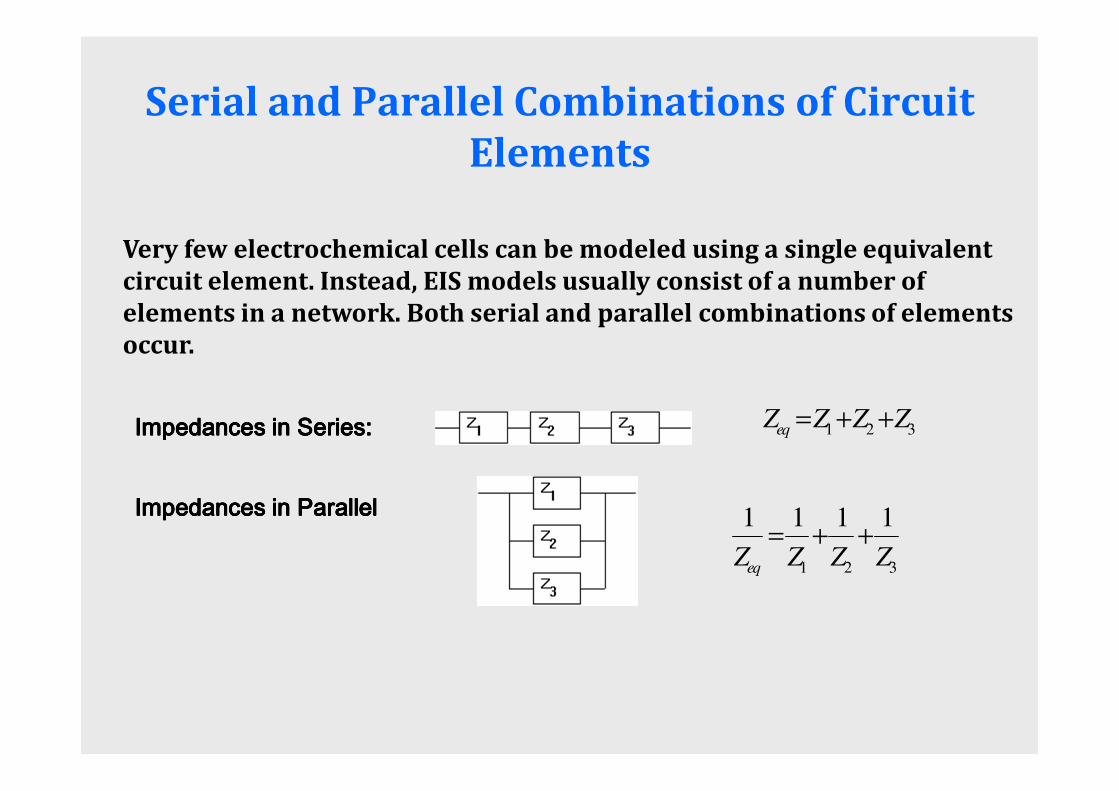
Very few electrochemical cells can be modeled using a single equivalent
circuit element. Instead, EIS models usually consist of a number of
elements in a network. Both serial and parallel combinations of elements
occur.
Impedances in Series:Impedances in Series:Impedances in Series:Impedances in Series: 1 2 3eqZ Z Z Z= + +
Impedances in ParallelImpedances in ParallelImpedances in ParallelImpedances in Parallel
1 2 3
1 1 1 1
eqZ Z Z Z
= + +
Serial and Parallel Combinations of Circuit
Elements
1 2 1 2 1 4 5eq
Z Z Z R R= + = + = Ω+ Ω = Ω
1 2
1 2
6 6 6
1 1 1
1 1 11 µF
(2 ) (2 ) (1 )
eq
e
Z ZZ i C i C
i e i e i
ω ω
ω ω ω− − −
= + = +
= + = =
Resistance and impedance both go up when resistors are combined in series.
Now suppose that we connect two 2 µF capacitors in series. The total capacitance of the
combined capacitors is 1 µF
Suppose we have a 1Ω and a 4 Ω resistor is series. The impedance of a resistor is the
same as its resistance (see Table 2-1). We thus calculate the total impedance Zeq
:
Impedance goes up, but capacitance goes down when capacitors are connected in series.
This is a consequence of the inverse relationship between capacitance and impedance.
C1 C2
R1 R2
Equivalent
Circuit
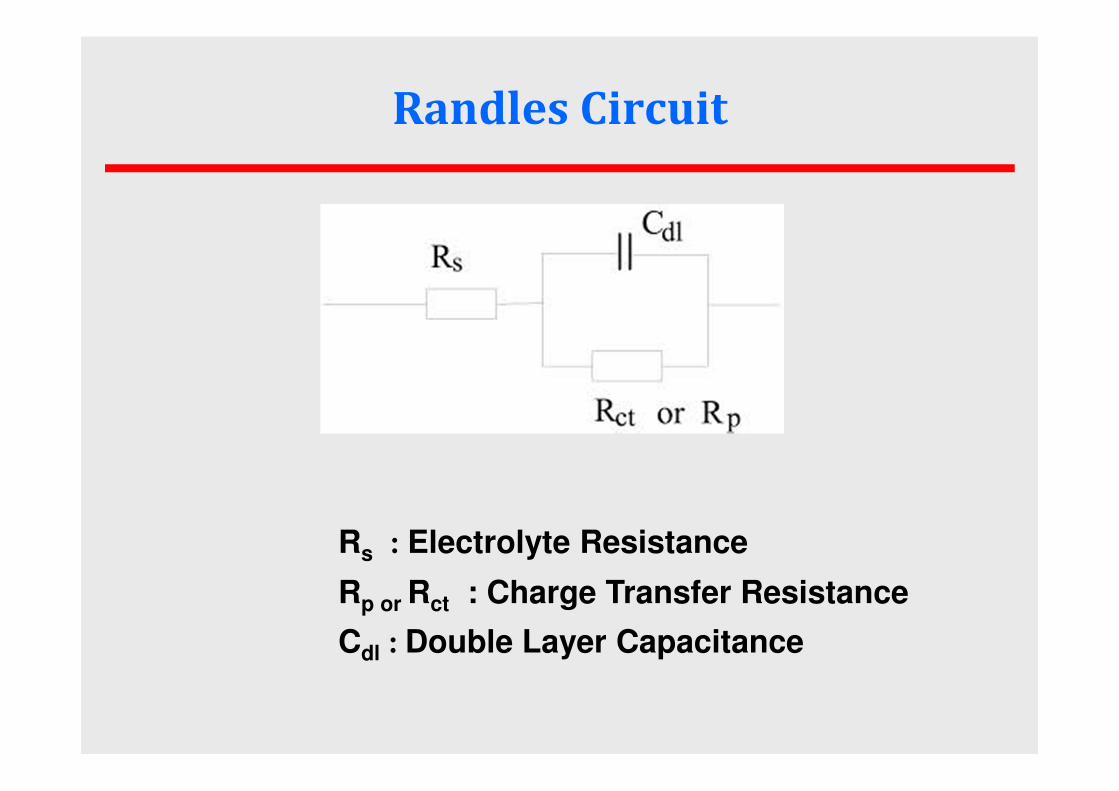
Randles Circuit
Rs : Electrolyte Resistance
Rp or Rct : Charge Transfer Resistance
Cdl : Double Layer Capacitance
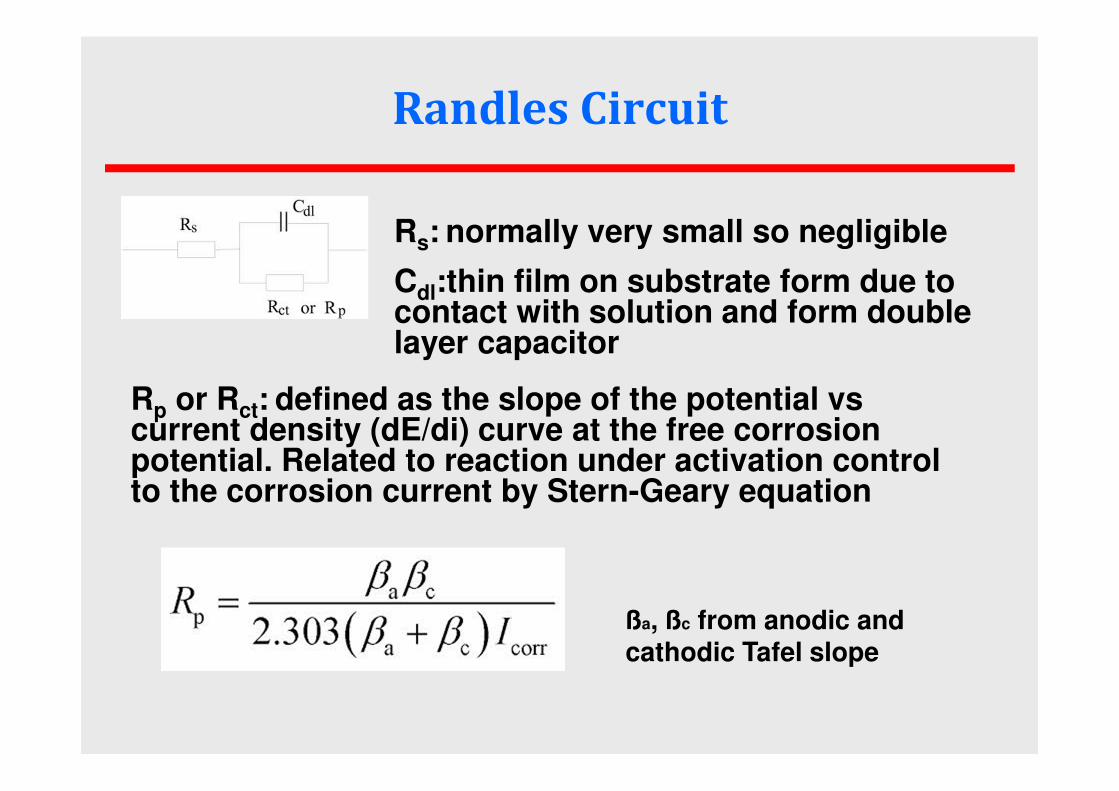
Randles Circuit
Rs: normally very small so negligible
Cdl:thin film on substrate form due to contact with solution and form double layer capacitor
Rp or Rct: defined as the slope of the potential vs current density (dE/di) curve at the free corrosion potential. Related to reaction under activation control to the corrosion current by Stern-Geary equation
ßa, ßc from anodic and cathodic Tafel slope
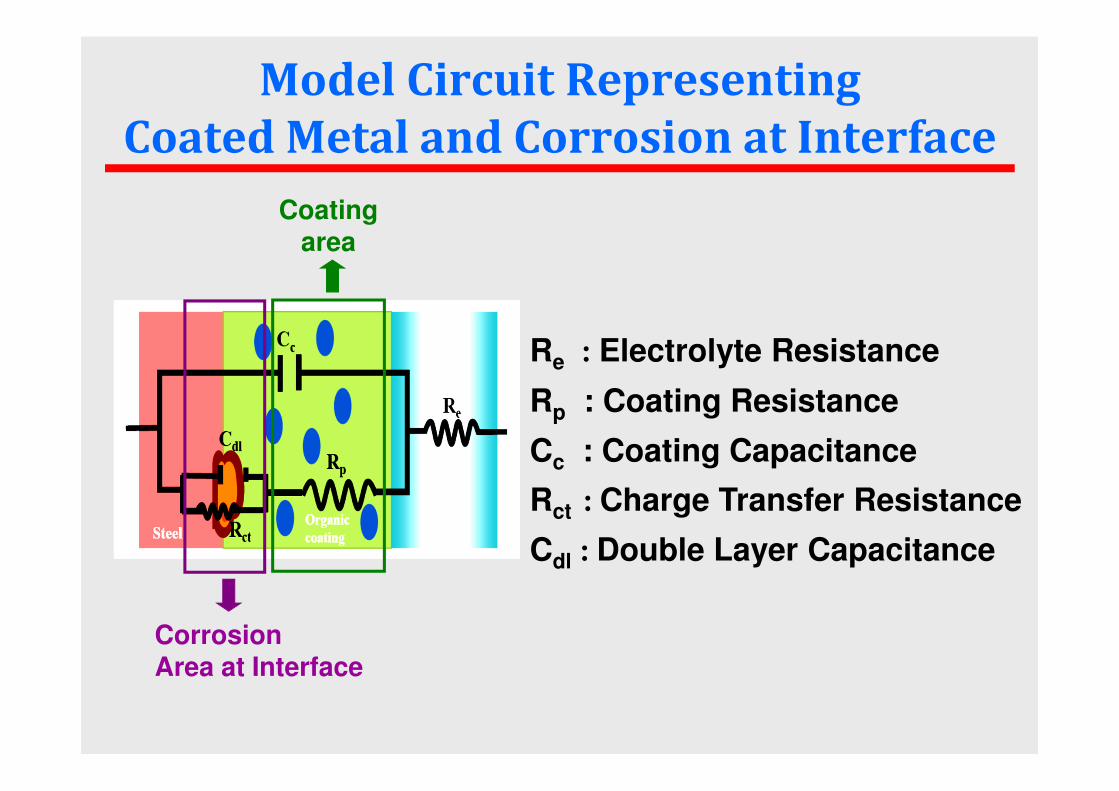
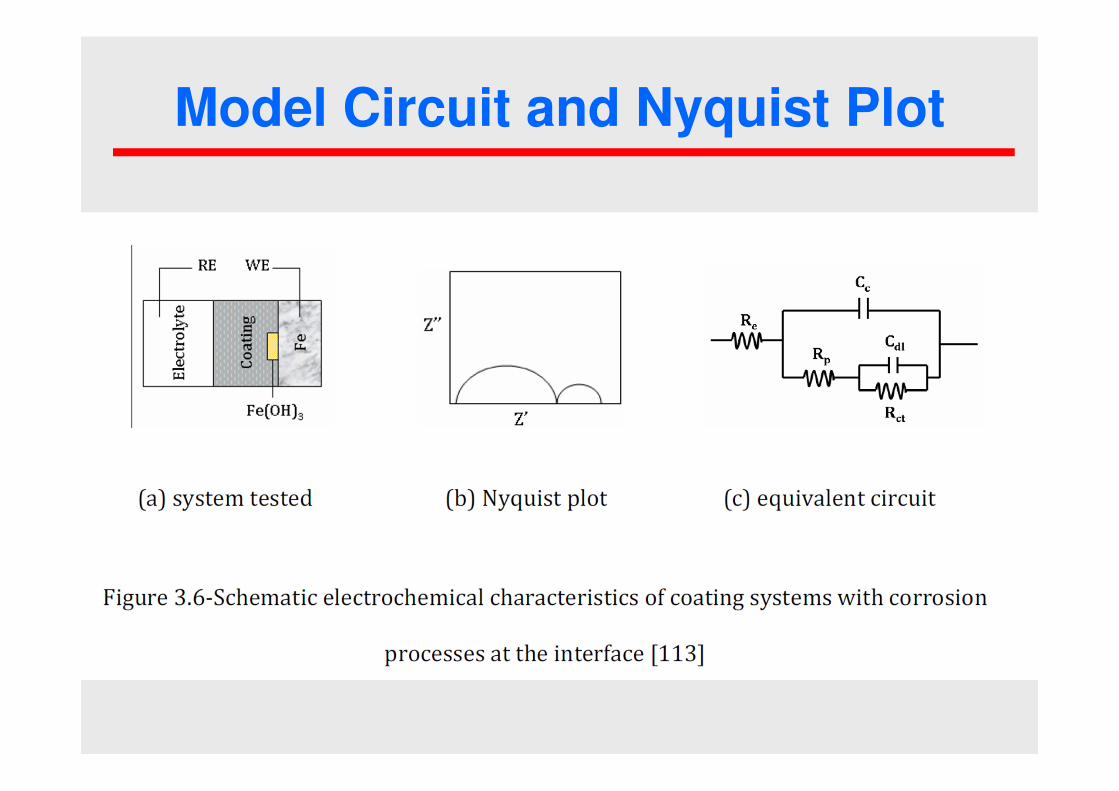
Model Circuit Representing
Coated Metal and Corrosion at Interface
Re : Electrolyte Resistance
Rp : Coating Resistance
Cc : Coating Capacitance
Rct : Charge Transfer Resistance
Cdl : Double Layer Capacitance
Coating area
Corrosion Area at Interface
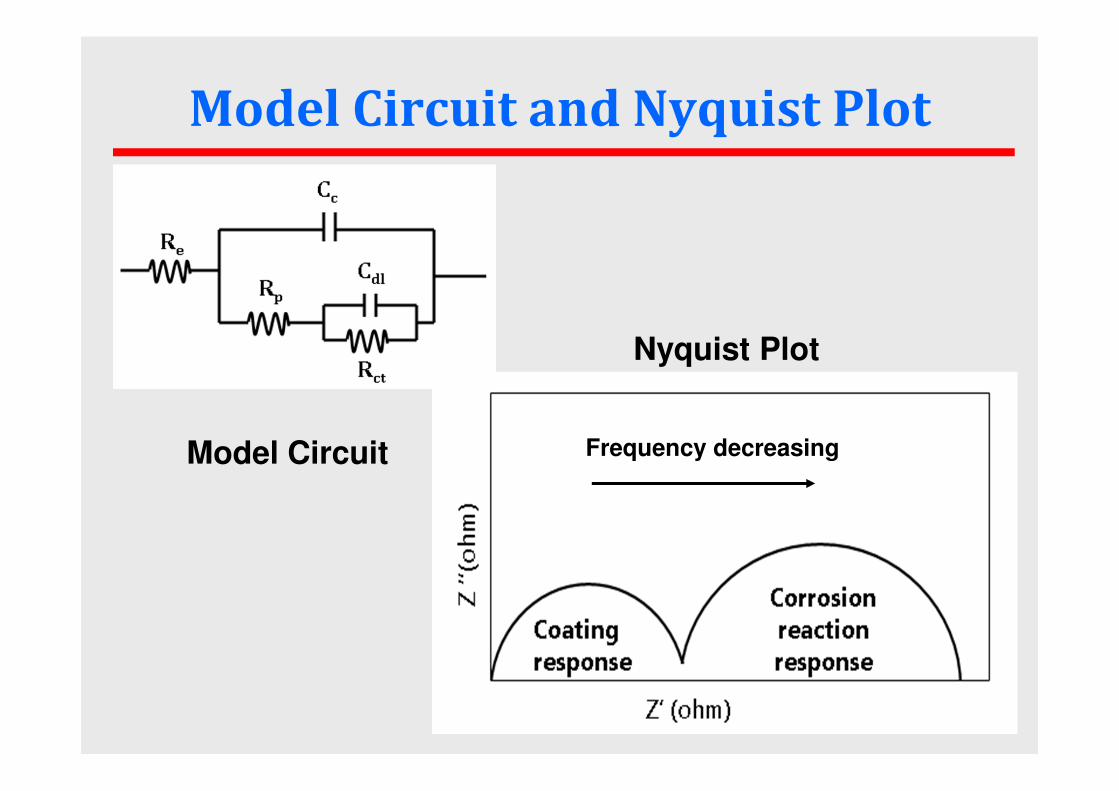
Model Circuit and Nyquist Plot
Nyquist Plot
Model Circuit Decreasing frequency Frequency decreasing

Model Circuit and Nyquist Plot
Model Circuit and Nyquist Plot
Model Circuit and Nyquist Plot
Model Circuit and Nyquist Plot
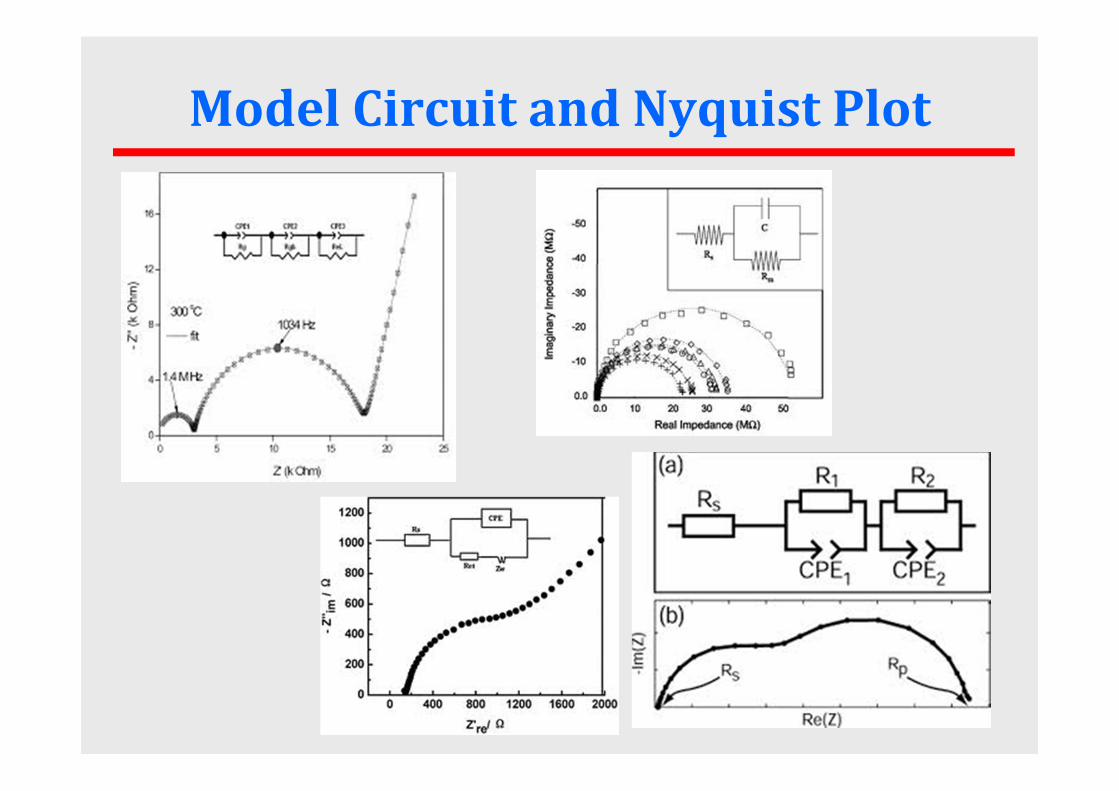
Model Circuit and Nyquist Plot
Z , Msd.
Z , Calc.
GA1-3d-25.dat
Model : R(Q(R(QR))) Wgt : Modulus
Z ' (ohm)4.00E+063.00E+062.00E+061.00E+060.00E+00
- Z
'' (
oh
m)
2.40E+06
2.20E+06
2.00E+06
1.80E+06
1.60E+06
1.40E+06
1.20E+06
1.00E+06
8.00E+05
6.00E+05
4.00E+05
2.00E+05
0.00E+00
Iter #: 1
Chsq: 5.99E-04
# of pars with
rel. std. errors
>10%: 5 / 7
>100%: 2 / 7
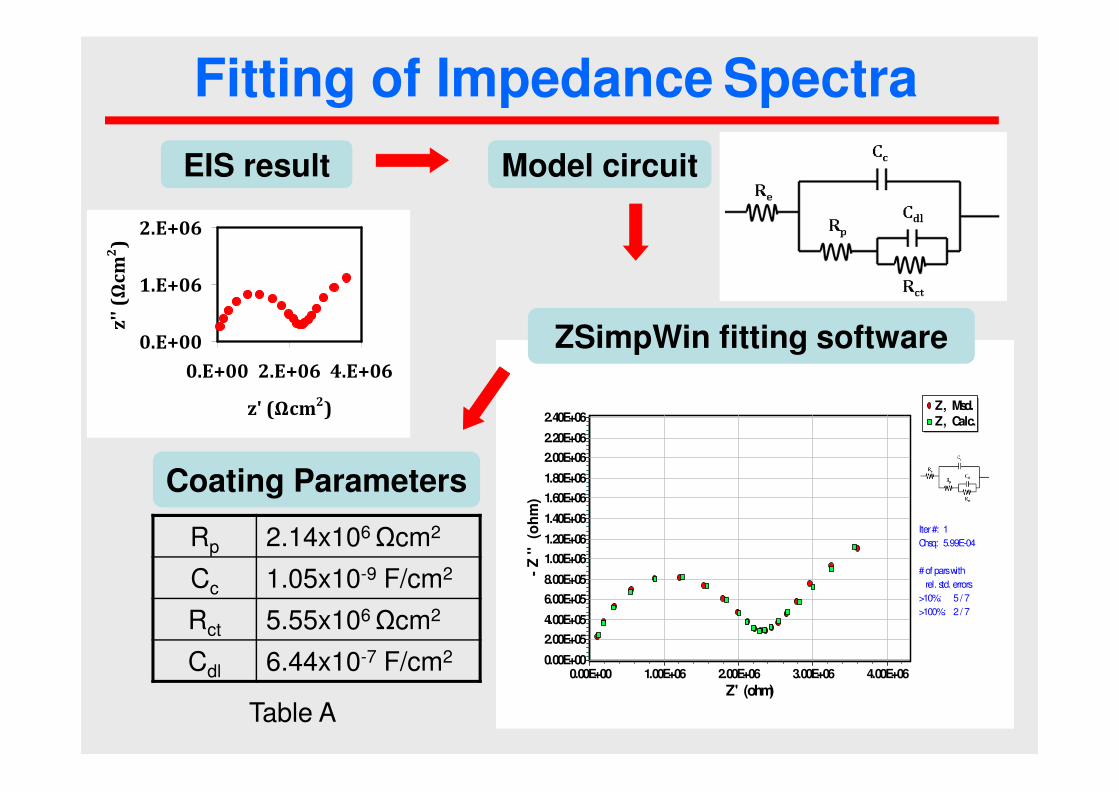
Fitting of Impedance Spectra
EIS result
Coating Parameters
ZSimpWin fitting software
Rp 2.14x10⁶ Ωcm2
Cc 1.05x10⁻⁹ F/cm2
Rct 5.55x10⁶ Ωcm2
Cdl 6.44x10⁻⁷ F/cm2
Model circuit
Table A
0.E+00
1.E+06
2.E+06
0.E+00 2.E+06 4.E+06
z' (Ωcm2)
z''
(Ω
cm
2)
EIS can be used to characterise an
intact coating on steel substrate
It can measure
1. The deterioration of the organic coating caused by
exposure to an electrolyte, shown by a decrease in
resistance, Rp
2. The increase in corrosion rate of the metallic substrate
due to the degradation of the coating and subsequent
attack by the electrolyte shown by falling of the charge
transfer resistance, Rct
Case study
Effect of Temperature on the Impedance
Behaviour of Coated Metals in 3% Sodium
Chloride Solution
The aim of the study was to assess the effect of
temperature on the protective properties of several
epoxy coatings.
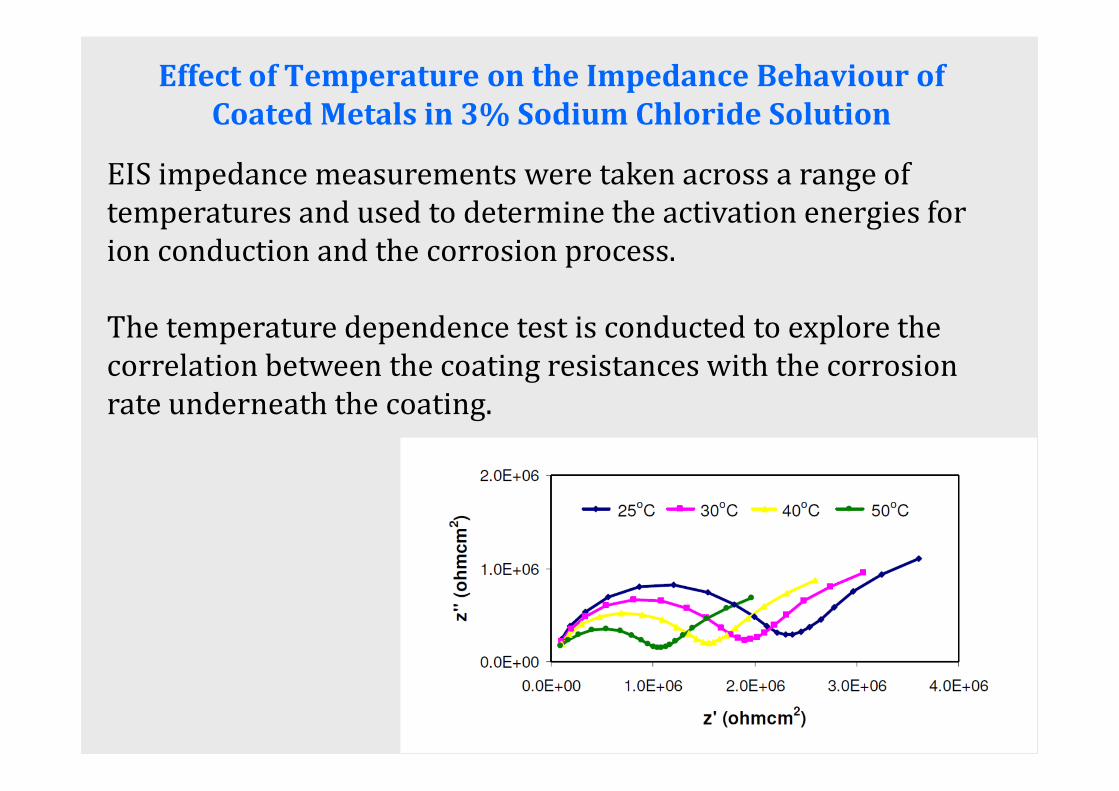
Effect of Temperature on the Impedance Behaviour of
Coated Metals in 3% Sodium Chloride Solution
EIS impedance measurements were taken across a range of
temperatures and used to determine the activation energies for
ion conduction and the corrosion process.
The temperature dependence test is conducted to explore the
correlation between the coating resistances with the corrosion
rate underneath the coating.

Z , Msd.
Z , Calc.
GA1-3d-25.dat
Model : R(Q(R(QR))) Wgt : Modulus
Z ' (ohm)4.00E+063.00E+062.00E+061.00E+060.00E+00
- Z
'' (
oh
m)
2.40E+06
2.20E+06
2.00E+06
1.80E+06
1.60E+06
1.40E+06
1.20E+06
1.00E+06
8.00E+05
6.00E+05
4.00E+05
2.00E+05
0.00E+00
Iter #: 1
Chsq: 5.99E-04
# of pars with
rel. std. errors
>10%: 5 / 7
>100%: 2 / 7
Fitting of Impedance Spectra
EIS result
Coating Parameters
ZSimpWin fitting software
Rp 2.14x10⁶ Ωcm2
Cc 1.05x10⁻⁹ F/cm2
Rct 5.55x10⁶ Ωcm2
Cdl 6.44x10⁻⁷ F/cm2
Model circuit
Table A
0.E+00
1.E+06
2.E+06
0.E+00 2.E+06 4.E+06
z' (Ωcm2)
z''
(Ω
cm
2)
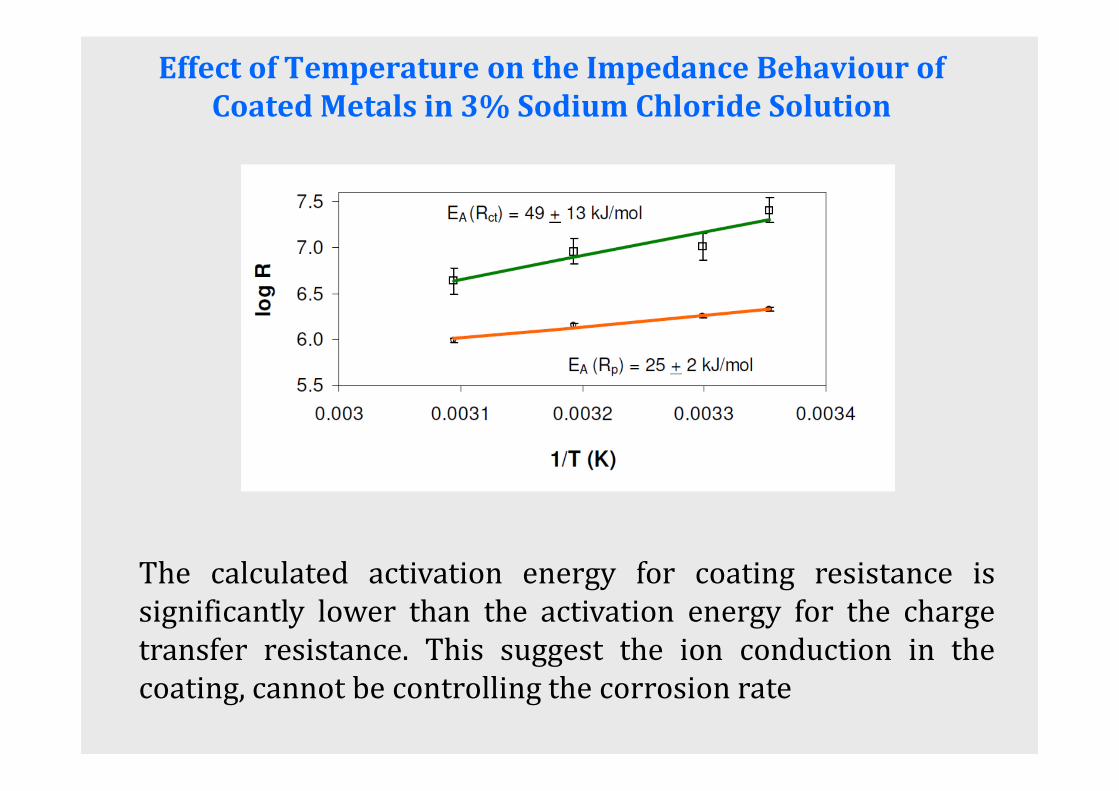
Effect of Temperature on the Impedance Behaviour of
Coated Metals in 3% Sodium Chloride Solution
The calculated activation energy for coating resistance is
significantly lower than the activation energy for the charge
transfer resistance. This suggest the ion conduction in the
coating, cannot be controlling the corrosion rate

Question?

The End
Thank You for the
Attention!