Embed Size (px)
Citation preview

Slide 1 t:/powerpnt/course/lect4.pptPurdue University Cytometry Laboratories
Lecture 3Fluorescence and Fluorescence Probes
BMS 524 - “Introduction to Confocal Microscopy and Image Analysis”
1 Credit course offered by Purdue University Department of Basic Medical Sciences, School of Veterinary Medicine
UPDATED October 27, 1998
J.Paul Robinson, Ph.D. Professor of Immunopharmacology
Director, Purdue University Cytometry Laboratories
These slides are intended for use in a lecture series. Copies of the graphics are distributed and students encouraged to take their notes on these graphics. The intent is to have the student NOT try to reproduce the
figures, but to LISTEN and UNDERSTAND the material. All material copyright J.Paul Robinson unless otherwise stated, however, the material may be freely used for lectures, tutorials and workshops. It may not
be used for any commercial purpose.
The text for this course is Pawley “Introduction to Confocal Microscopy”, Plenum Press, 2nd Ed. A number of the ideas and figures in these lecture notes are taken from this text.
Slide 2 t:/powerpnt/course/lect4.pptPurdue University Cytometry Laboratories
Overview
• Fluorescence
• Types of fluorescent probes
• Problems with fluorochromes
• General applications

Slide 3 t:/powerpnt/course/lect4.pptPurdue University Cytometry Laboratories
Excitation Sources
• Excitation SourcesLamps
XenonXenon/Mercury
LasersArgon Ion (Ar)Krypton (Kr)Helium Neon (He-Ne)Helium Cadmium (He-Cd)Krypton-Argon (Kr-Ar)

Slide 4 t:/powerpnt/course/lect4.pptPurdue University Cytometry Laboratories
Light Sources - Lasers
• Argon Ar 353-461, 488, 514 nm
• Krypton-Ar Kr-Ar 488, 568, 647 nm
• Helium-Neon He-Ne 633 nm
• He-Cadmium He-Cd 325 - 441 nm(He-Cd light difficult to get 325 nm band through some optical systems)
Laser Abbrev. Excitation Lines
Slide 5 t:/powerpnt/course/lect4.pptPurdue University Cytometry Laboratories
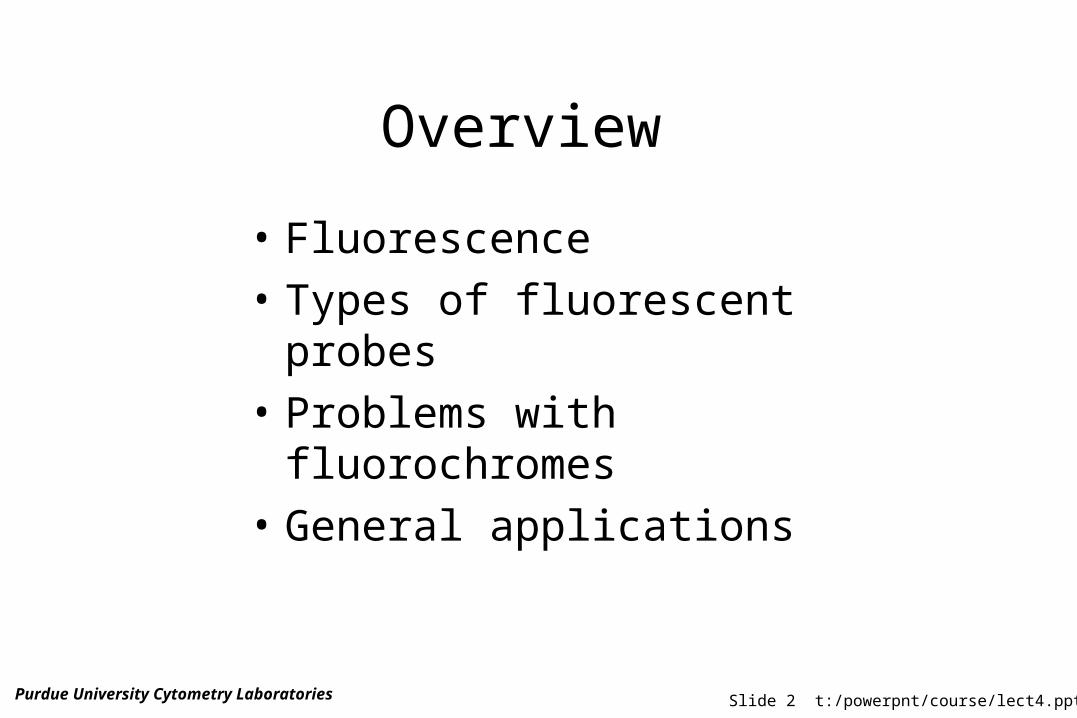
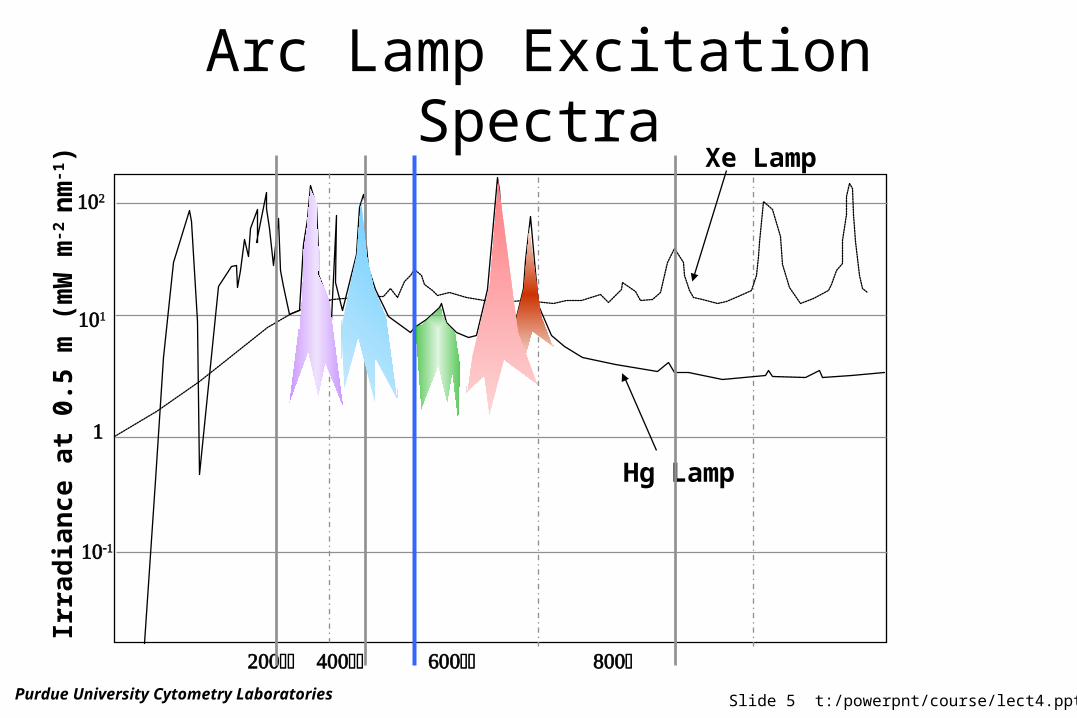
Arc Lamp Excitation SpectraIr
rad
ian
ce a
t 0.
5 m
(m
W m
-2 n
m-1)
Xe Lamp
Hg Lamp

Slide 6 t:/powerpnt/course/lect4.pptPurdue University Cytometry Laboratories
Fluorescence
• What is it?
• Where does it come from?
• Advantages
• Disadvantages

Slide 7 t:/powerpnt/course/lect4.pptPurdue University Cytometry Laboratories
FluorescenceE
NE
RG
Y
S0
S1
S2
T2
T1ABS FL I.C.
ABS - Absorbance S 0.1.2 - Singlet Electronic Energy LevelsFL - Fluorescence T 1,2 - Corresponding Triplet StatesI.C.- Nonradiative Internal Conversion IsC - Intersystem Crossing PH - Phosphorescence
IsC
IsC
PH
[Vibrational sublevels]
Jablonski Diagram
Vibrational energy levelsRotational energy levelsElectronic energy levels
Singlet States Triplet States

Slide 8 t:/powerpnt/course/lect4.pptPurdue University Cytometry Laboratories
Parameters
• Extinction Coefficient– refers to a single wavelength (usually the absorption maximum)
• Quantum Yield– Qf is a measure of the integrated photon emission over the
fluorophore spectral band
• At sub-saturation excitation rates, fluorescence intensity is proportional to the product of and Qf

Slide 9 t:/powerpnt/course/lect4.pptPurdue University Cytometry Laboratories
Excitation Saturation• The rate of emission is dependent upon the time the molecule remains
within the excitation state (the excited state lifetime f)
• Optical saturation occurs when the rate of excitation exceeds the reciprocal of f
• In a scanned image of 512 x 768 pixels (400,000 pixels) if scanned in 1 second requires a dwell time per pixel of 2 x 10⁻⁶ sec.
• Molecules that remain in the excitation beam for extended periods have higher probability of interstate crossings and thus phosphorescence
• Usually, increasing dye concentration can be the most effective means of increasing signal when energy is not the limiting factor (ie laser based confocal systems)

Slide 10 t:/powerpnt/course/lect4.pptPurdue University Cytometry Laboratories
How many Photons?
• Consider 1 mW of power at 488 nm focused to a Gaussian spot whose radius at 1/e2 intensity is 0.25m via a 1.25 NA objective
• The peak intensity at the center will be 10-3W [.(0.25 x 10⁻⁴ cm)2]= 5.1 x 10⁵ W/cm2 or 1.25 x 1024 photons/(cm2 sec-1)
• At this power, FITC would have 63% of its molecules in an excited state and 37% in ground state at any one time

Slide 11 t:/powerpnt/course/lect4.pptPurdue University Cytometry Laboratories
Raman Scatter• A molecule may undergo a vibrational transition (not an
electronic shift) at exactly the same time as scattering occurs
• This results in a photon emission of a photon differing in energy from the energy of the incident photon by the amount of the above energy - this is Raman scattering.
• The dominant effect in flow cytometry is the stretch of the O-H bonds of water. At 488 nm excitation this would give emission at 592 nm

Slide 12 t:/powerpnt/course/lect4.pptPurdue University Cytometry Laboratories
Rayleigh Scatter• Molecules and very small particles do not absorb,
but scatter light in the visible region
• Rayleigh scattering is directly proportional to the electric dipole and inversely proportional to the 4th power of the wavelength of the incident light
• e.g. the sky looks blue because the gas molecules scatter more light at shorter (blue) rather than longer wavelengths

Slide 13 t:/powerpnt/course/lect4.pptPurdue University Cytometry Laboratories
Photobleaching• Defined as the irreversible destruction of an
excited fluorophore (discussed in later lecture)• Methods for countering photobleaching
– Scan for shorter times
– Use high magnification, high NA objective
– Use wide emission filters
– Reduce excitation intensity
– Use “antifade” reagents (not compatible with viable cells)

Slide 14 t:/powerpnt/course/lect4.pptPurdue University Cytometry Laboratories
Photobleaching example
• FITC - at 4.4 x 10²³ photons cm-2 sec-1 FITC bleaches with a quantum efficiency Qb of 3 x 10⁻⁵
• Therefore FITC would be bleaching with a rate constant of 4.2 x 10³ sec-1 so 37% of the molecules would remain after 240 sec of irradiation.
• In a single plane, 16 scans would cause 6-50% bleaching

Slide 15 t:/powerpnt/course/lect4.pptPurdue University Cytometry Laboratories
Antifade Agents• Many quenchers act by reducing oxygen concentration to
prevent formation of singlet oxygen
• Satisfactory for fixed samples but not live cells!
• Antioxidents such as propyl gallate, hydroquinone, p-phenylenediamine are used
• Reduce O2 concentration or use singlet oxygen quenchers such as carotenoids (50 mM crocetin or etretinate in cell cultures); ascorbate, imidazole, histidine, cysteamine, reduced glutathione, uric acid, trolox (vitamin E analogue)

Slide 16 t:/powerpnt/course/lect4.pptPurdue University Cytometry Laboratories
Excitation - Emission Peaks
Fluorophore EXpeak EM peak
% Max Excitation at488 568 647 nm
FITC 496 518 87 0 0Bodipy 503 511 58 1 1Tetra-M-Rho 554 576 10 61 0L-Rhodamine 572 590 5 92 0Texas Red 592 610 3 45 1CY5 649 666 1 11 98
Note: You will not be able to see CY5 fluorescence under the regular fluorescent microscope because the wavelength is too high.
Slide 17 t:/powerpnt/course/lect4.pptPurdue University Cytometry Laboratories
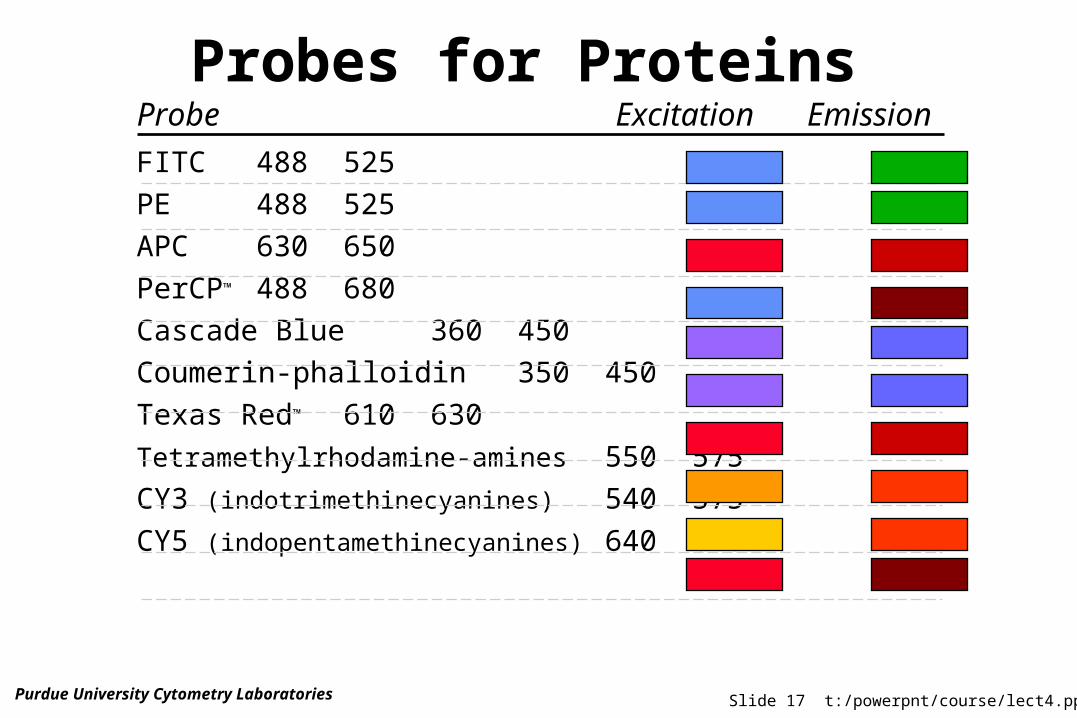
Probes for Proteins
FITC 488 525
PE 488 525
APC 630 650
PerCP™ 488 680
Cascade Blue 360 450
Coumerin-phalloidin 350 450
Texas Red™ 610 630
Tetramethylrhodamine-amines 550 575
CY3 (indotrimethinecyanines) 540 575
CY5 (indopentamethinecyanines) 640 670
Probe Excitation Emission

Slide 18 t:/powerpnt/course/lect4.pptPurdue University Cytometry Laboratories
Probes for Nucleic Acids
• Hoechst 33342 (AT rich) (uv)
• Dapi (uv)
• PI (uv/vis)
• Acridine Orange (vis)
• TOTO-1, YOYO-3, BOBO (vis)
• Pyrine Y (vis)
• Thiazole Orange (vis)
Slide 19 t:/powerpnt/course/lect4.pptPurdue University Cytometry Laboratories
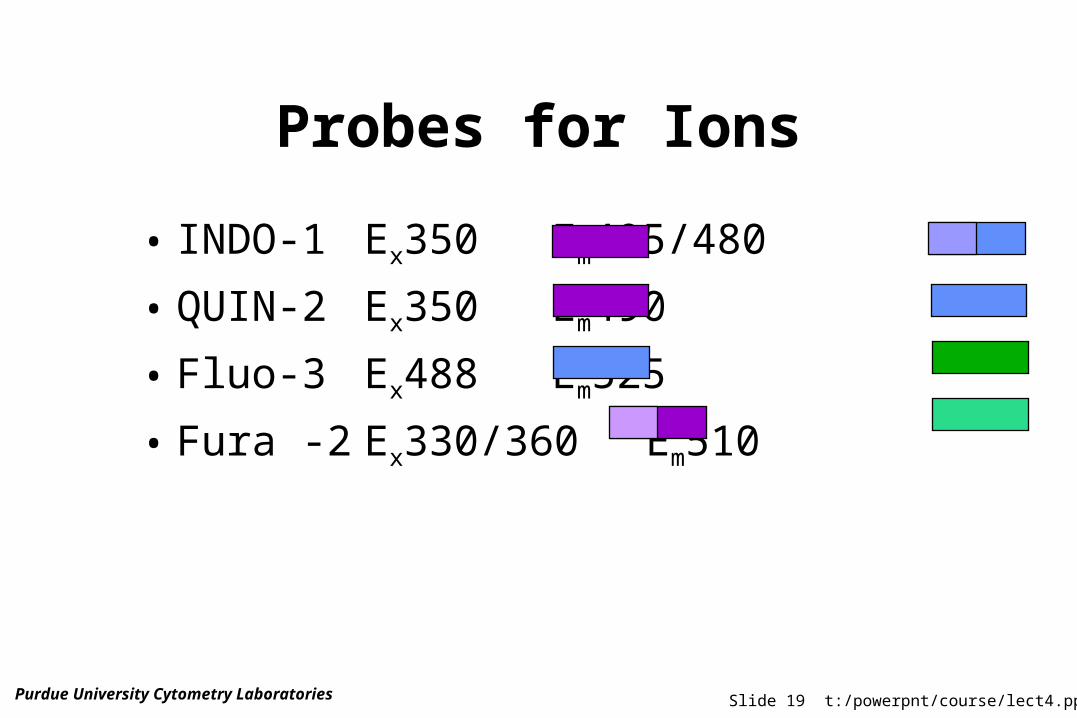
Probes for Ions
• INDO-1 Ex350Em405/480
• QUIN-2 Ex350 Em490
• Fluo-3 Ex488 Em525
• Fura -2 Ex330/360 Em510

Slide 20 t:/powerpnt/course/lect4.pptPurdue University Cytometry Laboratories
pH Sensitive Indicators
• SNARF-1 488 575
• BCECF 488 525/620
440/488 525[2’,7’-bis-(carboxyethyl)-5,6-carboxyfluorescein]
Probe Excitation Emission

Slide 21 t:/powerpnt/course/lect4.pptPurdue University Cytometry Laboratories
Probes for Oxidation States
• DCFH-DA(H2O2) 488 525
• HE (O2-) 488 590
• DHR 123 (H2O2) 488 525
Probe Oxidant Excitation Emission
DCFH-DA - dichlorofluorescin diacetateHE - hydroethidineDHR-123 - dihydrorhodamine 123

Slide 22 t:/powerpnt/course/lect4.pptPurdue University Cytometry Laboratories
Specific Organelle Probes
BODIPY Golgi 505 511
NBD Golgi 488 525
DPH Lipid 350 420
TMA-DPH Lipid 350 420
Rhodamine 123 Mitochondria 488 525
DiO Lipid 488 500
diI-Cn-(5) Lipid 550 565
diO-Cn-(3) Lipid 488 500
Probe Site Excitation Emission
BODIPY - borate-dipyrromethene complexesNBD - nitrobenzoxadiazoleDPH - diphenylhexatrieneTMA - trimethylammonium

Slide 23 t:/powerpnt/course/lect4.pptPurdue University Cytometry Laboratories
Other Probes of Interest• GFP - Green Fluorescent Protein
– GFP is from the chemiluminescent jellyfish Aequorea victoria
– excitation maxima at 395 and 470 nm (quantum efficiency is 0.8) Peak emission at 509 nm
– contains a p-hydroxybenzylidene-imidazolone chromophore generated by oxidation of the Ser-Tyr-Gly at positions 65-67 of the primary sequence
– Major application is as a reporter gene for assay of promoter activity
– requires no added substrates

Slide 24 t:/powerpnt/course/lect4.pptPurdue University Cytometry Laboratories
Multiple Emissions
• Many possibilities for using multiple probes with a single excitation
• Multiple excitation lines are possible
• Combination of multiple excitation lines or probes that have same excitation and quite different emissions– e.g. Calcein AM and Ethidium (ex 488)– emissions 530 nm and 617 nm
Slide 25 t:/powerpnt/course/lect4.pptPurdue University Cytometry Laboratories
Energy Transfer
• Effective between 10-100 Å only
• Emission and excitation spectrum must significantly overlap
• Donor transfers non-radiatively to the acceptor
• PE-Texas Red™
• Carboxyfluorescein-Sulforhodamine B

Slide 26 t:/powerpnt/course/lect4.pptPurdue University Cytometry Laboratories
Conclusions• Confocal Microscopes are designed to use fluorescence• Dye molecules must be close to, but below saturation levels
for optimum emission • Fluorescence emission is longer than the exciting wavelength• The energy of the light increases with reduction of wavelength• Fluorescence probes must be appropriate for the excitation
source and the sample of interest• Correct optical filters must be used for multiple color
fluorescence emission