Embed Size (px)
Citation preview

Slide 1
Risk and Rates of Return Remembering axioms Inflation and rates of return How to measure risk
(variance, standard deviation, beta) How to reduce risk
(diversification) How to price risk
(security market line, CAPM)
Slide 2
Ten Axioms of Financial Management Risk-Return Tradeoff
Save and invest for future consumption Investments should provide appropriate compensation
for forgone consumption

Slide 3
Ten Axioms of Financial Management
90%
Large-companystocks 13.3% 20.1
Small-companystocks 17.6 33.6
Long-termcorporate bonds 5.9 8.7
Long-termgovernment 5.5 9.3
Intermediate-termgovernment 5.4 5.8
U.S. Treasurybills 3.8 3.2
Inflation 3.2 4.5
-90% 0%
SeriesAverageReturn
StandardDeviation Distribution

Slide 4
Interest Rates The real, risk-free rate is the rate which would
exist on default-free (and free of other risks) obligations in an inflation-free environment (k*)
Most economists believe that the real rate of interest is approximately one to three percent
The Fisher equation indicates that the nominal rate of interest (krf) includes a component for inflation
risk premium (IRP))1*)(1()1( IRPkkrf

Slide 5
Interest Rates (Continued) Suppose the real rate is 3%, and the nominal rate
is 8%. What is the inflation rate premium?
(1.08) = (1.03) (1 + IRP)
(1 + IRP) = (1.0485), so
IRP = 4.85%
)1*)(1()1( IRPkkrf

Slide 6
Term Structure of Interest Rates The pattern of rates of return for debt securities
that differ only in the length of time to maturity1. Normal
Maturity
Yie
ld
2. Inverted
Maturity
Yie
ld
Slide 7
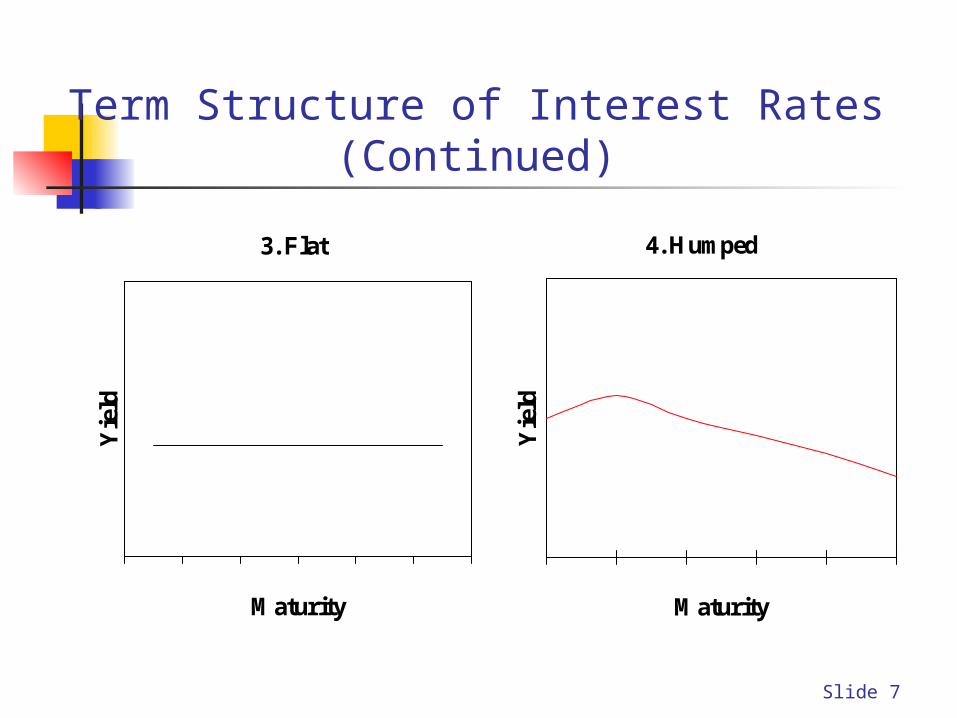
Term Structure of Interest Rates (Continued)
3. Flat
Maturity
Yie
ld
4. Humped
Maturity
Yie
ld

Slide 8
Term Structure of Interest Rates (Continued)Treasury Yield Curve
0.00
1.00
2.00
3.00
4.00
5.00
6.00
0 5 10 15 20 25 30
Maturity (in years)
Yie
ld (%
)
Nov. 2, 2001 Jun. 27, 2003 Jun. 18, 2004
http://www.smartmoney.com/onebond/index.cfm?story=yieldcurve
http://www.stockcharts.com/charts/YieldCurve.html
Slide 9
Term Structure of Interest Rates (Continued) Expected Return - the return that an investor
expects to earn on an asset, given its price, growth potential, etc
Required Return - the return that an investor requires on an asset given its risk and market interest rates

Slide 10
Treasury Securities Required Return The required return on Treasury securities is equal
to risk-free rate of return Since Treasuries are essentially free of default
risk, the rate of return on a Treasury security is considered the “risk-free” rate of return

Slide 11
Required Return on Risky Investments Required return on risky investments should take
into account what investors can earn on riskless investments and the risk premium for the risky investment
The problem is to determine how large of a risk premium we should require to buy a corporate security

Slide 12
Expected Return
For each firm, the expected return on the stock is
n
iiiA
nnA
kPkk
kPkkPkkPkk
1
2211
)(
or )(......)()(
Return
State of Economy Probability (P) Utility Tech
Recession 0.20 4.00% -10.00%
Normal 0.50 10.00% 14.00%
Boom 0.30 14.00% 30.00%

Slide 13
Expected Return (Continued)
For each firm, the expected return on the stock is
%14%)30)(30.0(%)14)(50.0(%)10)(20.0(
%10%)14)(30.0(%)10)(50.0(%)4)(20.0(
)(......)()( 2211
T
U
nnA
k
k
kPkkPkkPkk
Return
State of Economy Probability (P) Utility Tech
Recession 0.20 4.00% -10.00%
Normal 0.50 10.00% 14.00%
Boom 0.30 14.00% 30.00%

Slide 14
What is RISK? Based only on your expected return calculations,
which stock would you prefer? Have you considered the RISK? The possibility that an actual return will differ
from our expected return Uncertainty in the distribution of possible
outcomes

Slide 15
How do we Measure Risk? A scientific approach is to examine the stock’s
standard deviation of returns Standard deviation is a measure of the dispersion of
possible outcomes The greater the standard deviation, the greater the
uncertainty, and therefore, the greater the risk
n
iii kPkk
1
2 )()(
Slide 16
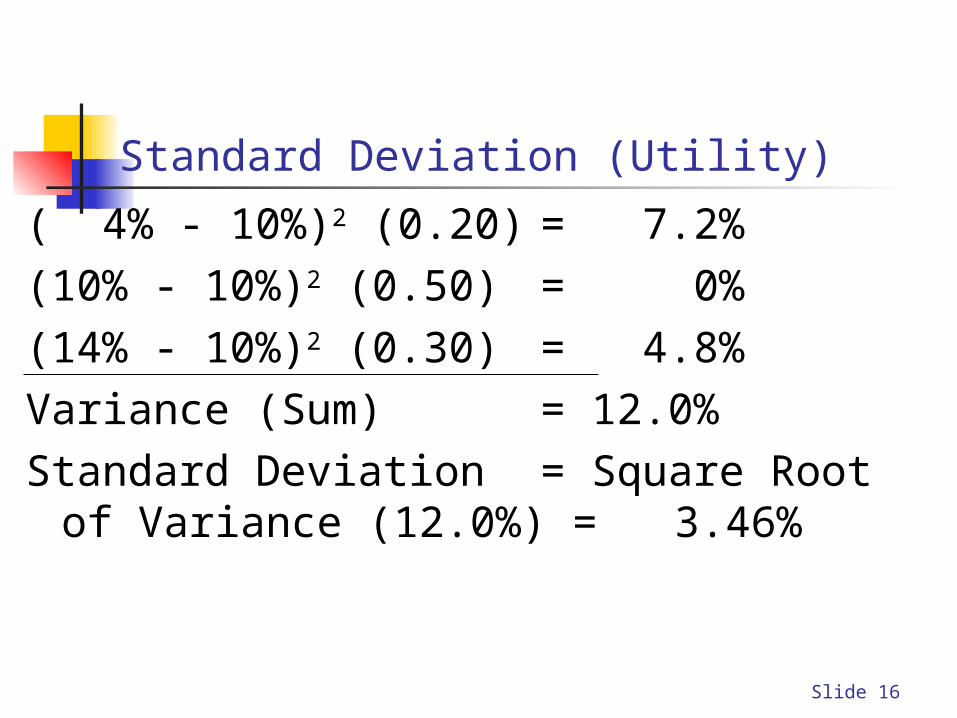
Standard Deviation (Utility)
( 4% - 10%)2 (0.20) = 7.2%
(10% - 10%)2 (0.50) = 0%
(14% - 10%)2 (0.30) = 4.8%
Variance (Sum) = 12.0%
Standard Deviation = Square Root of Variance (12.0%) = 3.46%
Slide 17
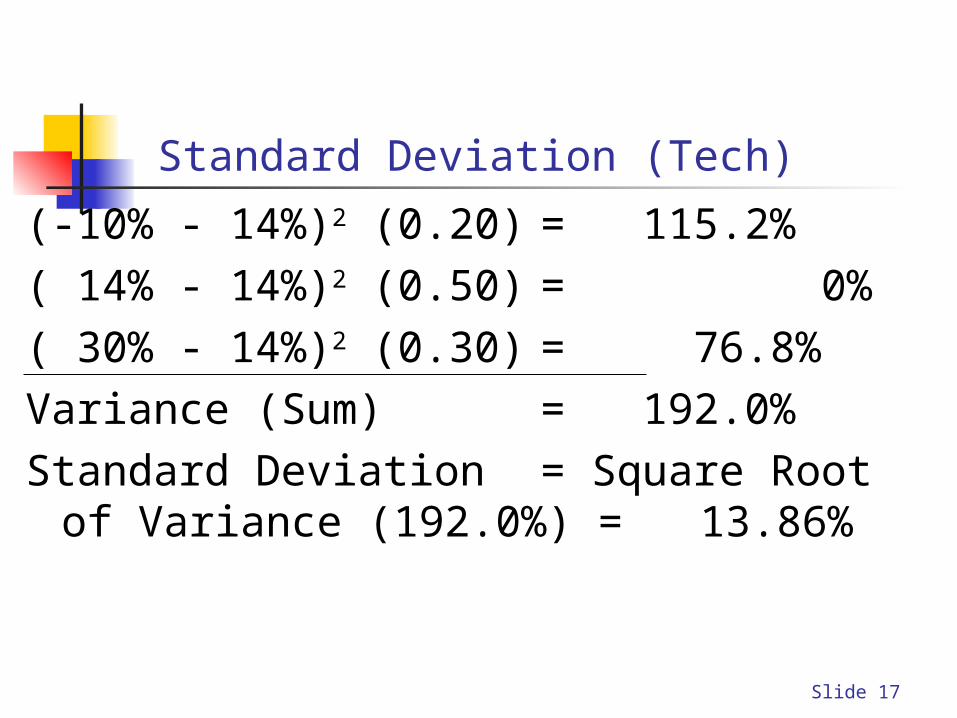
Standard Deviation (Tech)
(-10% - 14%)2 (0.20) = 115.2%
( 14% - 14%)2 (0.50) = 0%
( 30% - 14%)2 (0.30) = 76.8%
Variance (Sum) = 192.0%
Standard Deviation = Square Root of Variance (192.0%) = 13.86%

Slide 18
Which Stock Would You Prefer
Utility Tech
Expected Return 10.00% 14.00%
Standard Deviation 3.46% 13.86% It depends on your tolerance for risk! Remember, there’s a tradeoff between risk and
return

Slide 19
Portfolios Combining several securities in a portfolio can actually reduce overall
risk How does this work?
rateof
return
time
kp
kA
kB

Slide 20
Diversification Investing in more than one security to reduce risk If two stocks are perfectly positively correlated,
diversification has no effect on risk If two stocks are perfectly negatively correlated,
the portfolio is perfectly diversified If you owned a share of every stock traded on the
NYSE and NASDAQ, would you be diversified? – YES!
Would you have eliminated all of your risk? – NO! Common stock portfolios still have risk

Slide 21
Types of Risk Market risk (systematic risk) is non-diversifiable.
This type of risk cannot be diversified away Unexpected changes in interest rates Unexpected changes in cash flows due to tax rate
changes, foreign competition, and the overall business cycle

Slide 22
Types of Risk Company-unique risk (unsystematic risk) is diversifiable.
This type of risk can be reduced through diversification A company’s labor force goes on strike A company’s top management dies in a plane crash A huge oil tank bursts and floods a company’s production area

Slide 23
As you add stocks to your portfolio, company-unique risk is reduced

Slide 24
Do some firms have more market risk than others? Yes. For example: Interest rate changes affect all firms, but which
would be more affected: Retail food chain Commercial bank
As we know, the market compensates investors for accepting risk - but only for market risk. Company-unique risk can and should be diversified away
So - we need to be able to measure market risk

Slide 25
This is why we have Beta Beta: a measure of market risk Specifically, beta is a measure of how an
individual stock’s returns vary with market returns It’s a measure of the “sensitivity” of an individual
stock’s returns to changes in the market

Slide 26
-5-15 5 10 15
-15
-10
-10
-5
5
10
15
XYZ Co. returns
S&P 500returns
. . . .
. . . .. . . .
. . . .. . . .
. . . .
. . . .
. . . .
. . . .
. . .
. . . .
. . . .
Calculating BetaBeta = slope = 1.20
Slide 27
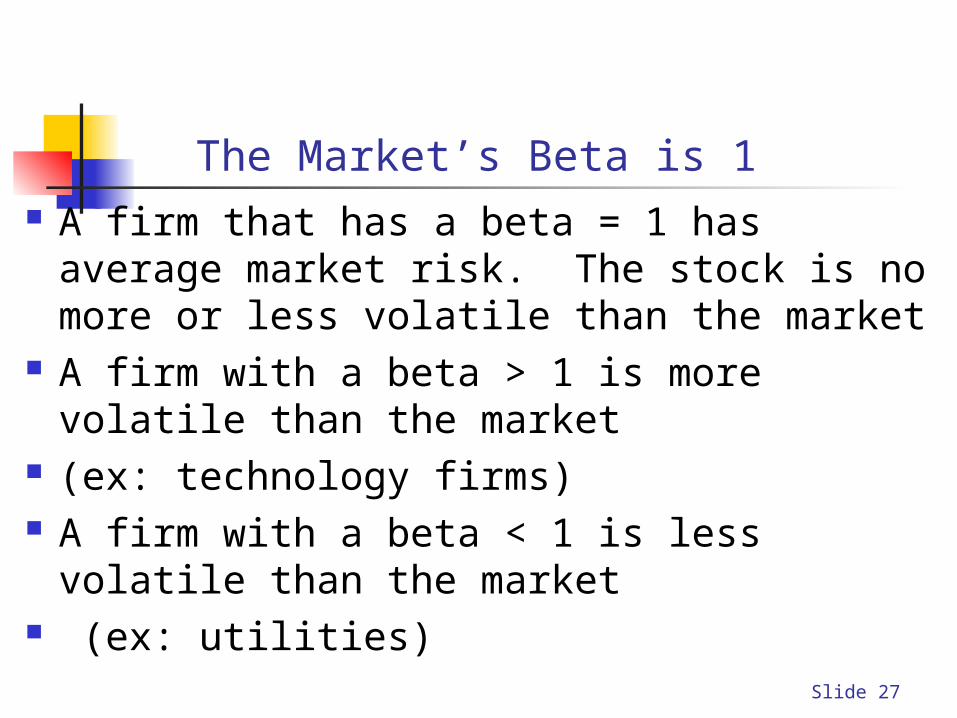
The Market’s Beta is 1 A firm that has a beta = 1 has average market risk.
The stock is no more or less volatile than the market
A firm with a beta > 1 is more volatile than the market
(ex: technology firms) A firm with a beta < 1 is less volatile than the
market (ex: utilities)

Slide 28
Summary We know how to measure risk, using standard
deviation for overall risk and beta for market risk We know how to reduce overall risk to only
market risk through diversification We need to know how to price risk so we will
know how much extra return we should require for accepting extra risk
Slide 29
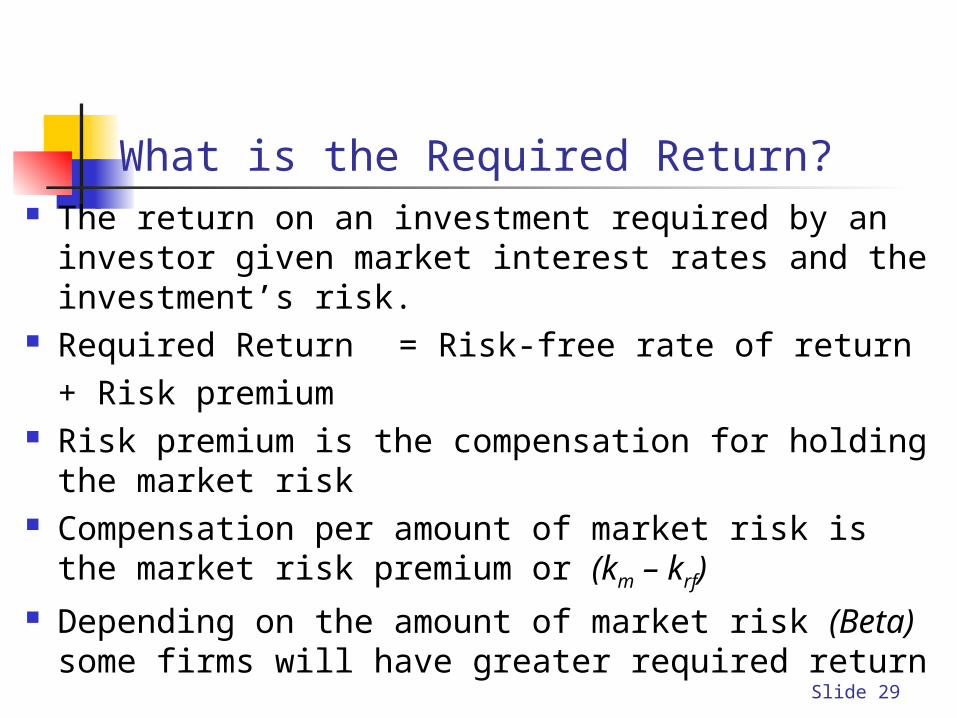
What is the Required Return? The return on an investment required by an investor given
market interest rates and the investment’s risk. Required Return = Risk-free rate of return
+ Risk premium Risk premium is the compensation for holding the market
risk Compensation per amount of market risk is the market
risk premium or (km – krf) Depending on the amount of market risk (Beta) some
firms will have greater required return

Slide 30
What is the Required Return? (Continued) This linear relationship between risk and required
return is known as the Capital Asset Pricing Model (CAPM)
indexmarket on thereturn the:
jsecurity of beta the:
interest of rate free-risk the:
jsecurity on return required the:
where,
)(
m
j
rf
j
rfmjrfj
k
k
k
kkkk

Slide 31
0%
5%
10%
15%
20%
25%
30%
0 0.5 1 1.5 2 2.5 3
Beta
Req
uire
d R
etur
n
krf
km
m
Security Market Line
Note that the slope of SML is the market risk premium or (km – krf)
Security Market Line (SML)

Slide 32
Example Suppose the Treasury bond rate is 6%, the average
return on the S&P 500 index is 12%, and Walt Disney has a beta of 1.2
According to the CAPM, what should be the required rate of return on Disney stock?
kDIS = 0.06 + 1.2 (0.12 - 0.06)
kDIS = 0.132 = 13.2% According to the CAPM, Disney stock should be
priced to give a 13.2% return

Slide 33
SLM and Fair Pricing Theoretically, every security should lie on the
SML If every stock is on the SML, investors are being
fully compensated for risk If a security is above the SML, it is underpriced If a security is below the SML, it is overpriced
Slide 34
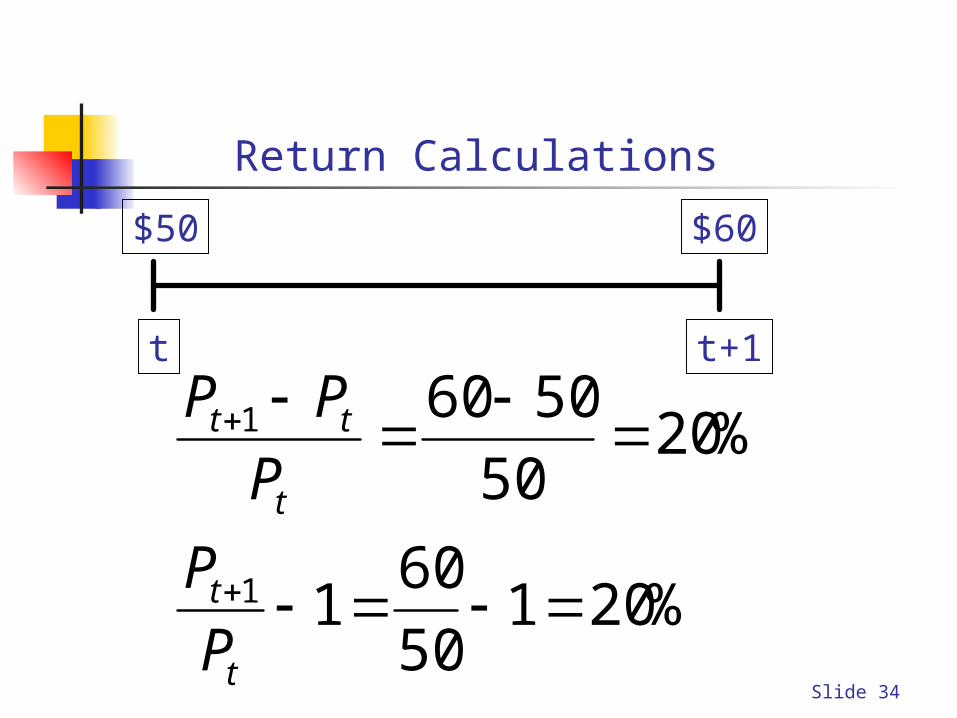
Return Calculations
%20150
601
%2050
5060
1
1
t
t
t
tt
P
P
P
PPt t+1
$50 $60