Embed Size (px)
Citation preview
SIMS 2009The 2nd Seoul International Maritime and Shipbuilding
Conference
17 September 2009
Peter M. SwiftManaging Director, INTERTANKO
Key Issues for Shipowners Today
Key Issues for Shipowners Today ?• Establishing an international framework of
consistent regulations and standards
• Delivering best environmental performance
• Ensuring availability of good people (and quality ships)
• Ensuring welfare and well-being of ships’ crews
• Meeting the challenges of Piracy
• Surviving the financial crisis
Establishing an international framework of consistent regulations and standards
Shipowners supporting:
• International rather than unilateral legislation• Ratification of IMO (and ILO) Conventions• IMO Member State Audit scheme (Flag & Coastal States) • Harmonisation and uniformity across Port State Control
regimes• Development and Application of Common Structural Rules
for Tankers & Bulkers• Classification societies’ procedural requirements, unified
requirements and unified interpretations• Greater uniformity in chartering practices and standards
Delivering best environmental performance
• Air emissions - Green House Gases - Exhaust Gas emissions (Annex VI & its revisions) - VOC emissions
• Spill Prevention and Response Planning• Ballast Water management • Biofouling• Antifouling systems• Ship Recycling• Port Reception Facilities (adequacy & affordability) • Waste management (onboard and ashore)• Radiated Noise pollution• Cetacean strikes
Ensuring availability of good people - recruitment, training and retention
Both a quantity and quality challenge !
Recruitment initiatives covering: • Raising awareness of the industry: - www.maritimefoundation.com and Careers outreach programme - www.shippingfacts.com - www.careers-at-sea.org and DVD: Careers in International Shipping - www.bimco.org/Corporate%20Area/Seascapes.aspx
• Attracting entrants to the Maritime Professions (Round Table: “Human Resources strategy” and IMO: “Go to Sea” campaigns)
Ensuring availability of good people - recruitment, training and retention
Both a quantity and quality challenge !
Training and retention initiatives covering: • Provision of Cadet berths and training facilities on ALL new
ships and maximum utilisation of cadet berths on existing ships
• Revision of STCW Convention• Development of Tanker Officer Training Standards (TOTS),
covering proficiency and experience, as the industry standard
• Establishment of Seafarer Focus Groups to provide feedback of experiences
Ensuring welfare and well-being of ships’ crews
Initiatives covering: • Unjustified criminalisation• Support for IMO-ILO guidelines on Fair Treatment of
Seafarers (in event of Maritime Accident)• Improved conditions for shore leave and access • Reduction in number of inspections• Less bureaucracy and associated paperwork• Guidelines for safe handling of cargoes and fuels, tank
cleaning and entry• Guidelines on implementing ILO Convention on “work and
rest hours” • Higher standards of accommodation as industry “norms”
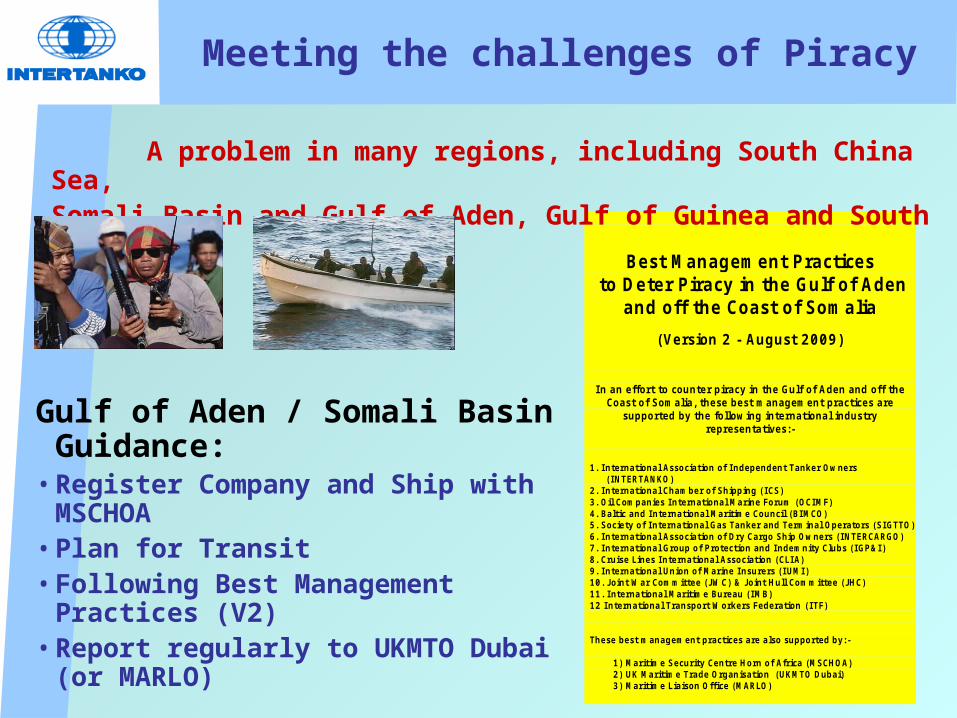
Meeting the challenges of Piracy
Gulf of Aden / Somali Basin Guidance:
• Register Company and Ship with MSCHOA
• Plan for Transit• Following Best Management Practices
(V2) • Report regularly to UKMTO Dubai (or
MARLO)
Best Management Practices to Deter Piracy in the Gulf of Aden
and off the Coast of Somalia
(Version 2 - August 2009)
I n an effort to counter piracy in the Gulf of Aden and off the Coast of Somalia, these best management practices are
supported by the following international industry representatives:-
1. I nternational Association of I ndependent Tanker Owners (I NTERTANKO)
2. I nternational Chamber of Shipping (I CS) 3. Oil Companies I nternational Marine Forum (OCIMF) 4. Baltic and International Maritime Council (BIMCO) 5. Society of I nternational Gas Tanker and Terminal Operators (SIGTTO) 6. I nternational Association of Dry Cargo Ship Owners (I NTERCARGO) 7. I nternational Group of Protection and I ndemnity Clubs (I GP&I ) 8. Cruise Lines I nternational Association (CLI A) 9. I nternational Union of Marine I nsurers (I UMI ) 10. J oint War Committee (J WC) & J oint Hull Committee (J HC) 11. I nternational Maritime Bureau (IMB) 12 I nternational Transport Workers Federation (ITF) These best management practices are also supported by:- 1) Maritime Security Centre Horn of Africa (MSCHOA) 2) UK Maritime Trade Organisation (UKMTO Dubai) 3) Maritime Liaison Office (MARLO)
A problem in many regions, including South China Sea, Somali Basin and Gulf of Aden, Gulf of Guinea and South America !
Surviving the financial crisis !
• Demand : World trade & by sector
• Supply : Ships on Order & Fleet development
• Shipbuilding capacity
• Tanker market
SIMS 2008
Issues and Challenges for Tanker Shipping
Global Financial Crisis
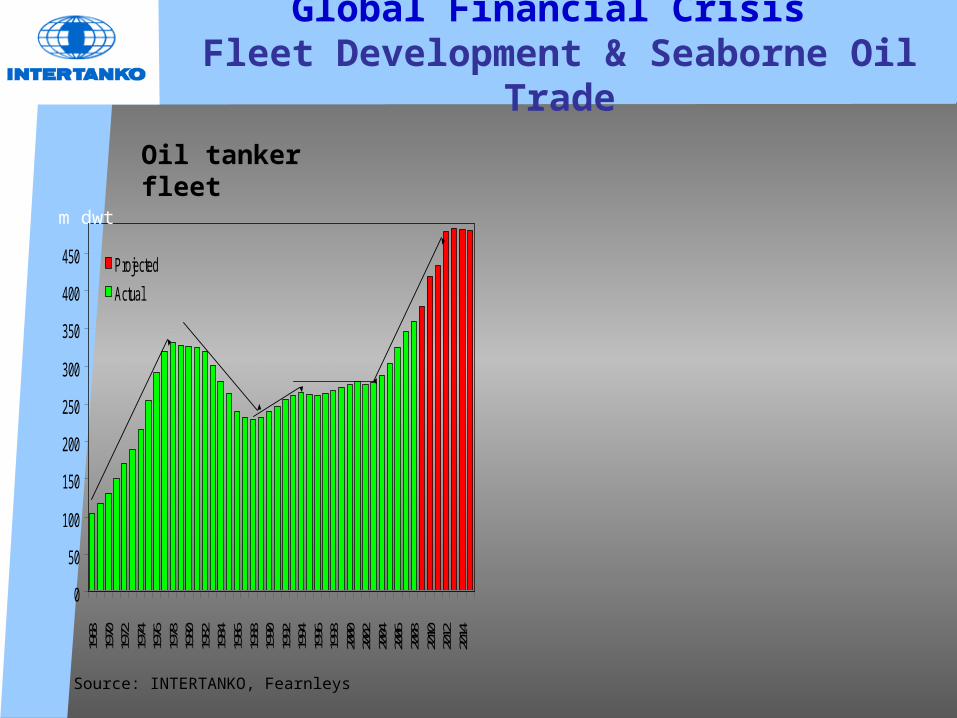
Global Financial Crisis Fleet Development & Seaborne Oil Trade
0
50
100
150
200
250
300
350
400
450
1968
1970
1972
1974
1976
1978
1980
1982
1984
1986
1988
1990
1992
1994
1996
1998
2000
2002
2004
2006
2008
2010
2012
2014
ProjectedActual
Oil tanker fleet
m dwt
Source: INTERTANKO, Fearnleys
0
2,500
5,000
7,500
10,000
12,500
72 74 76 78 80 82 84 86 88 90 92 94 96 98 00 02 04 06P08
P10
Oil productsCrude oil
???
Source: INTERTANKO, Fearnleys
Seaborne oil trade
bn tonne milesbn tonne miles
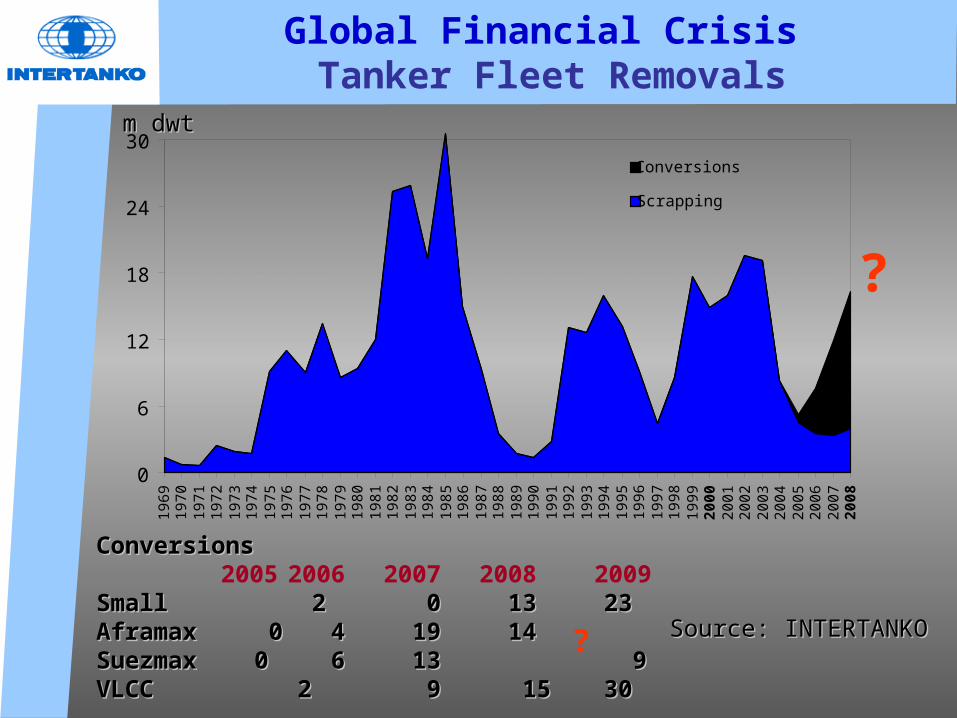
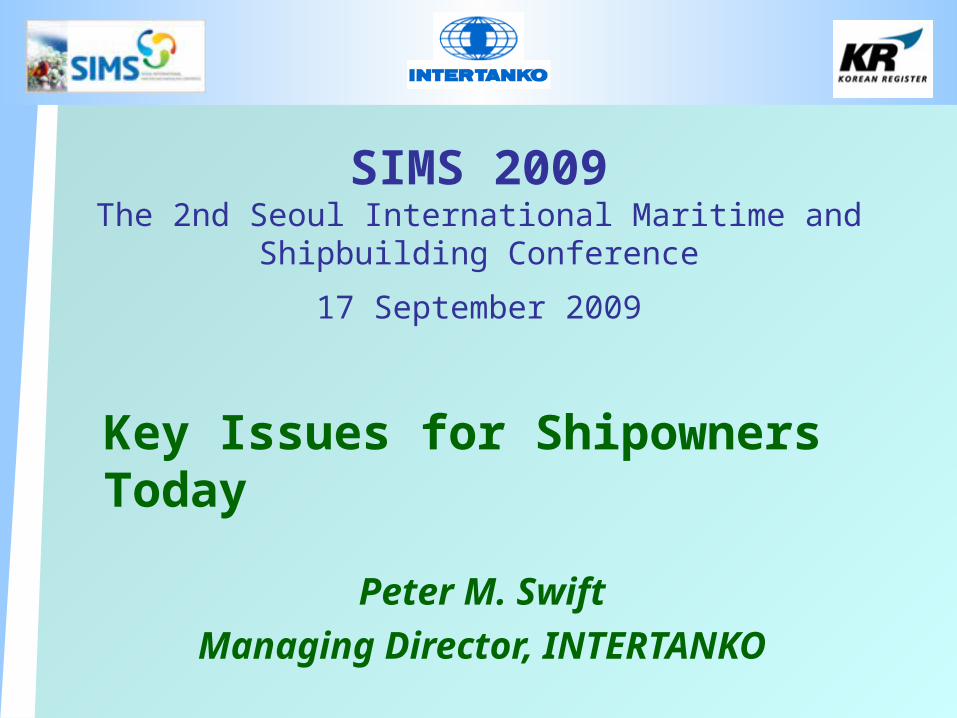
Global Financial Crisis Tanker Fleet Removals
Source: INTERTANKOSource: INTERTANKO
m dwtm dwt
ConversionsConversions 2005 2006 2007 2008 2009
Small 2Small 2 0 0 13 13 23 23Aframax 0Aframax 0 4 4 19 19 14 14Suezmax 0Suezmax 0 6 6 13 13 9 9VLCC 2VLCC 2 9 9 15 15 30 30
0
6
12
18
24
3019
6919
7019
7119
7219
7319
7419
7519
7619
7719
7819
7919
8019
8119
8219
8319
8419
8519
8619
8719
8819
8919
9019
9119
9219
9319
9419
9519
9619
9719
9819
9920
0020
0120
0220
0320
0420
0520
0620
0720
08
Conversions
Scrapping
?
?
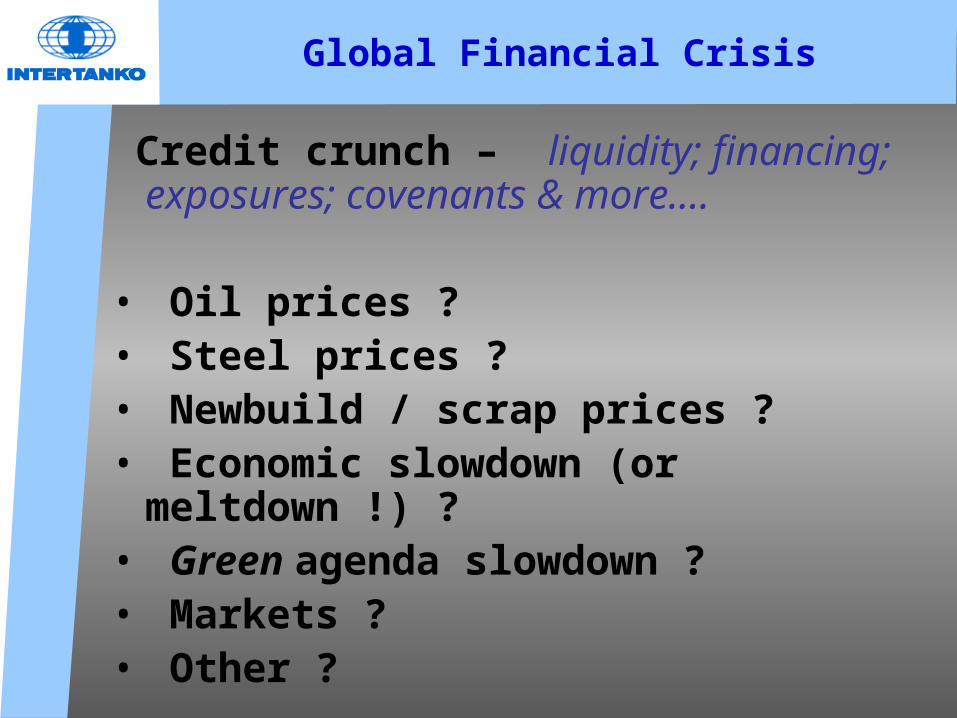
Credit crunch – liquidity; financing; exposures; covenants & more….
• Oil prices ?• Steel prices ?• Newbuild / scrap prices ?• Economic slowdown (or meltdown !) ?• Green agenda slowdown ?• Markets ?• Other ?
Global Financial Crisis
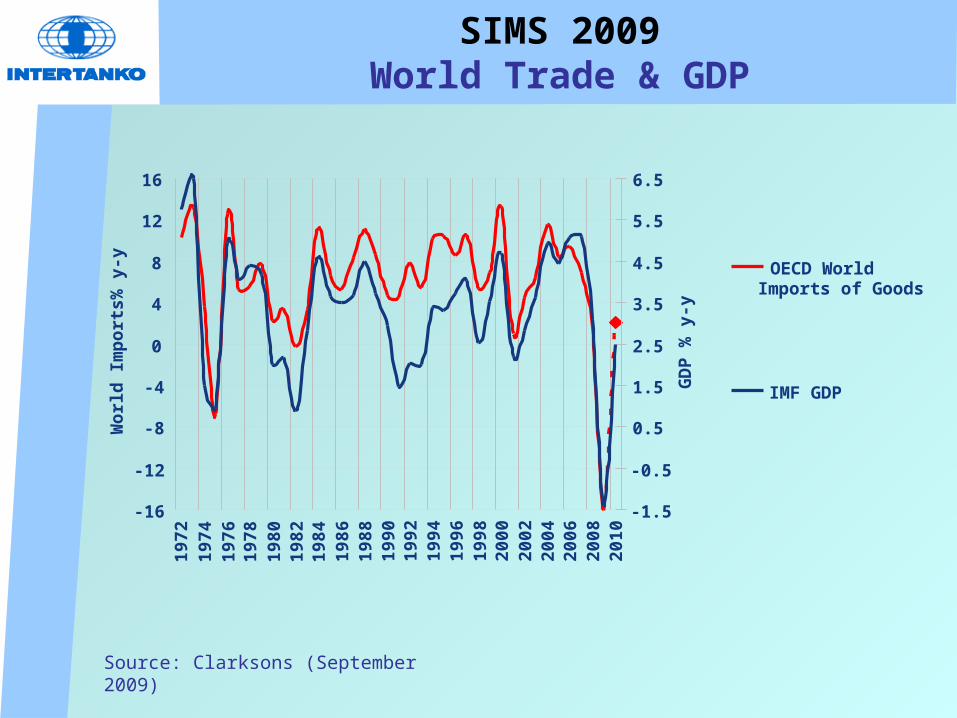
SIMS 2009World Trade & GDP
-16
-12
-8
-4
0
4
8
12
1619
7219
7419
7619
7819
8019
8219
8419
8619
8819
9019
9219
9419
9619
9820
0020
0220
0420
0620
0820
10
Wor
ld Im
port
s% y
-y
-1.5
-0.5
0.5
1.5
2.5
3.5
4.5
5.5
6.5
GD
P %
y-y
OECD WorldImports of Goods
IMF GDP
Source: Clarksons (September 2009)
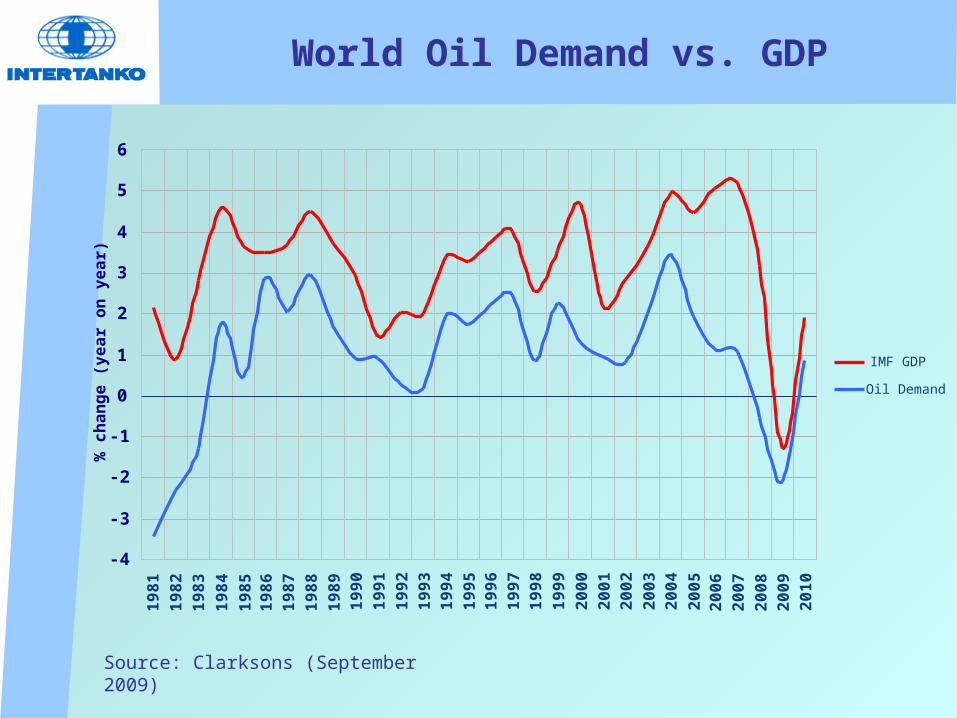
World Oil Demand vs. GDP
-4
-3
-2
-1
0
1
2
3
4
5
619
8119
8219
8319
8419
8519
8619
8719
8819
8919
9019
9119
9219
9319
9419
9519
9619
9719
9819
9920
0020
0120
0220
0320
0420
0520
0620
0720
0820
0920
10
% c
hang
e (y
ear o
n ye
ar)
IMF GDP
Oil Demand
Source: Clarksons (September 2009)
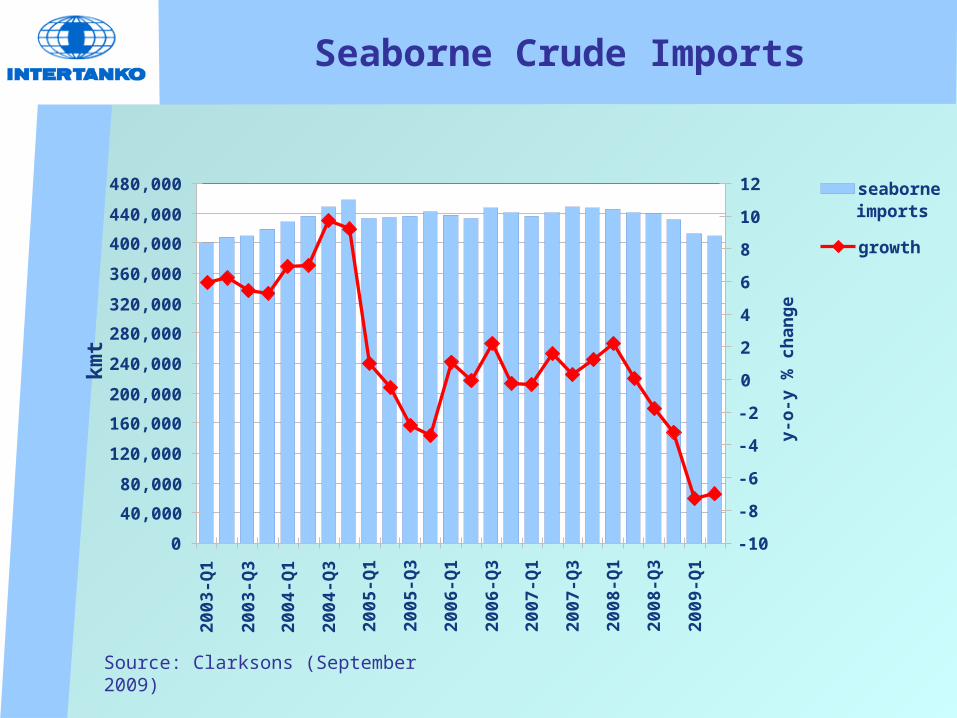
Seaborne Crude Imports
040,00080,000
120,000160,000200,000240,000280,000320,000360,000400,000440,000480,000
2003
-Q1
2003
-Q3
2004
-Q1
2004
-Q3
2005
-Q1
2005
-Q3
2006
-Q1
2006
-Q3
2007
-Q1
2007
-Q3
2008
-Q1
2008
-Q3
2009
-Q1
kmt
-10
-8
-6
-4
-2
0
2
4
6
8
10
12
y-o-
y %
cha
nge
seaborneimports
growth
Source: Clarksons (September 2009)
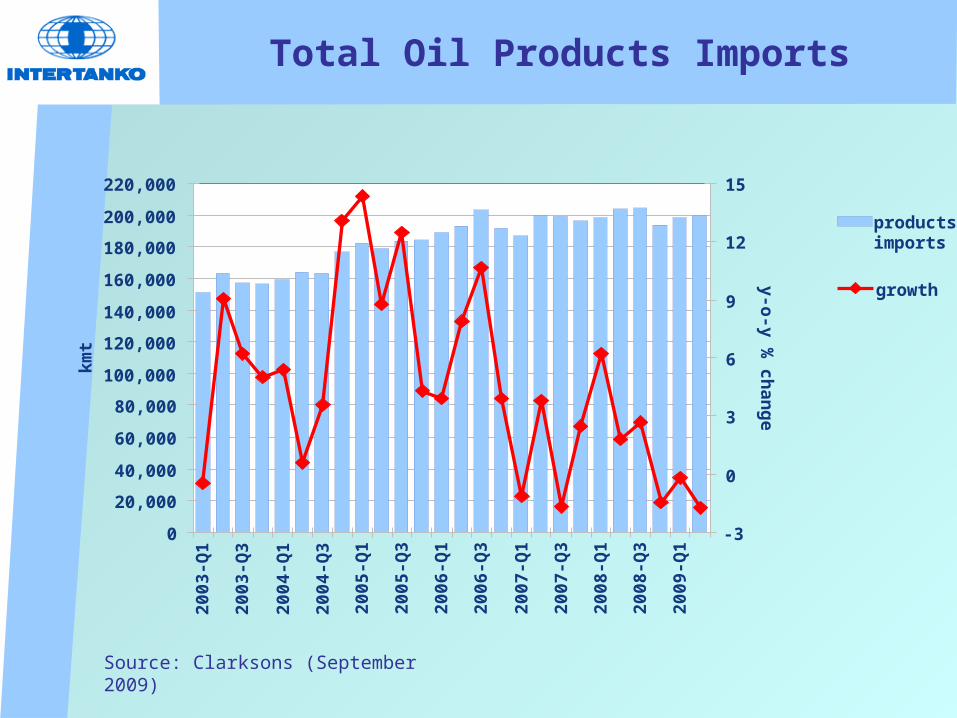
Total Oil Products Imports
0
20,000
40,000
60,000
80,000
100,000
120,000
140,000
160,000
180,000
200,000
220,00020
03-Q
1
2003
-Q3
2004
-Q1
2004
-Q3
2005
-Q1
2005
-Q3
2006
-Q1
2006
-Q3
2007
-Q1
2007
-Q3
2008
-Q1
2008
-Q3
2009
-Q1
kmt
-3
0
3
6
9
12
15y-o-y %
change
productsimports
growth
Source: Clarksons (September 2009)
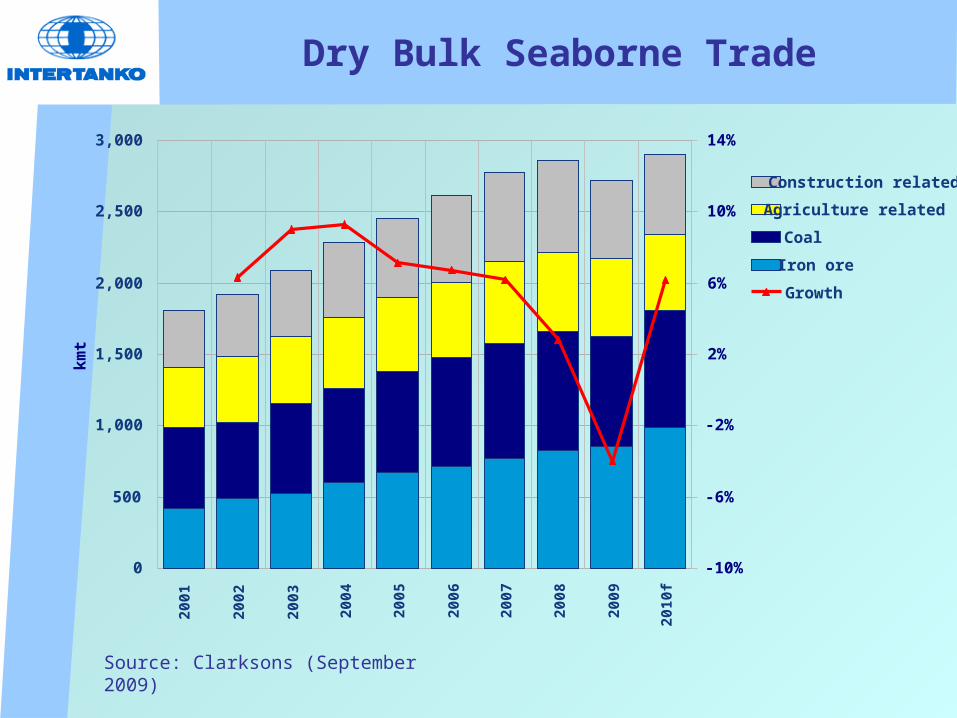
Dry Bulk Seaborne Trade
0
500
1,000
1,500
2,000
2,500
3,000
2001
2002
2003
2004
2005
2006
2007
2008
2009
2010
f
kmt
-10%
-6%
-2%
2%
6%
10%
14%
Construction relatedAgriculture related CoalIron oreGrowth
Source: Clarksons (September 2009)
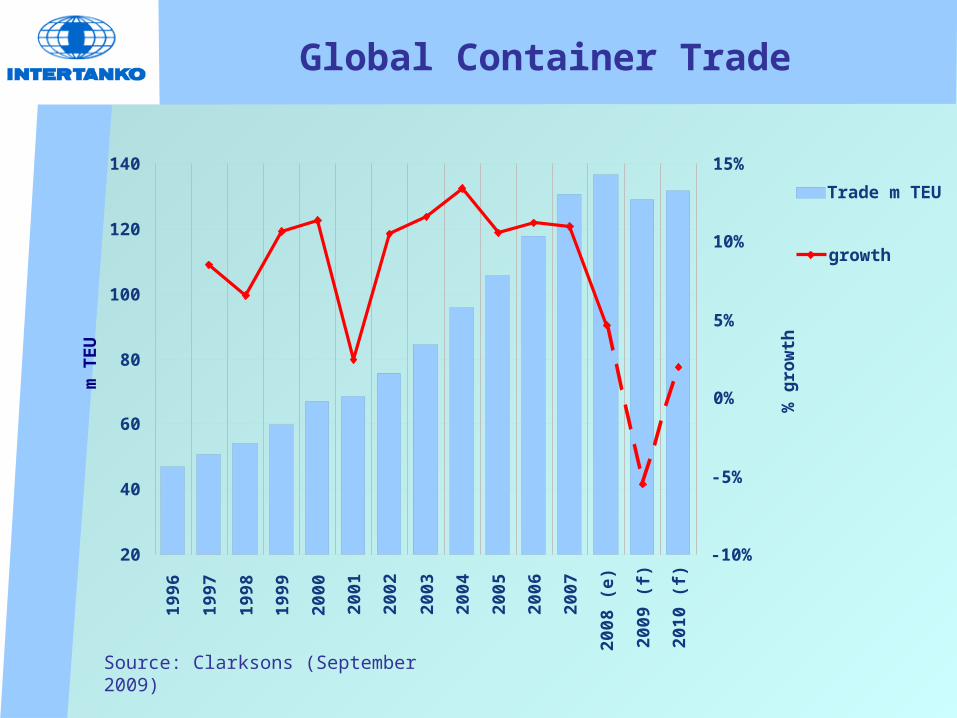
Global Container Trade
20
40
60
80
100
120
14019
96
1997
1998
1999
2000
2001
2002
2003
2004
2005
2006
2007
2008
(e)
2009
(f)
2010
(f)
m T
EU
-10%
-5%
0%
5%
10%
15%
% g
row
th
Trade m TEU
growth
Source: Clarksons (September 2009)
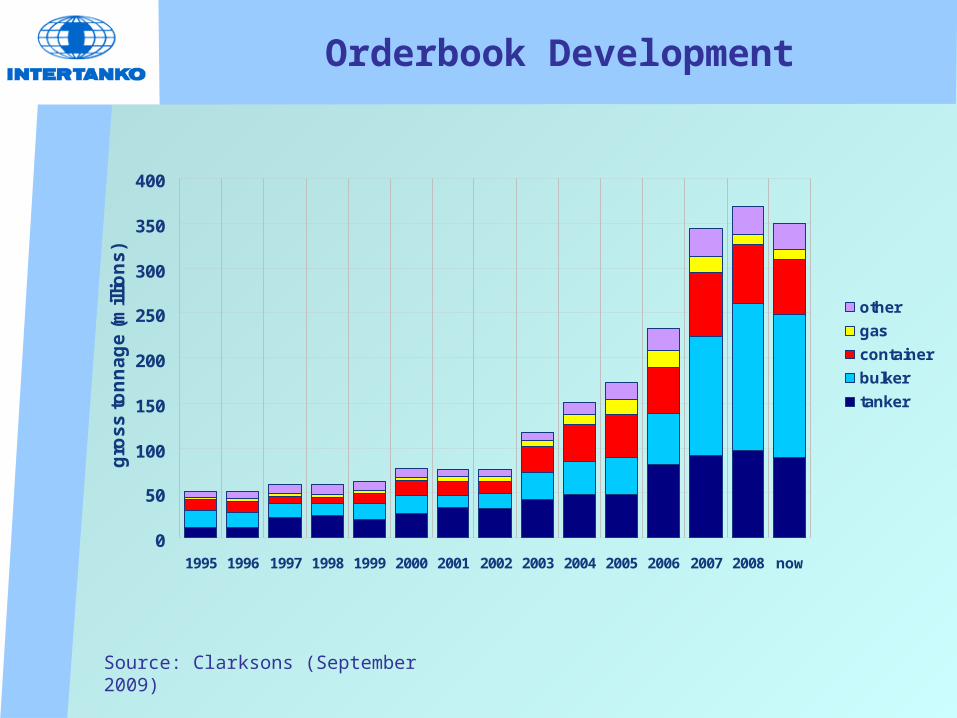
Orderbook Development
0
50
100
150
200
250
300
350
400
1995 1996 1997 1998 1999 2000 2001 2002 2003 2004 2005 2006 2007 2008 now
gros
s to
nnag
e (m
illio
ns)
othergascontainerbulkertanker
Source: Clarksons (September 2009)
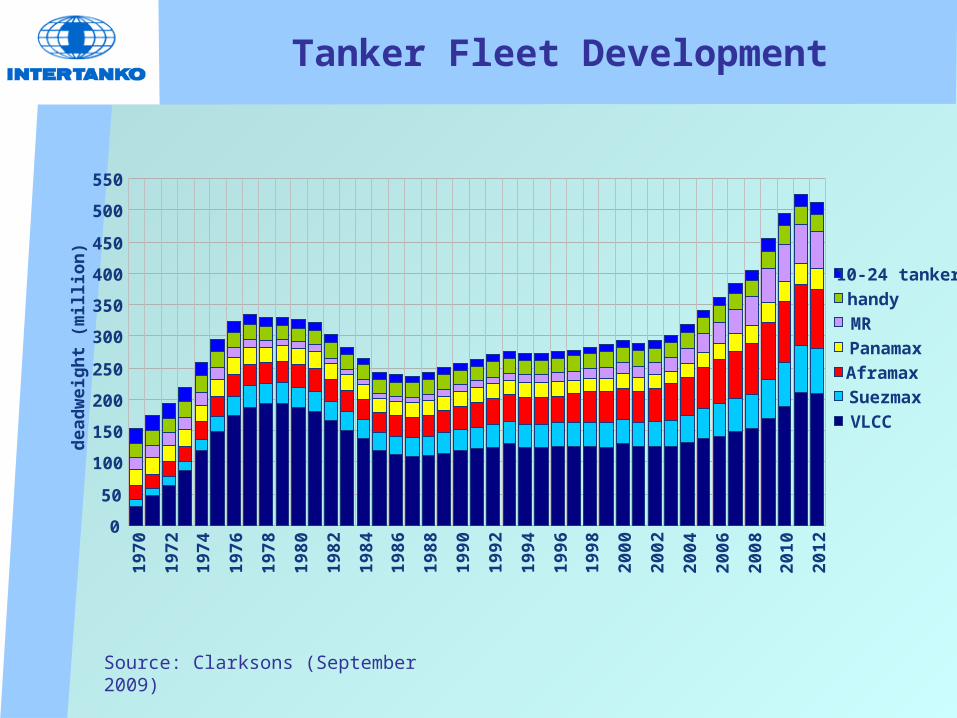
Tanker Fleet Development
0
50
100
150
200
250
300
350
400
450
500
550
1970
1972
1974
1976
1978
1980
1982
1984
1986
1988
1990
1992
1994
1996
1998
2000
2002
2004
2006
2008
2010
2012
dead
wei
ght (
mill
ion) 10-24 tanker
handyMRPanamaxAframaxSuezmaxVLCC
Source: Clarksons (September 2009)
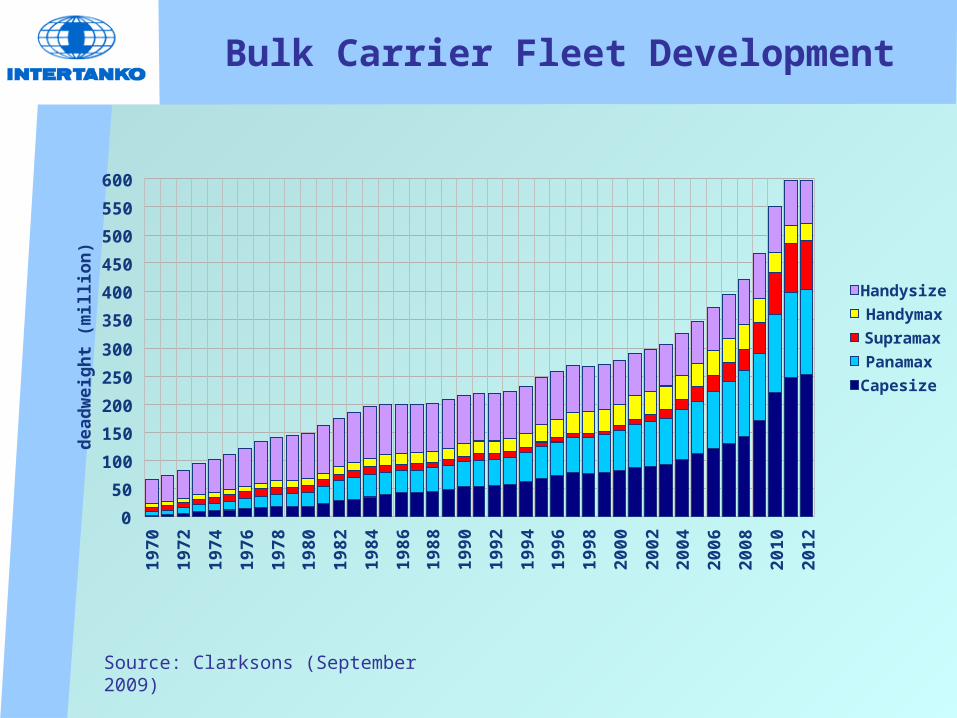
Bulk Carrier Fleet Development
050
100150200250300350400450500550600
1970
1972
1974
1976
1978
1980
1982
1984
1986
1988
1990
1992
1994
1996
1998
2000
2002
2004
2006
2008
2010
2012
dead
wei
ght (
mill
ion)
HandysizeHandymaxSupramaxPanamaxCapesize
Source: Clarksons (September 2009)
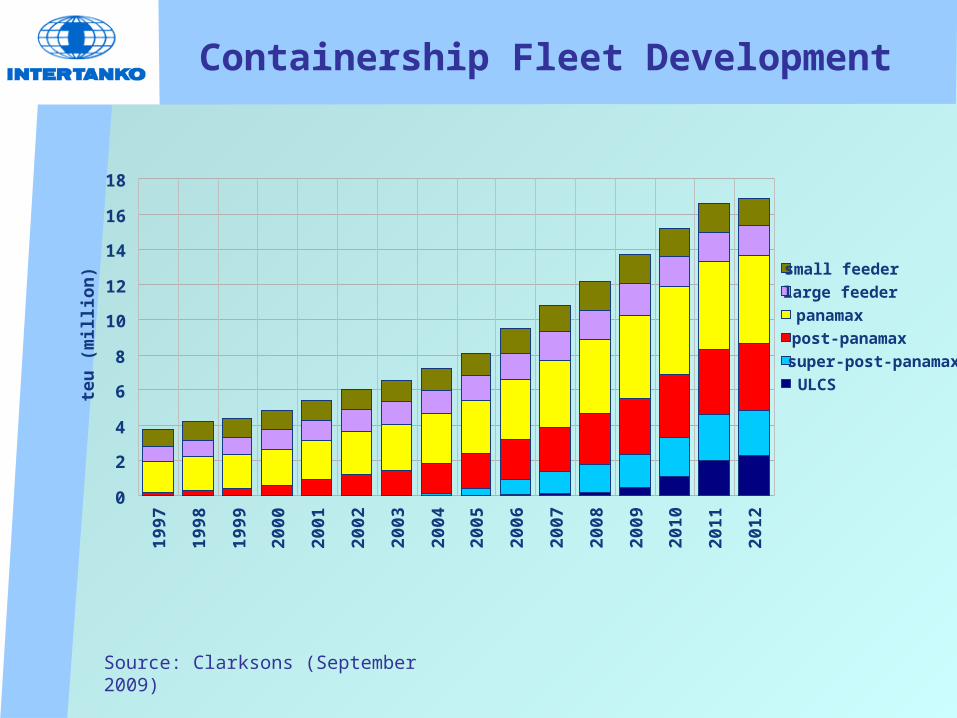
Containership Fleet Development
0
2
4
6
8
10
12
14
16
1819
97
1998
1999
2000
2001
2002
2003
2004
2005
2006
2007
2008
2009
2010
2011
2012
teu
(mill
ion)
small feederlarge feederpanamaxpost-panamaxsuper-post-panamaxULCS
Source: Clarksons (September 2009)
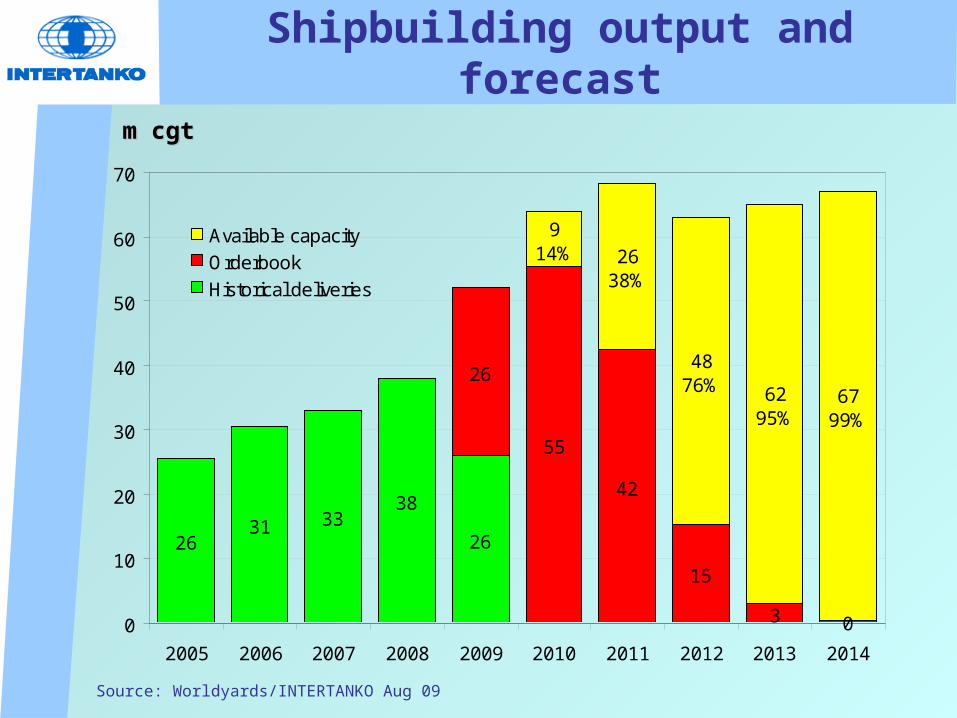
Shipbuilding output and forecast
Source: Worldyards/INTERTANKO Aug 09
m cgtm cgt
2631 33
38
26
26
55
42
15
3 0
914% 26
38%
4876% 62
95%67
99%
0
10
20
30
40
50
60
70
2005 2006 2007 2008 2009 2010 2011 2012 2013 2014
Available capacityOrderbookHistorical deliveries
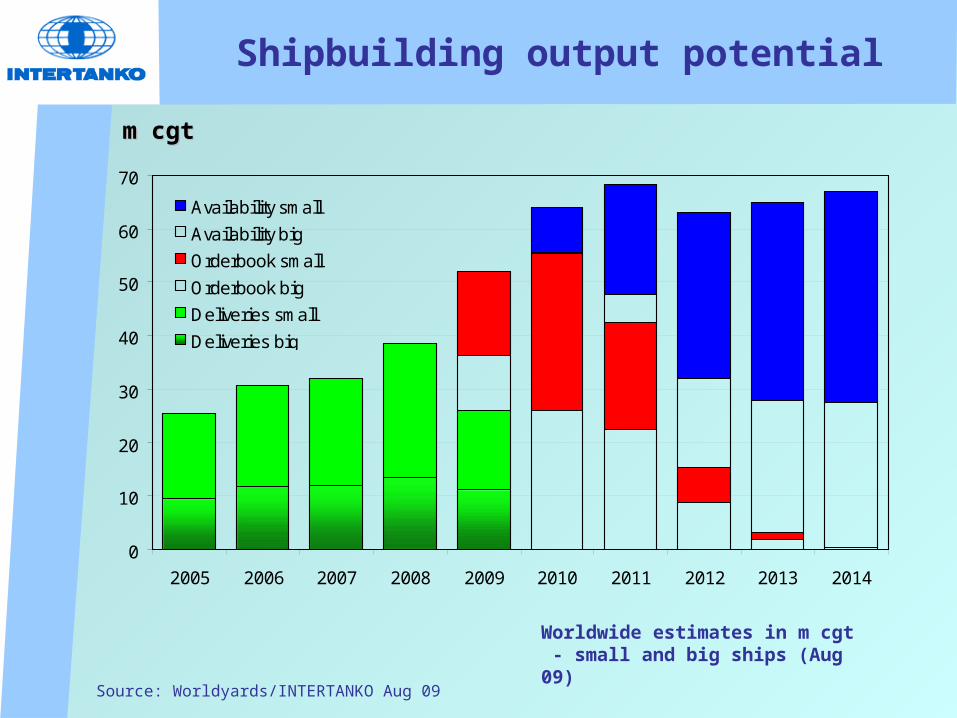
Shipbuilding output potential
Source: Worldyards/INTERTANKO Aug 09
m cgtm cgt
0
10
20
30
40
50
60
70
2005 2006 2007 2008 2009 2010 2011 2012 2013 2014
Availability smallAvailability bigOrderbook smallOrderbook bigDeliveries smallDeliveries big
Worldwide estimates in m cgt - small and big ships (Aug 09)
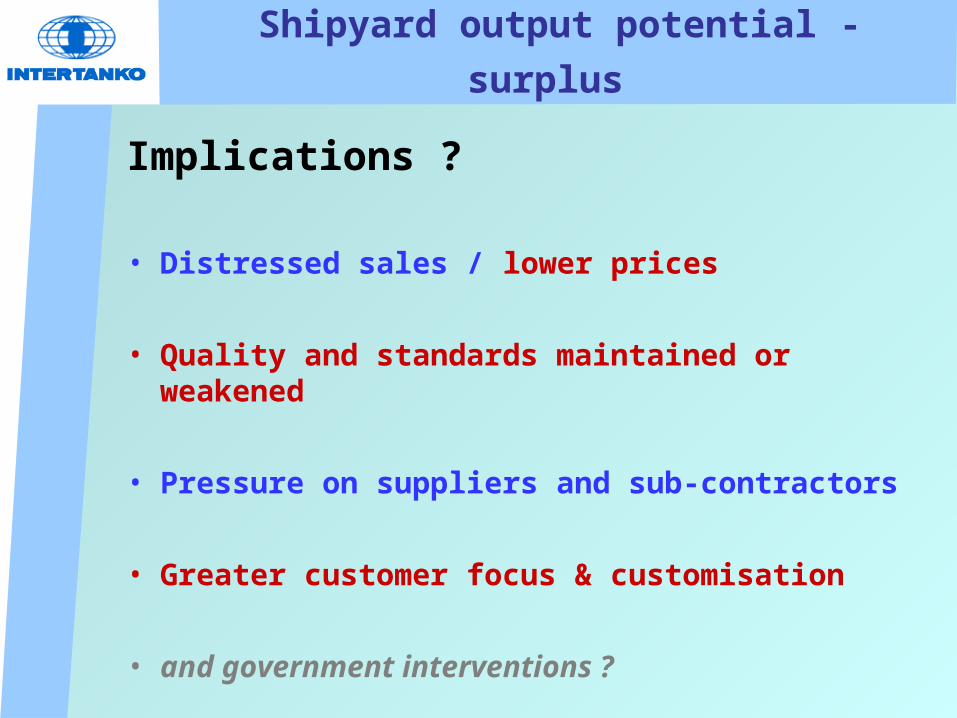
Shipyard output potential - surplus
Implications ?
• Distressed sales / lower prices
• Quality and standards maintained or weakened
• Pressure on suppliers and sub-contractors
• Greater customer focus & customisation
• and government interventions ?
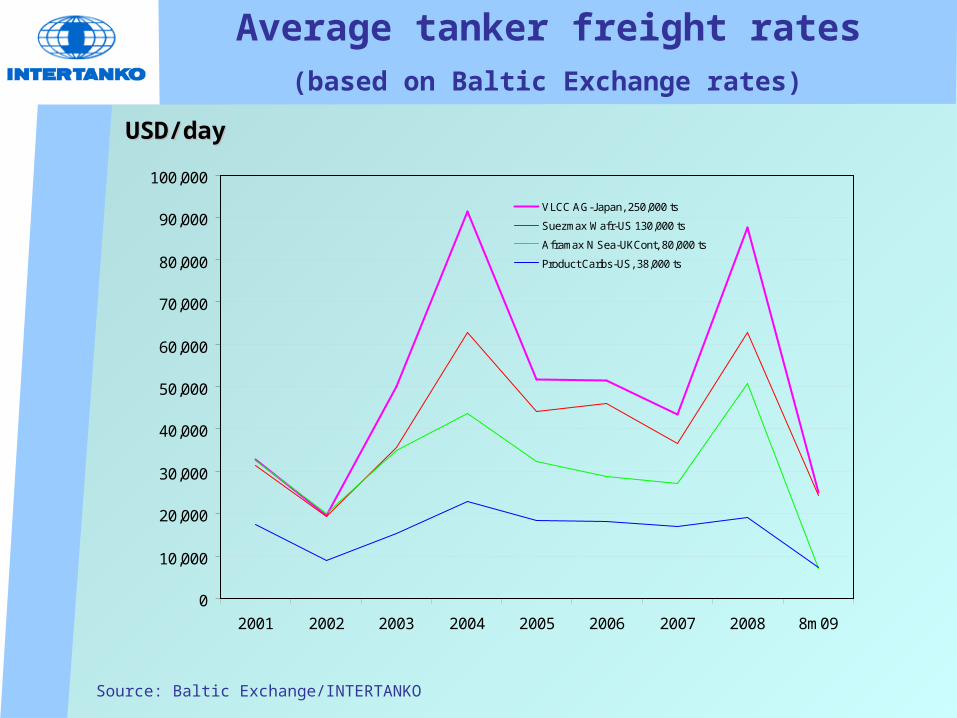
Source: Baltic Exchange/INTERTANKO
USD/dayUSD/day
Average tanker freight rates (based on Baltic Exchange rates)
0
10,000
20,000
30,000
40,000
50,000
60,000
70,000
80,000
90,000
100,000
2001 2002 2003 2004 2005 2006 2007 2008 8m09
VLCC AG-Japan, 250,000 ts
Suezmax Wafr-US 130,000 ts
Aframax N Sea-UKCont, 80,000 ts
Product Caribs-US, 38,000 ts
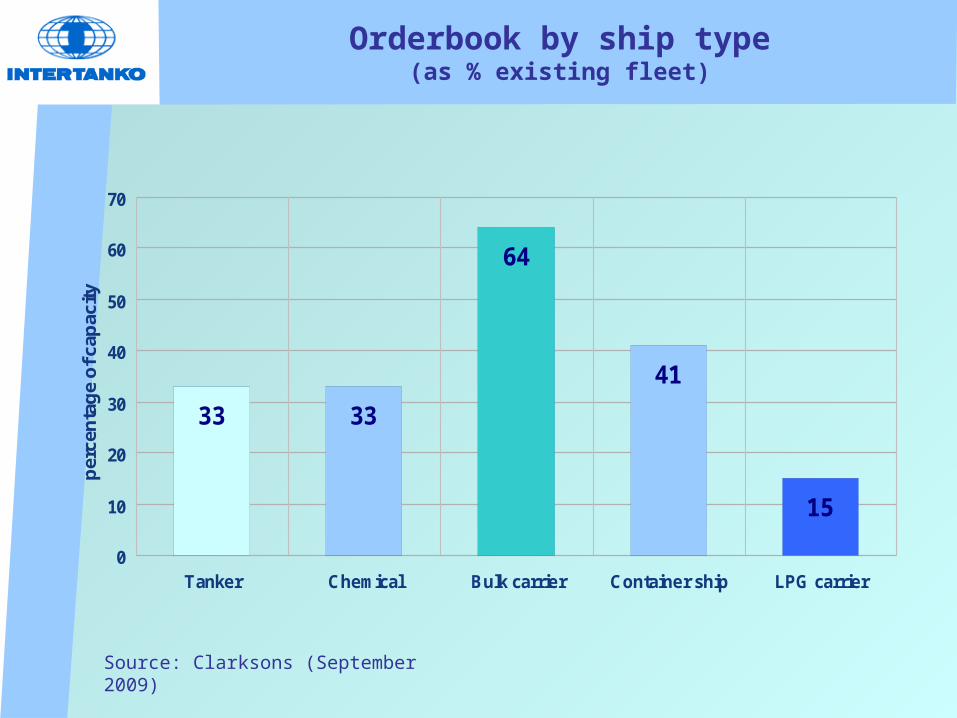
Orderbook by ship type(as % existing fleet)
Source: Clarksons (September 2009)
33
64
41
15
33
0
10
20
30
40
50
60
70
Tanker Chemical Bulk carrier Container ship LPG carrier
perc
enta
ge o
f cap
acity
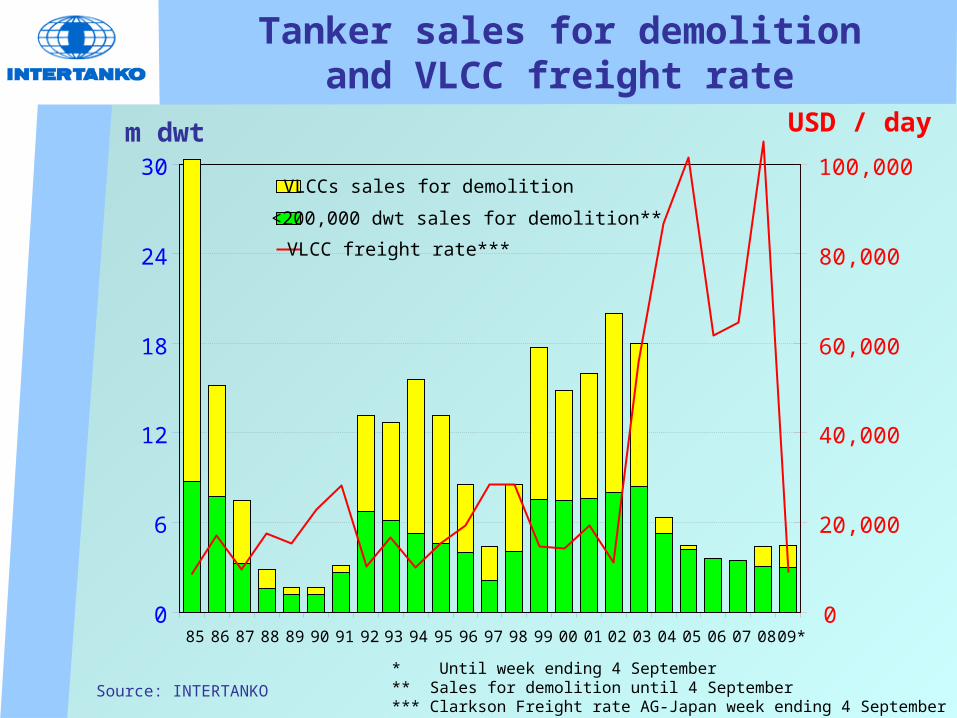
Tanker sales for demolitionand VLCC freight rate
Source: INTERTANKO
m dwt USD / day
* Until week ending 4 September** Sales for demolition until 4 September*** Clarkson Freight rate AG-Japan week ending 4 September
0
6
12
18
24
30
85 86 87 88 89 90 91 92 93 94 95 96 97 98 99 00 01 02 03 04 05 06 07 08 09*0
20,000
40,000
60,000
80,000
100,000VLCCs sales for demolition
<200,000 dwt sales for demolition**
VLCC freight rate***
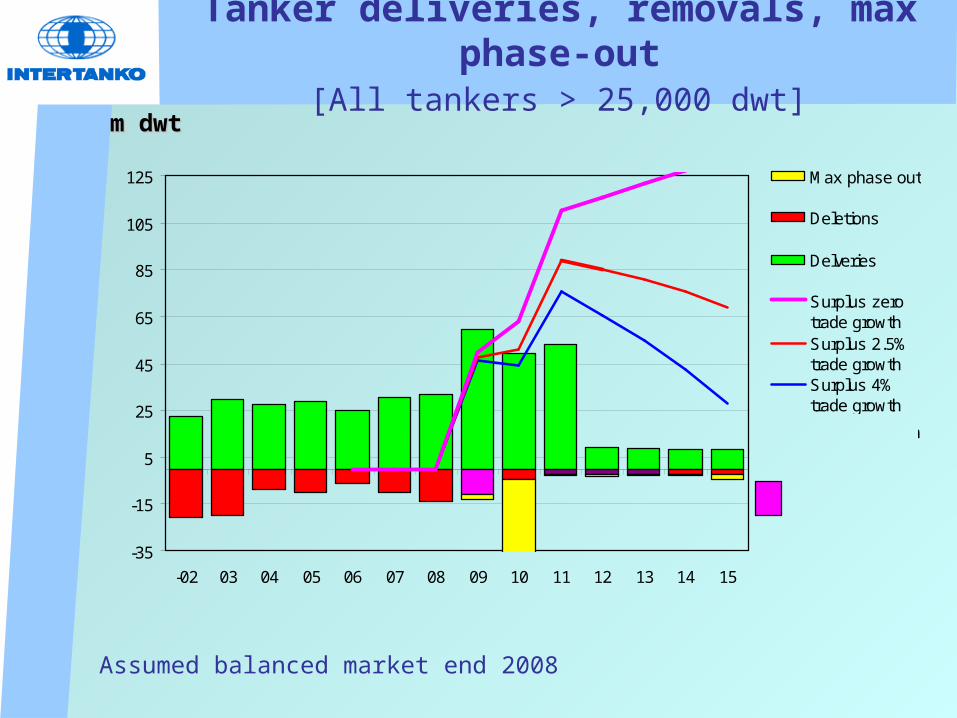
Tanker deliveries, removals, max phase-out [All tankers > 25,000 dwt]
m dwtm dwt
Assumed balanced market end 2008
-35
-15
5
25
45
65
85
105
125
-02 03 04 05 06 07 08 09 10 11 12 13 14 15
Max phase out
Deletions
Delveries
Surplus zerotrade growthSurplus 2.5%trade growthSurplus 4%trade growth
year
Removals in addition to phase out (conversions)
Minus 2% growth in 2009 and the above scenarios later
Lower Freight Rates & Fleet surpluses in ALL sectors – not just tankers
Implications ?
• Challenge to maintain quality and standards
• Challenge to meet the issues of the day
• and government interventions ?
Panel Discussion to follow on:- Financial Crisis, its prospect- Role and Responsibilities of Regulators, Class,
Shipbuilders, Repairers to Promote Maritime Safety and Quality Shipbuilding
Thank you 감사합니다For more information, please visit:
www.intertanko.com www.maritimefoundation.com
www.poseidonchallenge.comwww.shippingfacts.com