Embed Size (px)
Citation preview
Slide 1
Flexibility for in-Space PropulsionTechnology Investment
Jonathan Battat
ESD.71 Engineering Systems Analysis for Design
Application Portfolio
Slide 2
Background
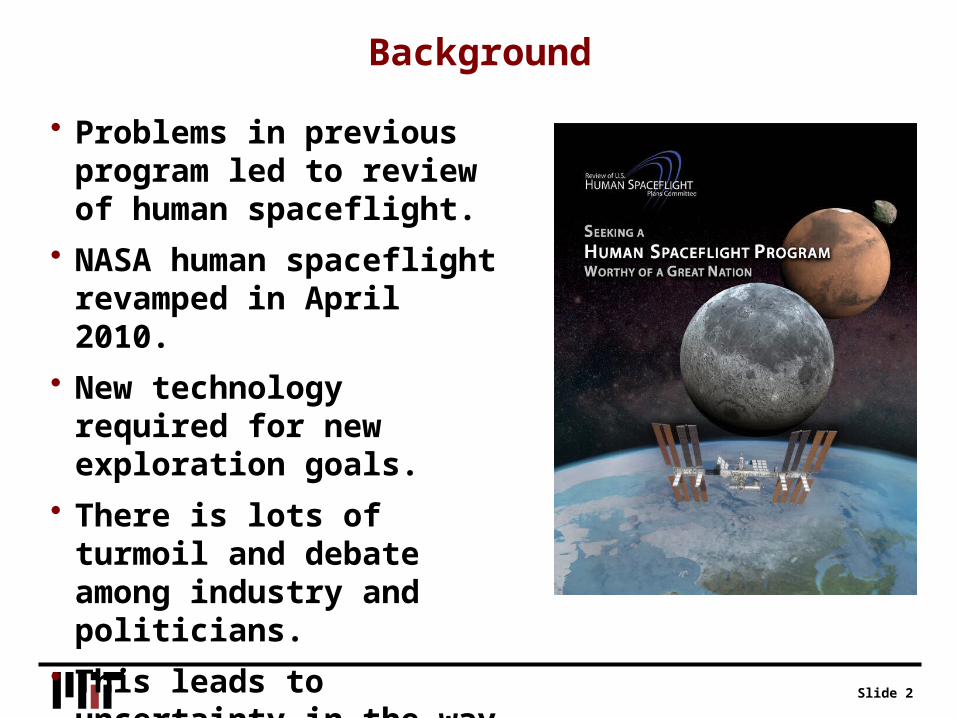
• Problems in previous program led to review of human spaceflight.
• NASA human spaceflight revamped in April 2010.
• New technology required for new exploration goals.
• There is lots of turmoil and debate among industry and politicians.
• This leads to uncertainty in the way forward…
Slide 3
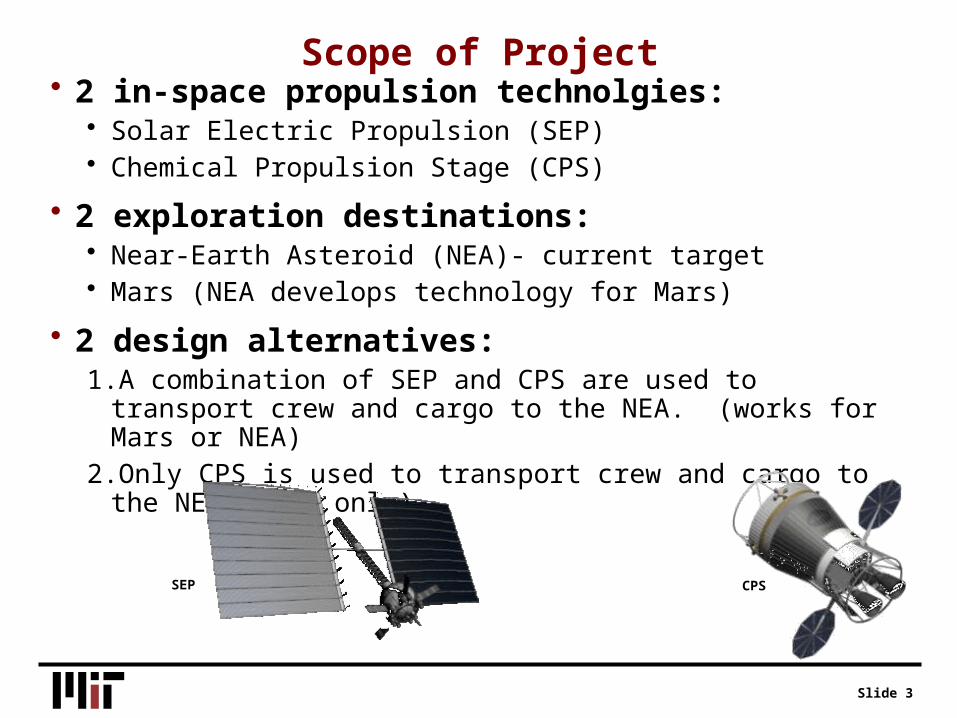
Scope of Project• 2 in-space propulsion technolgies:
• Solar Electric Propulsion (SEP)• Chemical Propulsion Stage (CPS)
• 2 exploration destinations:• Near-Earth Asteroid (NEA)- current target• Mars (NEA develops technology for Mars)
• 2 design alternatives:1. A combination of SEP and CPS are used to transport crew and cargo to the NEA.
(works for Mars or NEA)2. Only CPS is used to transport crew and cargo to the NEA. (NEA only)
SEP CPS
Slide 4
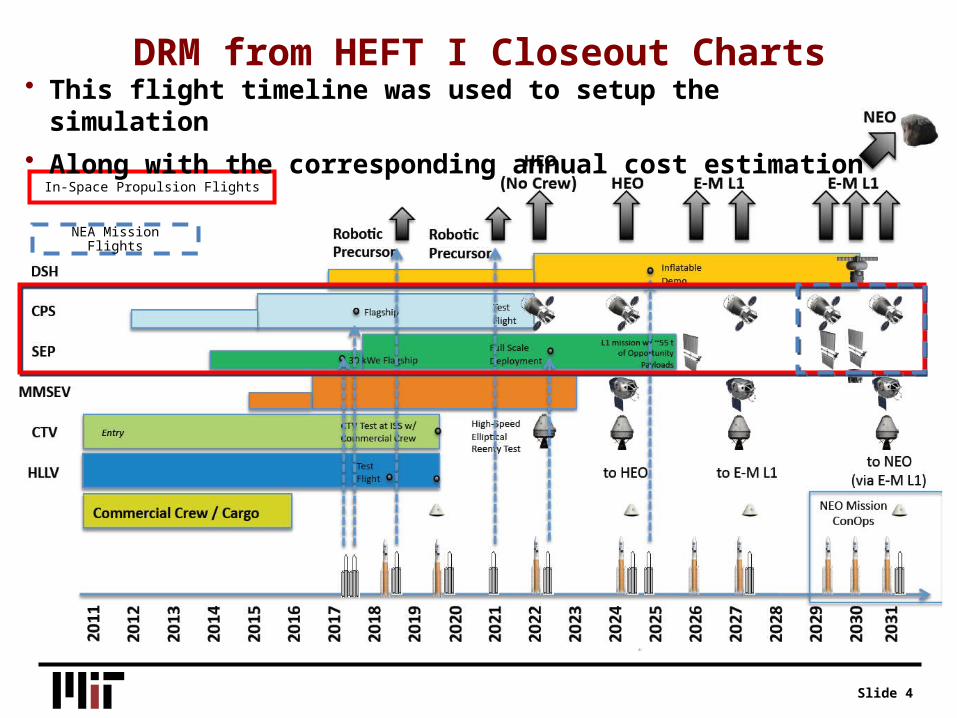
DRM from HEFT I Closeout Charts
In-Space Propulsion Flights
NEA Mission Flights
• This flight timeline was used to setup the simulation
• Along with the corresponding annual cost estimation
Slide 5
Simulation Setup
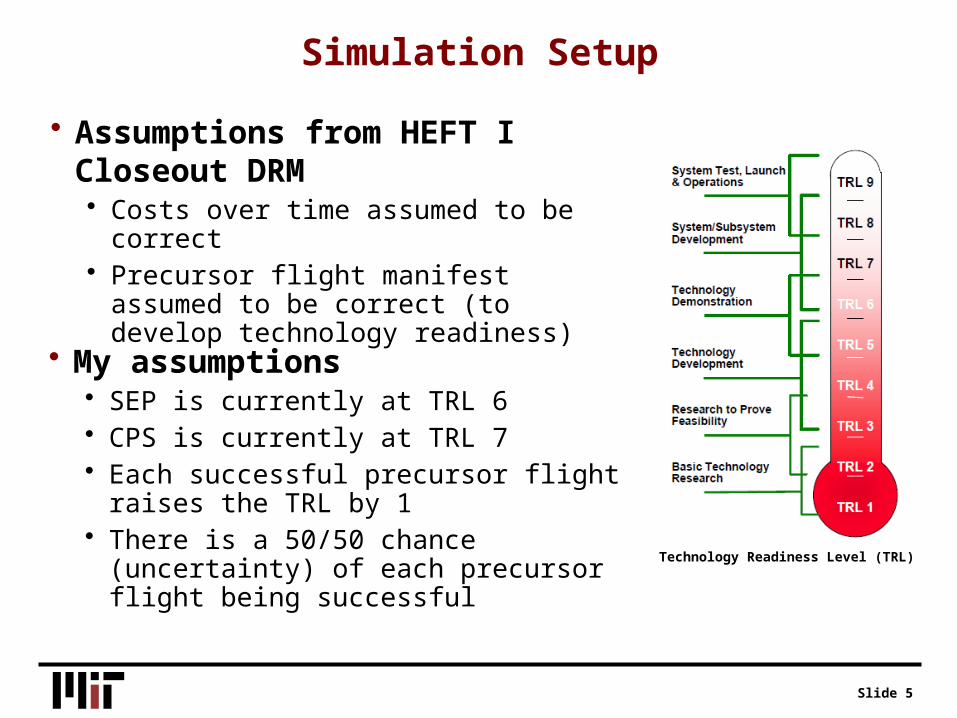
• Assumptions from HEFT I Closeout DRM• Costs over time assumed to be correct• Precursor flight manifest assumed to be correct (to
develop technology readiness)
• My assumptions• SEP is currently at TRL 6• CPS is currently at TRL 7• Each successful precursor flight raises the TRL by 1• There is a 50/50 chance (uncertainty) of each
precursor flight being successfulTechnology Readiness Level (TRL)
Slide 6
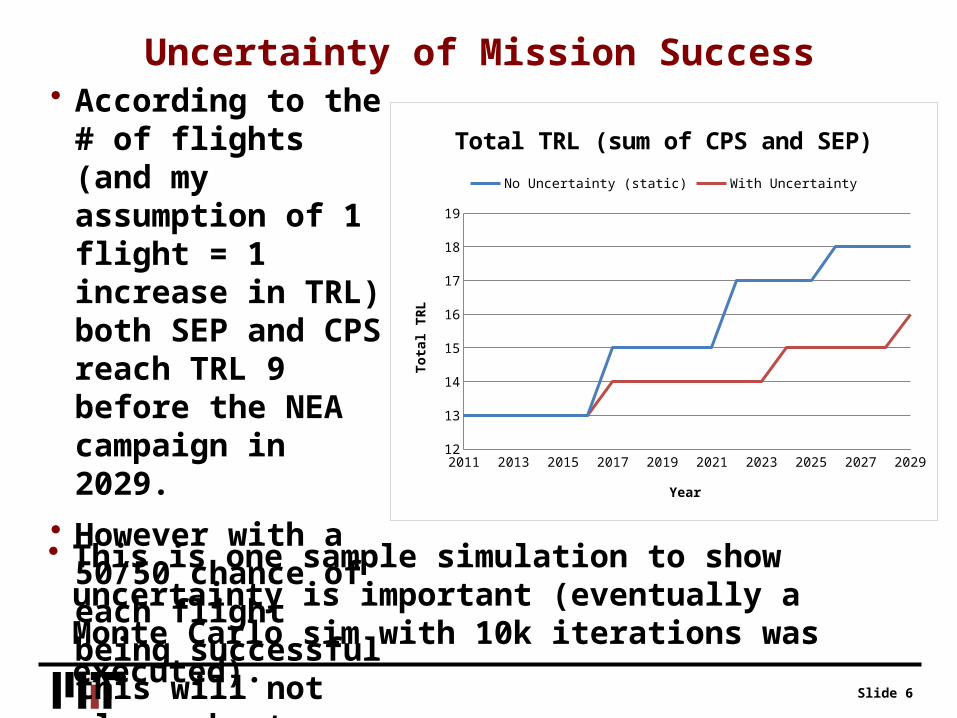
Uncertainty of Mission Success• According to the # of
flights (and my assumption of 1 flight = 1 increase in TRL) both SEP and CPS reach TRL 9 before the NEA campaign in 2029.
• However with a 50/50 chance of each flight being successful this will not always be true.
2011 2013 2015 2017 2019 2021 2023 2025 2027 202912
13
14
15
16
17
18
19
Total TRL (sum of CPS and SEP)No Uncertainty (static) With Uncertainty
Year
Tota
l TRL
• This is one sample simulation to show uncertainty is important (eventually a Monte Carlo sim with 10k iterations was executed).
Slide 7
Measure of Effectiveness
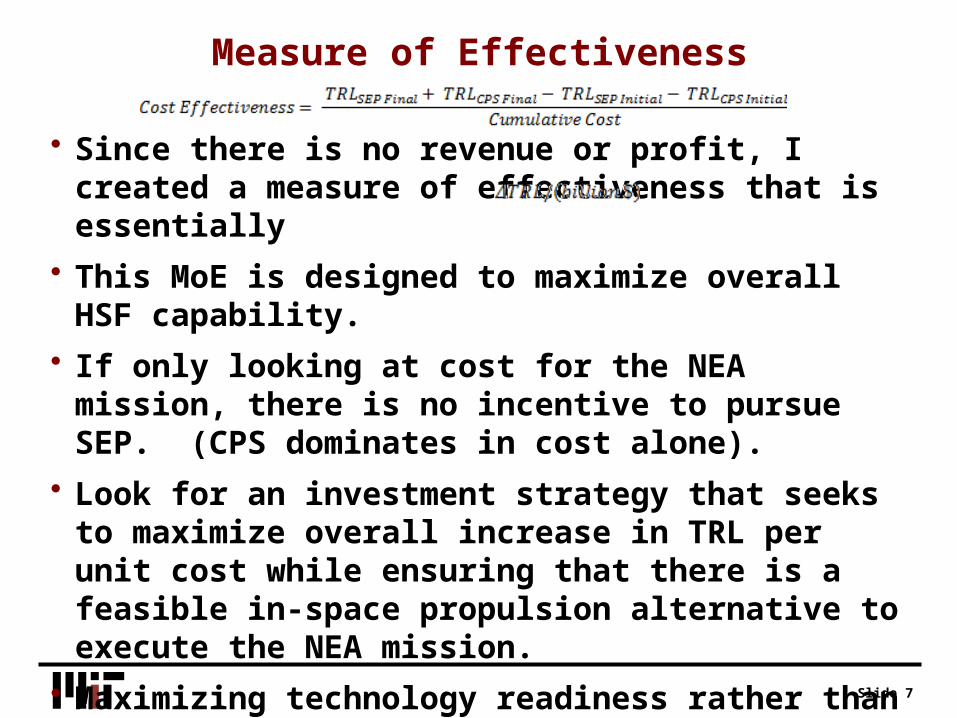
• Since there is no revenue or profit, I created a measure of effectiveness that is essentially
• This MoE is designed to maximize overall HSF capability.
• If only looking at cost for the NEA mission, there is no incentive to pursue SEP. (CPS dominates in cost alone).
• Look for an investment strategy that seeks to maximize overall increase in TRL per unit cost while ensuring that there is a feasible in-space propulsion alternative to execute the NEA mission.
• Maximizing technology readiness rather than minimizing cost can also be seen as a form of flexibility given the uncertainty of mission goals (which have already changed in the past).
Slide 8
Decision Rules
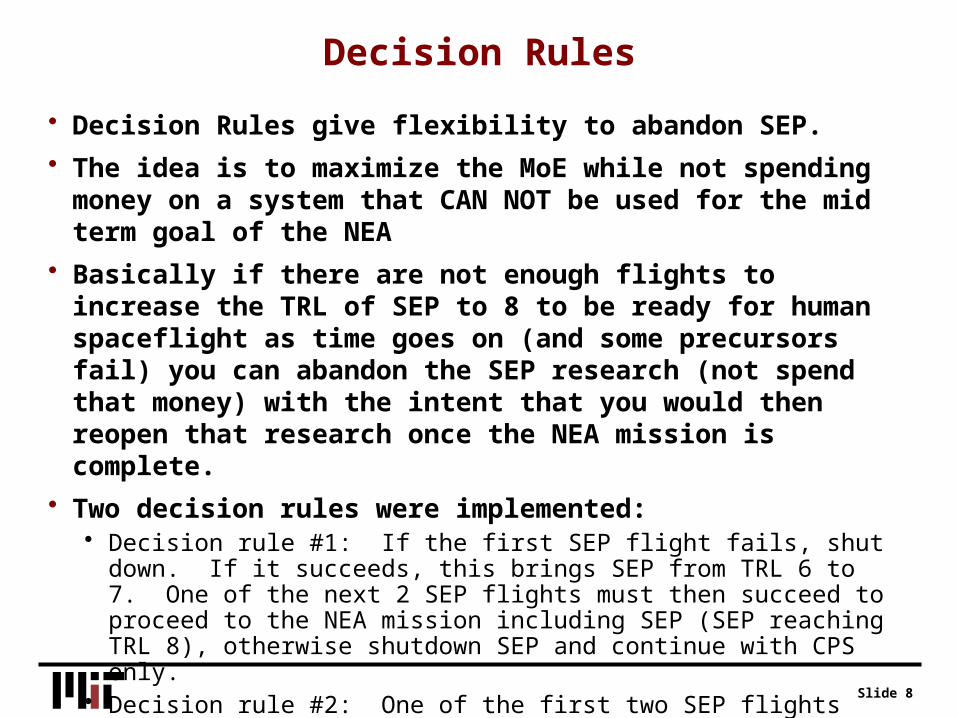
• Decision Rules give flexibility to abandon SEP.
• The idea is to maximize the MoE while not spending money on a system that CAN NOT be used for the mid term goal of the NEA
• Basically if there are not enough flights to increase the TRL of SEP to 8 to be ready for human spaceflight as time goes on (and some precursors fail) you can abandon the SEP research (not spend that money) with the intent that you would then reopen that research once the NEA mission is complete.
• Two decision rules were implemented:• Decision rule #1: If the first SEP flight fails, shut down. If it succeeds, this brings SEP from
TRL 6 to 7. One of the next 2 SEP flights must then succeed to proceed to the NEA mission including SEP (SEP reaching TRL 8), otherwise shutdown SEP and continue with CPS only.
• Decision rule #2: One of the first two SEP flights must succeed. Only one or the other may fail. This will make SEP at least a TRL 7 (could be 8). However the next flight must then succeed to achieve TRL 8 (or 9) before the NEA mission. If not, then shut down SEP and continue with CPS only.
Slide 9
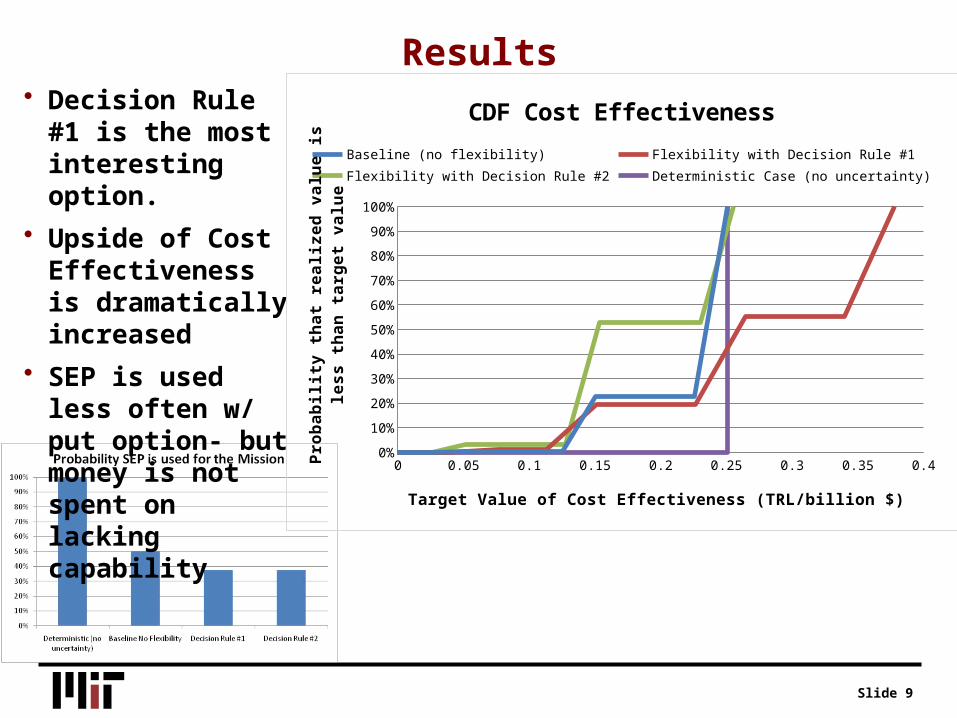
Results• Decision Rule #1 is the
most interesting option.
• Upside of Cost Effectiveness is dramatically increased
• SEP is used less often w/ put option- but money is not spent on lacking capability
0 0.05 0.1 0.15 0.2 0.25 0.3 0.35 0.40%
10%
20%
30%
40%
50%
60%
70%
80%
90%
100%
CDF Cost EffectivenessBaseline (no flexibility) Flexibility with Decision Rule #1Flexibility with Decision Rule #2 Deterministic Case (no uncertainty)
Target Value of Cost Effectiveness (TRL/billion $)
Prob
abili
ty t
hat
real
ized
val
ue is
less
tha
n ta
rget
va
lue
Slide 10
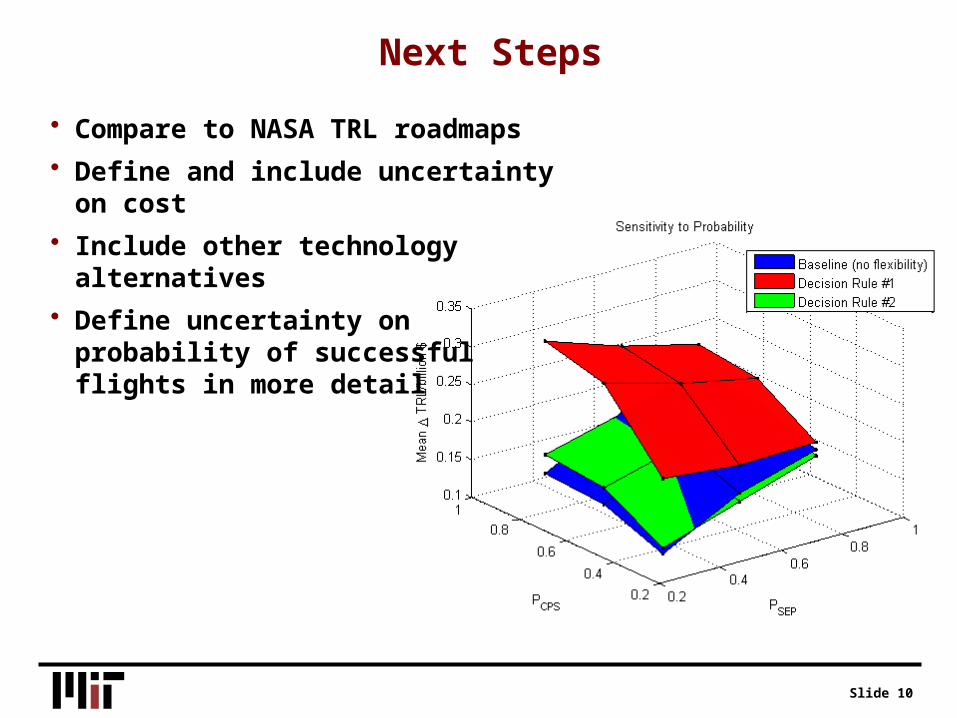
Next Steps
• Compare to NASA TRL roadmaps
• Define and include uncertainty on cost
• Include other technology alternatives
• Define uncertainty on probability of successful flights in more detail
Slide 11
Thank You!
• Thanks for listening.
• Special thanks to Prof. de Neufville and Michel for taking time to discuss my project.