Embed Size (px)
Citation preview
Slide #1
Emerging Remote Sensing Data, Systems, and Tools to Support
PEM Applications for Resource Management
Olaf Niemann
Department of Geography
University of Victoria
Slide #2
Introduction
• Predictive Ecosystem Mapping (PEM) will require data input from a variety of sources depending on the driving models and the potential use.
• Remotely sensed data sets represent a source of information for inventory of the more dynamic terrain related aspects .
• The products that can be derived from this source of data are wide ranging and can cover a number of potential applications within the context of PEM.
Slide #3
Introduction
• This presentation will touch on a number of sources of remotely sensed data that are available and readily available for use.
• It will also deal with some of the tools that are currently available that may benefit this mapping approach.
Slide #4
Remote Sensing
• Remotely sensed data is generally divided into three main groups:
• Optical (normally falls within the 450 nanometre and 2500 nanometre range),
• Thermal (from 10000 nanometres to 15000 nanometres), and• Microwave (from 5 cm to 15 cm).
• As the microwave data, while plentiful, are not as easily applied to terrestrial studies this talk will focus on optical and to a lesser extent thermal data.
Slide #5
Optical
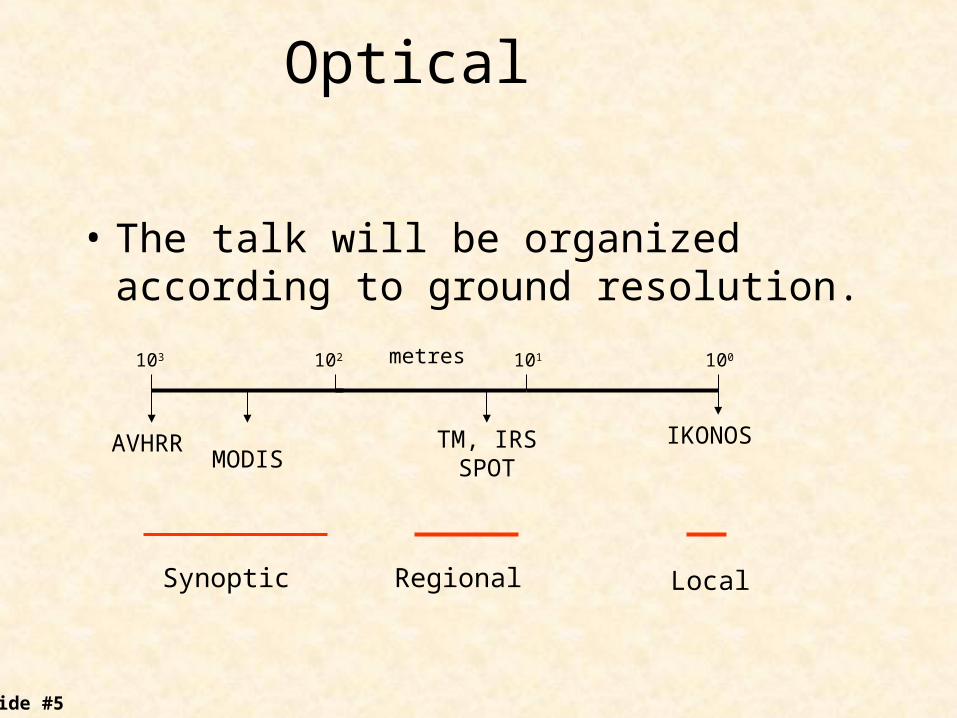
• The talk will be organized according to ground resolution.
metres103 102 101 100
AVHRRMODIS
TM, IRSSPOT
IKONOS
Synoptic Regional Local
Slide #6
Synoptic
• Currently a number of satellites sensors are in service supplying data for synoptic scale studies. These include:
• AVHRR (Advanced Very High Resolution Radiometer) • SeaWiFS (Sea-viewing Wide Field of view Sensor)
• MODIS (Moderate Resolution Imaging Spectrometer)
Slide #7
AVHRR
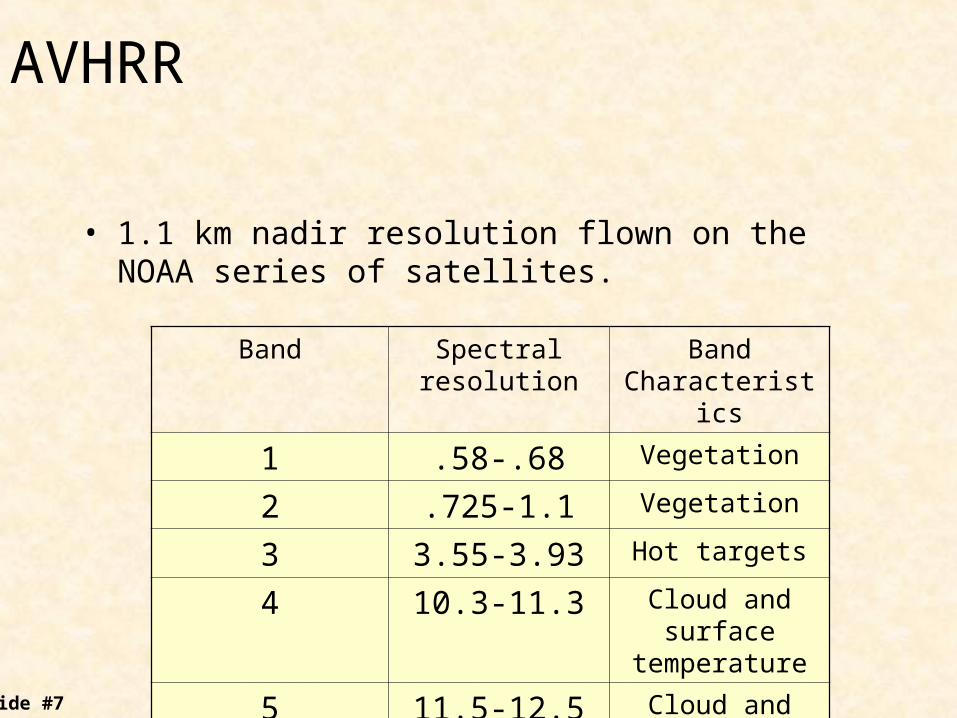
• 1.1 km nadir resolution flown on the NOAA series of satellites.
Band Spectral resolution Band Characteristics
1 .58-.68 Vegetation
2 .725-1.1 Vegetation
3 3.55-3.93 Hot targets
4 10.3-11.3 Cloud and surface temperature
5 11.5-12.5 Cloud and surface temperature
Slide #8
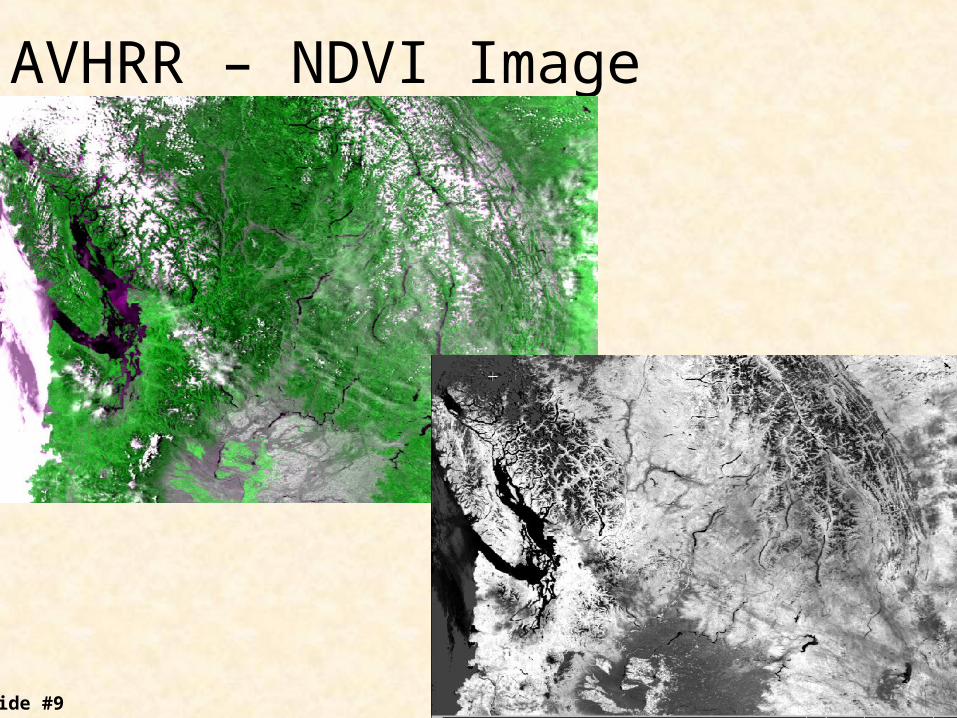
AVHRR
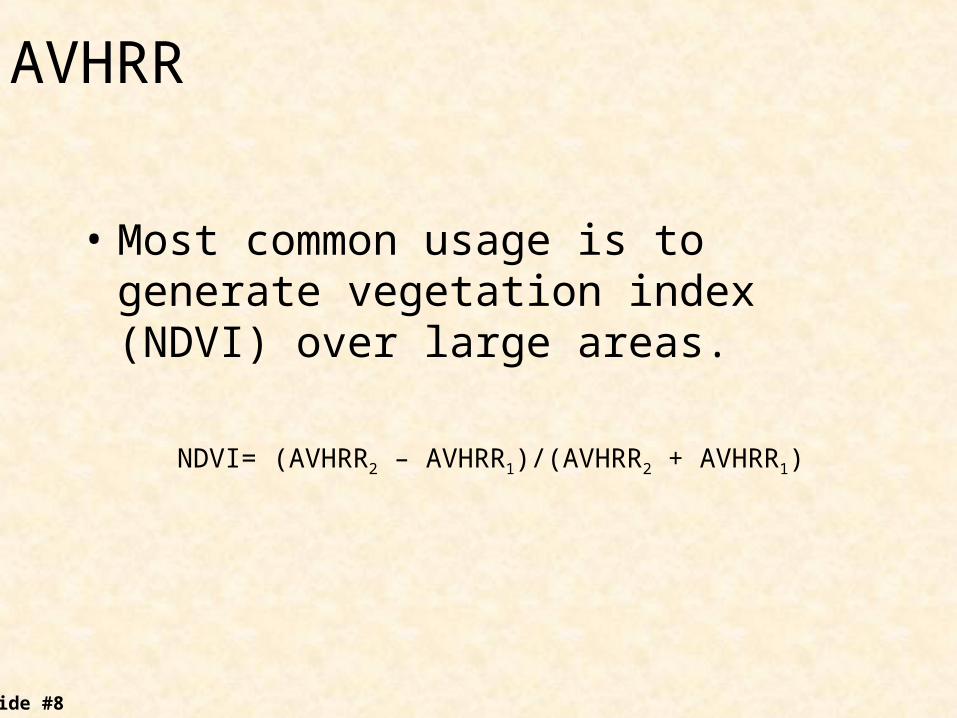
• Most common usage is to generate vegetation index (NDVI) over large areas.
NDVI= (AVHRR2 – AVHRR1)/(AVHRR2 + AVHRR1)
Slide #9
AVHRR – NDVI Image
Slide #10
MODIS
• Part of the NASA EOS (Earth Observing System) Terra satellite.
• Sun synchronous orbit at 705 km.
• 36 channels with a spatial resolution ranging from 250 metres to 1 km.
Slide #11
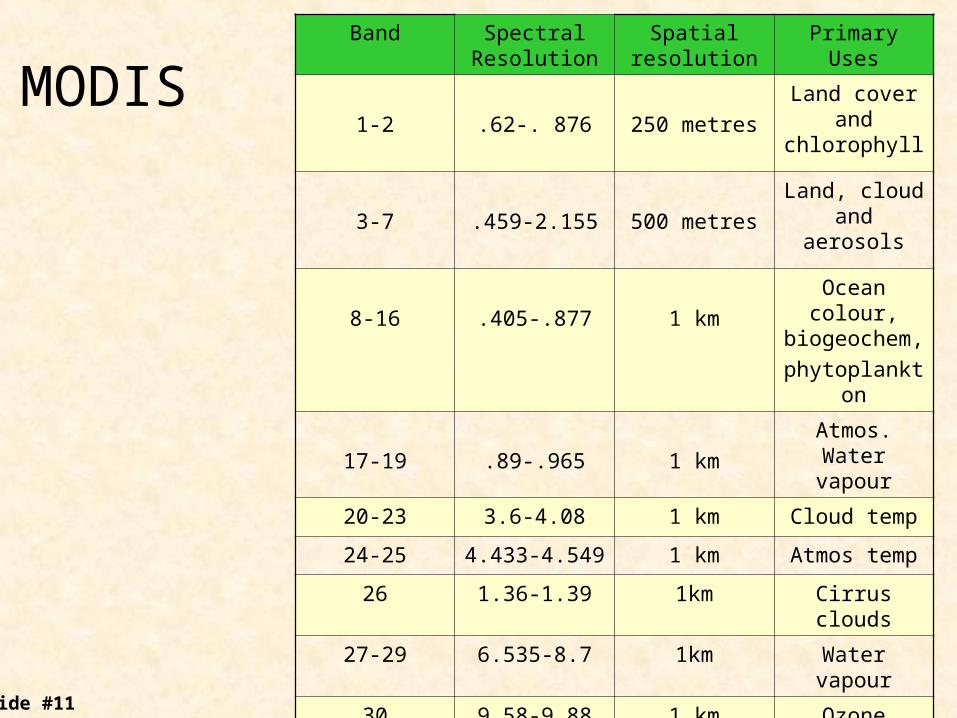
MODISBand Spectral
ResolutionSpatial
resolutionPrimary Uses
1-2 .62-. 876 250 metres
Land cover and chlorophyll
3-7 .459-2.155 500 metres
Land, cloud and aerosols
8-16 .405-.877 1 km
Ocean colour, biogeochem,
phytoplankton
17-19 .89-.965 1 km
Atmos. Water vapour
20-23 3.6-4.08 1 km Cloud temp
24-25 4.433-4.549 1 km Atmos temp
26 1.36-1.39 1km Cirrus clouds
27-29 6.535-8.7 1km Water vapour
30 9.58-9.88 1 km Ozone
31-32 10.780-11.280 1 km Cloud temp
33-36 13.185-14.385 1 km Cloud top altitude
Slide #12
MODIS
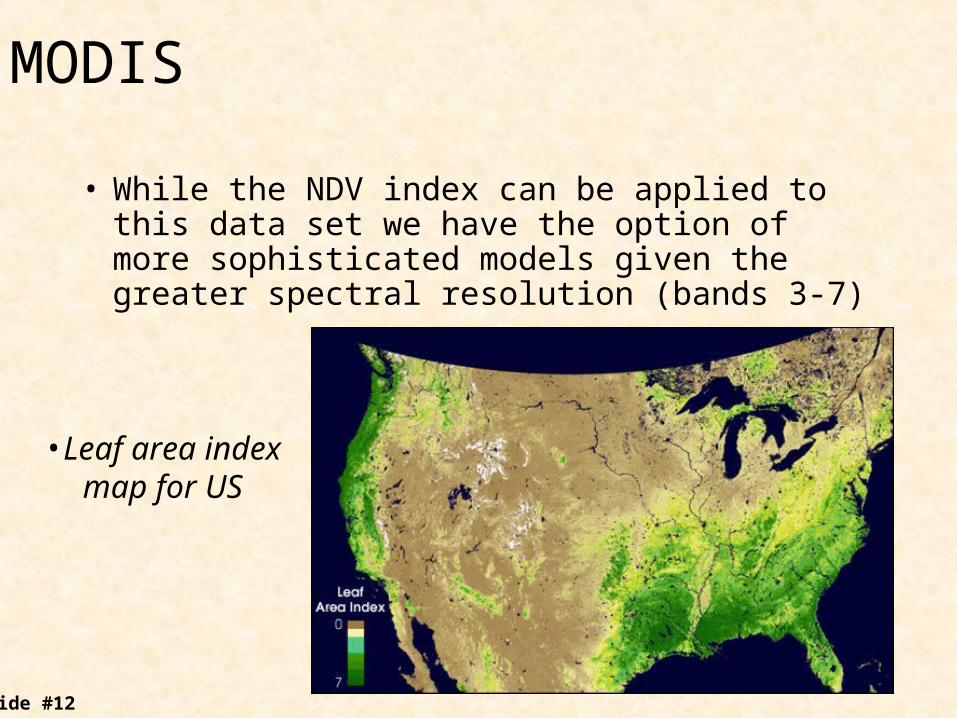
• While the NDV index can be applied to this data set we have the option of more sophisticated models given the greater spectral resolution (bands 3-7)
•Leaf area index map for US
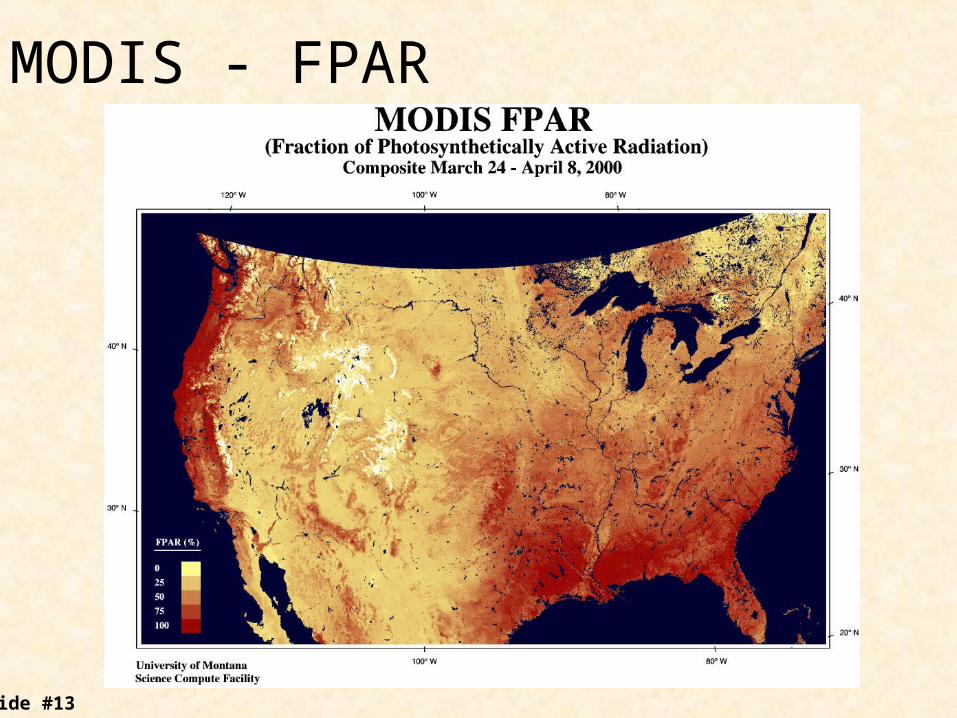
Slide #13
MODIS - FPAR
Slide #14
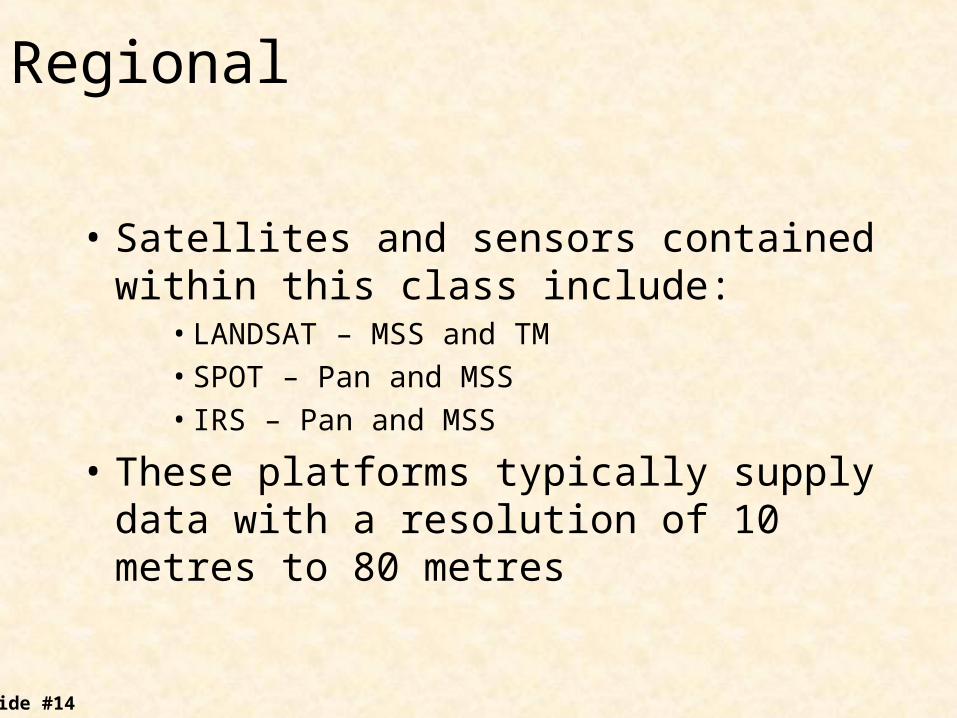
Regional
• Satellites and sensors contained within this class include:
• LANDSAT – MSS and TM
• SPOT – Pan and MSS
• IRS – Pan and MSS
• These platforms typically supply data with a resolution of 10 metres to 80 metres
Slide #15
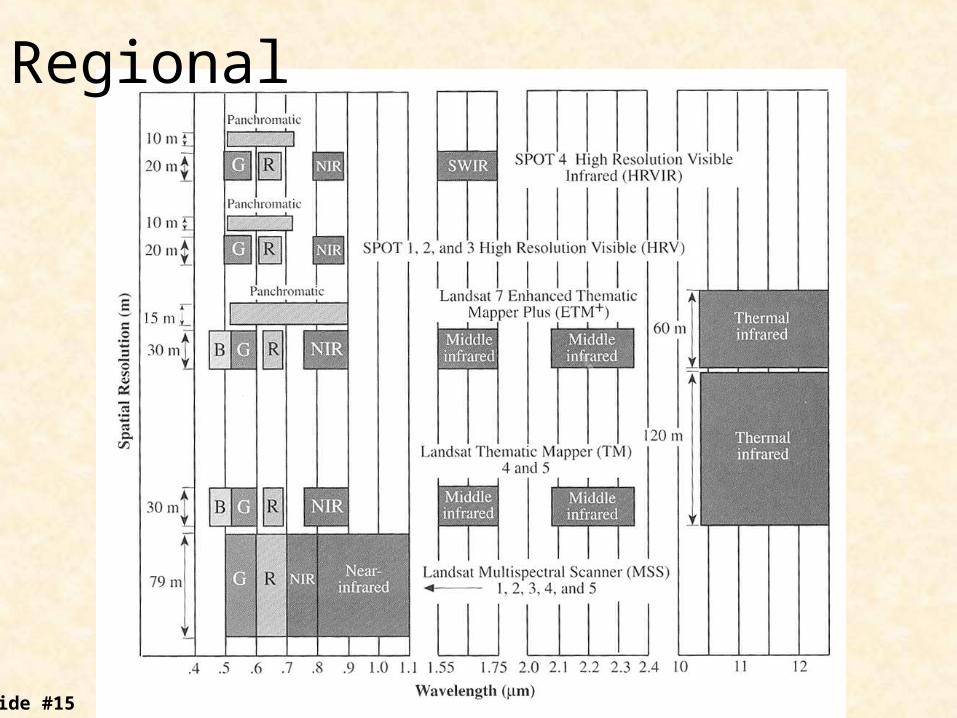
Regional
Slide #16
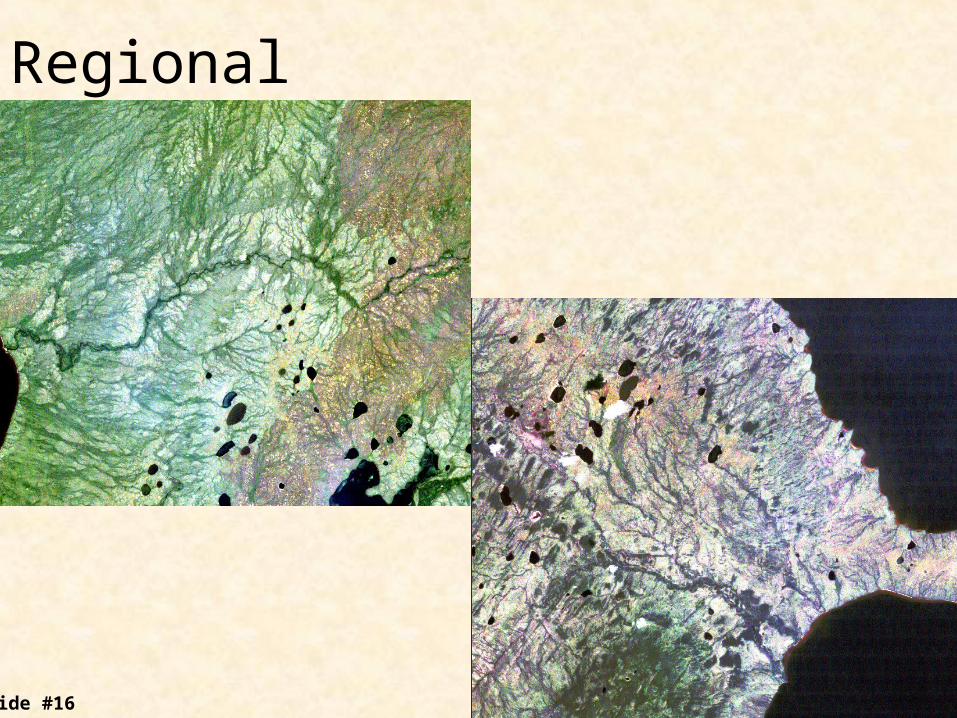
Regional
Slide #17
Regional
• The complexity of the information that can be extracted from the data obtained from these satellites through modeling ( i.e. indices, classifications, etc). increases substantially from the synoptic data.
• We are able to discriminate the various reflective components, that is forest canopy, understory, and background reflectance) much more effectively than with the synoptic data.
Slide #18
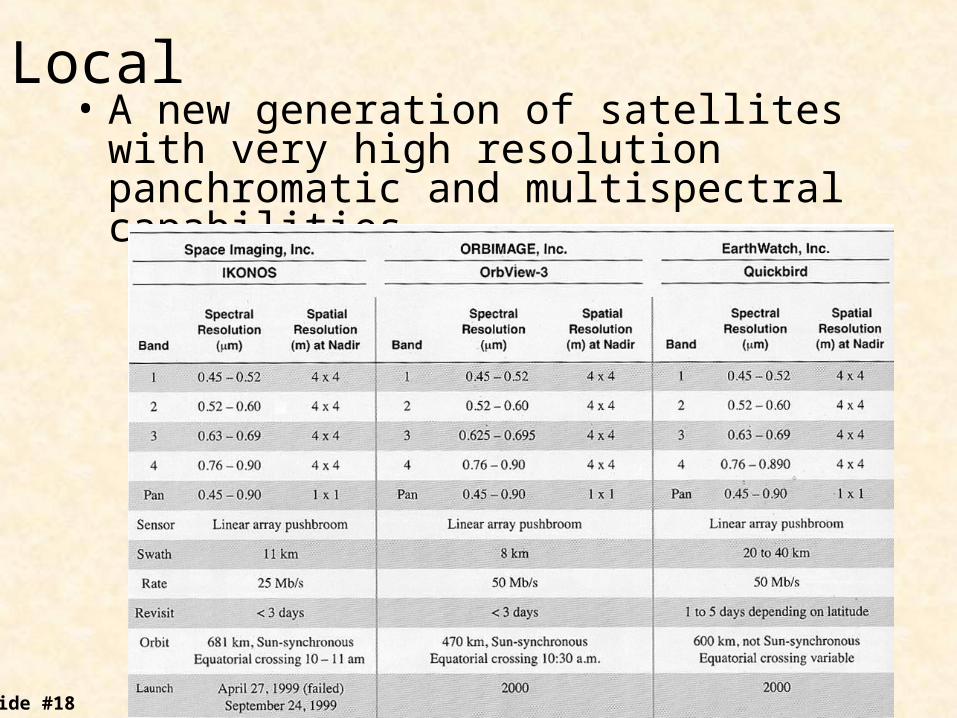
Local• A new generation of satellites with very
high resolution panchromatic and multispectral capabilities.
Slide #19
Local
• High resolution gives us the opportunity to assess the landscape to a much greater level than has been previously experienced.
Slide #20
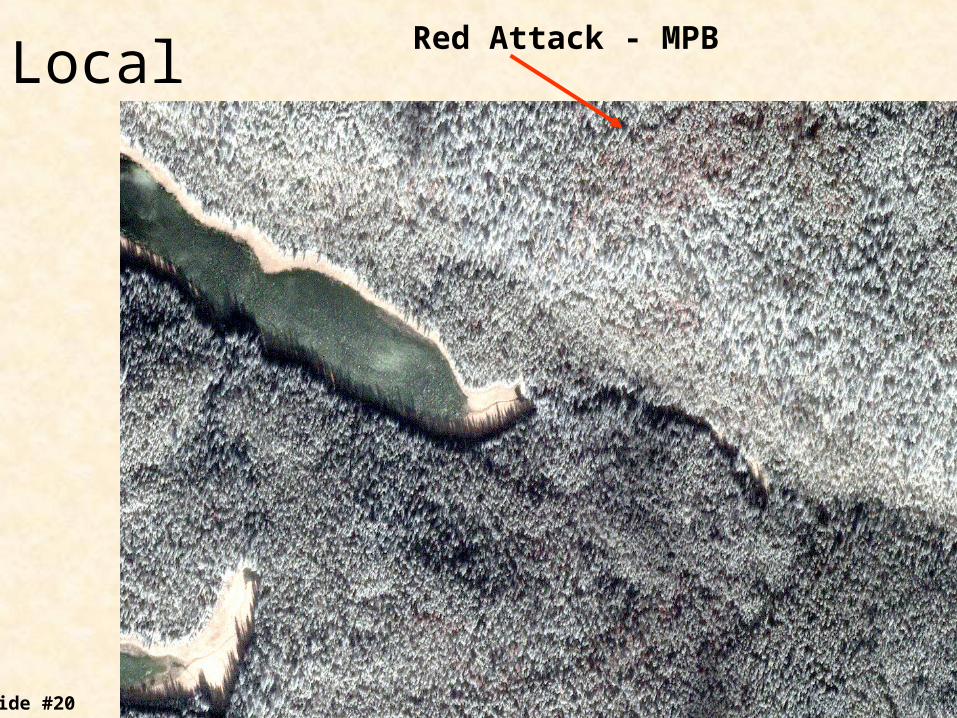
LocalRed Attack - MPB
Slide #21
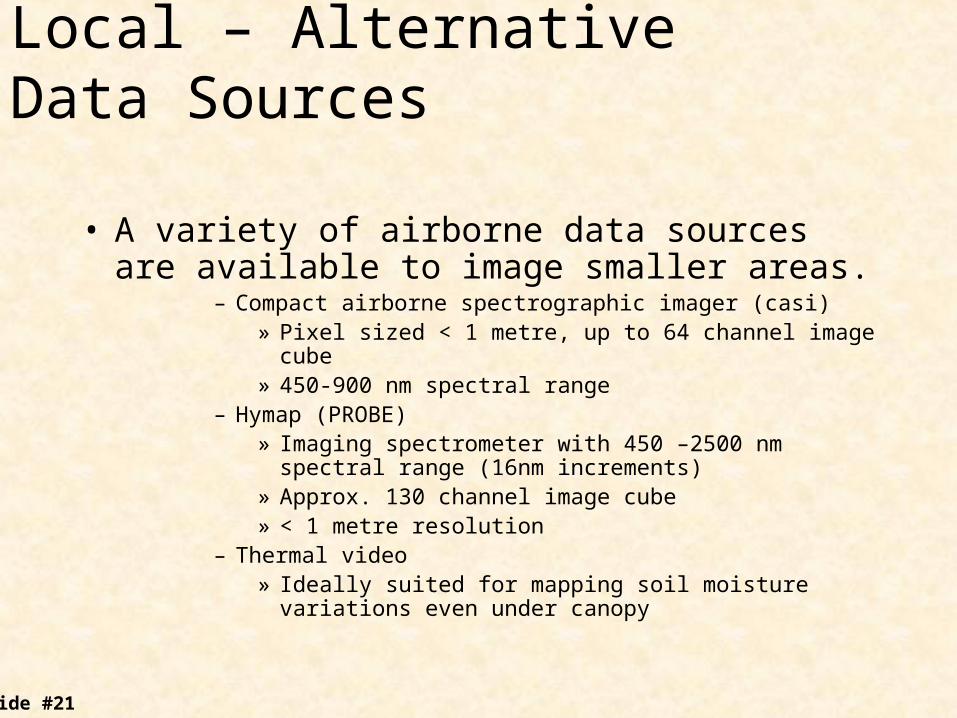
Local – Alternative Data Sources
• A variety of airborne data sources are available to image smaller areas.
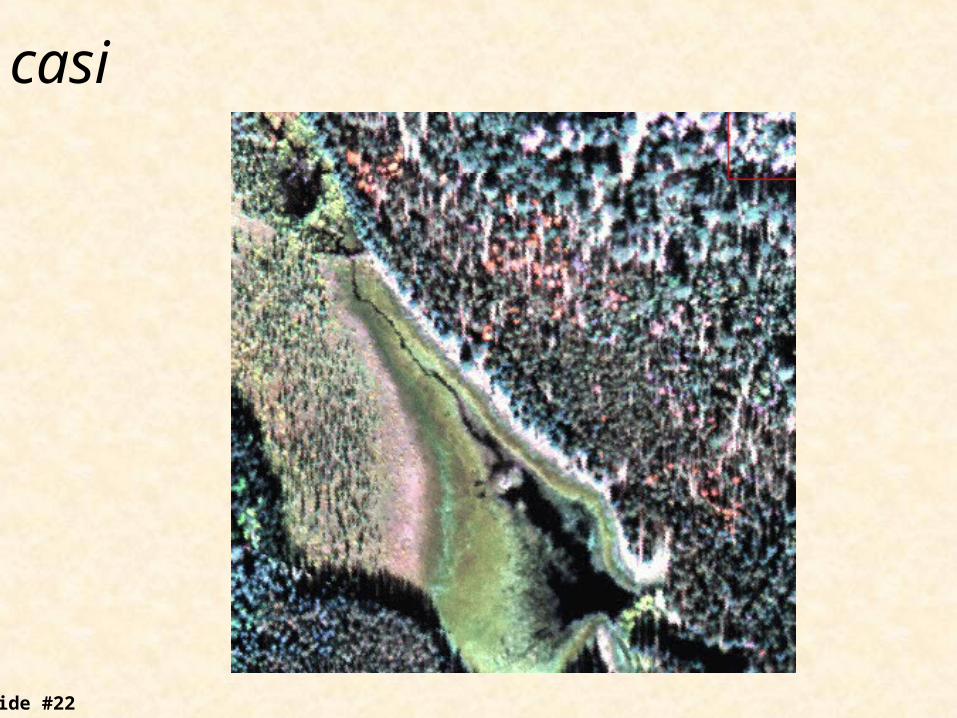
– Compact airborne spectrographic imager (casi)» Pixel sized < 1 metre, up to 64 channel image cube» 450-900 nm spectral range
– Hymap (PROBE) » Imaging spectrometer with 450 –2500 nm spectral range
(16nm increments)» Approx. 130 channel image cube» < 1 metre resolution
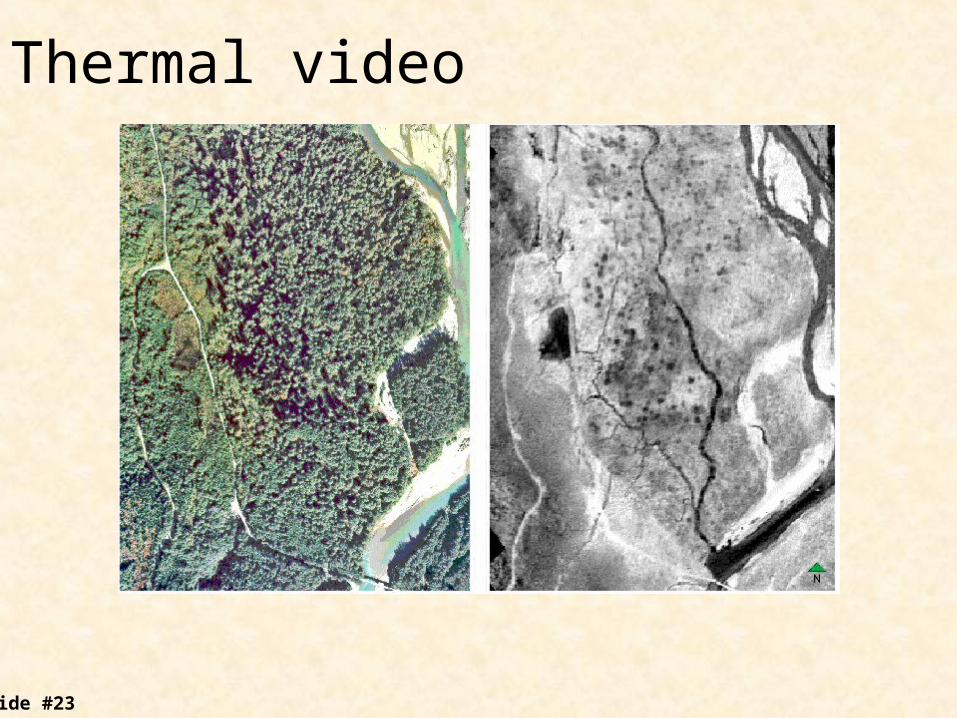
– Thermal video» Ideally suited for mapping soil moisture variations even
under canopy
Slide #22
casi
Slide #23
Thermal video
Slide #24
Research Issues
• Most of the vegetation indices were developed in climatic regimes that yield a very good separation between over- and understory and soil reflective components.
• Unfortunately in many areas of the west coast environments the understory is as green as the overstory and as continuous. As a result the NDVI values are flat and unresponsive to changes in forest cover.
Slide #25
Research Issues
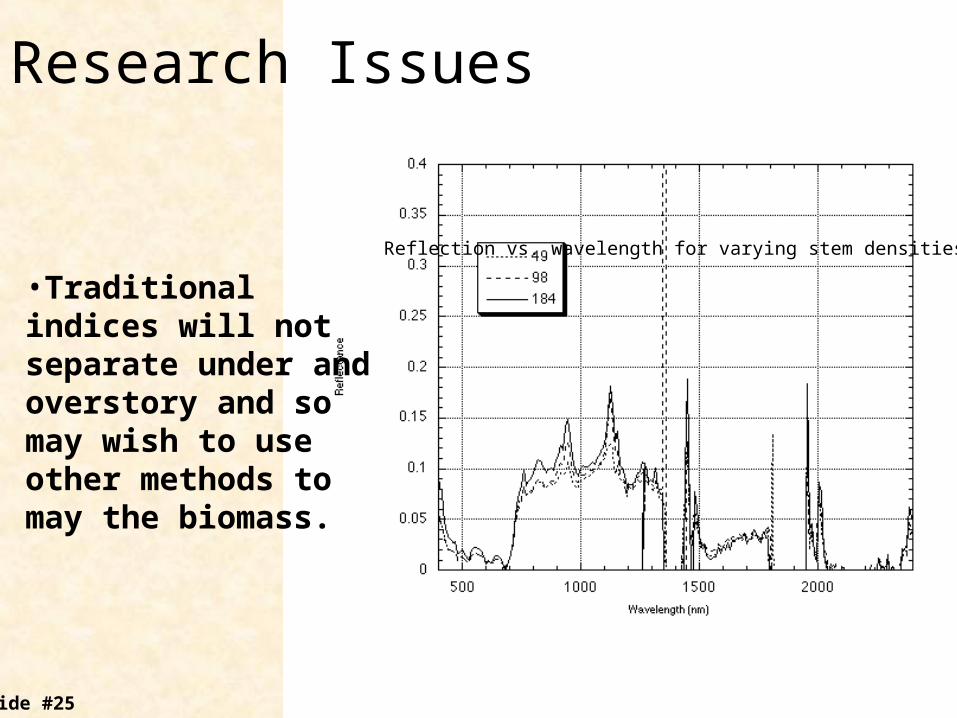
•Traditional indices will not separate under and overstory and so may wish to use other methods to may the biomass.
Reflection vs. wavelength for varying stem densities
Slide #26
Research Issues – estimation of radiation reaching the ground
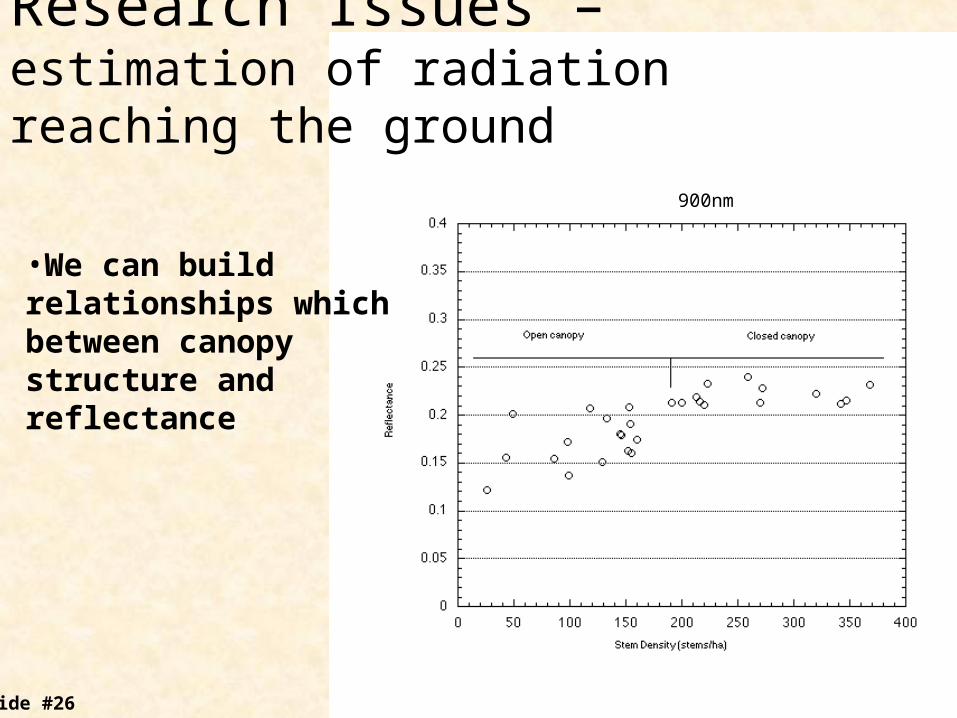
900nm
•We can build relationships which between canopy structure and reflectance
Slide #27
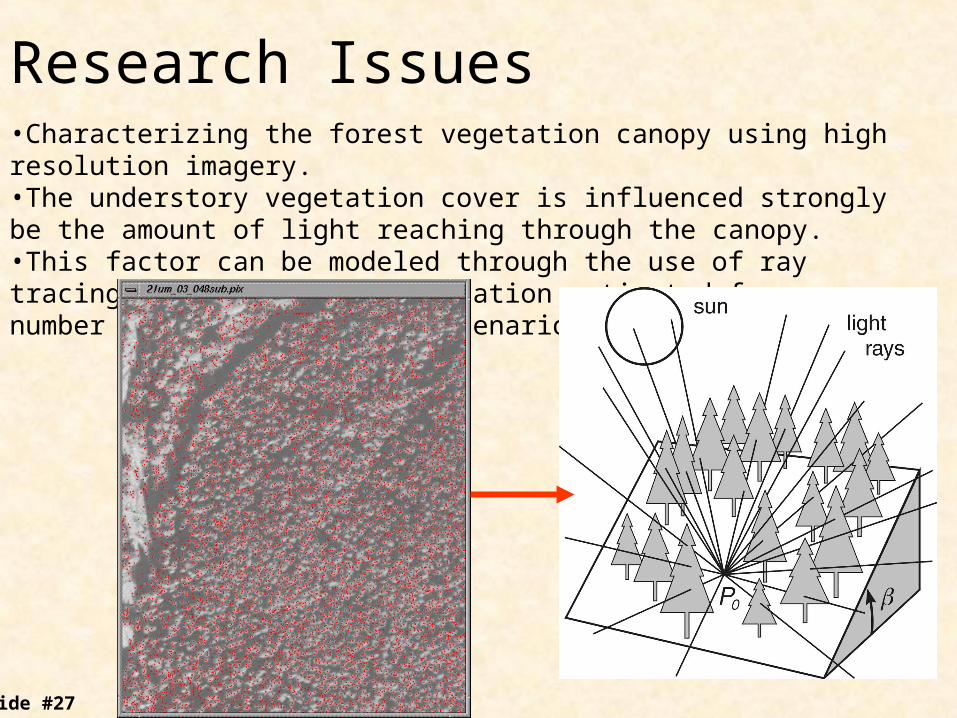
Research Issues•Characterizing the forest vegetation canopy using high resolution imagery. •The understory vegetation cover is influenced strongly be the amount of light reaching through the canopy.•This factor can be modeled through the use of ray tracing routines and the radiation estimated for a number of vegetation cover scenarios.
Slide #28
Conclusions
• Remote sensing can support a large number of research and application initiatives for PEM at a variety of scales.
• This technology can also be integrated into existing data bases (such as the vegetation inventory) to supply information that is not normally found in these data bases.