Embed Size (px)
Citation preview
Slide 1
Annual Accounts 2005February 16, 2006
Slide 2
• Changes in Group Structure
• Q4 and 2005 In Brief
• Sales and Profitability
• Cashflow & Working Capital
• Strategy Implementation
• Personnel, Board and Ownership Changes
• North American Perspective
• Outlook for 2006 and Dividend for 2005
• Rewards
AGENDA
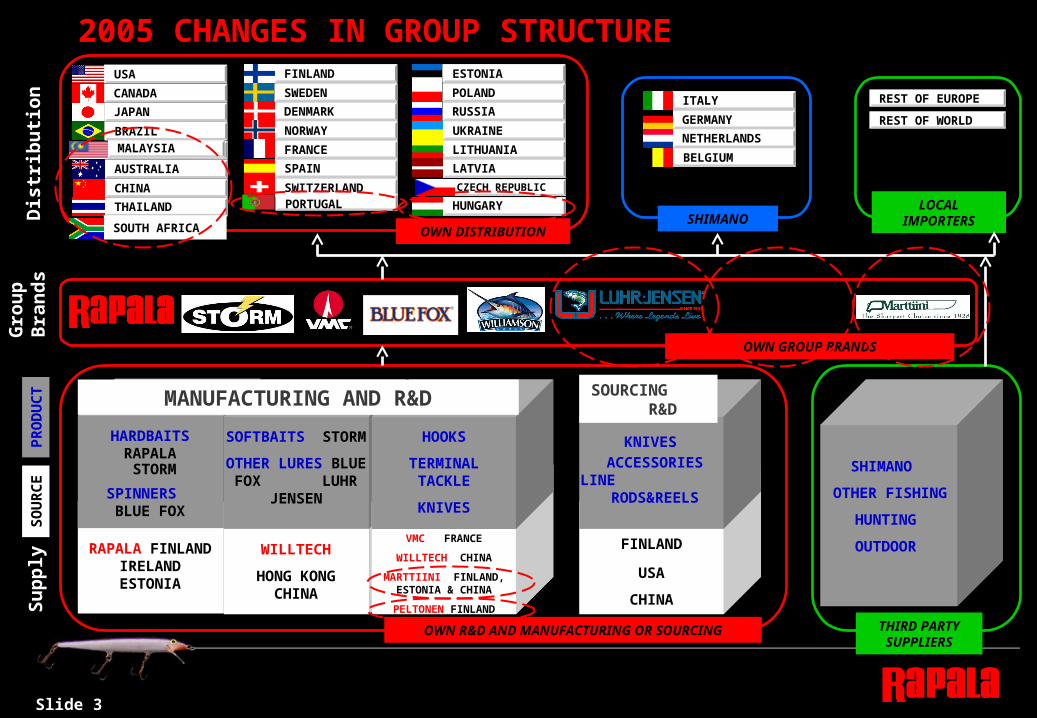
RAPALA FINLAND IRELAND ESTONIA
SOFTBAITS STORM
OTHER LURES BLUE FOX LUHR JENSEN
WILLTECH
HONG KONG CHINA
HOOKS
TERMINAL TACKLE
KNIVES
SHIMANO
OTHER FISHING
HUNTING
OUTDOOR
ACCESSORIES LINE
RODS&REELS
USA
CHINA
KNIVES
REST OF EUROPE
REST OF WORLD
Dis
trib
uti
on
Gro
up
B
ran
ds
FINLAND
MANUFACTURING AND R&D SOURCING R&D
OWN R&D AND MANUFACTURING OR SOURCING
OWN GROUP BRANDS
OWN DISTRIBUTIONSHIMANO
LOCAL IMPORTERS
THIRD PARTY SUPPLIERS
Su
pp
ly
SO
UR
CE
PR
OD
UC
T
HARDBAITS RAPALA
SPINNERS BLUE FOX
STORM
2005 CHANGES IN GROUP STRUCTURE
Slide 3
FINLAND
SWEDEN
DENMARK
NORWAY
FRANCE
SPAIN
SWITZERLAND
USA
CANADA
JAPAN
BRAZIL
AUSTRALIA
CHINA
THAILAND
ESTONIA
POLAND
RUSSIA
UKRAINE
LITHUANIA
LATVIA
HUNGARY
ITALY
GERMANY
NETHERLANDS
BELGIUM
VMC FRANCE
WILLTECH CHINA
MARTTIINI FINLAND, ESTONIA & CHINA
PELTONEN FINLAND
PORTUGAL
MALAYSIA
CZECH REPUBLIC
SOUTH AFRICA
Slide 4
Q4 AND 2005 IN BRIEF
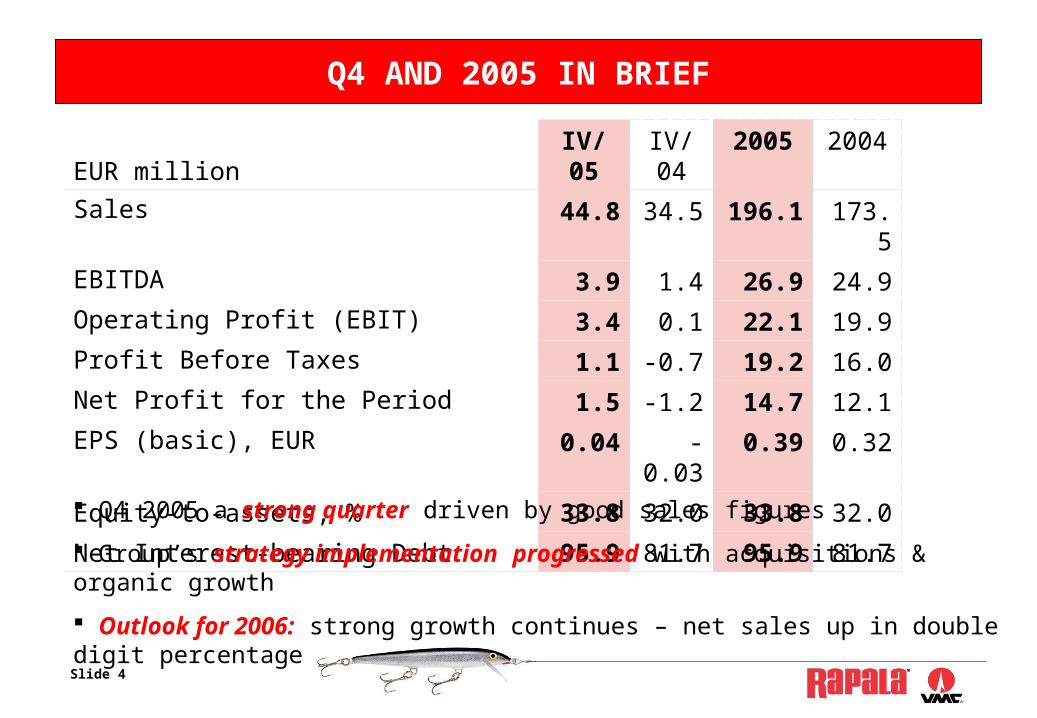
EUR million IV/05 IV/04 2005 2004
Sales 44.8 34.5 196.1 173.5
EBITDA 3.9 1.4 26.9 24.9
Operating Profit (EBIT) 3.4 0.1 22.1 19.9
Profit Before Taxes 1.1 -0.7 19.2 16.0
Net Profit for the Period 1.5 -1.2 14.7 12.1
EPS (basic), EUR 0.04 -0.03 0.39 0.32
Equity-to-assets, % 33.8 32.0 33.8 32.0
Net Interest-bearing Debt 95.9 81.7 95.9 81.7
Q4 2005 a strong quarter driven by good sales figures
Group’s strategy implementation progressed with acquisitions & organic growth
Outlook for 2006: strong growth continues – net sales up in double digit percentage
Slide 5
NET SALES BY QUARTER
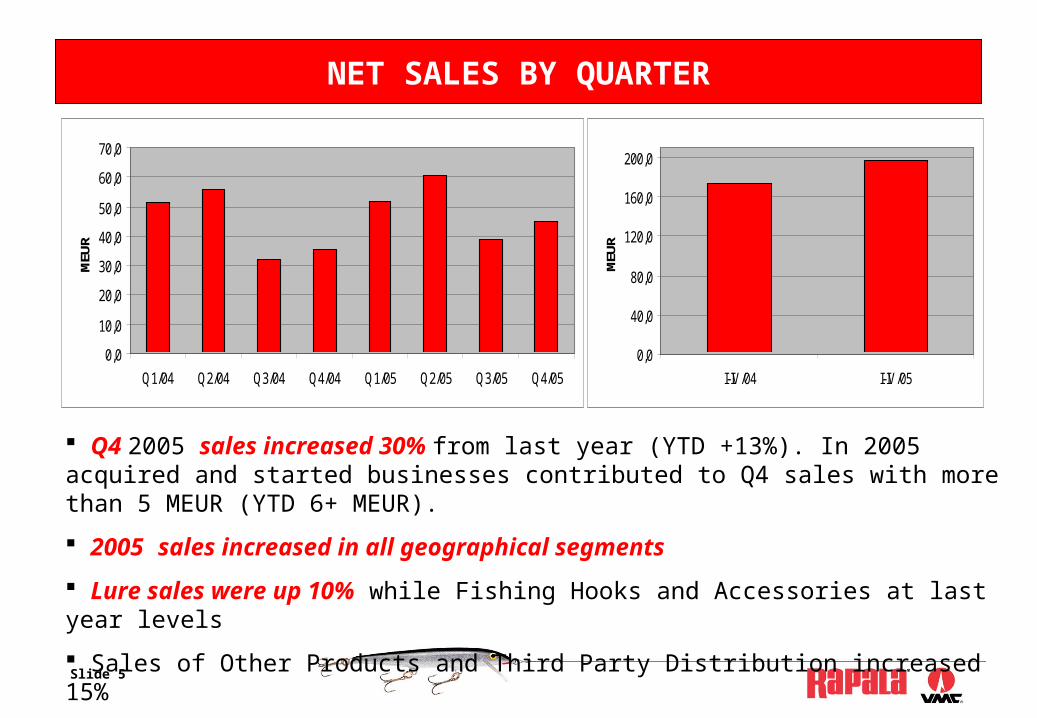
Q4 2005 sales increased 30% from last year (YTD +13%). In 2005 acquired and started businesses contributed to Q4 sales with more than 5 MEUR (YTD 6+ MEUR).
2005 sales increased in all geographical segments
Lure sales were up 10% while Fishing Hooks and Accessories at last year levels
Sales of Other Products and Third Party Distribution increased 15%
0,0
10,0
20,0
30,0
40,0
50,0
60,0
70,0
Q1/04 Q2/04 Q3/04 Q4/04 Q1/05 Q2/05 Q3/05 Q4/05
MEU
R
0,0
40,0
80,0
120,0
160,0
200,0
I-IV/04 I-IV/05
MEU
R
Slide 6
OPERATING PROFIT & EBITDA BY QUARTER
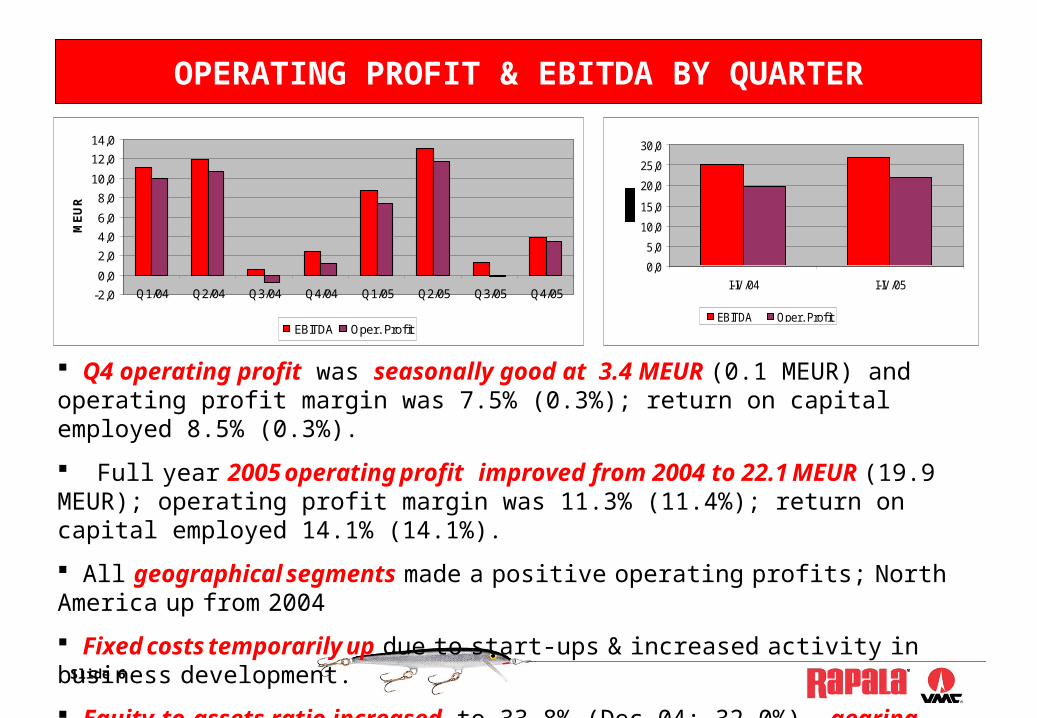
Q4 operating profit was seasonally good at 3.4 MEUR (0.1 MEUR) and operating profit margin was 7.5% (0.3%); return on capital employed 8.5% (0.3%).
Full year 2005 operating profit improved from 2004 to 22.1 MEUR (19.9 MEUR); operating profit margin was 11.3% (11.4%); return on capital employed 14.1% (14.1%).
All geographical segments made a positive operating profits; North America up from 2004
Fixed costs temporarily up due to start-ups & increased activity in business development.
Equity-to-assets ratio increased to 33.8% (Dec 04: 32.0%), gearing decreased to 124.1% (Dec 04: 136.6%) & net interest-bearing debt increase to 95.9 (Dec 04: 81.7)
-2,0
0,0
2,0
4,0
6,0
8,0
10,0
12,0
14,0
Q1/04 Q2/04 Q3/04 Q4/04 Q1/05 Q2/05 Q3/05 Q4/05
ME
UR
EBITDA Oper. Profit
0,0
5,0
10,0
15,0
20,0
25,0
30,0
I-IV/04 I-IV/05
EBITDA Oper. Profit
Slide 7
CASHFLOW AND WORKING CAPITAL
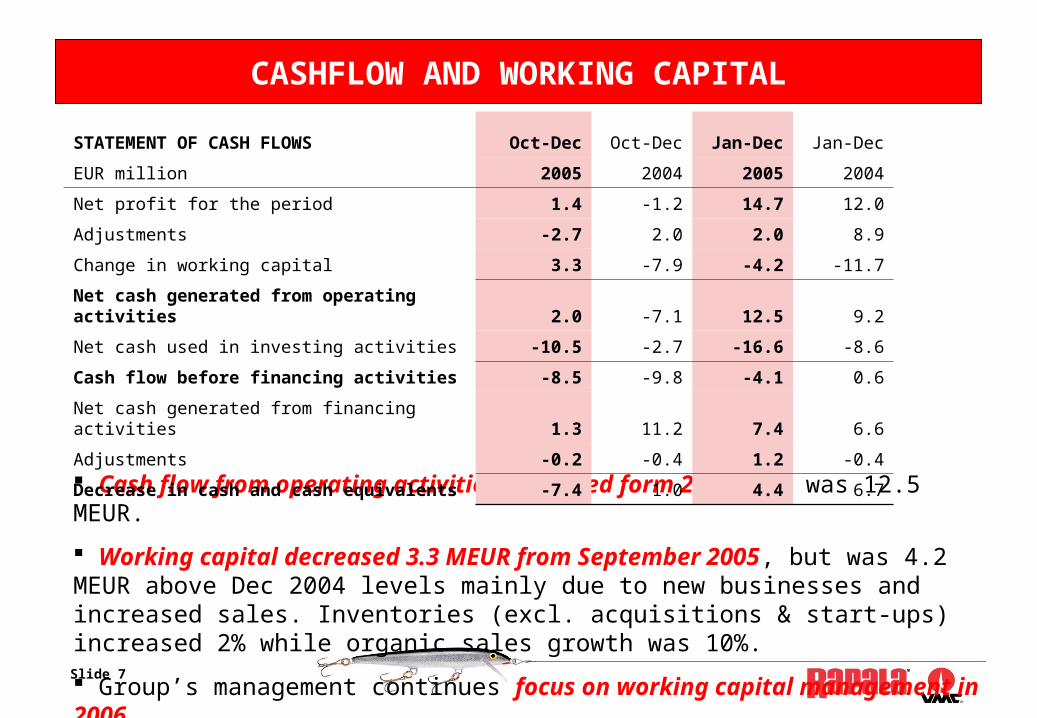
Cash flow from operating activities increased form 2004 and was 12.5 MEUR.
Working capital decreased 3.3 MEUR from September 2005, but was 4.2 MEUR above Dec 2004 levels mainly due to new businesses and increased sales. Inventories (excl. acquisitions & start-ups) increased 2% while organic sales growth was 10%.
Group’s management continues focus on working capital management in 2006.
STATEMENT OF CASH FLOWS Oct-Dec Oct-Dec Jan-Dec Jan-Dec
EUR million 2005 2004 2005 2004
Net profit for the period 1.4 -1.2 14.7 12.0
Adjustments -2.7 2.0 2.0 8.9
Change in working capital 3.3 -7.9 -4.2 -11.7
Net cash generated from operating activities 2.0 -7.1 12.5 9.2
Net cash used in investing activities -10.5 -2.7 -16.6 -8.6
Cash flow before financing activities -8.5 -9.8 -4.1 0.6
Net cash generated from financing activities 1.3 11.2 7.4 6.6
Adjustments -0.2 -0.4 1.2 -0.4
Decrease in cash and cash equivalents -7.4 1.0 4.4 6.7
Slide 8
STRATEGY IMPLEMENTATION IN 2005
Rapala’s strategic objective is profitable growth, founded on 3 established strenghts: a unique manufacturing and sourcing platform (China and Europe) a leading global distribution network in fishing tackle industry a strong brand portfolio with several leading brands
The strengthening of the Group’s distribution network Started with the purchase of the Swiss distributor FunFish (net sales 1 MEUR) in May Followed with the acquisition of the Australian distribution company Freetime (5 MEUR) in July Remaining 33% minority stake of Rapala’s Danish distribution company purchased in August Hungarian distributor Eurohold (2 MEUR) was acquired in October Acquisition of the South African fishing tackle distributor Tatlow & Pledger (6 MEUR) was closed
in February 2006
The Group also signed a worldwide exclusive distribution agreement for sport fishing for the pheromone based fish attractant branded as Ultrabite. In the future, Rapala will launch lures and baits containing these pheromones. On a larger scale, the impact on sales will be seen only in 2007 and onwards.
In addition to these acquisitions, new sales companies were opened in Malaysia, China and Thailand.
Slide 9
STRATEGY IMPLEMENTATION IN 2005
Acquisition of Luhr Jensen & Sons (USA) closed in October (net sales 7 MEUR) Market leader in the Pacific Northwest and Alaska (USA) and in British Columbia (Canada). The production will be transferred to the Rapala factories, primarily Rapala’s factory located in
China, during a 12-month transition period. Combined Luhr Jensen & Blue Fox makes Rapala the market leader world wide in metal lures
Acquisition of Finnish knife manufacturer Marttiini closed in November (net sales 6 MEUR) The deal includes the Finnish knife factory in Rovaniemi, the knife sheaths factory in Estonia and
the 49% share in the Chinese knife joint-venture with Rapala. Rapala is now the market leader worldwide in filleting knives.
The acquisition of 61% of Peltonen Ski (net sales of 2 MEUR) finalised in November Winter-sports, together with hunting, have an important role in the Group distribution business in
Nordic countries were the fishing tackle business is very slow in autumn and winter time. The integration of new businesses has progressed on plan.
Ramp-up of production at the Chinese knife manufacturing joint venture on plan. As a result of the acquisition of Marttiini, this joint venture is now 100% owned by the Group.
The launch of Rapala’s new product line for fishing clothing (Rapala ProWear) has proceeded on plan and will be available for season 2006.
Slide 10
Personnel increased
– The personnel increased with 625 persons and was 3 986 at year end
– This resulted from acquisitions made, new operations started and the expansion of Chinese operations.
Changes in Ownership and Board of Directors
– In November, there was a significant change in the Group ownership.
– The long time main shareholder, Rapala Normark N.V. sold its shares to the French Viellard family, a Belgian publicly listed investment company Sofina S.A. and William Ng.
– The Board’s composition was also changed accordingly in December.
– Hardy McLain representing Rapala Normark N.V. and Manjit Dale resigned from the Board and Marc Speeckaert, representing Sofina, joined the Board.
– At the same time, Emmanuel Viellard was elected Chairman of the Board.
CHANGES IN PERSONNEL AND BOARD
Slide 11
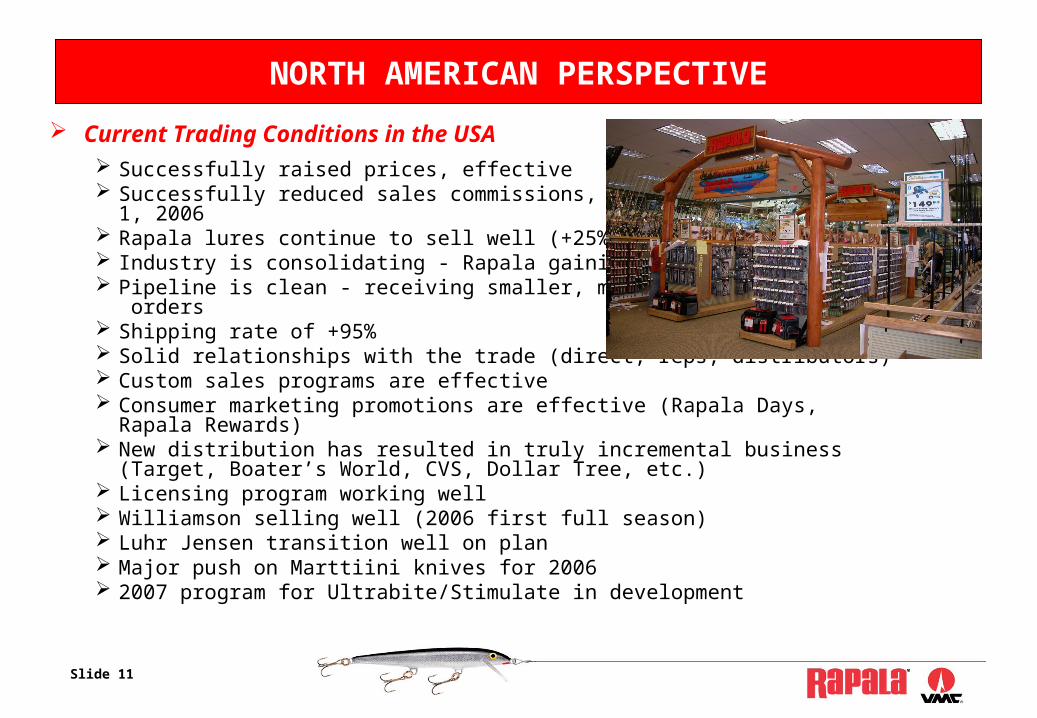
Current Trading Conditions in the USA Successfully raised prices, effective January
1, 2006 Successfully reduced sales commissions,
effective January 1, 2006 Rapala lures continue to sell well (+25% in 2005) Industry is consolidating - Rapala gaining market share Pipeline is clean - receiving smaller, more frequent
orders Shipping rate of +95% Solid relationships with the trade (direct, reps, distributors) Custom sales programs are effective Consumer marketing promotions are effective (Rapala Days, Rapala Rewards) New distribution has resulted in truly incremental business (Target, Boater’s
World, CVS, Dollar Tree, etc.) Licensing program working well Williamson selling well (2006 first full season) Luhr Jensen transition well on plan Major push on Marttiini knives for 2006 2007 program for Ultrabite/Stimulate in development
NORTH AMERICAN PERSPECTIVE
Slide 12
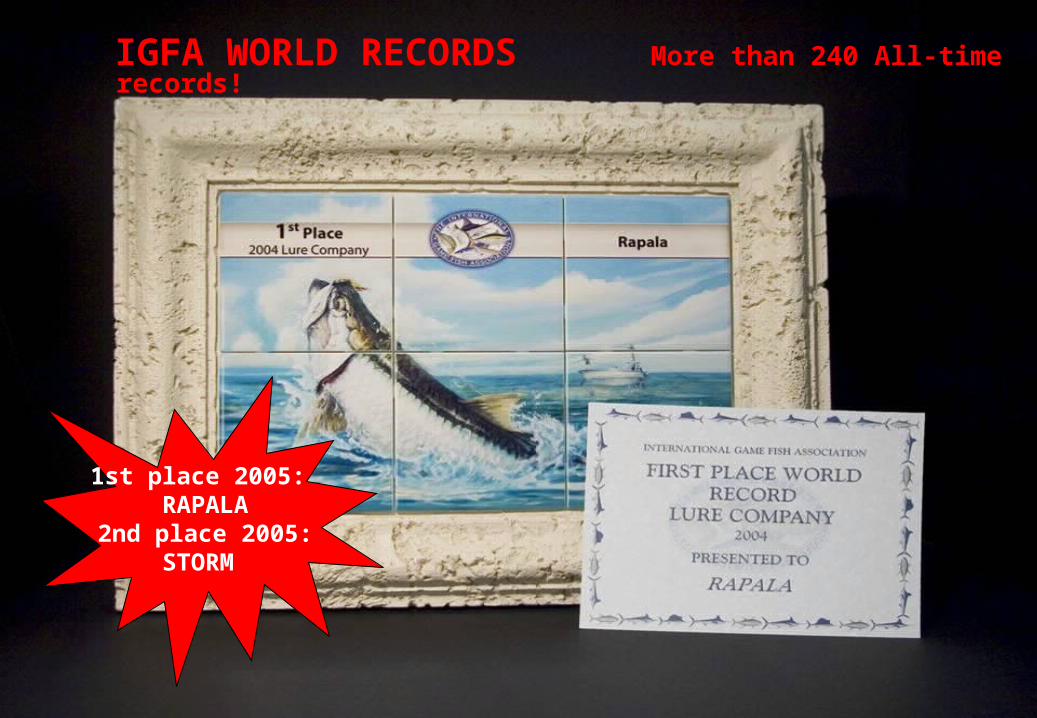
IGFA WORLD RECORDS More than 240 All-time records!
1st place 2005: RAPALA
2nd place 2005:STORM
Slide 13
– Market outlook for 2006 looks stable in key markets (North America & Western Europe) and especially good in the new markets like East Europe, South Africa, Australia and Asia.
– Including the completed acquisitions in 2005 and early 2006, it is expected that the Group’s net sales for 2006 will continue to increase with double digit percentage.
– The profitability of the Group’s ongoing operations continues to be good. Pursuing acquisitions and business development as well as integration of acquired businesses has increased the fixed costs and this will continue in 2006. Also fixed costs on several start-up operations will continue to negatively affect the profitability until the sales volumes are high enough to cover the costs and deliver the targeted margins. As a result of the acquisitions, also the depreciation will increase.
– Therefore, operating profit is expected to be in absolute terms above last year level but achieving the 2005 operating margin level will be challenging. The full benefit of the completed acquisitions will materialize from 2007 onward.
– Working capital management continues in 2006. The target is to see an improvement on ongoing operations while the new acquisitions and start-ups will add working capital.
– Group management continues planning and negotiations regarding further acquisitions and business combinations to implement the Group’s strategy.
– The Board of Directors proposes to the Annual General Meeting that a dividend of EUR 0.11 per share be paid. This represents an increase of 22%.
OUTLOOK FOR 2006

Slide 14