Embed Size (px)
Citation preview
Slide 1 / 20.04.23
Impact of crisis on retail banking
Ionut Dumitru, Chief-Economist Raiffeisen Bank

Slide 2 / 20.04.23
Overview – Impact of crisis on demand for retail banking products
Rapidly deteriorating economic activity caused
Downward adjustment in financial position of households – real disposable income decreased, unemployment increased
Low consumer morale – as a result of both current financial situation and persisting uncertainties regarding future economic and financial outlook
Dynamics of private credit turned negative – consumer loans were the most affected
Both WILLINGNESS and CAPACITY of households to take on new debt has been significantly impaired
Increased propensity to save and lower consumption
Slide 3 / 20.04.23
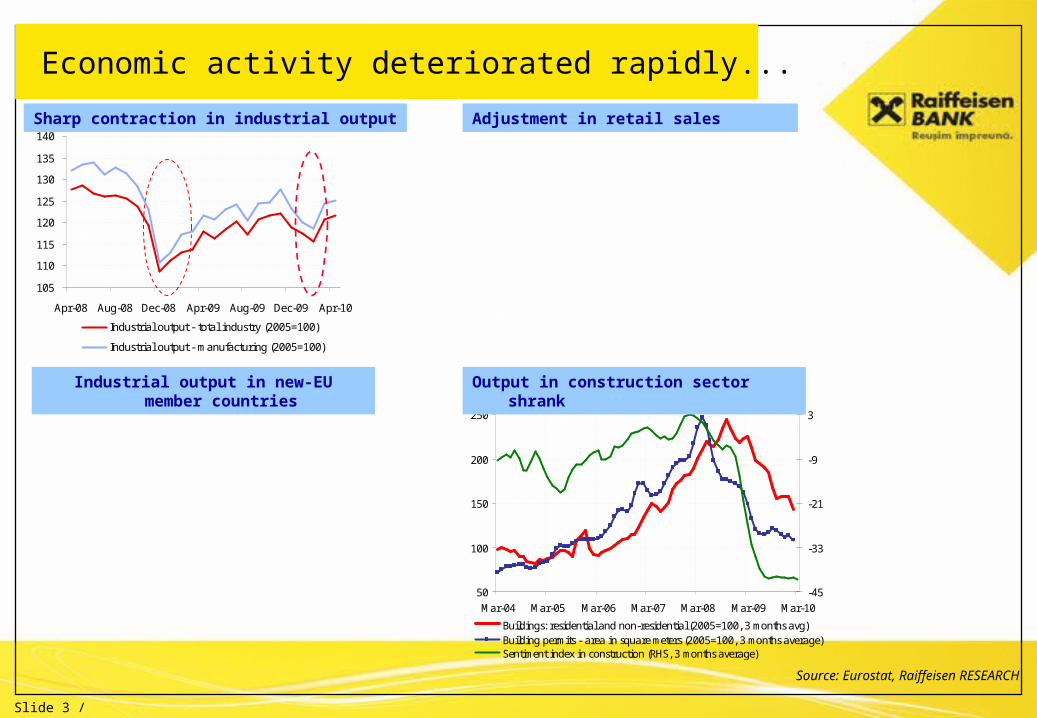
Economic activity deteriorated rapidly...
Adjustment in retail sales Sharp contraction in industrial output
Industrial output in new-EU member countries
50
100
150
200
250
Mar-04 Mar-05 Mar-06 Mar-07 Mar-08 Mar-09 Mar-10-45
-33
-21
-9
3
Buildings: residential and non-residential (2005=100, 3 months avg)Building permits - area in square meters (2005=100, 3 months average)Sentiment index in construction (RHS, 3 months average)
Output in construction sector shrank
Source: Eurostat, Raiffeisen RESEARCH
105
110
115
120
125
130
135
140
Apr-08 Aug-08 Dec-08 Apr-09 Aug-09 Dec-09 Apr-10
Industrial output - total industry (2005=100)
Industrial output - manufacturing (2005=100)
100
120
140
160
180
200
Apr-
06
Oct-
06
Apr-
07
Oct-
07
Apr-
08
Oct-
08
Apr-
09
Oct-
09
Apr-
10
Non-foods, excluding fuels Fuels
Total retail sales Foods
2005=100,
3 months average
Index of industrial output (2008Q2=100)
75
80
85
90
95
100
105
Apr-07 Oct-07 Apr-08 Oct-08 Apr-09 Oct-09 Apr-10
Romania CEE 4 Countries Baltic countries Euro area
Slide 4 / 20.04.23
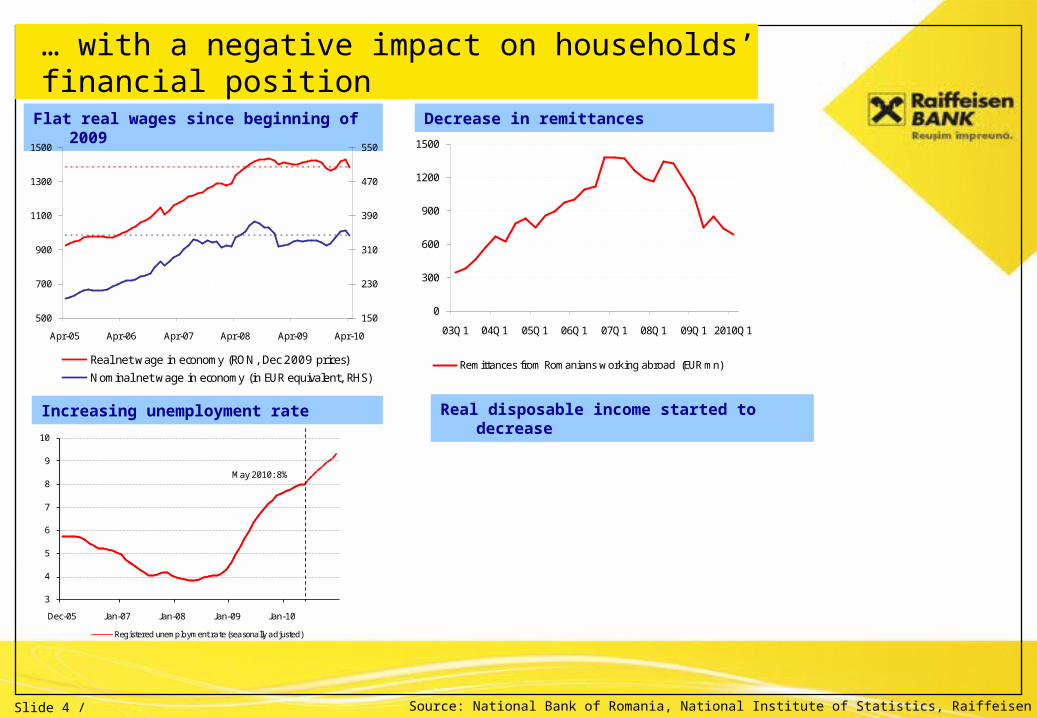
… with a negative impact on households’ financial position
Flat real wages since beginning of 2009
Increasing unemployment rate
Decrease in remittances
0
300
600
900
1200
1500
03Q1 04Q1 05Q1 06Q1 07Q1 08Q1 09Q1 2010Q1
Remittances from Romanians working abroad (EUR mn)
Real disposable income started to decrease
Source: National Bank of Romania, National Institute of Statistics, Raiffeisen RESEARCH
3
4
5
6
7
8
9
10
Dec-05 Jan-07 Jan-08 Jan-09 Jan-10
Registered unemployment rate (seasonally adjusted)
May 2010: 8%
500
700
900
1100
1300
1500
Apr-05 Apr-06 Apr-07 Apr-08 Apr-09 Apr-10
150
230
310
390
470
550
Real net wage in economy (RON, Dec 2009 prices)
Nominal net wage in economy (in EUR equivalent, RHS)
-20
0
20
40
60
80
100
120
05Q1 06Q1 07Q1 08Q1 09Q1 2010Q01
Real disposable income (2008=100)
Real disposable income (% yoy)
Slide 5 / 20.04.23
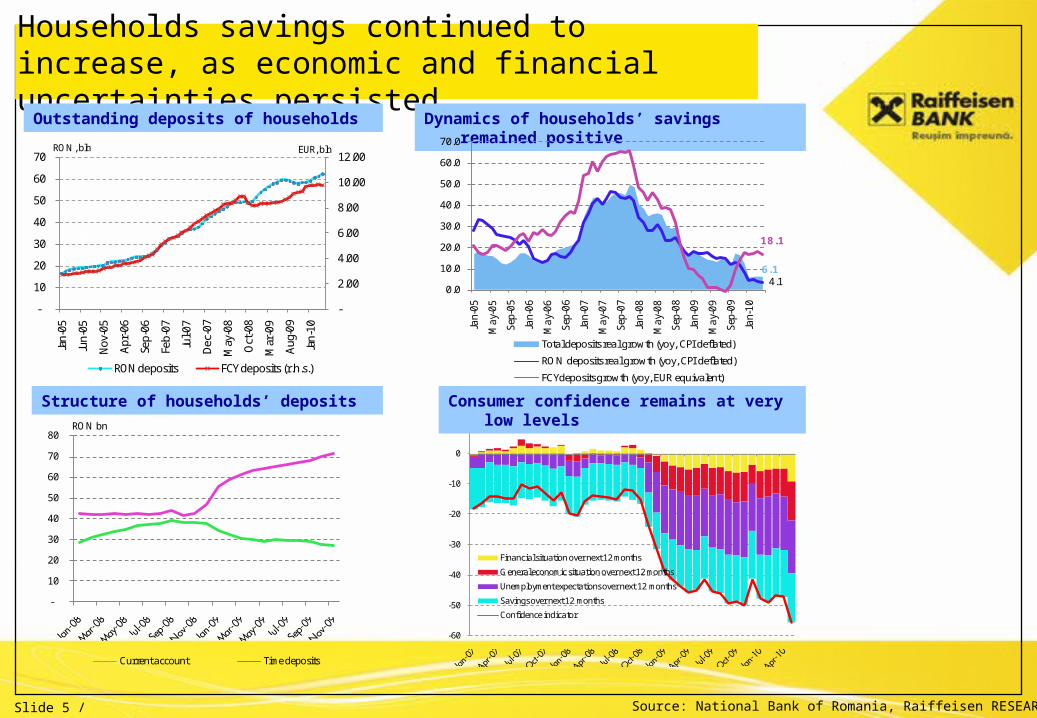
Households savings continued to increase, as economic and financial uncertainties persisted
Outstanding deposits of households
Structure of households’ deposits
Dynamics of households’ savings remained positive
Source: National Bank of Romania, Raiffeisen RESEARCH
-
2.00
4.00
6.00
8.00
10.00
12.00
-
10
20
30
40
50
60
70
Jan-
05
Jun-
05
Nov
-05
Apr
-06
Sep-
06
Feb-
07
Jul-0
7
Dec
-07
May
-08
Oct
-08
Mar
-09
Aug
-09
Jan-
10
RON deposits FCY deposits (r.h.s.)
RON, bln EUR, bln
4.1
18.1
0.0
10.0
20.0
30.0
40.0
50.0
60.0
70.0
Jan-
05
May
-05
Sep-
05
Jan-
06
May
-06
Sep-
06
Jan-
07
May
-07
Sep-
07
Jan-
08
May
-08
Sep-
08
Jan-
09
May
-09
Sep-
09
Jan-
10
Total deposits real growth (yoy, CPI deflated)
RON deposits real growth (yoy, CPI deflated)
FCYdeposits growth (yoy, EUR equivalent)
6.1
-
10
20
30
40
50
60
70
80
Current account Time deposits
RON bn
-60
-50
-40
-30
-20
-10
0
10
Financial situation over next 12 months
General economic situation over next 12 months
Unemployment expectations over next 12 months
Savings over next 12 months
Confidence indicator
Consumer confidence remains at very low levels
Slide 6 / 20.04.23
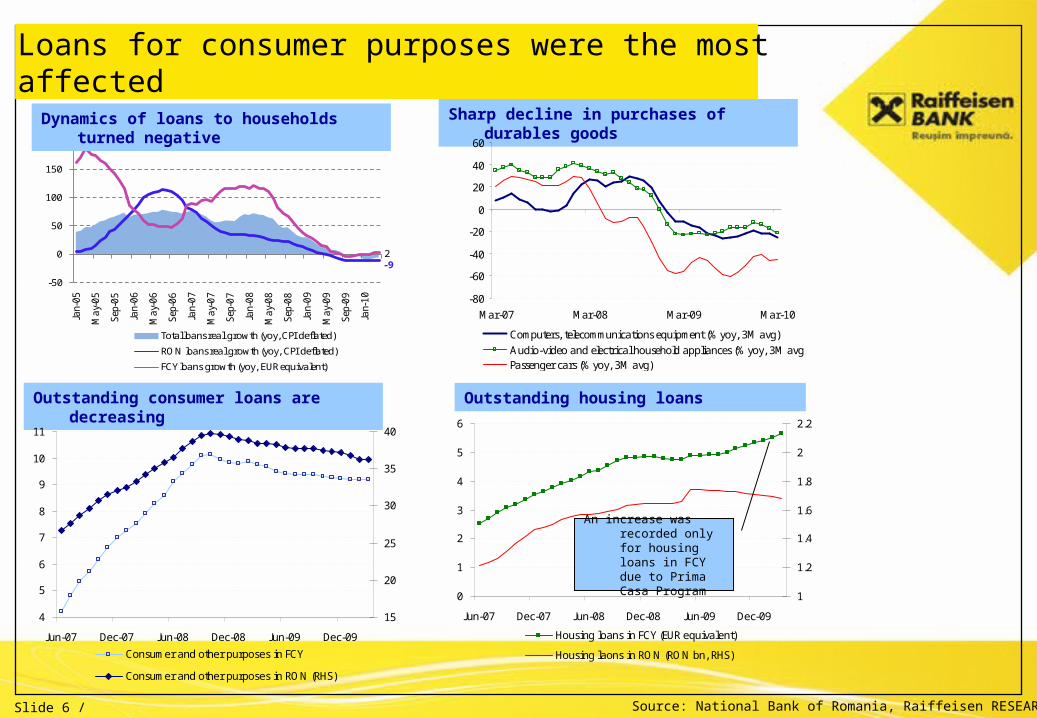
Loans for consumer purposes were the most affected
Outstanding consumer loans are decreasing
Outstanding housing loans
Sharp decline in purchases of durables goods
4
5
6
7
8
9
10
11
Jun-07 Dec-07 Jun-08 Dec-08 Jun-09 Dec-09
15
20
25
30
35
40
Consumer and other purposes in FCY
Consumer and other purposes in RON (RHS)
-80
-60
-40
-20
0
20
40
60
Mar-07 Mar-08 Mar-09 Mar-10
Computers, telecommunications equipment (% yoy, 3M avg)Audio-video and electrical household appliances (% yoy, 3M avg)Passenger cars (% yoy, 3M avg)
0
1
2
3
4
5
6
Jun-07 Dec-07 Jun-08 Dec-08 Jun-09 Dec-09
1
1.2
1.4
1.6
1.8
2
2.2
Housing loans in FCY (EUR equivalent)
Housing laons in RON (RON bn, RHS)
An increase was recorded only for housing loans in FCY due to Prima Casa Program
Source: National Bank of Romania, Raiffeisen RESEARCH
-92
-50
0
50
100
150
200
Jan-
05
May
-05
Sep-
05
Jan-
06
May
-06
Sep-
06
Jan-
07
May
-07
Sep-
07
Jan-
08
May
-08
Sep-
08
Jan-
09
May
-09
Sep-
09
Jan-
10
Total loans real growth (yoy, CPI deflated)
RON loans real growth (yoy, CPI deflated)
FCY loans growth (yoy, EUR equivalent)
Dynamics of loans to households turned negative

Slide 7 / 20.04.23
Overview – Impact of crisis on banks (supply-side of retail banking products)
Financial standing of banks’ clients deteriorated, future outlook of credit risk remains negative Tightening of lending standards by banks in an attempt to contain future potential losses
Rapid increase in non-performing loans and risk costs leading to a significant erosion of banks’ profit margins
Increase in funding costs as a result of the financial crisis added to the pressure on profit margins, as it was not (fully) passed on to customers.

Slide 8 / 20.04.23
Banks tightened the lending standards and became more reluctant to lend money
Source: National Bank of Romania, Raiffeisen RESEARCH
Lending standards have been tightened
-40
-20
0
20
40
60
80
100
Bala
nce
(%)
Companies Households
Tigh
teni
ng le
ndin
g st
anda
rds
Easi
ngle
ndin
g st
anda
rds
-40
-20
0
20
40
60
80
100
2007Q4 2008Q1 2008Q2 2008Q3 2008Q4 2009Q1 2009Q2 2009Q3 2009Q4
SME Corporate
Ris
ing
cred
it risk
Dec
reas
ing
cred
it risk
Credit risk of real sector as perceived by banks increased substantially
Slide 9 / 20.04.23
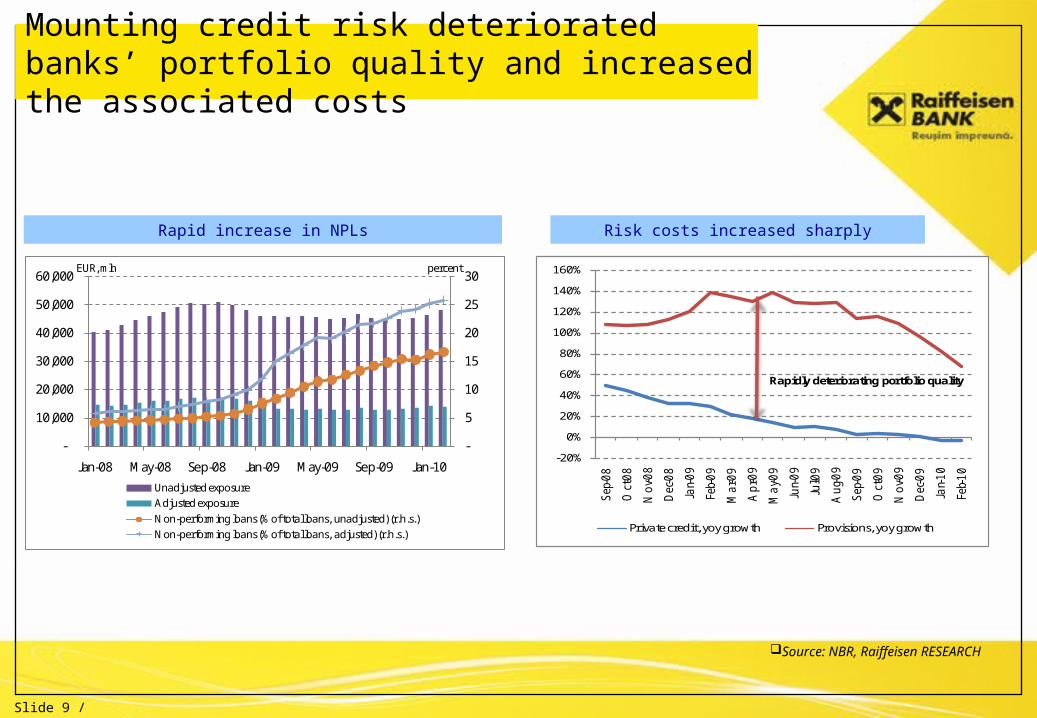
Mounting credit risk deteriorated banks’ portfolio quality and increased the associated costs
Source: NBR, Raiffeisen RESEARCH
Rapid increase in NPLs Risk costs increased sharply
-
5
10
15
20
25
30
-
10,000
20,000
30,000
40,000
50,000
60,000
Jan-08 May-08 Sep-08 Jan-09 May-09 Sep-09 Jan-10
Unadjusted exposureAdjusted exposureNon-performing loans (% of total loans, unadjusted) (r.h.s.)Non-performing loans (% of total loans, adjusted) (r.h.s.)
EUR, mln percent
-20%
0%
20%
40%
60%
80%
100%
120%
140%
160%
Sep
-08
Oct-
08
Nov-0
8
Dec
-08
Jan-09
Feb-09
Mar-0
9
Apr-0
9
May-0
9
Jun-09
Jul-0
9
Aug-09
Sep
-09
Oct-
09
Nov-0
9
Dec
-09
Jan-10
Feb-10
Private credit, yoy growth Provisions, yoy growth
Rapidly deteriorating portfolio quality
Slide 10 / 20.04.23
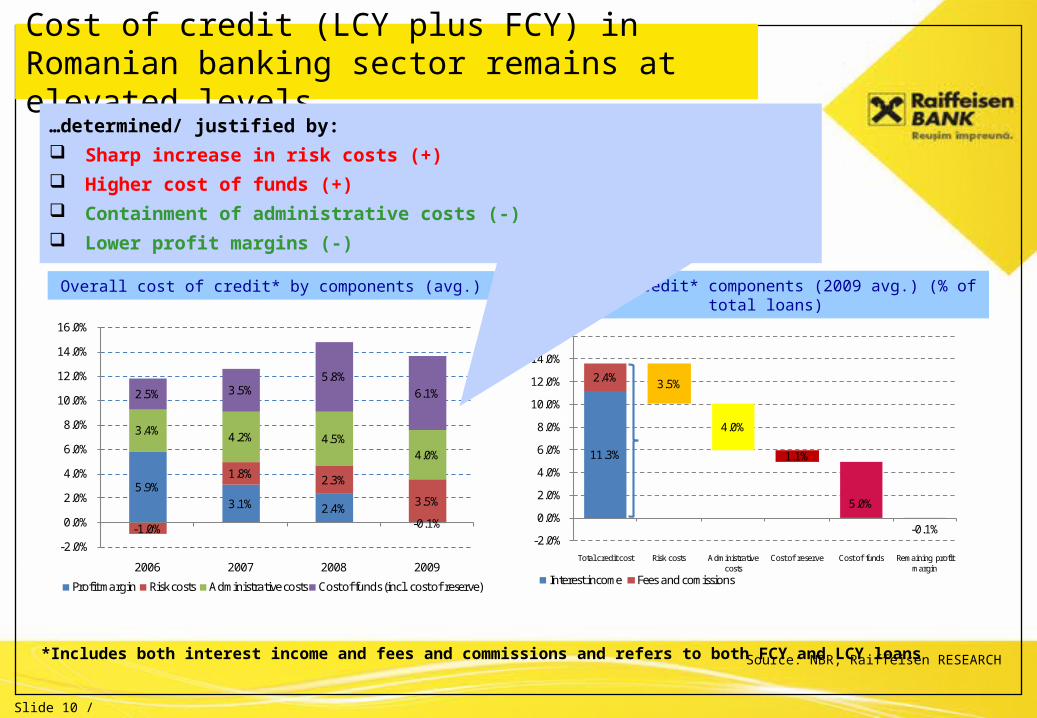
Cost of credit (LCY plus FCY) in Romanian banking sector remains at elevated levels…
Overall cost of credit* by components (avg.)
*Includes both interest income and fees and commissions and refers to both FCY and LCY loans
Cost of credit* components (2009 avg.) (% of total loans)
Source: NBR, Raiffeisen RESEARCH
5.9%3.1% 2.4%
-0.1%-1.0%
1.8% 2.3%
3.5%
3.4% 4.2% 4.5%4.0%
2.5% 3.5%5.8%
6.1%
-2.0%
0.0%
2.0%
4.0%
6.0%
8.0%
10.0%
12.0%
14.0%
16.0%
2006 2007 2008 2009
Profit margin Risk costs Administrative costs Cost of funds (incl. cost of reserve)
11.3%
-0.1%
2.4% 3.5%
4.0%
1.1%
5.0%
-2.0%
0.0%
2.0%
4.0%
6.0%
8.0%
10.0%
12.0%
14.0%
16.0%
Total credit cost Risk costs Administrative costs
Cost of reserve Cost of funds Remaining profit margin
Interest income Fees and comissions
…determined/ justified by: Sharp increase in risk costs (+) Higher cost of funds (+) Containment of administrative costs (-) Lower profit margins (-)
Slide 11 / 20.04.23
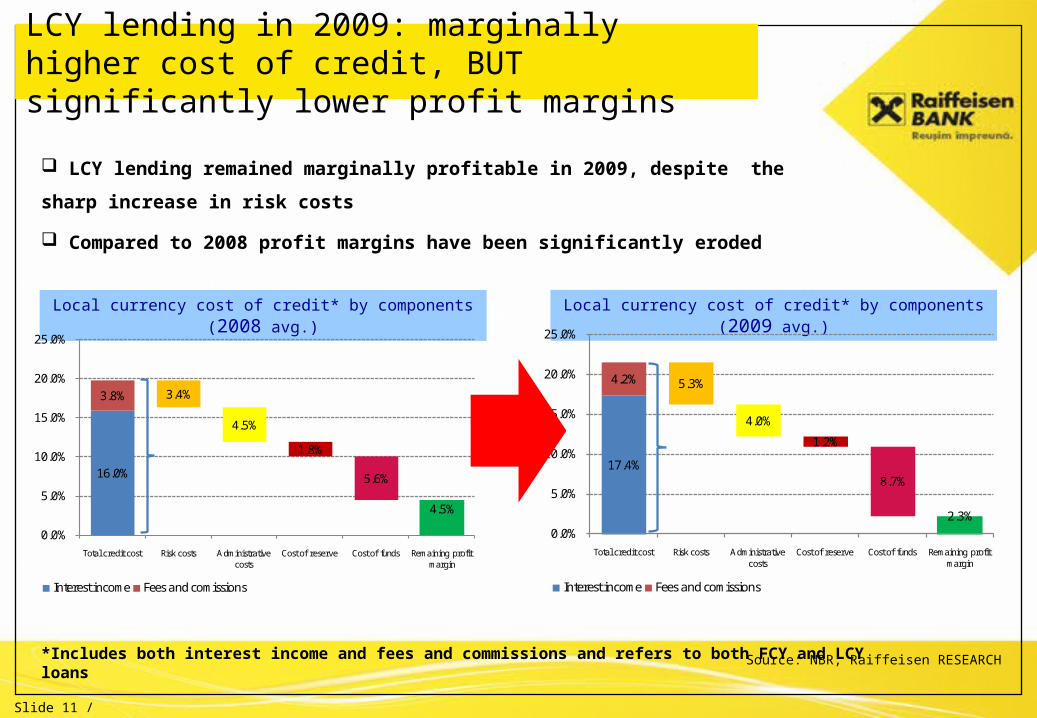
LCY lending in 2009: marginally higher cost of credit, BUT significantly lower profit margins
Local currency cost of credit* by components (2008 avg.)
*Includes both interest income and fees and commissions and refers to both FCY and LCY loans
Local currency cost of credit* by components (2009 avg.)
Source: NBR, Raiffeisen RESEARCH
17.4%
2.3%
4.2% 5.3%
4.0%
1.2%
8.7%
0.0%
5.0%
10.0%
15.0%
20.0%
25.0%
Total credit cost Risk costs Administrative costs
Cost of reserve Cost of funds Remaining profit margin
Interest income Fees and comissions
16.0%
4.5%
3.8% 3.4%
4.5%
1.8%
5.6%
0.0%
5.0%
10.0%
15.0%
20.0%
25.0%
Total credit cost Risk costs Administrative costs
Cost of reserve Cost of funds Remaining profit margin
Interest income Fees and comissions
LCY lending remained marginally profitable in 2009, despite the
sharp increase in risk costs
Compared to 2008 profit margins have been significantly eroded
Slide 12 / 20.04.23
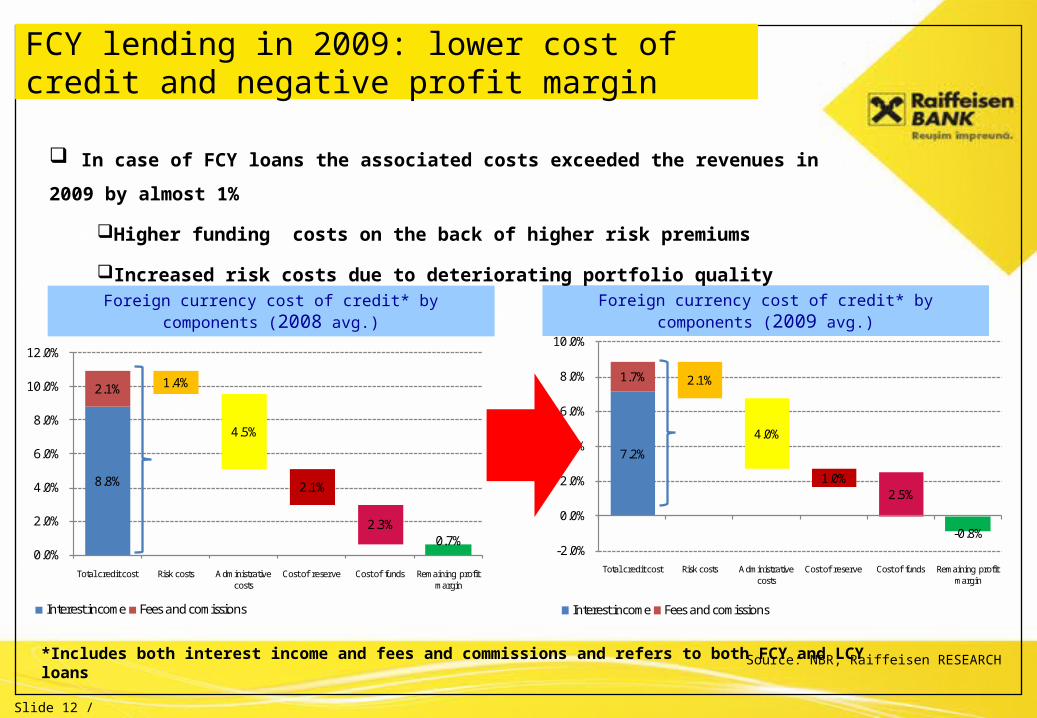
FCY lending in 2009: lower cost of credit and negative profit margin
Foreign currency cost of credit* by components (2008 avg.)
*Includes both interest income and fees and commissions and refers to both FCY and LCY loans
Foreign currency cost of credit* by components (2009 avg.)
Source: NBR, Raiffeisen RESEARCH
7.2%
-0.8%
1.7% 2.1%
4.0%
1.0%2.5%
-2.0%
0.0%
2.0%
4.0%
6.0%
8.0%
10.0%
Total credit cost Risk costs Administrative costs
Cost of reserve Cost of funds Remaining profit margin
Interest income Fees and comissions
8.8%
0.7%
2.1% 1.4%
4.5%
2.1%
2.3%
0.0%
2.0%
4.0%
6.0%
8.0%
10.0%
12.0%
Total credit cost Risk costs Administrative costs
Cost of reserve Cost of funds Remaining profit margin
Interest income Fees and comissions
In case of FCY loans the associated costs exceeded the revenues in 2009
by almost 1%
Higher funding costs on the back of higher risk premiums
Increased risk costs due to deteriorating portfolio quality

Slide 13 / 20.04.23
The fiscal adjustment process (1) Will have a negative effect on the economy and consequently on demand and supply of loans
Public revenues, expenditures and deficit
Source: Eurostat, Finance Ministry, Raiffeisen RESEARCH
The large budget deficit is the result of fast increase in public expenditures, especially with wages and social transfers (pensions, unemployment benefits)
The large budget deficit is difficult to finance in the current context
Radical measures are required to lower the budget deficit in a sustainable way: cut in the expenditures or/and increase in taxation
Main drivers of expenditures
10
17
24
31
38
45
2005 2006 2007 2008 2009
Compensation of employees (% of revenues)Intermediate consumption and other current expenditure (% of revenues)Social benefits (% of revenues)Capital investments (% of revenues)
The government decided to adjust the deficit on the expenditure side: cut in public wages by 25% and in pensions by 15%
The measures are radical and they would trigger resistance of unions; Increase in taxations should not be completely ruled out
Even with these measures, the budget deficit would be very high in 2010 (close to 7% of GDP based on cash methodology and 8% of GDP based on ESA 95)
1.2
2.22.5 5.4
8.3
7.8
38.8
40.4
37.6
36.035.3
33.5
32.333.1
33.5
32.132.1
31.030
32
34
36
38
40
42
2005 2006 2007 2008 2009 2010P
30
32
34
36
38
40
42
Budget deficit (% of GDP) Public expenses (% of GDP)
Public revenues (% of GDP)
Slide 14 / 20.04.23
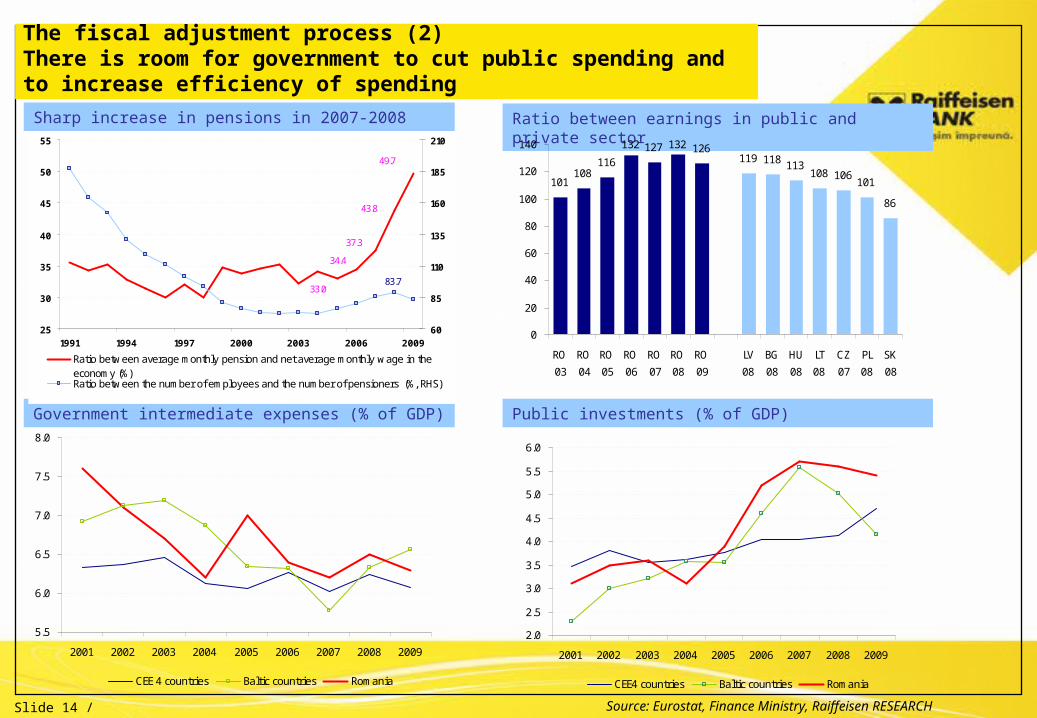
The fiscal adjustment process (2) There is room for government to cut public spending and to increase efficiency of spending
Sharp increase in pensions in 2007-2008
Source: Eurostat, Finance Ministry, Raiffeisen RESEARCH
Ratio between earnings in public and private sector
101108
116
132 127 132 126119 118 113
108 106101
86
0
20
40
60
80
100
120
140
RO
03
RO
04
RO
05
RO
06
RO
07
RO
08
RO
09
LV
08
BG
08
HU
08
LT
08
CZ
07
PL
08
SK
08
Government intermediate expenses (% of GDP)
2.0
2.5
3.0
3.5
4.0
4.5
5.0
5.5
6.0
2001 2002 2003 2004 2005 2006 2007 2008 2009
CEE4 countries Baltic countries Romania
Public investments (% of GDP)
5.5
6.0
6.5
7.0
7.5
8.0
2001 2002 2003 2004 2005 2006 2007 2008 2009
CEE 4 countries Baltic countries Romania
49.7
43.8
37.3
34.4
33.083.7
25
30
35
40
45
50
55
1991 1994 1997 2000 2003 2006 200960
85
110
135
160
185
210
Ratio between average monthly pension and net average monthly wage in theeconomy (%)Ratio between the number of employees and the number of pensioners (%, RHS)