Embed Size (px)
Citation preview
SLICE ORDER IN TASE – STRATEGY TO HIDE?
Isabel Tkatch and Zinat Shaila Alam*
Department of Finance, J. Mack Robinson College of Business
Georgia State University Atlanta, GA 30303
August 21, 2007
ABSTRACT
We identify a group of limit orders in an electronic limit order book and define them as slice orders. Slice orders
are of equal size and price submitted consecutively within an interval of two minutes. These orders are priced
aggressively, have shorter life span and hit the transaction most of the time. We find an increasing intra-day
pattern in slice order submission, more prevalent at the end of continuous trading session. We argue that these
orders arrive from the same trader and are used as a strategic tool to achieve best execution or to reduce price
impact of their large orders. Order imbalance in the short run and a higher percentage of impatient traders from the
opposite site in the long run increase the probability of observing a slice order. Our result is also consistent with
the empirical findings that traders’ perceived price impact of a large buy order is greater than that of a large sell
order.
JEL Classification: G15; G23; N20
Keywords: Market microstructure, trading strategies
* Corresponding author: Isabel Tkatch, Department of Finance, Georgia State University. Phone: + 1 – 404 -413 -
7351, Email: [email protected]. We are grateful to Harley E. Ryan, Jr., Reza Mahani and Vikas Agarwal for useful
suggestions and comments. We thank Tel-Aviv Stock Exchange for intra-day data.
2
SLICE ORDER IN TASE – STRATEGY TO HIDE?
I. INTRODUCTION
According to the traditional view of order choice under information asymmetry, informed (impatient) traders
use market orders to take advantage of better information before it is revealed to others. On the other hand,
uninformed (patient) traders use limit orders. From liquidity standpoint, informed (impatient) traders are the
consumer of liquidity while uninformed (patient) traders are the supplier of liquidity.
Rapid fragmentation in the US market and around the world, advances in technology and regulation-driven
changes in market structure have transformed trading process. Now the order choice is much more complex
beyond the oversimplified classification of limit and market order due to changing market structure, specially
in a pure limit order context.
When an institutional trader trading for a liquidity reason expose his bulk order in an open limit order book, a
quote matcher can potentially extract some profit by front running. Or he might be suspected to have some
private information and receive a worse price. As a result, traders do not have an incentive to expose their
order position. Therefore, a much larger proportion of liquidity is hidden in the desk of broker-dealer, floor
brokers, and orders at upstairs markets, in the “reserve order” pool of ECNs, in the dark books of the
crossing networks and ATSs (alternative trading systems). Large brokerage houses, are aggressively devising
algorithms to trap hidden liquidity in the electronic limit order markets for their clients and claim to offer
best execution. Many electronic trading platforms have introduced iceberg orders that allow market
participants to submit the orders only with a certain portion of the orders publicly disclosed.
Given the changing market structure, we would like to see what trading scheme would like to be adopted by
a large trader in an electronic anonymous limit order market which does not allow an iceberg order.
Empirical evidence suggests that large institutional split their orders to ensure better execution and reduce
price impact. Now a days, algorithmic trading is well skilled to the task of breaking larger trades into smaller
pieces. We identify a group of limit orders in an electronic limit order book. These limit orders are of equal
size and price submitted consecutively within an interval of two minutes. We name them slice orders. These
slice orders may be a portion of large orders broken to smaller pieces. We argue that these orders arrive from
the same trader and are used as a strategic tool to achieve best execution or to reduce price impact of their
large orders. The anonymity of a trader in a pure electronic limit order market of TASE helps him to hide his
large order volume by submitting slice orders.
3
In the spirit of Hasbrouck and Saar (2004) paper, we then extend the classification of market and limit orders
in an order driven market. We classify two groups of limit orders - regular and slice orders. Slice order, as
defined before, is a group of limit orders of equal size and price submitted consecutively within an interval of
two minutes. Each group is recognized as a single slice order. The rest of the orders in the order book are
considered as regular limit order. We argue that slice orders are used as a hiding (trading) strategy for a large
trader and have different characteristics and implications as opposed to regular limit orders.
If order slicing is a hiding mechanism as we argued, then the next series of questions are – what characterizes
a slice order? Does it exhibit an intra-day pattern? What market conditions encourage traders to hide? Who
wants to hide? and so on. We investigate first three questions in this paper. First we provide a partial
characterization of slice order. The dramatic proliferation of ECNs in the United States and the transition of
many other exchanges such as AMEX, Chicago, Toronto, Euronext, and Paris Bourse to an electronic format
and a billion dollar algorithimic trading industry tell us that this characterization is not trivial. It will help us
to understand how liquidity emerges endogenously through the strategic interaction of informed and large
uninformed traders through their placement of slice and regular limit order in an open limit order book.
Second, we explore the market conditions that encourage traders to submit slice orders.
We examine the limit order book and transaction data of TelAviv Stock Exchange (TASE) for a period of
two months during the year 2006. Choosing TASE for our investigation is important for several reasons.
First of all, due to intense competition and huge investment on proprietary software, large brokerage houses
are unwilling to disclose order flow information and trading strategies applied by these algorithmic
softwares. ECNs only display aggregate order flow information in the Book Viewer. Therefore, order slicing
strategy on the electronic limit order markets in the US is unobservable. On the other hand, TASE allows us
to see uncompiled individual order flows as they arrive. As a result, every order coming to the exchange can
unambiguously be identified as individual order and viewed in a real time. This allows us to see the order
slicing pattern in the limit order book.
Secondly, we know that both informed and large traders disguise their true order size by (a) partially
exposing their order (iceberg order) (b) frequently canceling and resubmitting their order and (c) slicing their
order into pieces (Harris, 1996). When traders use order slicing and iceberg orders simultaneously to hide
e.g., as in ECNs, it is difficult to separate the impact of order slicing from that of iceberg orders. At TASE
limit order market, every trader must expose his/her order size, this unique setting gives us an opportunity to
assess the impact of order slicing independent of iceberg orders.
4
Lastly, in a limit order market with market makers, order flows are continuously scrutinized by them and
they make money by smoothing the order imbalance. Therefore, any order submission strategy to hide the
order size is likely to be revealed and adjusted into price at a faster speed in those markets. ‘No market maker
environment’ of TASE provides a controlled environment to observe the price impact of order slicing and
information adjustment process which is difficult to observe in some other markets with market makers like
Paris Bourse or Euronext.
Tel Aviv Stock Exchange (TASE) data set gives us a unique opportunity to identify a group of orders defined
as slice order which may well be used to hide the order volume of large traders. Having a successive flow of
three or more orders of same size and price within an interval of two minute is unlikely to arrive from
different traders. We argue that these orders arrive from the same trader and are used as a strategic tool to
achieve best execution or to reduce price impact of their large orders. We find support that slice orders
indeed have some special characteristics.
Slice orders are observed in most liquid stocks of TA100. We identify that the slice orders are aggressively
priced and hit the transaction most of the time. The slice orders have shorter life span. Specially, the duration
of unfulfilled slice orders is 28 minutes 34 seconds, much lower than the duration of regular unexecuted limit
orders. Slice orders also improve the fill rate of partially executed orders. We find an increasing intra-day
pattern in slice order submission, more prevalent at the end of continuous trading session. This type of
pattern may emerge when institutional traders strategically hide at the end of the day by using slice orders.
Since the professional money managers’ performance is evaluated at the closing price, they may also like to
delay their trade till the end of the day. Order imbalance in the short run and a higher percentage of
impatient traders from the opposite site in the long run increase the probability of observing a slice order.
The depth at the same and opposite side increases the probability of a slice order incident. On the other hand,
trade volume has an inverse effect.
The probability of observing a buy slice order is on an average 33% higher than that of a sell order. The
probability of observing a buy slice order is significantly influenced by more market condition variables than
that of a sell slice order. The average execution price of a buy slice order compared to a hypothetical market
order is also much lower. Our result is also consistent with the empirical findings that traders’ perceived
price impact of a large buy order is greater than that of a large sell order.
This paper continues with a literature overview in Section II. A brief description of TASE market is included
in section III. Data and sample construction to identify slice orders are provided in section IV. The
characterization of slice orders and descriptive statistics are provided in Section V. Section VI develops
5
predictions about the market conditions that encourage traders to place slice orders and presents the results.
Section VII concludes the paper.
II. LITERATURE REVIEW
The earlier literature argues that informed traders would prefer market orders because benefit of immediate
execution outweighs the cost of a worse price. By contrast, liquidity traders are more patient and wait for an
opportunity to trade at a better price (Rock, 1990, Glosten, 1994, Seppi, 1997). However, informed traders do
prefer limit order when prices deviation from fundamentals is wide (Angel, 1994, Harris, 1998), when
transitory volatility is higher and spread is wider (Handa and Schwartz, 1996) and when private information
is long-lived (Kaniel and Liu, 2004). Thus, limit order choice by informed traders may be influenced by
other market parameters. However, those studies are set up (except Kaniel and Liu, 2004) in a traditional
market structure.
There is a new strand of literature on electronic limit order books that does not take traditional roles of order
types and trader groups as given but examines how their respective roles change in pure electronic markets
(Bloomfield, O'Hara and Saar, 2005; Hasbrouck and Saar,2004; Kaniel and Liu, 2004). Those studies show
that role of limit order traders in the market place can no longer be characterized as uninformed and patient
suppliers of liquidity. While Hasbrouck and Saar (2004) finds that limit order can be aggressive, Bloomfield,
O'Hara and Saar (2005) investigates the role of informed traders in providing liquidity.
Some of the recent models on a limit order market also support the notion that limit orders are not
homogeneous. An experimental study by Bloomfield, O'Hara and Saar (2005) in a pure order driven market
provides strong evidence that informed traders actively use limit orders and their limit order choice depends
on several market conditions. This result is certainly in contrast with traditional view. With the advantage of
the experimental setting (controls the degree of information each trader posses), their study includes both
informed and uninformed traders and finds that use of limit order by informed traders is also time-varying. It
implies that limit orders may carry information. Hasbrouck and Saar (2004) identify a particular type of limit
order called “fleeting orders” that seek for immediacy of execution in different trading venues. In that sense,
fleeting limit orders are closer substitutes to market orders. So the question that arises is what purpose a limit
order serves beyond the traditional role as a provider of liquidity? We argued earlier that slice orders are used
as a as a strategic tool by the traders in a pure order driven market.
A large strand of theoretical literature investigates strategic behavior of the traders. A lot of models suggest
that traders incorporate strategy by changing trade size and splitting their orders. However, none of
6
theoretical models suits our purpose. We cannot generate predictions from those models. Therefore, we set
forward to characterize slice order to improve our understanding of this type of order.
III. MARKET STRUCTURE AND STATISTICS ON TEL-AVIV STOCK EXCHANGE
Tel Aviv Stock Exchange (TASE) is an electronic order driven market that supports anonymous trading. This
market operates without any designated market maker or floor traders. A limit order allows a trader to trade
a certain amount at a given price. Traders post limit (buy and sell) orders to an electronic trading system.
Limit orders are executed according to time and price priority. At a given time, a buy (sell) orders with
highest (lowest) quote receives first priority in execution. If two or more limit orders are at the same price,
time priority is in effect. A priority can only change if a trade occurs. Every trader has equal access to
trading opportunities in the market and can view three levels of best bid and ask prices and quantities of the
book and last few transactions. The status of the book - order arrival, cancellation or execution- is updated
instantaneously on the screen. TASE does not allow any hidden order. Traders can also place market orders.
However, market orders comprise a very insignificant portion of total daily order flow of the market.
Trading on TASE is composed of three phases. First phase is call auction which starts at 9:30 am in order to
facilitate the price discovery process. Continuous trading phase covers from 9:45 am to 16:45 pm. Then there
is a closing phase between 16:45 pm to 17:00 pm. Exchange opens at 8:30 am with an empty order book. It
allows traders to submit their market or limit orders till 9:45 am. Three best bid and ask prices on each side
are displayed from 9:00 am. At 9:45 am all the orders in the book are crossed using call auction. Then the
market moves on to continuous phase, which is a pure limit order market. The orders line up in sequence as
they arrive in the market. Transaction occurs when a trader from opposite side hits the quote. In the closing
phase, market orders are executed, if possible at the closing price. All unexecuted orders are cancelled at the
end of the trading day. In addition to that, some orders are cancelled actively by the traders. The next
morning again begins with an empty order book.
Investors can place limit order at any price within a prespecified price range defined by the tick size. For
prices below 5, 50, 500 Shekel (the currency), tick size is 0.001, 0.01 and 0.1 Shekel respectively. For prices
above 500 Shakel, tick size is 1 shakel. There is no round lot restriction; however, there is minimum order
volume requirement.
TA100 is the major index in the market. TA25 is the index for largest 25 companies. Some of the stocks are
cross listed in NASDAQ. Last one hour of TASE trading session overlaps with NASDAQ trading everyday
except for Sunday and Friday.
7
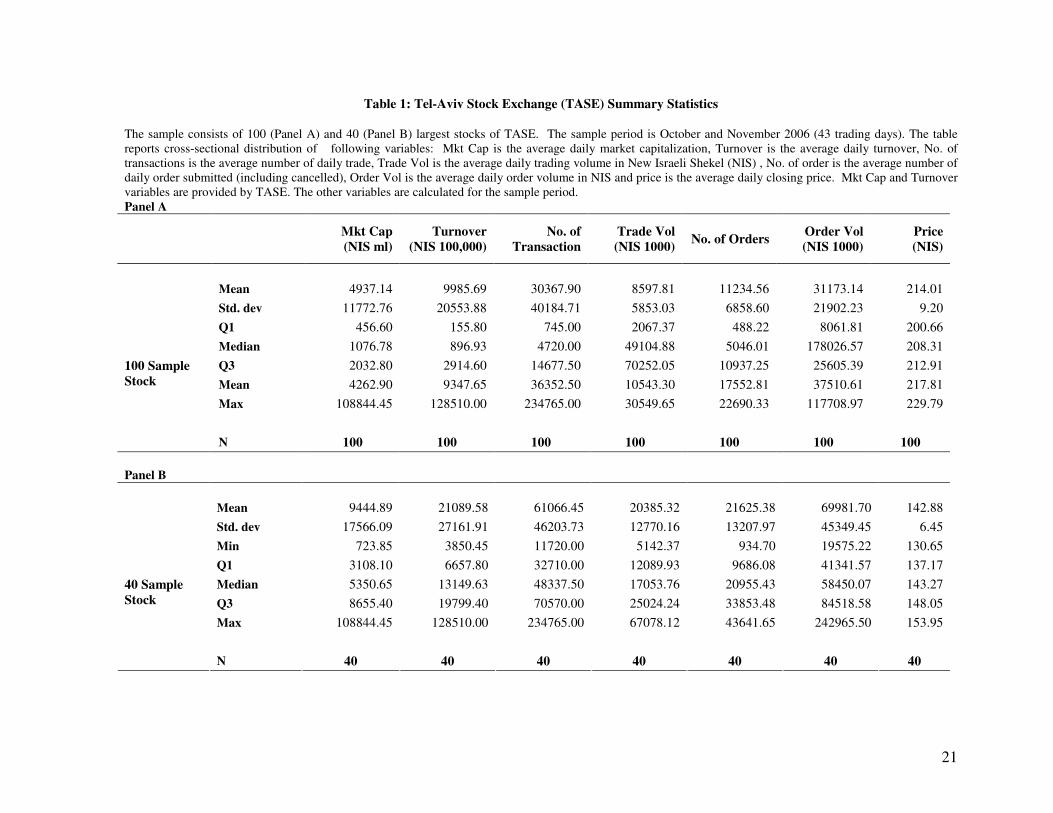
Table 1 reports cross-sectional average of market capitalization, turnover, order flow and trading statistics of
largest 100 and 40 stocks respectively for October and November, 2006. The stocks are ranked by their
average trading volume in the sample period. We first compute the daily estimates for each stock and then
report summary statistics across firms. The average daily volume of limit orders is NIS 31.173 million
thousands and NIS 69.98 million for TA100 and top 40 stocks respectively. Average daily order and trading
volume is higher for top 40 stocks as expected. Order volume is on an average 3.5 times higher than trading
volume shown both in Panel A and B. The ratio of order volume to total number of orders is much higher
compared to the ratio of trading volume to the number of transactions revealing that TASE is not a very deep
market.
IV. DATA AND SAMPLE CONSTRUCTION
A. Data Set
The data set contains the order book and transaction record and three best bid and ask records from the limit
order book for TA100 (Tel Aviv) stocks. The sample covers all 43 trading days from October to November
2006. For each order, data set provides information about order submission time, price, quantity ordered,
order quantity met, status of the order placed, cancellation time if the order is cancelled. For a cancelled and
resubmitted orders, it also gives information about resubmission time, new order number, price, quantity,
order quantity met from resubmission. Transaction file provides transaction time, price and quantity for each
stock on each side. Limit order book provides real time information on first three best bid and ask prices and
quantities.
This is a unique data set as we directly observe each order placement with price, quantity, side, time and
status. Status details the state of execution - if an order quantity is fully executed, partially met, waiting to be
filled, cancelled and/or resubmitted. Traders do not observe the information about the order flow. Only
exchange can monitor or supervise the order flow to ensure that everything is running smoothly.
B. Construction of Slice Order Sample
We are interested in identifying order submission strategy, particularly, order slicing in the context of a pure
limit order market. Hence, our sample considers order flow information only from continuous phase. We
analyze continuous order flow to identify the orders that arrive on the same side one after another with equal
size and price within an interval of two minutes. We develop a filter rule to separate those successive orders
from the rest of the limit orders. We consider each group of successive order as a single observation or
8
incident. We keep slice order with 3 or more pieces for our analysis. The median number of pieces in an
average slice observation is 4. The highest number of successive pieces observed in the sample is 78 with
partial execution. Median slice order size ranges from 490 to 2000 units in shares cross-sectionally. Since the
traders are anonymous, we cannot claim for sure that the orders are coming from the same trader. However,
observing the types of incidents are likely to be non-coincidental. Characterization of slice order in the
subsequent section also provides some interesting findings suggesting that slice order might be of a special
type of orders.
1. Issues with Order Cancellation
The observations applying filter rule have 20.00% orders that are cancelled at some point in time without
execution. We want to see if the cancellation is voluntary by the trader or due to some system fault. We
assume that if the cancellation appears to be between 2 to 10 second of submission, then it is due to system
fault. The rationale is that traders are not as quick as the system to cancel their order and they do not have
any apparent incentive to do that. Also if the cancellation is due to system fault, then orders are more likely
to be resubmitted.
About 0.21% of cancelled slice orders are cancelled within 2 seconds and only 0.01% of them are
resubmitted. About 0.67% of orders are cancelled and resubmitted within 10 seconds. We also look at the
orders that are cancelled and resubmitted within 30 seconds and 1 minute respectively and find cancelled and
resubmitted orders increase in proportion of total observations – 1.96% and 3.20% respectively. The
statistics suggests that most of the cancelled orders are cancelled by the trader and can play an important role
in their order submission strategy. Therefore, we include cancelled slice orders in our sample.
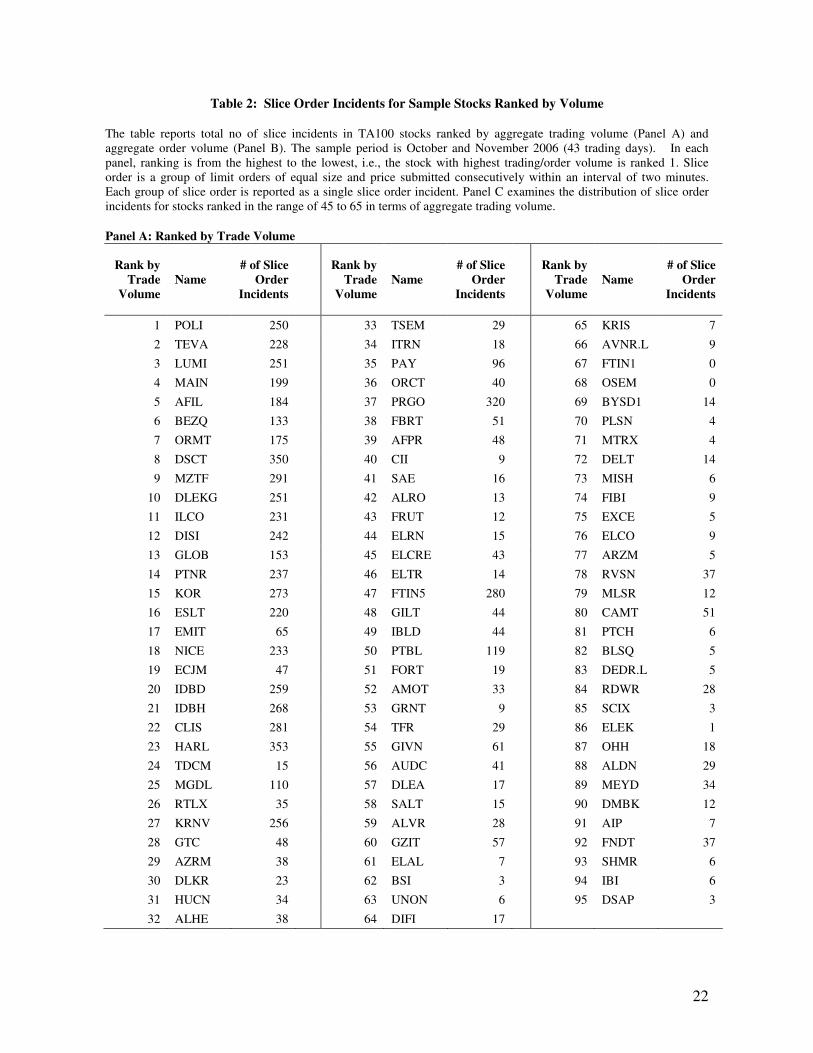
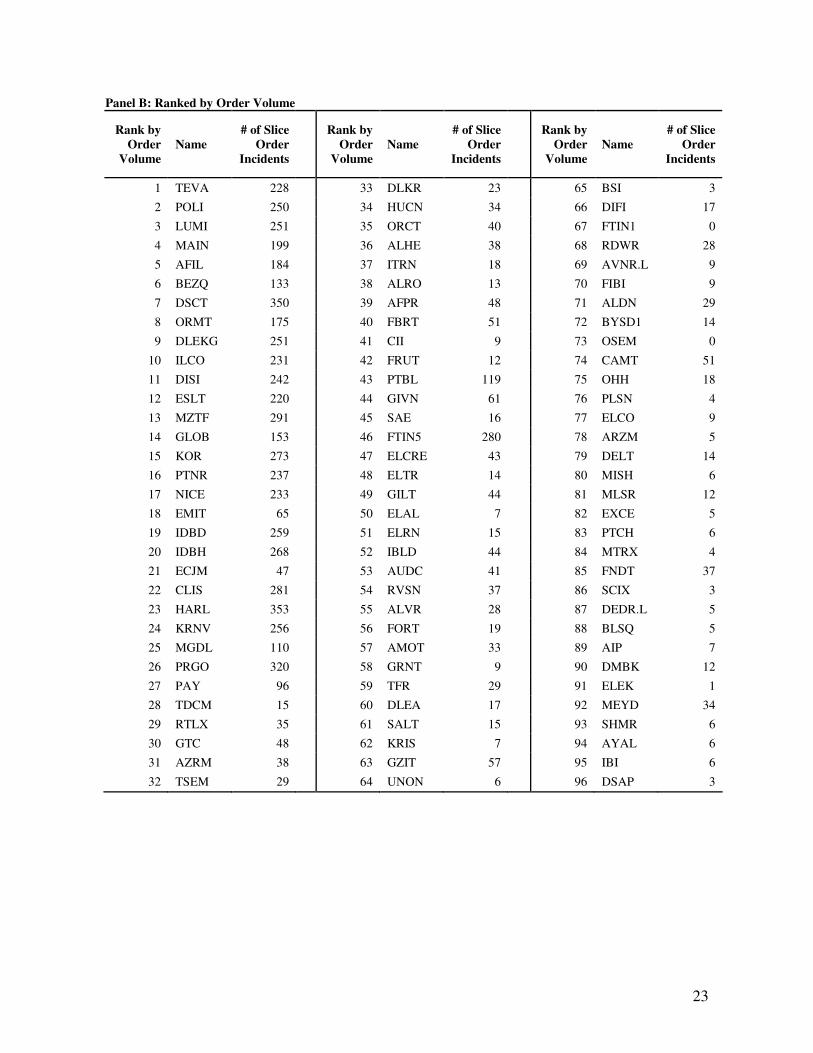
2. Selection of Sample Stocks
Initially we run some descriptive statistics on 96 stocks that are listed in TA100 index during the period from
October to November 2006 to see if slice orders are more prevalent in some categories of stock. We find
wide presence of those types of orders cross-sectionally. Then we rank sample stocks based on aggregate
trading volume and order volume for the sample period and calculate total slice order incidents for each
stock. Panel A and B of Table 2 present the statistics. Each group of slice order is viewed as a single
incident. The table shows that the raking of the stock and the occurrence of slice order incidents are
correlated. Most of the incidents are observed for stocks with high trading and order volume suggesting that
slice order is a phenomenon mostly observed in liquid stocks. Some of the stocks that are ranked between 45
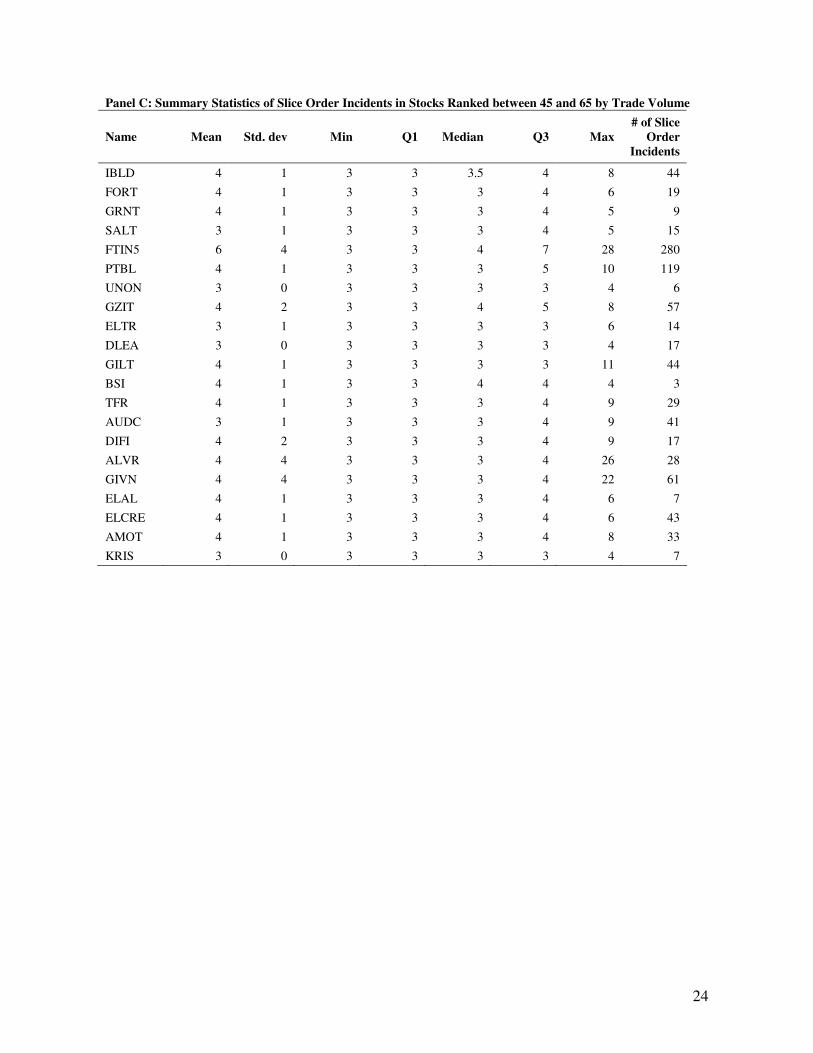
and 65 show relatively high incidents of order slicing. Panel 3 reports distribution of slice order incidents for
each stock in this category. For most stocks the number of slicing at third quartile is 4. The maximum figure
is an extreme incident for those stocks. It suggests that there is no systematic order slicing for stocks in this
9
category. Therefore, we decide to confine our sample to top 40 stocks with the advantage that the sample
provides reasonable variability in the trading volume.
V. PRELIMINARY CHARACTERIZATION OF SLICE ORDER
A. Comparative Statistics on Regular vs Slice Order
As defined earlier, slice order is a group of limit orders of equal size and price submitted consecutively
within an interval of two minutes. Each group is treated as a single slice order observation. Rest of the limit
orders are classified as regular orders. Each order, given that it is a slice or a regular order, is again classified
as a limit and marketable limit order. Marketable limit order is a buy/sell order whose limit price is equal to
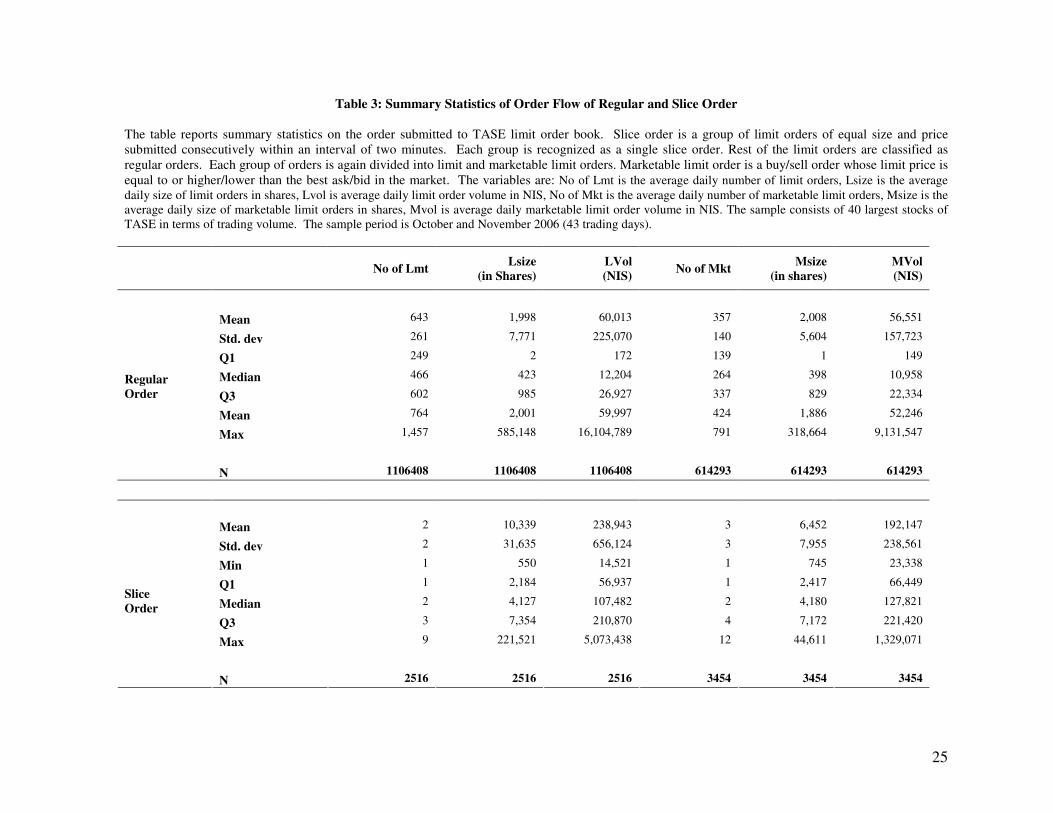
or higher/lower than the best ask/bid in the market. Table 3 presents the statistics on the number, size in
shares and volume of each category of orders. The description of variables is as follows. No of Lmt is the
average daily volume of limit orders, Lsize is the average daily size of limit orders in shares, Lvol is average
daily limit order volume in NIS (New Israeli Shekel), No of Mkt is the average daily number of marketable
limit orders, Msize is the average daily size of marketable limit orders in shares, Mvol is average daily
marketable limit order volume in NIS. All the statistics in this subsection are computed for 40 sample stocks
for 43 trading days in October and November 2006.
There are total 2516 slice order observations in the sample. On an average, the number of slice orders that
are submitted daily is much lower than the number of regular orders both in the limit (defined as LMT) and
marketable limit category (defined as MKT). However, the volume of slice order is phenomenally higher
than that of a regular order. The average daily LMT slice order volume is NIS 238,943 compared to LMT
regular order volume of NIS 60, 013. The pattern is similar for marketable orders. Though large enough, the
order size of a typical MKT slice order is less disproportionate to that of a MKT regular order. On the other
hand, the order size of an average LMT slice order is 10,339 shares compared to 1,998 shares for a LMT
regular order.
B. Aggressiveness of Slice Order
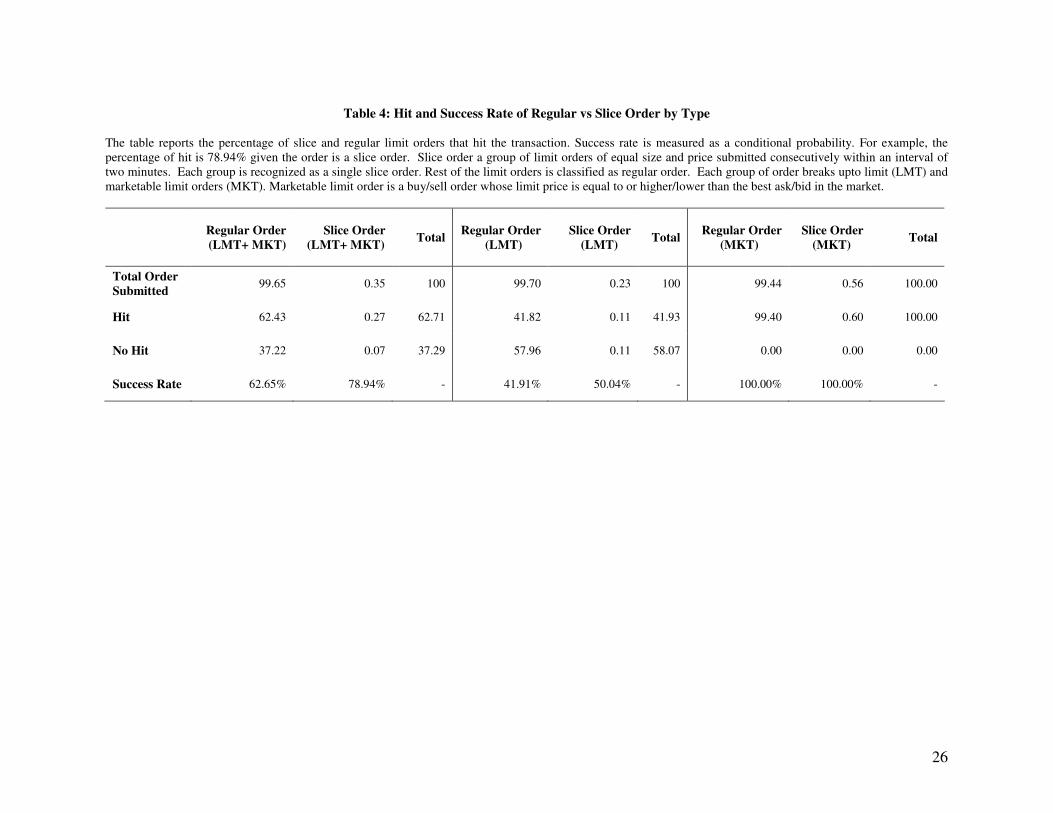
Table 4 reports hit statistics and success rate of regular and slice order. Slice orders constitute only 0.35% of
total order flow in the period from October to November 2006. A higher proportion of slice order (0.56%) is
submitted as MKT orders compared to as LMT orders (0.23%). A large percent of slice order are priced
inside the quote and reflects urgency for execution. About 63.72% of all orders hit the transaction. Slice
orders comprise about 17% (0.27% of 63.72%) of hit orders. Noticeably, a very high percentage of slice
10
orders hit the transaction as shown by the success rate. Success rate is measured as a conditional probability.
For example, the percentage of hit is 78.94% given the order is a slice order. On the other hand, the success
rate of a regular order is 62.65%. The success rate for a sliced order is 26% higher than that of a regular order
due to the fact that a higher proportion of slice orders arrive as MKT orders.
Total limit order flow that hit the transaction is 41.93%. LMT slice comprises (0.11% of 41.93%) about 4%
of that flow. MKT slice orders that hit the transaction comprise 0.60% of the total marketable order flow.
They hit the transaction all the time. The success rate for LMT slice is also higher (50.04%) than that of a
LMT regular order (41.91%). Slice orders seem to be more aggressive and have higher success rate
compared to a regular order.
The magnitude of successful hit by slice orders compared to their presence in the order flow is
distinguishable from Table 4. Another interesting phenomenon is the cancellation statistics of slice order.
About 98% of the unfulfilled slice orders are cancelled within one hour and 91% of them are cancelled
within three minutes of order submission (not reported in the table). Unfulfilled and cancelled slice orders
also reflect upon the aggressive nature of slice orders.
C. Fill Rate of Slice Order
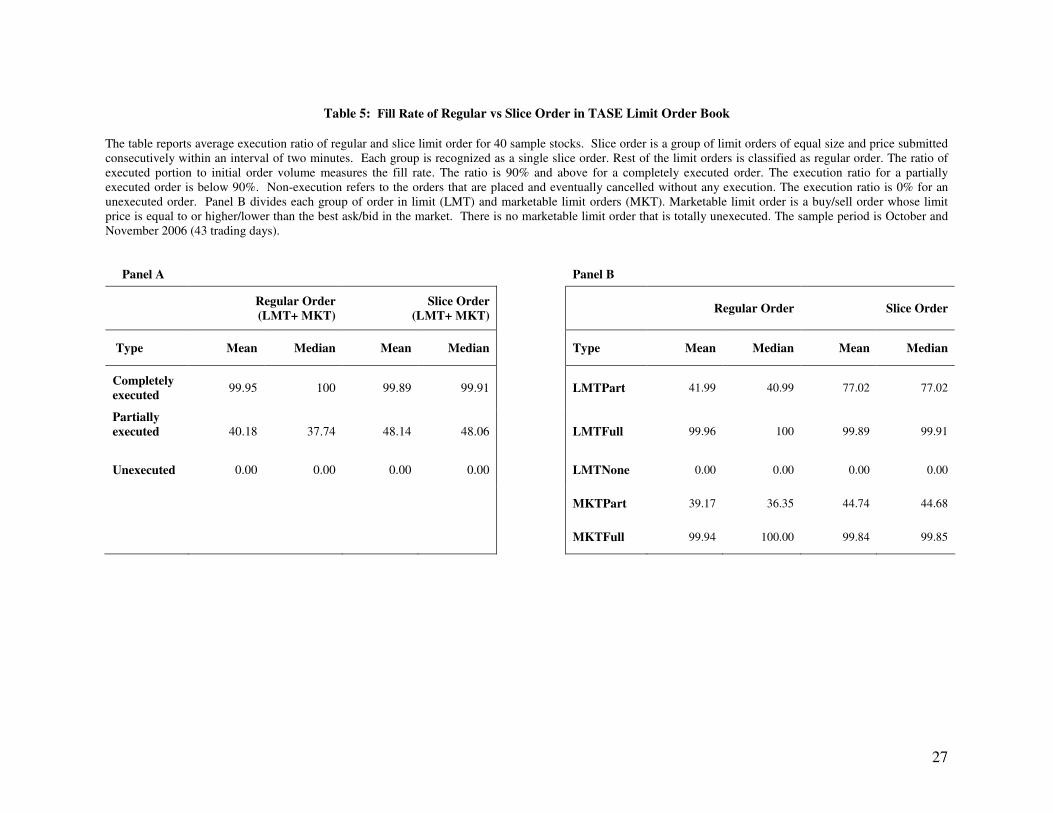
The fill rate for an order is the ratio of total order volume fulfilled to total order volume submitted. The
classification scheme is as follows. Completely executed order has a fill rate of 90% or above. The execution
ratio for a partially executed order is below 90%. Unexecuted orders are placed and eventually cancelled
without any execution. The execution ratio is 0% for an unexecuted order. Table 5 reports the fill rate for
slice and regular order. The fill rate of completely executed orders is almost same for slice and regular order.
However, slice orders seem to be more effective in filling a partially executed order. The average fill rate of a
slice order is 48.14 % compared to 40.18% fill rate of a regular order as shown in Panel A. Panel B also
reveals that fill rate of partially executed slice orders, either LMT or MKT orders, is higher than that of a
regular order. Specially, the average fill rate of partially executed LMT slice order is strikingly high
(77.02%) compared to 41.99% for LMT regular order. Slice orders improves the fill rate of a LMT order.
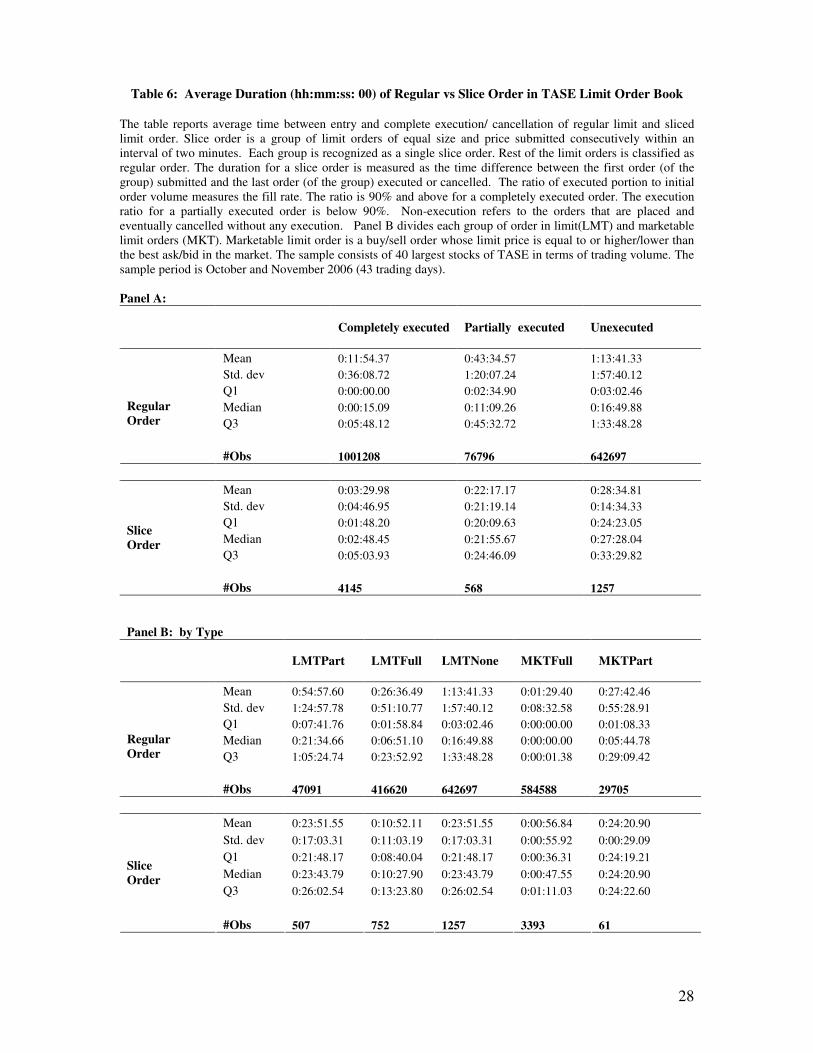
D. Execution Duration of Slice Order
The execution duration is the average time between order submission and execution or cancellation. We can
directly measure the duration of each order from the data set. The duration for a slice order is measured as
the time difference between the first order (of the group) submitted and the last order (of the group) executed
11
or cancelled. Full, partial and non-execution are defined as before. Panel A of table 6 reports the cross
sectional average duration for each order category. The mean duration of a fully filled slice order is 3 min 29
seconds while the mean duration is 11 min 54 seconds for a regular order. Full execution of a slice order
takes one fourth less time compared to an average regular order. The median value for a fully executed
regular order is lower than that of a slice order. This is because regular order duration is calculated per order
basis while slice duration is calculated from the beginning to the end of a slice consisting of several orders.
The median for a non-executed regular order is lower as most of them are cancelled by the system. However,
the standard deviation of duration of a slice order is much lower suggesting that there is lower variation in
cross sectional duration for this type of order. Panel B describes the duration by order type – LMT or MKT.
Overall pattern is similar to Panel A.
Looking at the execution time between entry and complete execution or cancellation of slice order one can
state that traders check the status of their slice orders frequently and cancel them if prices move away from
the limit price. This observation is also consistent with the fact that 98% of the unfilled slice orders are the
cancelled ones.
E. Intra –Day and Weekly Pattern in Slice Order
We analyze the intra-day pattern in regular and slice order flow in terms of number and volume of orders.
We measure the flow in each 15-minute (Figure 1) and 90-minute (Figure 2) trading intervals during the
continuous trading phase from 9:45 am to 5:15 pm for the sample period for 40 stocks. Frequency of regular
order exhibits a U-shape pattern while frequency of slice order depicts an increasing curve reaching at the
peak at the end of the continuous trading phase.
Intra day pattern of order flow is also observed in Paris Bourse. Biais, et al (1995) suggests that intra day
pattern could reflect strategic investors splitting their order during the day and unwinding the remaining
exposure at the end of the day in the hidden order market. The pattern might also arise when institutional
investors such as mutual fund, who are likely to be evaluated at the closing price, try to execute a large
portion of their bulk order at the end of the day. The pattern may also emerge due to the trading of the cross
listed stocks at the end of the day both at TASE and NASDAQ.
In addition to analyzing order specific characteristics, we also explore intra-day pattern of various market
conditions variables such as order volume, trade volume, volatility and spread. We calculate each of the
variables for 90-minute and 15-minute trading intervals during the continuous trading phase from 9:45 am to
5:15 pm. Order volume is the log of the average order volume submitted during each interval. Trade volume
12
is the log of the average volume traded during each interval. Spread is the log of inside quoted spread before
the order is submitted. Volatility is the average of price range scaled by the range midpoint at each trading
interval.
Intraday order volume, trade volume and volatility exhibits U-shape pattern as depicted in Graph 4 and
Graph 6. NIS spread is very high at the beginning of the trading interval and falls to a consistent level as the
day passes. Spread slightly increases at the end of the trading interval but is much lower than the spread at
the start of the day. The theoretical models suggest that intra-day pattern arises from information asymmetry
and/or trading opportunities at closure of the market. Literature also suggests that institutional traders can
influence the intraday variation in volume and prices. Obizhaeva and Wang (2005) develop a model for
execution strategy for institutional traders in the limit order market. The model implies large trade at the
beginning and at the end of trading period. According to their paper, we might observe a U-shape pattern in
order and trade volume if institutional traders’ trade horizons coincide with a trading day.
We also look at the weekly pattern of regular and slice order for a better understanding of the purpose of a
slice order. Sunday is the first day and Thursday is the last day of the trading week for TASE. Hence we do
not observe any simultaneous trading in TASE and NASDAQ during these two days. Figure 3 exhibits that
the frequency of slice order is also lower at the beginning and at the end of the week while regular order flow
increases in the midweek. Weekly pattern may be due to cross-listed stock trading at the mid week and/or
institutional investors’ trading horizon coinciding with the midweek. The significance of these patterns is
tested in the next section by employing statistical models.
VI. EMPIRICAL TESTS AND RESULTS
The initial characterization of slice order suggests that cross sectional pattern of slice order differ from that of
a regular limit order. In this section we employ more formal tests to see what type of market conditions
increase/decrease the probability of observing a slice order. We use a binomial Logit model for two
categories of order (regular and slice) with indexing i = 0, 1 corresponding to the categories. The probability
of event i for stock j is:
ij
j
jiX
P
Pβ=
,0
,log
for i= 0,1 where Xj is the vector of explanatory variables. The probability of slice order incident is modeled
relative to the probability of occurrence of a regular order.
13
A. Explanatory Variables and Predictions
The following explanatory variables are used in the model. The variables are defined for a buy side order.
OppMKT and SameMkt are the ratio of the monetary value of sell and buy market orders to the total
monetary value of sell and buy orders respectively. These variables proxy for impatient traders in the market.
A higher proportion of OppMKT would imply more impatient sellers who would place marketable limit
orders. Since slice orders are relatively aggressive in nature and seek immediate execution, higher proportion
of impatient trader on the opposite side would increase the likelihood of observing a slice order.
DepthSmVol and DepthOppVol are the log of monetary size of the depth at the best bid and ask respectively.
According to Parlour (1998), as depth of the opposite side (sell) increases, there are more competition among
sellers implying the likelihood of a marketable sell order. Therefore, we predict that DepthOppVol has a
positive effect on the probability of observing a sell slice order. A higher depth on the same side forces
liquidity traders to price more aggressively and as they also demand immediacy, the occurrence of a slice
order should also increase.
Imbalance is the difference in the monetary value of the same side and the opposite side orders scaled by the
total monetary size of orders. Imbalance is positive if sell side order volume is larger. From a buyer’s
perspective, if imbalance is positive then average duration of his order should decline. Hence likelihood of a
buy slice order should increase. The prediction is symmetric for a sell slice order.
DepthNtrd is the sum of net number of newly placed limit order and the orders that are unexecuted in the last
interval. The net number of newly placed limit order is the difference between the number of newly placed
limit order and the limit orders that are executed at a given interval. Sdepth and Bdepth are sell and buy side
depth of DepthNtrd variable. DepthNtrd is an alternative measure of market depth based on the number of
transactions, not on volume. Since the slice order is characterized by a number of successive order
submissions and transactions, higher DepthNtrd at a given interval may arise because of a large trader
splitting his order evenly or unevenly. If this is indeed the case, then this big order will eat up the liquidity
and decrease the probability of observing a slice order in the subsequent period.
We use two types of volatility measures. Volatility1 is the average of price range scaled by the range
midpoint at each trading interval. Volatility2 is the squared return from a transaction of a stock at a given
interval summed over all the transactions at that interval. Foucault (1999) develops a model that shows that
when volatility increases, the probability of being picked-off by an informed trader also increases. Hence
14
limit traders post limit price away from the reservation price. Therefore, when the volatility is high limit
orders are less price aggressive. On the other hand, when volatility is high, a limit order is likely to be hit
shortly after submission. Slice orders are both price aggressive and has a quicker execution. We are not sure
which of the two effects will dominate. Hence we do not have a prediction for the effect of volatility on the
probability of observing a slice order.
Retmmt is the return over the preceding interval for a buy order and negative return over the preceding
interval for a sell order. This variable measures the price change in the direction of the order. The variable is
also used in Hasbrouck and Saar (2004) in analyzing fleeting orders on Islands. When price is moving in the
same direction as the trading intention, we should observe more aggressive orders to avoid the risk of
missing the market. Therefore, we expect a positive relation between Retmmt and the probability of a slice
order event.
TradeVol is the log of the volume traded. Empirical evidence shows that volumes are auto-correlated. High
volume in the preceding period increases the likelihood of higher volume in the next period. This pattern is
due to the fact that when new information arrives in the market, the adjustment process takes time. Specially,
if a trader is splitting his order because he possesses some private information, the adjustment process is even
slower. Therefore, if the trading volume is high in the previous period, likelihood of observing a slice order
should increase in the next period.
OrderVol is the log of the order volume submitted. This variable proxy for the arrival rate of traders
(Foucault, Kadan and Kandel, 2004). Higher order volume in the previous period should reduce the duration
of an order in the limit order book. So we expect a positive relation between OrderVol and slice order
incident.
Duration is the time between entry and execution (cancellation) for each order. Duration is positively related
to the probability of observing a slice order.
Other stock specific control variables are Osize, TickSprd, DailyVol, Logmidpoint, Open_price, daytime
and weekday. Osize is the log of order volume submitted. TickSprd is the spread scaled by tick size.
DailyVol is the log of average daily volume for each stock. Logmidpoint is the average of best bid and ask.
Open_price is the average opening price for each stock calculated for the sample period. Four different
daytime intervals are chosen for empirical investigation – 15 min, 30 min, 45 min and 60 min. Sell,
Tradeside, TA25, Dual, Simult, Rquote, Tk1ind are dummy variables. Sell is 1 if the order is a sell order.
Tradeside is 1 if the last transaction and current order is from buy side. Tradeside also proxy for order
15
imbalance. TA25 is 1 if the stock is included in TA25. Dual is 1 if the stock is traded in NASDAQ. Simult is
1 for a dual stock in a simultaneous daytime interval. Rquote is 1 if a quoted price is a round number. Tk1ind
is 1 if TickSprd is greater than 1. In the Logit regression the reference point for all dummy variables are
zero. Last trading interval and the last day of the week are the reference points for daytime and weekday
statistics.
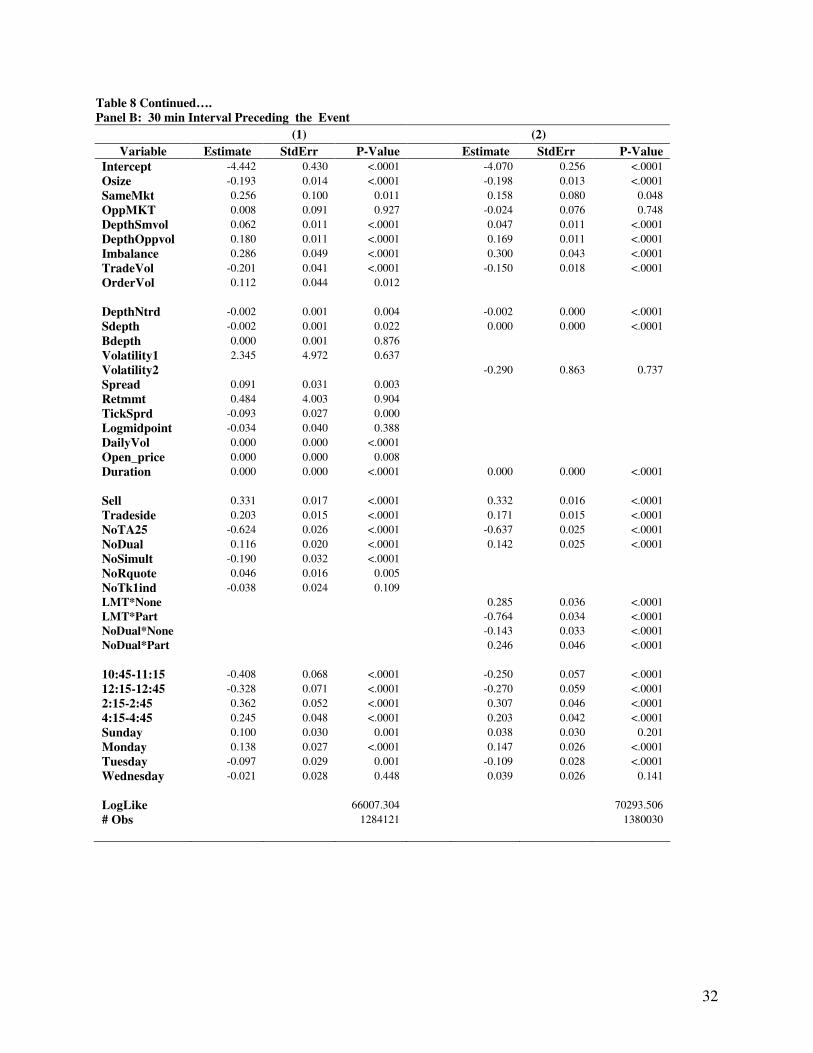
SameMkt, OppMKT, Imbalance, TradeVol, OrderVol, DepthNtrd, Sdepth, Volatility1, Volatility2, Retmmt
are measured in the preceding 15 min, 30 min , 45 min and 60 min intervals before the event interval and
reported in Panel A, Panel B, Panel C and Panel D of Table 8. (1) and (2) of each panel report the result
from two separate Logit models. Daytime interval variables are not reported if they are not significant. Slice
order is grouped as one order. Every order is assumed to be independent. We also assume that there is an
equal likelihood of observing a buy and a sell order. All variables are calculated for each of the 40 stocks
over the sample period of October and November, 2006 (43 trading days).
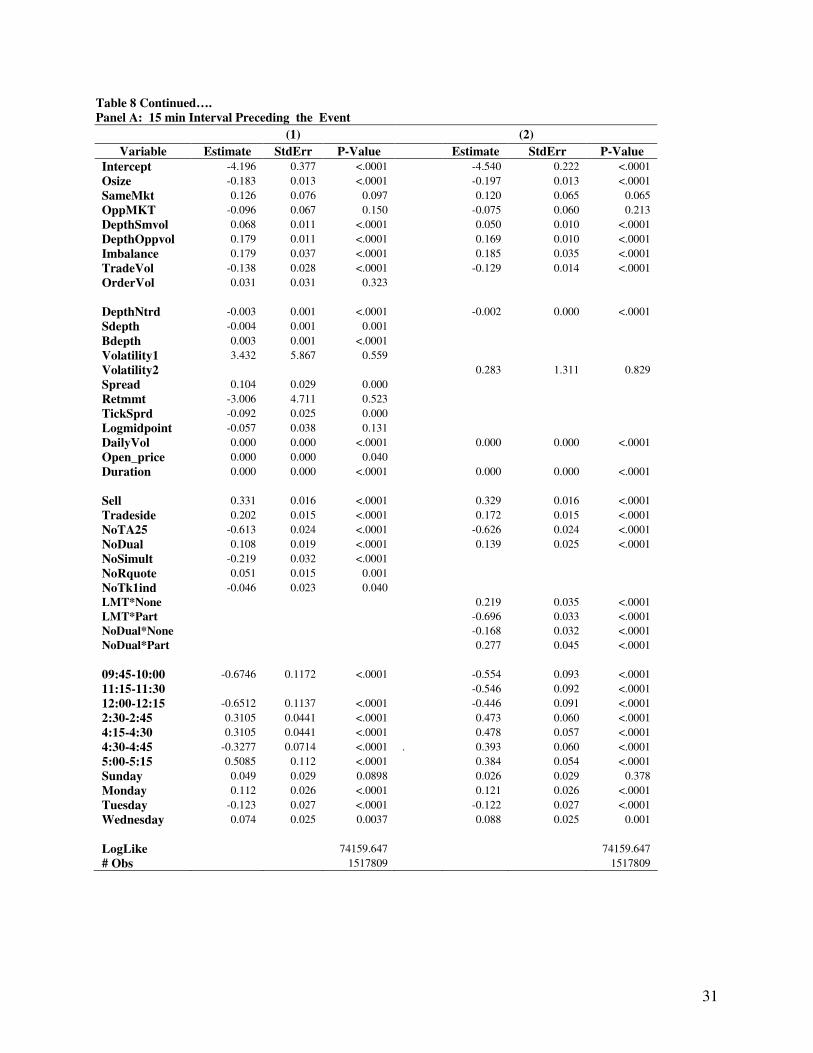
B. Results
Table 8 reports the result of first sets of regressions. The significant variables are DepthSmVol,
DepthOppVol, Imbalance, TradeVol, DepthNtrd, Duration and they all have the predicted signs. Volatility
and Retmmt have no significant influence on the probability of slice order event. We use two different
measures of volatility in two separate regressions and get similar results.
Osize and dailyVol are two control variables that affect slice order probability significantly, the former
inversely and the later positively. The probability of observing a slice order increases if it is a buy order or
initiated by a buyer when the last trade is a buy, is included in TA25, is a simultaneously traded stock, or is
not a dual stock. The occurrence of slice order increases for non dual stocks that are partly executed. The
probability of a slice order also increases given it is a LMT order and fully executed. Slice order submission
is significantly lower at the beginning and higher at the end of the trading day and supports intraday pattern
observed in Graph 1 and Graph 2. Probability of observing a slice order is also higher in the midweek.
Theory does not guide us in choosing the appropriate length of the preceding time interval for the calculation
of explanatory variables. If the time interval is too long, the predictive power of the variables that influence
slice order event cannot be captured. On the other hand, if the time interval is too short, there might not have
enough depth in the market to induce traders to submit slice orders. Therefore, we explore the impact of the
variables on the probability of slice order on different intervals. This also allows us to distinguish short term
impact variables from the long term ones.
16
Table 8 reveals that the influence of imbalance disappears if this variable is measured in an interval of more
than 30 minutes. On the other hand, OppMKT is significant if measured in an interval of more than 30
minutes. The coefficient is also positive as predicted earlier. This result is intuitive. Order imbalance of the
near past is relevant to the slice trader if he is impatient. Order imbalance further in the past does not help
him in devising a strategy as he has uncertainty about the type and side of orders that will arrive from other
traders. On the other hand, OppMKT proxy for an impatient trader from the other side. Observing a higher
percentage of impatient traders 45 minutes preceding the event imply that there will be more marketable
limit orders in the opposite side in the subsequent intervals. And since those traders are aggressive, they set
competitive prices. Once the price moves to a desired direction for the sliced order trader, he submits
marketable limit order and achieves faster execution.
Table 8 reports that the probability of observing a buy slice order is on an average 33% higher than that of a
sell order. Therefore, we run Logit regression on buy and sell orders separately. Panel A of Table 9 reports
the results for sell orders. Only significant variables are DepthOppVol , DailyVol and duration with
predicted signs. TradeVol seems to influence if measured at preceding 45-min and 60-min interval and this
variable also has its predicted sign. Panel B reports the results for buy orders. The result exhibits the same
pattern as shown in Table 8. Specially, the switching role of order imbalance and OppMKT in short run and
long run is also prevalent for the buy order case. The traders of a buy slice order seem to be very watchful
about the market conditions before they submit slice orders. This result is particularly interesting because it
is consistent with Keim and Madhavan (1995). In an empirical investigation on institutional trader, they find
that buy orders take longer to execute than sell orders suggesting that the traders perceive that price impact of
a buy order is greater than large sell order. If that is indeed the case, large traders of buy orders have enough
incentive to hide their action by submitting slice orders.
C. Average Execution Price and Return of a Slice Order
Previous empirical research finds an asymmetric price response for a buyer versus seller initiated trade. The
findings in Table 8 and 9 identifies a significant increase in the probability of observing slice order events if
the trade is a buy. This result motivates us to explore average execution price of a slice order and compare it
with an equivalent hypothetical market order. The intuition is as follows. If a large liquidity trader wants to
reduce the price impact on his buy trade, he submits slice order instead of a market order of equivalent size.
Therefore, the execution price of the slice order would be lower than the average execution price of a
hypothetical market order.
17
The hypothetical market order is constructed in the following manner. The size of the hypothetical market
order is equal to the size of a slice order. Execution price of a hypothetical market sell/buy order is the
prevailing best bid/ ask if the quantity attached to the best bid/ask is sufficient to satisfy the limit order size.
Otherwise, execution price is calculated as average price at three best level of bid/ask weighted by order
quantity attached to each level. Totally unexecuted orders are excluded from the sample. The execution price
of a slice order is the limit price. Panel A of Table 10 reports the average execution price of slice and regular
order. The average execution price of a hypothetical market order is NIS 273.45, much higher than the actual
execution price of a slice order, NIS 174.06. Supporting the results from Table 9, we find that execution
price of a buy slice order is much lower (NIS 182.89) than a hypothetical market buy order (NIS 357.17)
while the execution price of a sell order (NIS 209.9) is much closer to the execution price of a hypothetical
market sell order (NIS 246.98).
We also compare the average return after 15 min and 60 min of the trade for slice and hypothetical market
order calculated as a percentage return with reference to best bid/ask at the end of corresponding interval. For
hypothetical market order, return is calculated based on average execution price. A negative return is
calculated for partially executed slice order in the following way:
A = (quantity ordered × execution price of a market order – quantity executed × limit price)
B = quantity ordered × limit price
The negative return due to partial execution = A/B
Net return of a partially executed slice order is the difference between return from trade and negative return
due to partial execution. Panel B of Table 10 reports the average return of a slice order and a hypothetical
market order after 15 minutes and 60 minutes of the trade. The return is negative for both types of orders and
do not change much for two different holding periods. However, return of a slice order is lower than that of a
hypothetical market order. The result might be due to the crude estimate of negative return for partially
executed slice order. Probably we have given more weight to loss than to gain. We plan to explore more on
the price impact of a slice order in the later version of the paper.
D. Robustness Check
We also run Probit regression on table 8 and 9 and get similar results. We also run some tests on dual listed
stocks. The intra day flow of slice orders reaches a peak at the end of the day. This may be due to
simultaneous trading of dual listed stocks in TASE and NYSE or in TASE and NASDAQ as mentioned
before. Dual trading time starts at 4:45 pm TASE time. We check the incidents of slice order only for dual
18
listed stocks. Slice order incident is not that dominant in dual listed stock. Nor the incidents of slice order
increase for dual trading stocks when US market is open.
VII. SUMMARY AND CONCLUSION
Tel Aviv Stock Exchange (TASE) data set gives us a unique opportunity to identify a group of orders defined
as slice order which may well be used to hide the order volume of large traders. We argue that having a
successive flow of three or more orders of same size and price within an interval of two minute is unlikely to
arrive from different traders. We argue that these orders arrive from the same trader and are used as a
strategic tool to achieve best execution or to reduce price impact of their large orders. We find support that
slice orders indeed have some special characters.
Slice orders are observed in most liquid stocks of TA100. We identify that the slice orders are aggressively
priced and hit the transaction most of the time. The slice orders have shorter life span. Specially, the duration
of unfulfilled slice orders is 28 minutes 34 seconds, much lower than the duration of regular unexecuted limit
orders. Slice orders also improve the fill rate of partially executed orders. We find an increasing intra-day
pattern in slice order submission, more prevalent at the end of continuous trading session. This type of
pattern may emerge when institutional traders strategically hide at the end of the day by using slice orders.
Since the professional money managers’ performance is evaluated at the closing price, they may also like to
delay their trade till the end of the day. Order imbalance in the short run and a higher percentage of
impatient traders from the opposite site in the long run increase the probability of observing a slice order.
The depth at the same and opposite side increases the probability of a slice order incident. On the other hand,
trade volume has an inverse effect.
The probability of observing a buy slice order is on an average 33% higher than that of a sell order. The
probability of observing a buy slice order is significantly influenced by more market condition variables than
that of a sell slice order. The average execution price of a buy slice order compared to a hypothetical market
order is also much lower. Our result is also consistent with the empirical findings that traders’ perceived
price impact of a large buy order is greater than that of a large sell order.
19
References: Admati, Anat, and Paul Pfleiderer, 1988, A Theory of Intraday Trading Patterns: Volume and Price Variability, Review of Financial Studies 1, 3-40. Admati, Anat, and Paul Pfleiderer, 1990, Direct and Indirect Sale of Information, Econometrica 58, 901-928..
Angel, James J., 1994, Limit versus Market Orders, Working Paper, Georgetown University, Washington, DC.
Back, Kerry, 1992, Insider Trading in Continuous Time, Review of Financial Studies 5, 387-409.
Back, Kerry, and Hal Pedersen, 1998, Long-lived Information and Intraday Patterns, Journal of Financial Markets 1, 385-402.
Biais, B, P Hillion, and C Spatt, 1995, An Empirical Analysis of the Limit Order Book and the Order Flow in the Paris Bourse, Journal of Finance 50, 1655-1689.
Bertsimas, Dimitris, and Andrew Lo, 1998, Optimal Control of Execution costs, Journal of Financial Markets 1, 1-50.
Bloomfield, Robert and Maureen O'Hara, 2000, Can Transparent Markets Survive?, Journal of Financial Economics, 55, pp 425-59.
Bloomfield, Robert, Maureen O’Hara and Gideon Saar, 2005, The ‘’Make or Take’’ Decision in an Electronic Market: Evidence on the Evolution of Liquidity, Journal of Financial Economics, 75, 165-199.
Degryse, Hans, 1999, The Total Costs of Trading Belgian Shares: Brussels versus London, Journal of Banking and Finance, 23, 1331-1355.
D’Hondt, C., R. De Winne and Fran¸cois-Heude, 2006, Hidden Orders on Euronext: Nothing is Quite as It Seems..., Working Paper, University of Perpignan and FUCaM
Easley, David, and Maureen O'Hara, 1987, Price, Trade Size, and Information in Securities Markets, Journal of Financial Economics 19, 69-90.
Foster, F. Douglas, and S. Viswanathan, 1993, The Effect of Public Information and Competition on Trading Volume and Price Volatility, Review of Financial Studies 6, 23--56.
Foucault, T., 1999, Order Flow Composition and Trading Costs in a Dynamic Limit Order Market, Journal of Financial Markets 2, 99-134.
Glosten, Lawrence R., 1994, Is the Electronic Open Limit Order Book Inevitable?, Journal of Finance 49, 1127-61.
Glosten, Lawrence R., and Paul R. Milgrom, 1985, Bid, Ask, and Transaction Prices in a Specialist Market with Heterogeneously Informed Traders, Journal of Financial Economics 14, 71-100.
Handa, Puneet and Robert A. Schwartz, 1996, Limit Order Trading, Journal of Finance, 51, 1835-1861.
Harris, Lawrence, 1998, Optimal Dynamic Order Submission Strategies in Some Stylized Trading Problems, Financial Markets, Institutions, and Instruments, 7, 26-74.
Harris, Lawrence, 1996, Does a Large Minimum Price Variation Encourage Order Exposure, Unpublished Manuscript, University of Southern California.
Hasbrouck, Joel, and Gideon Saar, 2002, Limit Orders and Volatility in a Hybrid Market: the Island ECN, Working Paper, Stern School of Business, New York University.
Hasbrouck, Joel and Gideon Saar 2004, Technology and Liquidity Provision: The Blurring of Traditional Definitions, Working Paper, Stern School of Business, New York University.
Holden, C. W., and A. Subrahmanyam, 1992, Long-lived Private Information and Imperfect Competition, Journal of Finance 47, 247-270.
Kaniel, Ron and Hong Liu (2004), So What Orders Do Informed Traders Use?, Journal of Business, Forthcoming.
20
Keim, Donald B. and Ananth Madhavan, 1995, Anatomy of the Trading Process: Empirical Evidence on the Behavior of Institutional Traders, Journal of Financial Economics, 37, 371-398.
Kyle, Albert S., 1985, Continuous Auctions and Insider Trading, Econometrica 53, 1315-1336.
Kyle, Albert S., 1989, Informed Speculation with Imperfect Competition, Review of Financial Studies 56, 317-355.
Menkhoff, Lukas and Maik Schmeling, 2005, Informed Trading in Limit Order Markets: Evidence on Trinary Order Choice, Working Paper, University of Hannover, Germany.
Madhavan, Ananth, 1992, Trading Mechanisms in Securities Markets, Journal of Finance 47, 607-641.
Madhavan, Ananth, 2000, Market Microstructure: A survey, Journal of Financial Markets 3, 205-258.
McInish, T. H. and R. A. Wood, 1995, Hidden Limit Orders on the NYSE, Journal of Portfolio Management 21, 19–26.
Obizhaeva, Anna and Jiang Wang, 2005, Optimal Trading Strategy and Supply/Demand Dynamics, Working Paper, Sloan School of Management, MIT.
Pardo Ángel, and Roberto Pascual, 2006, On the Hidden Side of Liquidity, Working Paper, Universidad de Valencia, Spain.
Parlour, C., 1998, Price Dynamics in Limit Order Markets, Review of Financial Studies 11, 789-816.
Rock, K., 1990, The Specialist’s Order Book and Price Anomalies, Unpublished Working Paper, Harvard University, Graduate School of Business.
Sandas, P., 2001, Adverse Selection and Competitive Market Making: Evidence from a Pure Limit Order Book, Review of Financial Studies 14, 705-734.
Seppi, Duane J., 1997, Liquidity Provision with Limit Orders and a Strategic Specialist, Review of Financial Studies, 10:1, 103-150.
Tkatch, Isabel, Eugene Kandel, 2005, Demand for Immediacy: Time is Money, Working Paper, Georgia State University.
Tuttle, Laura, 2006, Hidden Orders, Trading Costs and Information, Working Paper, Fisher College of Business, Ohio State University.
21
Table 1: Tel-Aviv Stock Exchange (TASE) Summary Statistics The sample consists of 100 (Panel A) and 40 (Panel B) largest stocks of TASE. The sample period is October and November 2006 (43 trading days). The table reports cross-sectional distribution of following variables: Mkt Cap is the average daily market capitalization, Turnover is the average daily turnover, No. of transactions is the average number of daily trade, Trade Vol is the average daily trading volume in New Israeli Shekel (NIS) , No. of order is the average number of daily order submitted (including cancelled), Order Vol is the average daily order volume in NIS and price is the average daily closing price. Mkt Cap and Turnover variables are provided by TASE. The other variables are calculated for the sample period. Panel A
Mkt Cap
(NIS ml)
Turnover
(NIS 100,000)
No. of
Transaction
Trade Vol
(NIS 1000) No. of Orders
Order Vol
(NIS 1000)
Price
(NIS)
Mean 4937.14 9985.69 30367.90 8597.81 11234.56 31173.14 214.01
Std. dev 11772.76 20553.88 40184.71 5853.03 6858.60 21902.23 9.20
Q1 456.60 155.80 745.00 2067.37 488.22 8061.81 200.66
Median 1076.78 896.93 4720.00 49104.88 5046.01 178026.57 208.31
Q3 2032.80 2914.60 14677.50 70252.05 10937.25 25605.39 212.91
Mean 4262.90 9347.65 36352.50 10543.30 17552.81 37510.61 217.81
Max 108844.45 128510.00 234765.00 30549.65 22690.33 117708.97 229.79
100 Sample
Stock
N 100 100 100 100 100 100 100
Panel B
Mean 9444.89 21089.58 61066.45 20385.32 21625.38 69981.70 142.88
Std. dev 17566.09 27161.91 46203.73 12770.16 13207.97 45349.45 6.45
Min 723.85 3850.45 11720.00 5142.37 934.70 19575.22 130.65
Q1 3108.10 6657.80 32710.00 12089.93 9686.08 41341.57 137.17
Median 5350.65 13149.63 48337.50 17053.76 20955.43 58450.07 143.27
Q3 8655.40 19799.40 70570.00 25024.24 33853.48 84518.58 148.05
Max 108844.45 128510.00 234765.00 67078.12 43641.65 242965.50 153.95
40 Sample
Stock
N 40 40 40 40 40 40 40
22
Table 2: Slice Order Incidents for Sample Stocks Ranked by Volume
The table reports total no of slice incidents in TA100 stocks ranked by aggregate trading volume (Panel A) and aggregate order volume (Panel B). The sample period is October and November 2006 (43 trading days). In each panel, ranking is from the highest to the lowest, i.e., the stock with highest trading/order volume is ranked 1. Slice order is a group of limit orders of equal size and price submitted consecutively within an interval of two minutes. Each group of slice order is reported as a single slice order incident. Panel C examines the distribution of slice order incidents for stocks ranked in the range of 45 to 65 in terms of aggregate trading volume. Panel A: Ranked by Trade Volume
Rank by
Trade
Volume
Name
# of Slice
Order
Incidents
Rank by
Trade
Volume
Name
# of Slice
Order
Incidents
Rank by
Trade
Volume
Name
# of Slice
Order
Incidents
1 POLI 250 33 TSEM 29 65 KRIS 7
2 TEVA 228 34 ITRN 18 66 AVNR.L 9
3 LUMI 251 35 PAY 96 67 FTIN1 0
4 MAIN 199 36 ORCT 40 68 OSEM 0
5 AFIL 184 37 PRGO 320 69 BYSD1 14
6 BEZQ 133 38 FBRT 51 70 PLSN 4
7 ORMT 175 39 AFPR 48 71 MTRX 4
8 DSCT 350 40 CII 9 72 DELT 14
9 MZTF 291 41 SAE 16 73 MISH 6
10 DLEKG 251 42 ALRO 13 74 FIBI 9
11 ILCO 231 43 FRUT 12 75 EXCE 5
12 DISI 242 44 ELRN 15 76 ELCO 9
13 GLOB 153 45 ELCRE 43 77 ARZM 5
14 PTNR 237 46 ELTR 14 78 RVSN 37
15 KOR 273 47 FTIN5 280 79 MLSR 12
16 ESLT 220 48 GILT 44 80 CAMT 51
17 EMIT 65 49 IBLD 44 81 PTCH 6
18 NICE 233 50 PTBL 119 82 BLSQ 5
19 ECJM 47 51 FORT 19 83 DEDR.L 5
20 IDBD 259 52 AMOT 33 84 RDWR 28
21 IDBH 268 53 GRNT 9 85 SCIX 3
22 CLIS 281 54 TFR 29 86 ELEK 1
23 HARL 353 55 GIVN 61 87 OHH 18
24 TDCM 15 56 AUDC 41 88 ALDN 29
25 MGDL 110 57 DLEA 17 89 MEYD 34
26 RTLX 35 58 SALT 15 90 DMBK 12
27 KRNV 256 59 ALVR 28 91 AIP 7
28 GTC 48 60 GZIT 57 92 FNDT 37
29 AZRM 38 61 ELAL 7 93 SHMR 6
30 DLKR 23 62 BSI 3 94 IBI 6
31 HUCN 34 63 UNON 6 95 DSAP 3
32 ALHE 38 64 DIFI 17
23
Panel B: Ranked by Order Volume
Rank by
Order
Volume
Name
# of Slice
Order
Incidents
Rank by
Order
Volume
Name
# of Slice
Order
Incidents
Rank by
Order
Volume
Name
# of Slice
Order
Incidents
1 TEVA 228 33 DLKR 23 65 BSI 3
2 POLI 250 34 HUCN 34 66 DIFI 17
3 LUMI 251 35 ORCT 40 67 FTIN1 0
4 MAIN 199 36 ALHE 38 68 RDWR 28
5 AFIL 184 37 ITRN 18 69 AVNR.L 9
6 BEZQ 133 38 ALRO 13 70 FIBI 9
7 DSCT 350 39 AFPR 48 71 ALDN 29
8 ORMT 175 40 FBRT 51 72 BYSD1 14
9 DLEKG 251 41 CII 9 73 OSEM 0
10 ILCO 231 42 FRUT 12 74 CAMT 51
11 DISI 242 43 PTBL 119 75 OHH 18
12 ESLT 220 44 GIVN 61 76 PLSN 4
13 MZTF 291 45 SAE 16 77 ELCO 9
14 GLOB 153 46 FTIN5 280 78 ARZM 5
15 KOR 273 47 ELCRE 43 79 DELT 14
16 PTNR 237 48 ELTR 14 80 MISH 6
17 NICE 233 49 GILT 44 81 MLSR 12
18 EMIT 65 50 ELAL 7 82 EXCE 5
19 IDBD 259 51 ELRN 15 83 PTCH 6
20 IDBH 268 52 IBLD 44 84 MTRX 4
21 ECJM 47 53 AUDC 41 85 FNDT 37
22 CLIS 281 54 RVSN 37 86 SCIX 3
23 HARL 353 55 ALVR 28 87 DEDR.L 5
24 KRNV 256 56 FORT 19 88 BLSQ 5
25 MGDL 110 57 AMOT 33 89 AIP 7
26 PRGO 320 58 GRNT 9 90 DMBK 12
27 PAY 96 59 TFR 29 91 ELEK 1
28 TDCM 15 60 DLEA 17 92 MEYD 34
29 RTLX 35 61 SALT 15 93 SHMR 6
30 GTC 48 62 KRIS 7 94 AYAL 6
31 AZRM 38 63 GZIT 57 95 IBI 6
32 TSEM 29 64 UNON 6 96 DSAP 3
24
Panel C: Summary Statistics of Slice Order Incidents in Stocks Ranked between 45 and 65 by Trade Volume
Name Mean Std. dev Min Q1 Median Q3 Max
# of Slice
Order
Incidents
IBLD 4 1 3 3 3.5 4 8 44
FORT 4 1 3 3 3 4 6 19
GRNT 4 1 3 3 3 4 5 9
SALT 3 1 3 3 3 4 5 15
FTIN5 6 4 3 3 4 7 28 280
PTBL 4 1 3 3 3 5 10 119
UNON 3 0 3 3 3 3 4 6
GZIT 4 2 3 3 4 5 8 57
ELTR 3 1 3 3 3 3 6 14
DLEA 3 0 3 3 3 3 4 17
GILT 4 1 3 3 3 3 11 44
BSI 4 1 3 3 4 4 4 3
TFR 4 1 3 3 3 4 9 29
AUDC 3 1 3 3 3 4 9 41
DIFI 4 2 3 3 3 4 9 17
ALVR 4 4 3 3 3 4 26 28
GIVN 4 4 3 3 3 4 22 61
ELAL 4 1 3 3 3 4 6 7
ELCRE 4 1 3 3 3 4 6 43
AMOT 4 1 3 3 3 4 8 33
KRIS 3 0 3 3 3 3 4 7
25
Table 3: Summary Statistics of Order Flow of Regular and Slice Order
The table reports summary statistics on the order submitted to TASE limit order book. Slice order is a group of limit orders of equal size and price submitted consecutively within an interval of two minutes. Each group is recognized as a single slice order. Rest of the limit orders are classified as regular orders. Each group of orders is again divided into limit and marketable limit orders. Marketable limit order is a buy/sell order whose limit price is equal to or higher/lower than the best ask/bid in the market. The variables are: No of Lmt is the average daily number of limit orders, Lsize is the average daily size of limit orders in shares, Lvol is average daily limit order volume in NIS, No of Mkt is the average daily number of marketable limit orders, Msize is the average daily size of marketable limit orders in shares, Mvol is average daily marketable limit order volume in NIS. The sample consists of 40 largest stocks of TASE in terms of trading volume. The sample period is October and November 2006 (43 trading days).
No of Lmt Lsize
(in Shares)
LVol
(NIS) No of Mkt
Msize
(in shares)
MVol
(NIS)
Mean 643 1,998 60,013 357 2,008 56,551
Std. dev 261 7,771 225,070 140 5,604 157,723
Q1 249 2 172 139 1 149
Median 466 423 12,204 264 398 10,958
Q3 602 985 26,927 337 829 22,334
Mean 764 2,001 59,997 424 1,886 52,246
Max 1,457 585,148 16,104,789 791 318,664 9,131,547
Regular
Order
N 1106408 1106408 1106408 614293 614293 614293
Mean 2 10,339 238,943 3 6,452 192,147
Std. dev 2 31,635 656,124 3 7,955 238,561
Min 1 550 14,521 1 745 23,338
Q1 1 2,184 56,937 1 2,417 66,449
Median 2 4,127 107,482 2 4,180 127,821
Q3 3 7,354 210,870 4 7,172 221,420
Max 9 221,521 5,073,438 12 44,611 1,329,071
Slice
Order
N 2516 2516 2516 3454 3454 3454
26
Table 4: Hit and Success Rate of Regular vs Slice Order by Type The table reports the percentage of slice and regular limit orders that hit the transaction. Success rate is measured as a conditional probability. For example, the percentage of hit is 78.94% given the order is a slice order. Slice order a group of limit orders of equal size and price submitted consecutively within an interval of two minutes. Each group is recognized as a single slice order. Rest of the limit orders is classified as regular order. Each group of order breaks upto limit (LMT) and marketable limit orders (MKT). Marketable limit order is a buy/sell order whose limit price is equal to or higher/lower than the best ask/bid in the market.
Regular Order
(LMT+ MKT)
Slice Order
(LMT+ MKT) Total
Regular Order
(LMT)
Slice Order
(LMT) Total
Regular Order
(MKT)
Slice Order
(MKT) Total
Total Order
Submitted 99.65 0.35 100 99.70 0.23 100 99.44 0.56 100.00
Hit 62.43 0.27 62.71 41.82 0.11 41.93 99.40 0.60 100.00
No Hit 37.22 0.07 37.29 57.96 0.11 58.07 0.00 0.00 0.00
Success Rate 62.65% 78.94% - 41.91% 50.04% - 100.00% 100.00% -
27
Table 5: Fill Rate of Regular vs Slice Order in TASE Limit Order Book
The table reports average execution ratio of regular and slice limit order for 40 sample stocks. Slice order is a group of limit orders of equal size and price submitted consecutively within an interval of two minutes. Each group is recognized as a single slice order. Rest of the limit orders is classified as regular order. The ratio of executed portion to initial order volume measures the fill rate. The ratio is 90% and above for a completely executed order. The execution ratio for a partially executed order is below 90%. Non-execution refers to the orders that are placed and eventually cancelled without any execution. The execution ratio is 0% for an unexecuted order. Panel B divides each group of order in limit (LMT) and marketable limit orders (MKT). Marketable limit order is a buy/sell order whose limit price is equal to or higher/lower than the best ask/bid in the market. There is no marketable limit order that is totally unexecuted. The sample period is October and November 2006 (43 trading days).
Panel A Panel B
Regular Order
(LMT+ MKT)
Slice Order
(LMT+ MKT) Regular Order Slice Order
Type Mean Median Mean Median Type Mean Median Mean Median
Completely
executed 99.95 100
99.89
99.91
LMTPart 41.99 40.99 77.02 77.02
Partially
executed
40.18 37.74
48.14
48.06
LMTFull 99.96 100 99.89 99.91
Unexecuted 0.00 0.00 0.00 0.00 LMTNone 0.00 0.00 0.00 0.00
MKTPart 39.17 36.35 44.74 44.68
MKTFull 99.94 100.00 99.84 99.85
28
Table 6: Average Duration (hh:mm:ss: 00) of Regular vs Slice Order in TASE Limit Order Book
The table reports average time between entry and complete execution/ cancellation of regular limit and sliced limit order. Slice order is a group of limit orders of equal size and price submitted consecutively within an interval of two minutes. Each group is recognized as a single slice order. Rest of the limit orders is classified as regular order. The duration for a slice order is measured as the time difference between the first order (of the group) submitted and the last order (of the group) executed or cancelled. The ratio of executed portion to initial order volume measures the fill rate. The ratio is 90% and above for a completely executed order. The execution ratio for a partially executed order is below 90%. Non-execution refers to the orders that are placed and eventually cancelled without any execution. Panel B divides each group of order in limit(LMT) and marketable limit orders (MKT). Marketable limit order is a buy/sell order whose limit price is equal to or higher/lower than the best ask/bid in the market. The sample consists of 40 largest stocks of TASE in terms of trading volume. The sample period is October and November 2006 (43 trading days). Panel A:
Completely executed Partially executed Unexecuted
Mean 0:11:54.37 0:43:34.57 1:13:41.33 Std. dev 0:36:08.72 1:20:07.24 1:57:40.12 Q1 0:00:00.00 0:02:34.90 0:03:02.46 Median 0:00:15.09 0:11:09.26 0:16:49.88 Q3 0:05:48.12 0:45:32.72 1:33:48.28
Regular
Order
#Obs 1001208 76796 642697
Mean 0:03:29.98 0:22:17.17 0:28:34.81 Std. dev 0:04:46.95 0:21:19.14 0:14:34.33 Q1 0:01:48.20 0:20:09.63 0:24:23.05 Median 0:02:48.45 0:21:55.67 0:27:28.04 Q3 0:05:03.93 0:24:46.09 0:33:29.82
Slice
Order
#Obs 4145 568 1257
Panel B: by Type
LMTPart LMTFull LMTNone MKTFull MKTPart
Mean 0:54:57.60 0:26:36.49 1:13:41.33 0:01:29.40 0:27:42.46 Std. dev 1:24:57.78 0:51:10.77 1:57:40.12 0:08:32.58 0:55:28.91 Q1 0:07:41.76 0:01:58.84 0:03:02.46 0:00:00.00 0:01:08.33 Median 0:21:34.66 0:06:51.10 0:16:49.88 0:00:00.00 0:05:44.78 Q3 1:05:24.74 0:23:52.92 1:33:48.28 0:00:01.38 0:29:09.42
Regular
Order
#Obs 47091 416620 642697 584588 29705
Mean 0:23:51.55 0:10:52.11 0:23:51.55 0:00:56.84 0:24:20.90
Std. dev 0:17:03.31 0:11:03.19 0:17:03.31 0:00:55.92 0:00:29.09
Q1 0:21:48.17 0:08:40.04 0:21:48.17 0:00:36.31 0:24:19.21
Median 0:23:43.79 0:10:27.90 0:23:43.79 0:00:47.55 0:24:20.90
Q3 0:26:02.54 0:13:23.80 0:26:02.54 0:01:11.03 0:24:22.60
Slice
Order
#Obs 507 752 1257 3393 61
29
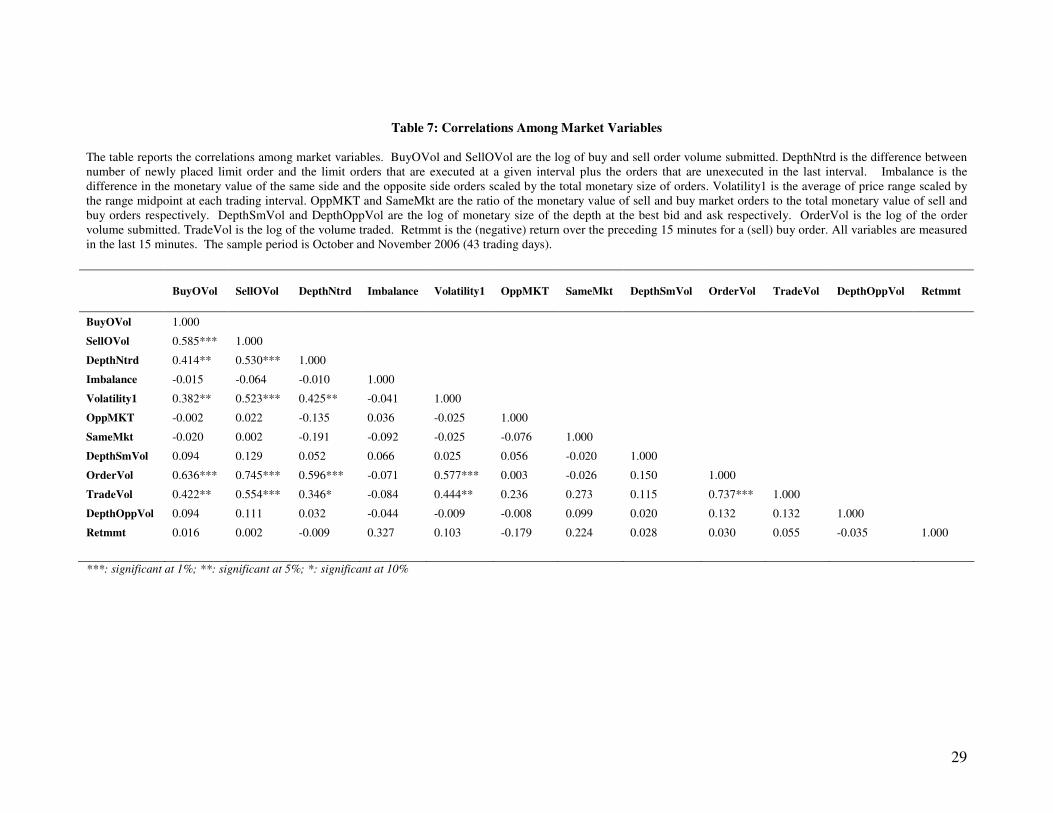
Table 7: Correlations Among Market Variables The table reports the correlations among market variables. BuyOVol and SellOVol are the log of buy and sell order volume submitted. DepthNtrd is the difference between number of newly placed limit order and the limit orders that are executed at a given interval plus the orders that are unexecuted in the last interval. Imbalance is the difference in the monetary value of the same side and the opposite side orders scaled by the total monetary size of orders. Volatility1 is the average of price range scaled by the range midpoint at each trading interval. OppMKT and SameMkt are the ratio of the monetary value of sell and buy market orders to the total monetary value of sell and buy orders respectively. DepthSmVol and DepthOppVol are the log of monetary size of the depth at the best bid and ask respectively. OrderVol is the log of the order volume submitted. TradeVol is the log of the volume traded. Retmmt is the (negative) return over the preceding 15 minutes for a (sell) buy order. All variables are measured in the last 15 minutes. The sample period is October and November 2006 (43 trading days).
BuyOVol SellOVol DepthNtrd Imbalance Volatility1 OppMKT SameMkt DepthSmVol OrderVol TradeVol DepthOppVol Retmmt
BuyOVol 1.000
SellOVol 0.585*** 1.000
DepthNtrd 0.414** 0.530*** 1.000
Imbalance -0.015 -0.064 -0.010 1.000
Volatility1 0.382** 0.523*** 0.425** -0.041 1.000
OppMKT -0.002 0.022 -0.135 0.036 -0.025 1.000
SameMkt -0.020 0.002 -0.191 -0.092 -0.025 -0.076 1.000
DepthSmVol 0.094 0.129 0.052 0.066 0.025 0.056 -0.020 1.000
OrderVol 0.636*** 0.745*** 0.596*** -0.071 0.577*** 0.003 -0.026 0.150 1.000
TradeVol 0.422** 0.554*** 0.346* -0.084 0.444** 0.236 0.273 0.115 0.737*** 1.000
DepthOppVol 0.094 0.111 0.032 -0.044 -0.009 -0.008 0.099 0.020 0.132 0.132 1.000
Retmmt 0.016 0.002 -0.009 0.327 0.103 -0.179 0.224 0.028 0.030 0.055 -0.035 1.000
***: significant at 1%; **: significant at 5%; *: significant at 10%
30
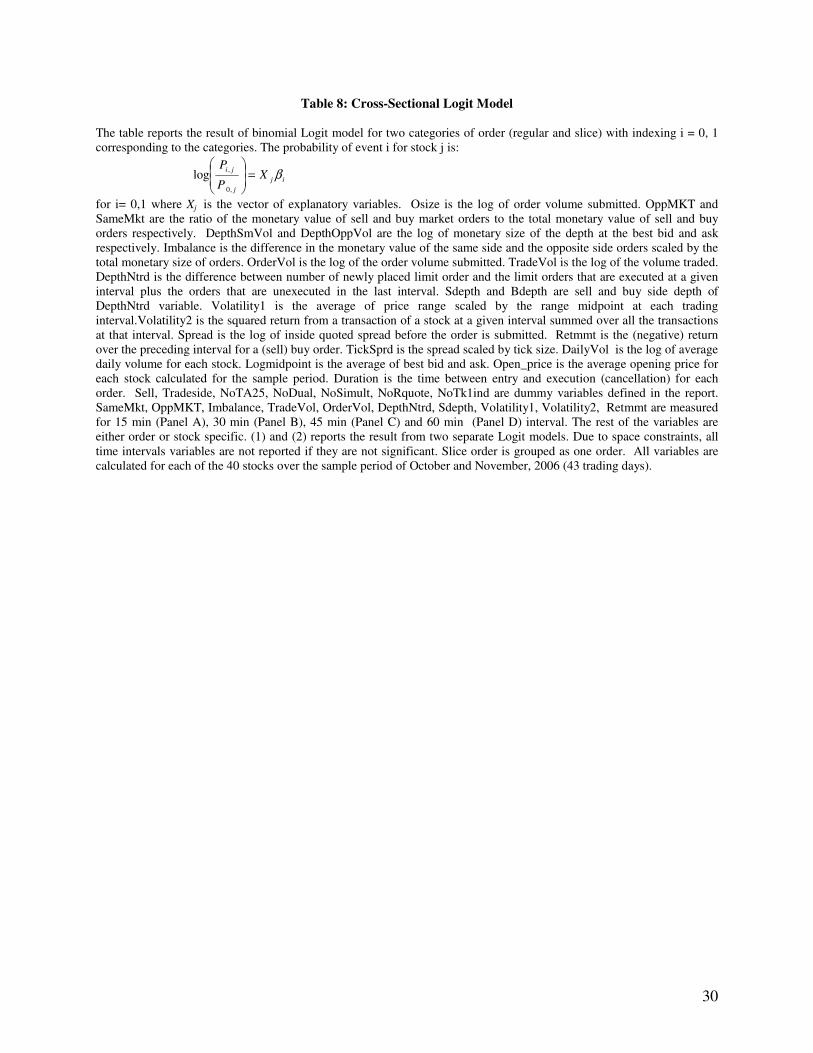
Table 8: Cross-Sectional Logit Model The table reports the result of binomial Logit model for two categories of order (regular and slice) with indexing i = 0, 1 corresponding to the categories. The probability of event i for stock j is:
ij
j
jiX
P
Pβ=
,0
,log
for i= 0,1 where Xj is the vector of explanatory variables. Osize is the log of order volume submitted. OppMKT and SameMkt are the ratio of the monetary value of sell and buy market orders to the total monetary value of sell and buy orders respectively. DepthSmVol and DepthOppVol are the log of monetary size of the depth at the best bid and ask respectively. Imbalance is the difference in the monetary value of the same side and the opposite side orders scaled by the total monetary size of orders. OrderVol is the log of the order volume submitted. TradeVol is the log of the volume traded. DepthNtrd is the difference between number of newly placed limit order and the limit orders that are executed at a given interval plus the orders that are unexecuted in the last interval. Sdepth and Bdepth are sell and buy side depth of DepthNtrd variable. Volatility1 is the average of price range scaled by the range midpoint at each trading interval.Volatility2 is the squared return from a transaction of a stock at a given interval summed over all the transactions at that interval. Spread is the log of inside quoted spread before the order is submitted. Retmmt is the (negative) return over the preceding interval for a (sell) buy order. TickSprd is the spread scaled by tick size. DailyVol is the log of average daily volume for each stock. Logmidpoint is the average of best bid and ask. Open_price is the average opening price for each stock calculated for the sample period. Duration is the time between entry and execution (cancellation) for each order. Sell, Tradeside, NoTA25, NoDual, NoSimult, NoRquote, NoTk1ind are dummy variables defined in the report. SameMkt, OppMKT, Imbalance, TradeVol, OrderVol, DepthNtrd, Sdepth, Volatility1, Volatility2, Retmmt are measured for 15 min (Panel A), 30 min (Panel B), 45 min (Panel C) and 60 min (Panel D) interval. The rest of the variables are either order or stock specific. (1) and (2) reports the result from two separate Logit models. Due to space constraints, all time intervals variables are not reported if they are not significant. Slice order is grouped as one order. All variables are calculated for each of the 40 stocks over the sample period of October and November, 2006 (43 trading days).
31
Table 8 Continued….
Panel A: 15 min Interval Preceding the Event (1) (2)
Variable Estimate StdErr P-Value Estimate StdErr P-Value
Intercept -4.196 0.377 <.0001 -4.540 0.222 <.0001 Osize -0.183 0.013 <.0001 -0.197 0.013 <.0001 SameMkt 0.126 0.076 0.097 0.120 0.065 0.065 OppMKT -0.096 0.067 0.150 -0.075 0.060 0.213 DepthSmvol 0.068 0.011 <.0001 0.050 0.010 <.0001 DepthOppvol 0.179 0.011 <.0001 0.169 0.010 <.0001 Imbalance 0.179 0.037 <.0001 0.185 0.035 <.0001 TradeVol -0.138 0.028 <.0001 -0.129 0.014 <.0001 OrderVol 0.031 0.031 0.323 DepthNtrd -0.003 0.001 <.0001 -0.002 0.000 <.0001 Sdepth -0.004 0.001 0.001 Bdepth 0.003 0.001 <.0001 Volatility1 3.432 5.867 0.559 Volatility2 0.283 1.311 0.829 Spread 0.104 0.029 0.000 Retmmt -3.006 4.711 0.523 TickSprd -0.092 0.025 0.000 Logmidpoint -0.057 0.038 0.131 DailyVol 0.000 0.000 <.0001 0.000 0.000 <.0001 Open_price 0.000 0.000 0.040 Duration 0.000 0.000 <.0001 0.000 0.000 <.0001 Sell 0.331 0.016 <.0001 0.329 0.016 <.0001 Tradeside 0.202 0.015 <.0001 0.172 0.015 <.0001 NoTA25 -0.613 0.024 <.0001 -0.626 0.024 <.0001 NoDual 0.108 0.019 <.0001 0.139 0.025 <.0001 NoSimult -0.219 0.032 <.0001 NoRquote 0.051 0.015 0.001 NoTk1ind -0.046 0.023 0.040 LMT*None 0.219 0.035 <.0001 LMT*Part -0.696 0.033 <.0001 NoDual*None -0.168 0.032 <.0001 NoDual*Part 0.277 0.045 <.0001 09:45-10:00 -0.6746 0.1172 <.0001 -0.554 0.093 <.0001 11:15-11:30 -0.546 0.092 <.0001 12:00-12:15 -0.6512 0.1137 <.0001 -0.446 0.091 <.0001 2:30-2:45 0.3105 0.0441 <.0001 0.473 0.060 <.0001 4:15-4:30 0.3105 0.0441 <.0001 0.478 0.057 <.0001 4:30-4:45 -0.3277 0.0714 <.0001 . 0.393 0.060 <.0001 5:00-5:15 0.5085 0.112 <.0001 0.384 0.054 <.0001 Sunday 0.049 0.029 0.0898 0.026 0.029 0.378 Monday 0.112 0.026 <.0001 0.121 0.026 <.0001 Tuesday -0.123 0.027 <.0001 -0.122 0.027 <.0001 Wednesday 0.074 0.025 0.0037 0.088 0.025 0.001 LogLike 74159.647 74159.647 # Obs 1517809 1517809
32
Table 8 Continued…. Panel B: 30 min Interval Preceding the Event
(1) (2)
Variable Estimate StdErr P-Value Estimate StdErr P-Value
Intercept -4.442 0.430 <.0001 -4.070 0.256 <.0001 Osize -0.193 0.014 <.0001 -0.198 0.013 <.0001 SameMkt 0.256 0.100 0.011 0.158 0.080 0.048 OppMKT 0.008 0.091 0.927 -0.024 0.076 0.748 DepthSmvol 0.062 0.011 <.0001 0.047 0.011 <.0001 DepthOppvol 0.180 0.011 <.0001 0.169 0.011 <.0001 Imbalance 0.286 0.049 <.0001 0.300 0.043 <.0001 TradeVol -0.201 0.041 <.0001 -0.150 0.018 <.0001 OrderVol 0.112 0.044 0.012 DepthNtrd -0.002 0.001 0.004 -0.002 0.000 <.0001 Sdepth -0.002 0.001 0.022 0.000 0.000 <.0001 Bdepth 0.000 0.001 0.876 Volatility1 2.345 4.972 0.637 Volatility2 -0.290 0.863 0.737 Spread 0.091 0.031 0.003 Retmmt 0.484 4.003 0.904 TickSprd -0.093 0.027 0.000 Logmidpoint -0.034 0.040 0.388 DailyVol 0.000 0.000 <.0001 Open_price 0.000 0.000 0.008 Duration 0.000 0.000 <.0001 0.000 0.000 <.0001 Sell 0.331 0.017 <.0001 0.332 0.016 <.0001 Tradeside 0.203 0.015 <.0001 0.171 0.015 <.0001 NoTA25 -0.624 0.026 <.0001 -0.637 0.025 <.0001 NoDual 0.116 0.020 <.0001 0.142 0.025 <.0001 NoSimult -0.190 0.032 <.0001 NoRquote 0.046 0.016 0.005 NoTk1ind -0.038 0.024 0.109 LMT*None 0.285 0.036 <.0001 LMT*Part -0.764 0.034 <.0001 NoDual*None -0.143 0.033 <.0001 NoDual*Part 0.246 0.046 <.0001 10:45-11:15 -0.408 0.068 <.0001 -0.250 0.057 <.0001 12:15-12:45 -0.328 0.071 <.0001 -0.270 0.059 <.0001 2:15-2:45 0.362 0.052 <.0001 0.307 0.046 <.0001 4:15-4:45 0.245 0.048 <.0001 0.203 0.042 <.0001 Sunday 0.100 0.030 0.001 0.038 0.030 0.201 Monday 0.138 0.027 <.0001 0.147 0.026 <.0001 Tuesday -0.097 0.029 0.001 -0.109 0.028 <.0001 Wednesday -0.021 0.028 0.448 0.039 0.026 0.141 LogLike 66007.304 70293.506 # Obs 1284121 1380030
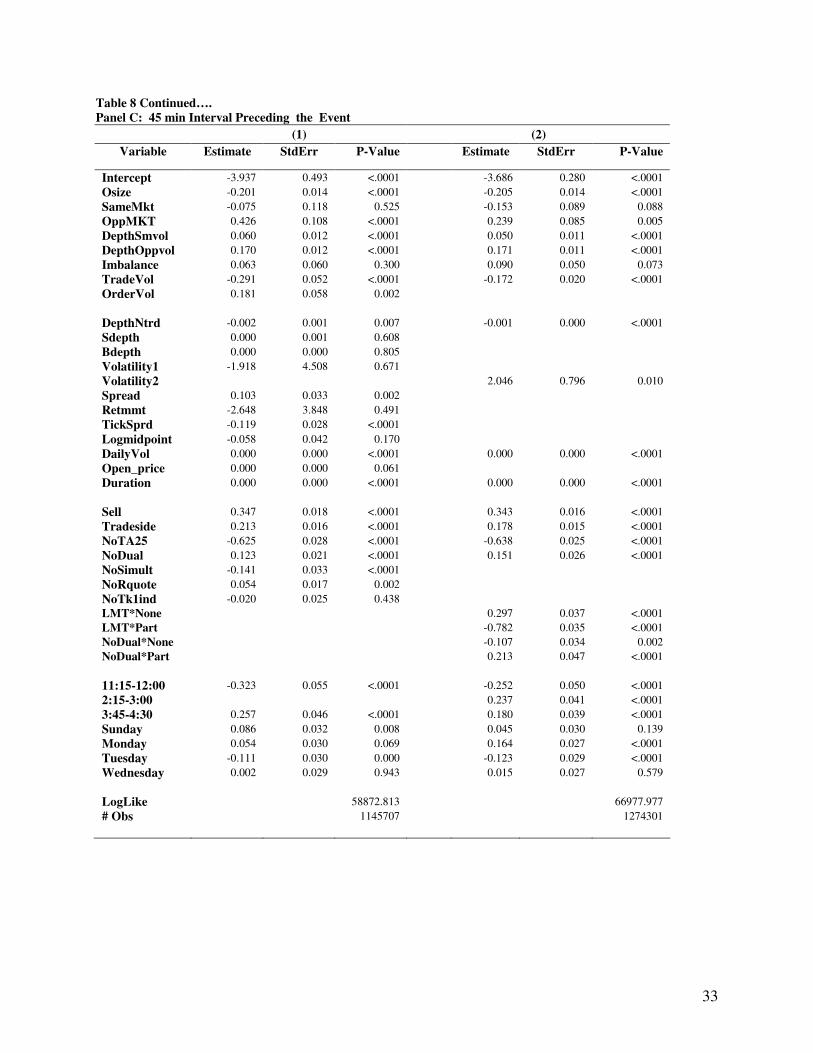
33
Table 8 Continued…. Panel C: 45 min Interval Preceding the Event
(1) (2)
Variable Estimate StdErr P-Value
Estimate StdErr P-Value
Intercept -3.937 0.493 <.0001 -3.686 0.280 <.0001 Osize -0.201 0.014 <.0001 -0.205 0.014 <.0001 SameMkt -0.075 0.118 0.525 -0.153 0.089 0.088 OppMKT 0.426 0.108 <.0001 0.239 0.085 0.005 DepthSmvol 0.060 0.012 <.0001 0.050 0.011 <.0001 DepthOppvol 0.170 0.012 <.0001 0.171 0.011 <.0001 Imbalance 0.063 0.060 0.300 0.090 0.050 0.073 TradeVol -0.291 0.052 <.0001 -0.172 0.020 <.0001 OrderVol 0.181 0.058 0.002 DepthNtrd -0.002 0.001 0.007 -0.001 0.000 <.0001 Sdepth 0.000 0.001 0.608 Bdepth 0.000 0.000 0.805 Volatility1 -1.918 4.508 0.671 Volatility2 2.046 0.796 0.010 Spread 0.103 0.033 0.002 Retmmt -2.648 3.848 0.491 TickSprd -0.119 0.028 <.0001 Logmidpoint -0.058 0.042 0.170 DailyVol 0.000 0.000 <.0001 0.000 0.000 <.0001 Open_price 0.000 0.000 0.061 Duration 0.000 0.000 <.0001 0.000 0.000 <.0001 Sell 0.347 0.018 <.0001 0.343 0.016 <.0001 Tradeside 0.213 0.016 <.0001 0.178 0.015 <.0001 NoTA25 -0.625 0.028 <.0001 -0.638 0.025 <.0001 NoDual 0.123 0.021 <.0001 0.151 0.026 <.0001 NoSimult -0.141 0.033 <.0001 NoRquote 0.054 0.017 0.002 NoTk1ind -0.020 0.025 0.438 LMT*None 0.297 0.037 <.0001 LMT*Part -0.782 0.035 <.0001 NoDual*None -0.107 0.034 0.002 NoDual*Part 0.213 0.047 <.0001 11:15-12:00 -0.323 0.055 <.0001 -0.252 0.050 <.0001 2:15-3:00 0.237 0.041 <.0001 3:45-4:30 0.257 0.046 <.0001 0.180 0.039 <.0001 Sunday 0.086 0.032 0.008 0.045 0.030 0.139 Monday 0.054 0.030 0.069 0.164 0.027 <.0001 Tuesday -0.111 0.030 0.000 -0.123 0.029 <.0001 Wednesday 0.002 0.029 0.943 0.015 0.027 0.579 LogLike 58872.813 66977.977 # Obs 1145707 1274301
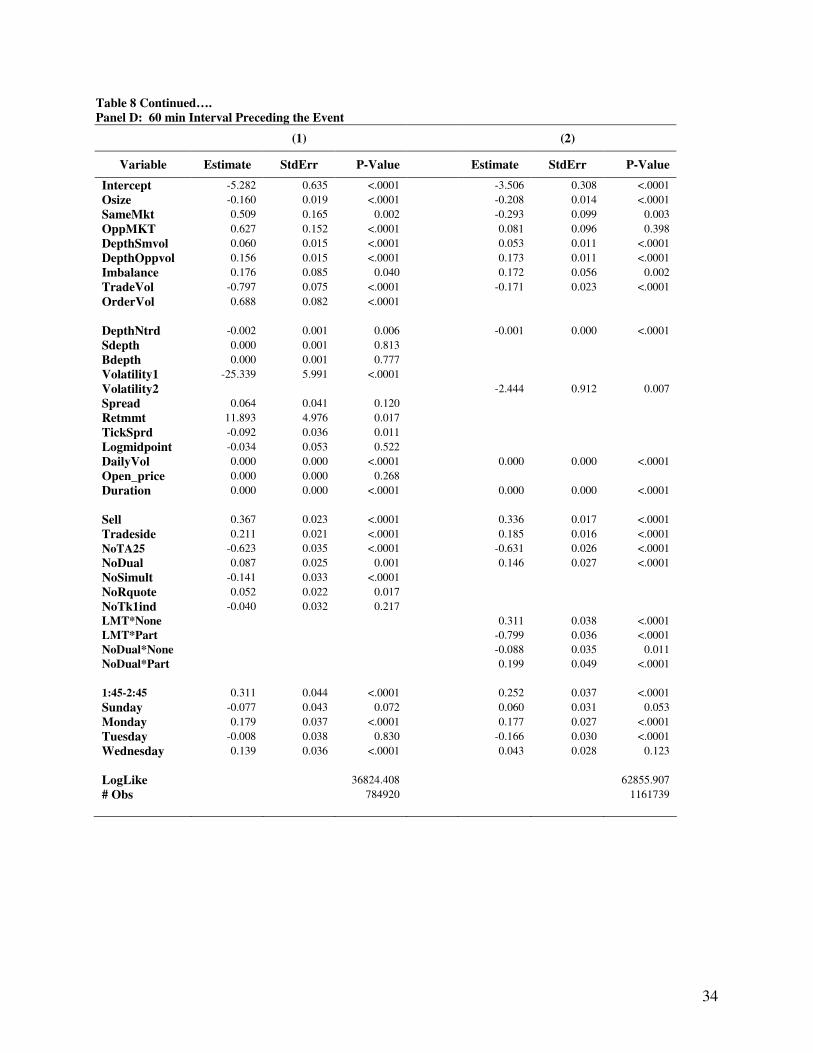
34
Table 8 Continued…. Panel D: 60 min Interval Preceding the Event
(1) (2)
Variable Estimate StdErr P-Value Estimate StdErr P-Value
Intercept -5.282 0.635 <.0001 -3.506 0.308 <.0001 Osize -0.160 0.019 <.0001 -0.208 0.014 <.0001 SameMkt 0.509 0.165 0.002 -0.293 0.099 0.003 OppMKT 0.627 0.152 <.0001 0.081 0.096 0.398 DepthSmvol 0.060 0.015 <.0001 0.053 0.011 <.0001 DepthOppvol 0.156 0.015 <.0001 0.173 0.011 <.0001 Imbalance 0.176 0.085 0.040 0.172 0.056 0.002 TradeVol -0.797 0.075 <.0001 -0.171 0.023 <.0001 OrderVol 0.688 0.082 <.0001 DepthNtrd -0.002 0.001 0.006 -0.001 0.000 <.0001 Sdepth 0.000 0.001 0.813 Bdepth 0.000 0.001 0.777 Volatility1 -25.339 5.991 <.0001 Volatility2 -2.444 0.912 0.007 Spread 0.064 0.041 0.120 Retmmt 11.893 4.976 0.017 TickSprd -0.092 0.036 0.011 Logmidpoint -0.034 0.053 0.522 DailyVol 0.000 0.000 <.0001 0.000 0.000 <.0001 Open_price 0.000 0.000 0.268 Duration 0.000 0.000 <.0001 0.000 0.000 <.0001 Sell 0.367 0.023 <.0001 0.336 0.017 <.0001 Tradeside 0.211 0.021 <.0001 0.185 0.016 <.0001 NoTA25 -0.623 0.035 <.0001 -0.631 0.026 <.0001 NoDual 0.087 0.025 0.001 0.146 0.027 <.0001 NoSimult -0.141 0.033 <.0001 NoRquote 0.052 0.022 0.017 NoTk1ind -0.040 0.032 0.217 LMT*None 0.311 0.038 <.0001 LMT*Part -0.799 0.036 <.0001 NoDual*None -0.088 0.035 0.011 NoDual*Part 0.199 0.049 <.0001 1:45-2:45 0.311 0.044 <.0001 0.252 0.037 <.0001 Sunday -0.077 0.043 0.072 0.060 0.031 0.053 Monday 0.179 0.037 <.0001 0.177 0.027 <.0001 Tuesday -0.008 0.038 0.830 -0.166 0.030 <.0001 Wednesday 0.139 0.036 <.0001 0.043 0.028 0.123 LogLike 36824.408 62855.907 # Obs 784920 1161739
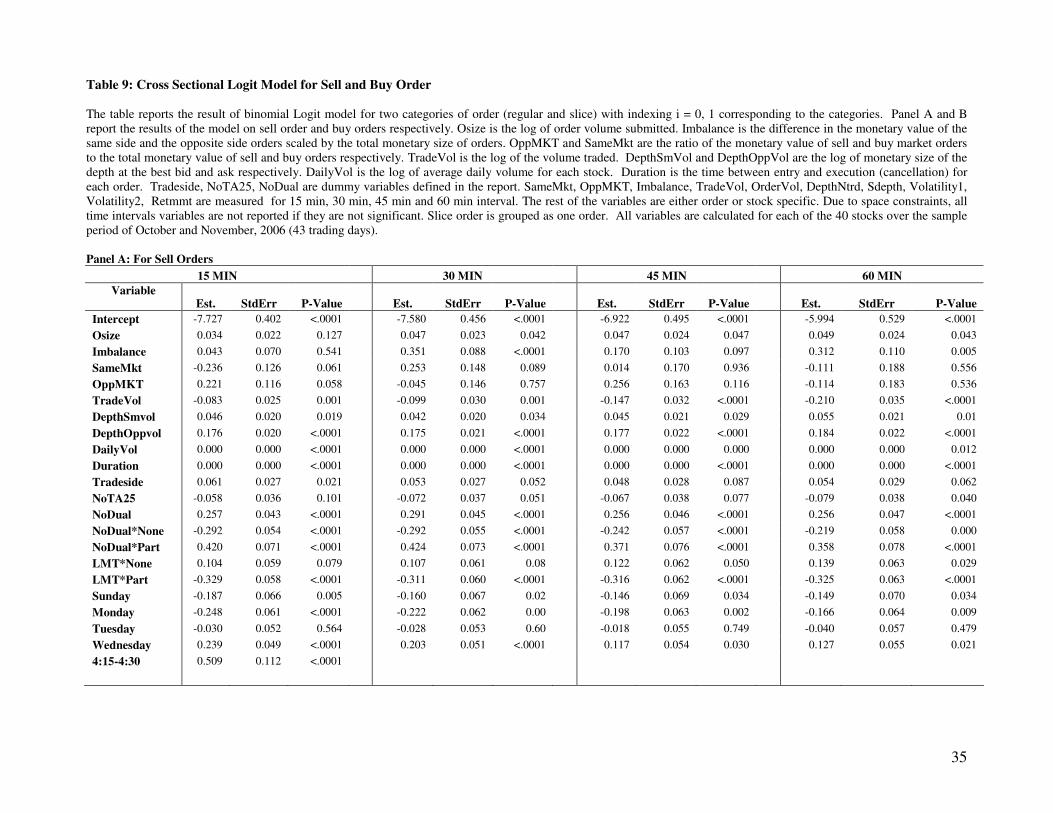
35
Table 9: Cross Sectional Logit Model for Sell and Buy Order The table reports the result of binomial Logit model for two categories of order (regular and slice) with indexing i = 0, 1 corresponding to the categories. Panel A and B report the results of the model on sell order and buy orders respectively. Osize is the log of order volume submitted. Imbalance is the difference in the monetary value of the same side and the opposite side orders scaled by the total monetary size of orders. OppMKT and SameMkt are the ratio of the monetary value of sell and buy market orders to the total monetary value of sell and buy orders respectively. TradeVol is the log of the volume traded. DepthSmVol and DepthOppVol are the log of monetary size of the depth at the best bid and ask respectively. DailyVol is the log of average daily volume for each stock. Duration is the time between entry and execution (cancellation) for each order. Tradeside, NoTA25, NoDual are dummy variables defined in the report. SameMkt, OppMKT, Imbalance, TradeVol, OrderVol, DepthNtrd, Sdepth, Volatility1, Volatility2, Retmmt are measured for 15 min, 30 min, 45 min and 60 min interval. The rest of the variables are either order or stock specific. Due to space constraints, all time intervals variables are not reported if they are not significant. Slice order is grouped as one order. All variables are calculated for each of the 40 stocks over the sample period of October and November, 2006 (43 trading days). Panel A: For Sell Orders
15 MIN 30 MIN 45 MIN 60 MIN
Variable Est. StdErr P-Value Est. StdErr P-Value Est. StdErr P-Value Est. StdErr P-Value
Intercept -7.727 0.402 <.0001 -7.580 0.456 <.0001 -6.922 0.495 <.0001 -5.994 0.529 <.0001
Osize 0.034 0.022 0.127 0.047 0.023 0.042 0.047 0.024 0.047 0.049 0.024 0.043
Imbalance 0.043 0.070 0.541 0.351 0.088 <.0001 0.170 0.103 0.097 0.312 0.110 0.005
SameMkt -0.236 0.126 0.061 0.253 0.148 0.089 0.014 0.170 0.936 -0.111 0.188 0.556
OppMKT 0.221 0.116 0.058 -0.045 0.146 0.757 0.256 0.163 0.116 -0.114 0.183 0.536
TradeVol -0.083 0.025 0.001 -0.099 0.030 0.001 -0.147 0.032 <.0001 -0.210 0.035 <.0001
DepthSmvol 0.046 0.020 0.019 0.042 0.020 0.034 0.045 0.021 0.029 0.055 0.021 0.01
DepthOppvol 0.176 0.020 <.0001 0.175 0.021 <.0001 0.177 0.022 <.0001 0.184 0.022 <.0001
DailyVol 0.000 0.000 <.0001 0.000 0.000 <.0001 0.000 0.000 0.000 0.000 0.000 0.012
Duration 0.000 0.000 <.0001 0.000 0.000 <.0001 0.000 0.000 <.0001 0.000 0.000 <.0001
Tradeside 0.061 0.027 0.021 0.053 0.027 0.052 0.048 0.028 0.087 0.054 0.029 0.062
NoTA25 -0.058 0.036 0.101 -0.072 0.037 0.051 -0.067 0.038 0.077 -0.079 0.038 0.040
NoDual 0.257 0.043 <.0001 0.291 0.045 <.0001 0.256 0.046 <.0001 0.256 0.047 <.0001
NoDual*None -0.292 0.054 <.0001 -0.292 0.055 <.0001 -0.242 0.057 <.0001 -0.219 0.058 0.000
NoDual*Part 0.420 0.071 <.0001 0.424 0.073 <.0001 0.371 0.076 <.0001 0.358 0.078 <.0001
LMT*None 0.104 0.059 0.079 0.107 0.061 0.08 0.122 0.062 0.050 0.139 0.063 0.029
LMT*Part -0.329 0.058 <.0001 -0.311 0.060 <.0001 -0.316 0.062 <.0001 -0.325 0.063 <.0001
Sunday -0.187 0.066 0.005 -0.160 0.067 0.02 -0.146 0.069 0.034 -0.149 0.070 0.034
Monday -0.248 0.061 <.0001 -0.222 0.062 0.00 -0.198 0.063 0.002 -0.166 0.064 0.009
Tuesday -0.030 0.052 0.564 -0.028 0.053 0.60 -0.018 0.055 0.749 -0.040 0.057 0.479
Wednesday 0.239 0.049 <.0001 0.203 0.051 <.0001 0.117 0.054 0.030 0.127 0.055 0.021
4:15-4:30 0.509 0.112 <.0001
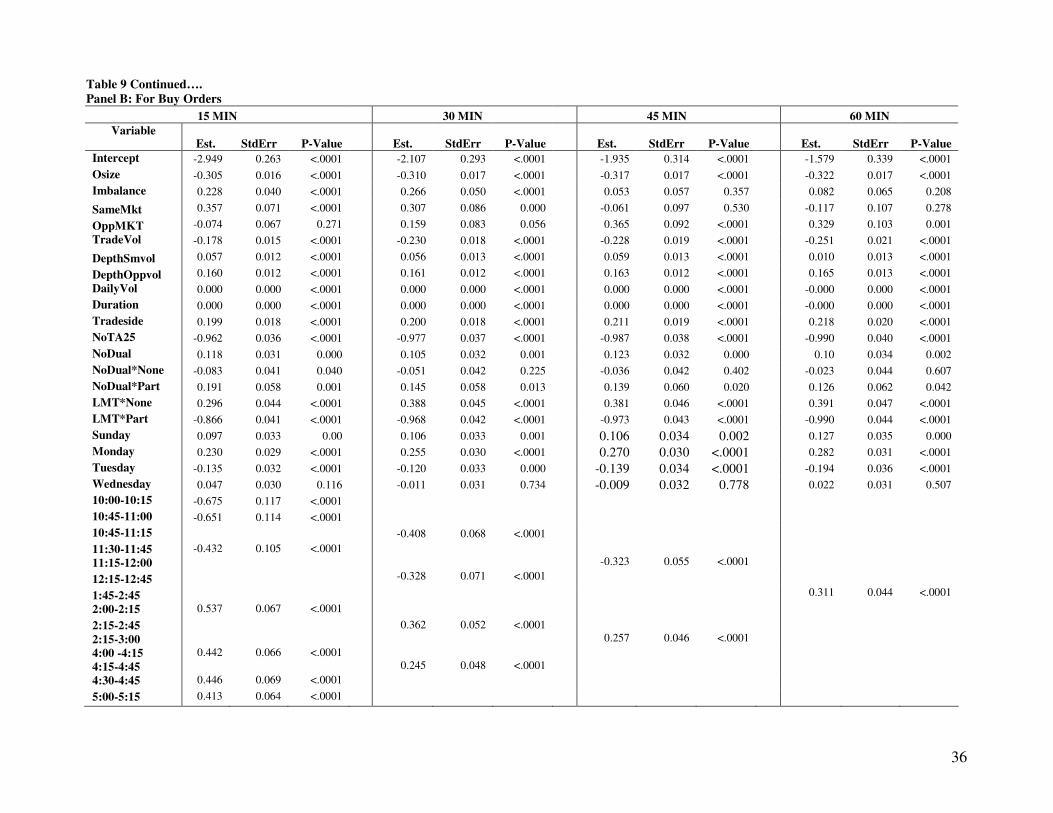
36
Table 9 Continued….
Panel B: For Buy Orders
15 MIN 30 MIN 45 MIN 60 MIN
Variable Est. StdErr P-Value Est. StdErr P-Value Est. StdErr P-Value Est. StdErr P-Value
Intercept -2.949 0.263 <.0001 -2.107 0.293 <.0001 -1.935 0.314 <.0001 -1.579 0.339 <.0001
Osize -0.305 0.016 <.0001 -0.310 0.017 <.0001 -0.317 0.017 <.0001 -0.322 0.017 <.0001 Imbalance 0.228 0.040 <.0001 0.266 0.050 <.0001 0.053 0.057 0.357 0.082 0.065 0.208
SameMkt 0.357 0.071 <.0001 0.307 0.086 0.000 -0.061 0.097 0.530 -0.117 0.107 0.278
OppMKT -0.074 0.067 0.271 0.159 0.083 0.056 0.365 0.092 <.0001 0.329 0.103 0.001 TradeVol -0.178 0.015 <.0001 -0.230 0.018 <.0001 -0.228 0.019 <.0001 -0.251 0.021 <.0001
DepthSmvol 0.057 0.012 <.0001 0.056 0.013 <.0001 0.059 0.013 <.0001 0.010 0.013 <.0001
DepthOppvol 0.160 0.012 <.0001 0.161 0.012 <.0001 0.163 0.012 <.0001 0.165 0.013 <.0001 DailyVol 0.000 0.000 <.0001 0.000 0.000 <.0001 0.000 0.000 <.0001 -0.000 0.000 <.0001 Duration 0.000 0.000 <.0001 0.000 0.000 <.0001 0.000 0.000 <.0001 -0.000 0.000 <.0001 Tradeside 0.199 0.018 <.0001 0.200 0.018 <.0001 0.211 0.019 <.0001 0.218 0.020 <.0001 NoTA25 -0.962 0.036 <.0001 -0.977 0.037 <.0001 -0.987 0.038 <.0001 -0.990 0.040 <.0001
NoDual 0.118 0.031 0.000 0.105 0.032 0.001 0.123 0.032 0.000 0.10 0.034 0.002 NoDual*None -0.083 0.041 0.040 -0.051 0.042 0.225 -0.036 0.042 0.402 -0.023 0.044 0.607 NoDual*Part 0.191 0.058 0.001 0.145 0.058 0.013 0.139 0.060 0.020 0.126 0.062 0.042 LMT*None 0.296 0.044 <.0001 0.388 0.045 <.0001 0.381 0.046 <.0001 0.391 0.047 <.0001 LMT*Part -0.866 0.041 <.0001 -0.968 0.042 <.0001 -0.973 0.043 <.0001 -0.990 0.044 <.0001 Sunday 0.097 0.033 0.00 0.106 0.033 0.001 0.106 0.034 0.002 0.127 0.035 0.000 Monday 0.230 0.029 <.0001 0.255 0.030 <.0001 0.270 0.030 <.0001 0.282 0.031 <.0001 Tuesday -0.135 0.032 <.0001 -0.120 0.033 0.000 -0.139 0.034 <.0001 -0.194 0.036 <.0001 Wednesday 0.047 0.030 0.116 -0.011 0.031 0.734 -0.009 0.032 0.778 0.022 0.031 0.507 10:00-10:15 -0.675 0.117 <.0001 10:45-11:00 -0.651 0.114 <.0001
10:45-11:15 -0.408 0.068 <.0001
11:30-11:45
11:15-12:00
-0.432 0.105 <.0001 -0.323
0.055
<.0001
12:15-12:45 -0.328 0.071 <.0001
1:45-2:45 0.311 0.044 <.0001
2:00-2:15 0.537 0.067 <.0001 2:15-2:45
2:15-3:00
0.362 0.052 <.0001 0.257
0.046
<.0001
4:00 -4:15
4:15-4:45
0.442 0.066 <.0001
0.245
0.048
<.0001
4:30-4:45 0.446 0.069 <.0001 5:00-5:15 0.413 0.064 <.0001
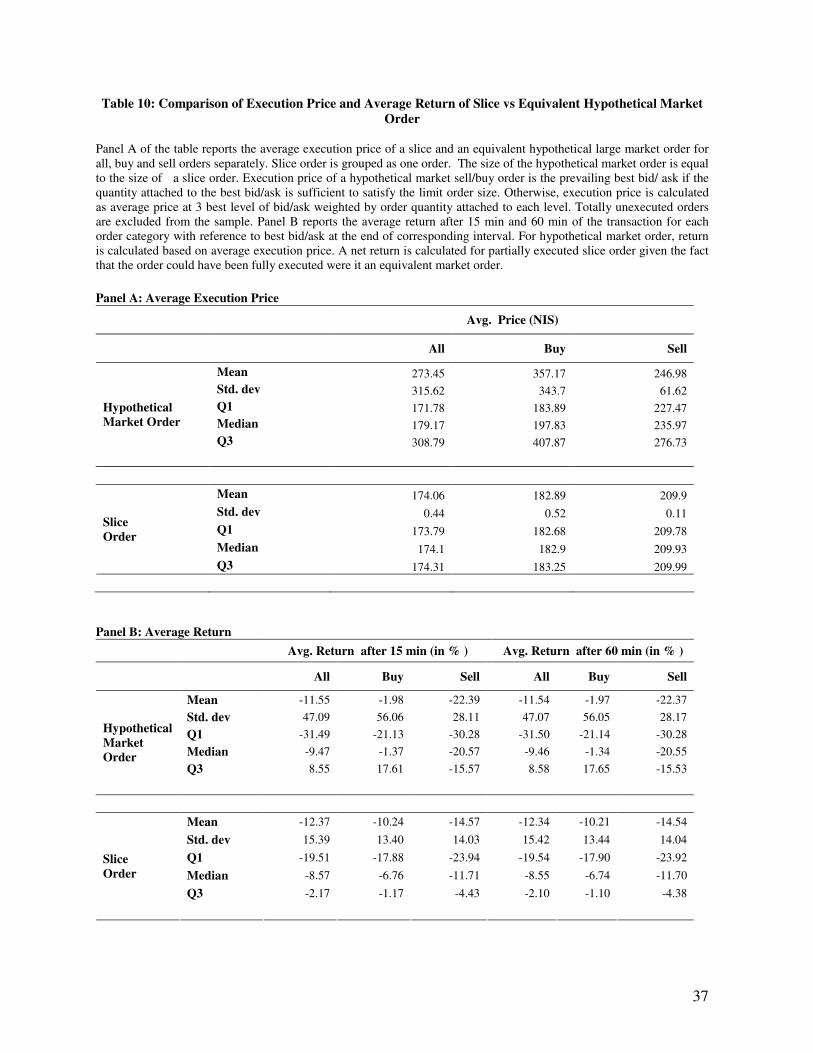
37
Table 10: Comparison of Execution Price and Average Return of Slice vs Equivalent Hypothetical Market
Order
Panel A of the table reports the average execution price of a slice and an equivalent hypothetical large market order for all, buy and sell orders separately. Slice order is grouped as one order. The size of the hypothetical market order is equal to the size of a slice order. Execution price of a hypothetical market sell/buy order is the prevailing best bid/ ask if the quantity attached to the best bid/ask is sufficient to satisfy the limit order size. Otherwise, execution price is calculated as average price at 3 best level of bid/ask weighted by order quantity attached to each level. Totally unexecuted orders are excluded from the sample. Panel B reports the average return after 15 min and 60 min of the transaction for each order category with reference to best bid/ask at the end of corresponding interval. For hypothetical market order, return is calculated based on average execution price. A net return is calculated for partially executed slice order given the fact that the order could have been fully executed were it an equivalent market order. Panel A: Average Execution Price
Avg. Price (NIS)
All Buy Sell
Mean 273.45 357.17 246.98 Std. dev 315.62 343.7 61.62 Q1 171.78 183.89 227.47 Median 179.17 197.83 235.97 Q3 308.79 407.87 276.73
Hypothetical
Market Order
Mean 174.06 182.89 209.9 Std. dev 0.44 0.52 0.11 Q1 173.79 182.68 209.78 Median 174.1 182.9 209.93
Slice
Order
Q3 174.31 183.25 209.99
Panel B: Average Return
Avg. Return after 15 min (in % ) Avg. Return after 60 min (in % )
All Buy Sell All Buy Sell
Mean -11.55 -1.98 -22.39 -11.54 -1.97 -22.37
Std. dev 47.09 56.06 28.11 47.07 56.05 28.17
Q1 -31.49 -21.13 -30.28 -31.50 -21.14 -30.28
Median -9.47 -1.37 -20.57 -9.46 -1.34 -20.55
Q3 8.55 17.61 -15.57 8.58 17.65 -15.53
Hypothetical
Market
Order
Mean -12.37 -10.24 -14.57 -12.34 -10.21 -14.54
Std. dev 15.39 13.40 14.03 15.42 13.44 14.04
Q1 -19.51 -17.88 -23.94 -19.54 -17.90 -23.92
Median -8.57 -6.76 -11.71 -8.55 -6.74 -11.70
Q3 -2.17 -1.17 -4.43 -2.10 -1.10 -4.38
Slice
Order
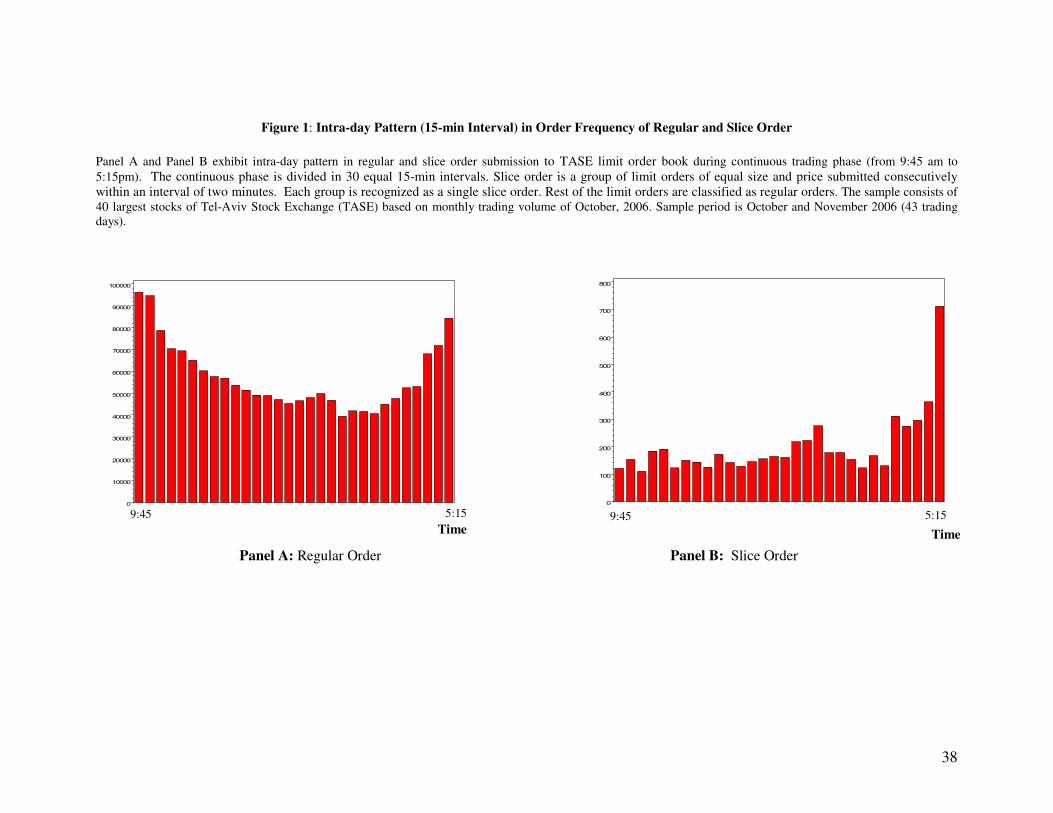
38
Figure 1: Intra-day Pattern (15-min Interval) in Order Frequency of Regular and Slice Order
Panel A and Panel B exhibit intra-day pattern in regular and slice order submission to TASE limit order book during continuous trading phase (from 9:45 am to 5:15pm). The continuous phase is divided in 30 equal 15-min intervals. Slice order is a group of limit orders of equal size and price submitted consecutively within an interval of two minutes. Each group is recognized as a single slice order. Rest of the limit orders are classified as regular orders. The sample consists of 40 largest stocks of Tel-Aviv Stock Exchange (TASE) based on monthly trading volume of October, 2006. Sample period is October and November 2006 (43 trading days).
0
10000
20000
30000
40000
50000
60000
70000
80000
90000
100000
0
100
200
300
400
500
600
700
800
Panel A: Regular Order Panel B: Slice Order
Time Time
9:45
5:15
9:45
5:15
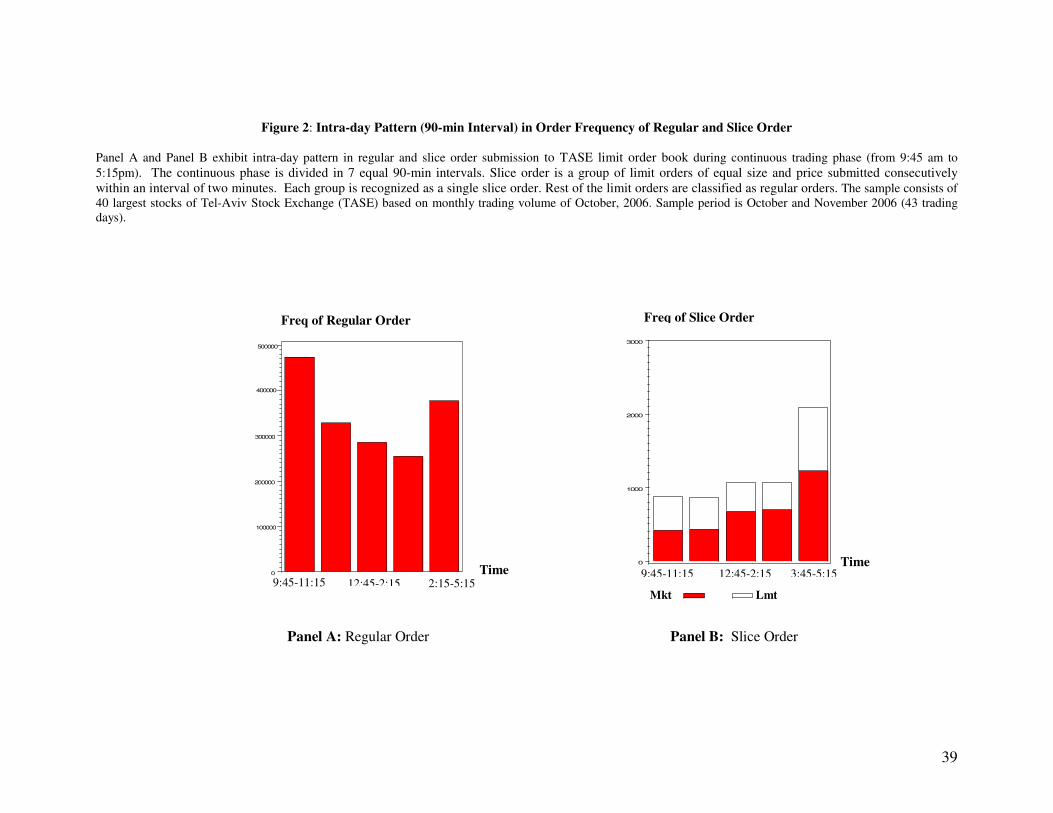
39
Figure 2: Intra-day Pattern (90-min Interval) in Order Frequency of Regular and Slice Order Panel A and Panel B exhibit intra-day pattern in regular and slice order submission to TASE limit order book during continuous trading phase (from 9:45 am to 5:15pm). The continuous phase is divided in 7 equal 90-min intervals. Slice order is a group of limit orders of equal size and price submitted consecutively within an interval of two minutes. Each group is recognized as a single slice order. Rest of the limit orders are classified as regular orders. The sample consists of 40 largest stocks of Tel-Aviv Stock Exchange (TASE) based on monthly trading volume of October, 2006. Sample period is October and November 2006 (43 trading days).
0
100000
200000
300000
400000
500000
0
1000
2000
3000
Panel A: Regular Order Panel B: Slice Order
12:45-2:15 9:45-11:15 3:45-5:15
Freq of Slice Order
Time
Freq of Regular Order
9:45-11:15
12:45-2:15
2:15-5:15
Time
Mkt Lmt
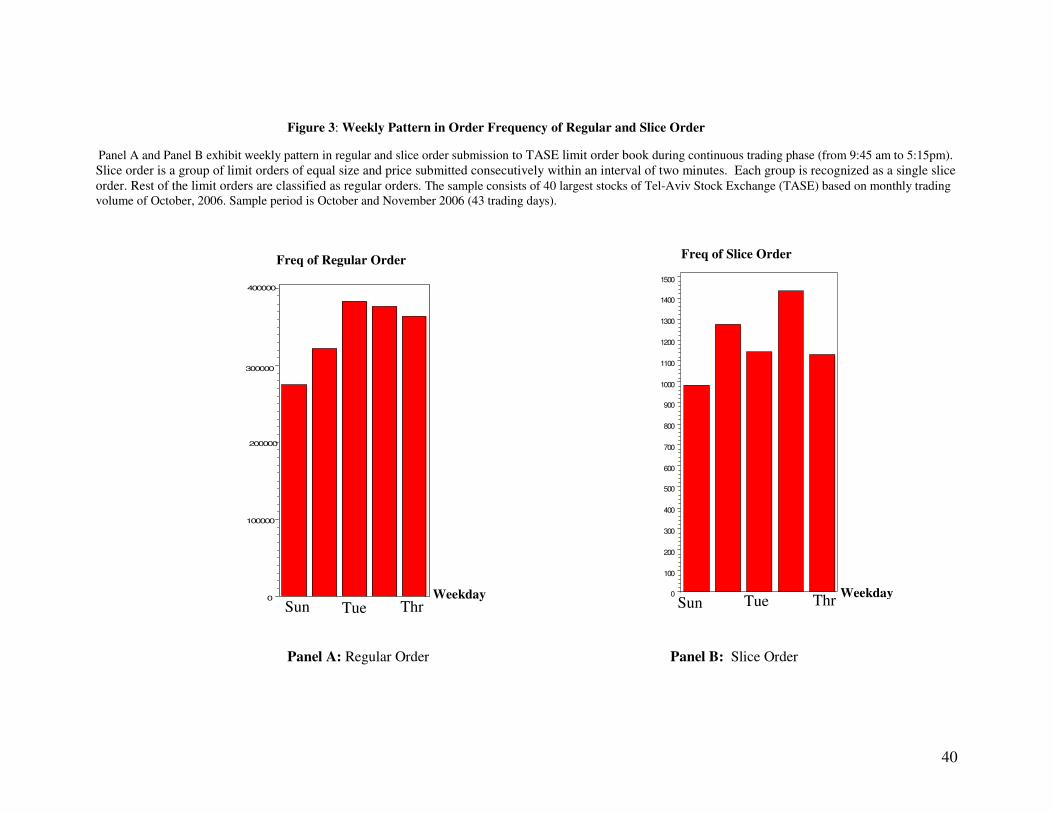
40
Figure 3: Weekly Pattern in Order Frequency of Regular and Slice Order
Panel A and Panel B exhibit weekly pattern in regular and slice order submission to TASE limit order book during continuous trading phase (from 9:45 am to 5:15pm). Slice order is a group of limit orders of equal size and price submitted consecutively within an interval of two minutes. Each group is recognized as a single slice order. Rest of the limit orders are classified as regular orders. The sample consists of 40 largest stocks of Tel-Aviv Stock Exchange (TASE) based on monthly trading volume of October, 2006. Sample period is October and November 2006 (43 trading days).
0
100000
200000
300000
400000
0
100
200
300
400
500
600
700
800
900
1000
1100
1200
1300
1400
1500
Panel A: Regular Order Panel B: Slice Order
Freq of Slice Order
Tue Sun Thr Weekday
Weekday
Freq of Regular Order
Sun Tue Thr
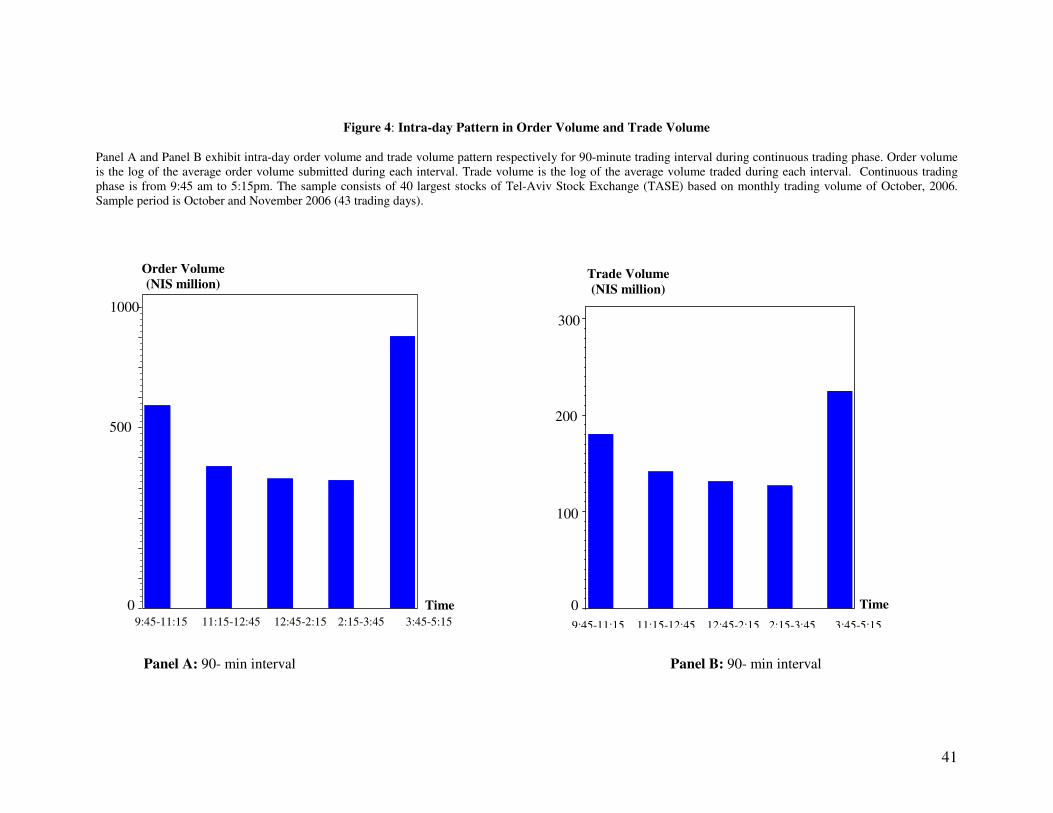
41
Figure 4: Intra-day Pattern in Order Volume and Trade Volume Panel A and Panel B exhibit intra-day order volume and trade volume pattern respectively for 90-minute trading interval during continuous trading phase. Order volume is the log of the average order volume submitted during each interval. Trade volume is the log of the average volume traded during each interval. Continuous trading phase is from 9:45 am to 5:15pm. The sample consists of 40 largest stocks of Tel-Aviv Stock Exchange (TASE) based on monthly trading volume of October, 2006. Sample period is October and November 2006 (43 trading days).
Panel A: 90- min interval Panel B: 90- min interval
Time
9:45-11:15 11:15-12:45 12:45-2:15 2:15-3:45 3:45-5:15
Order Volume
(NIS million)
500
1000
0 Time
Trade Volume
(NIS million)
200
300
100
0 9:45-11:15 11:15-12:45 12:45-2:15 2:15-3:45 3:45-5:15
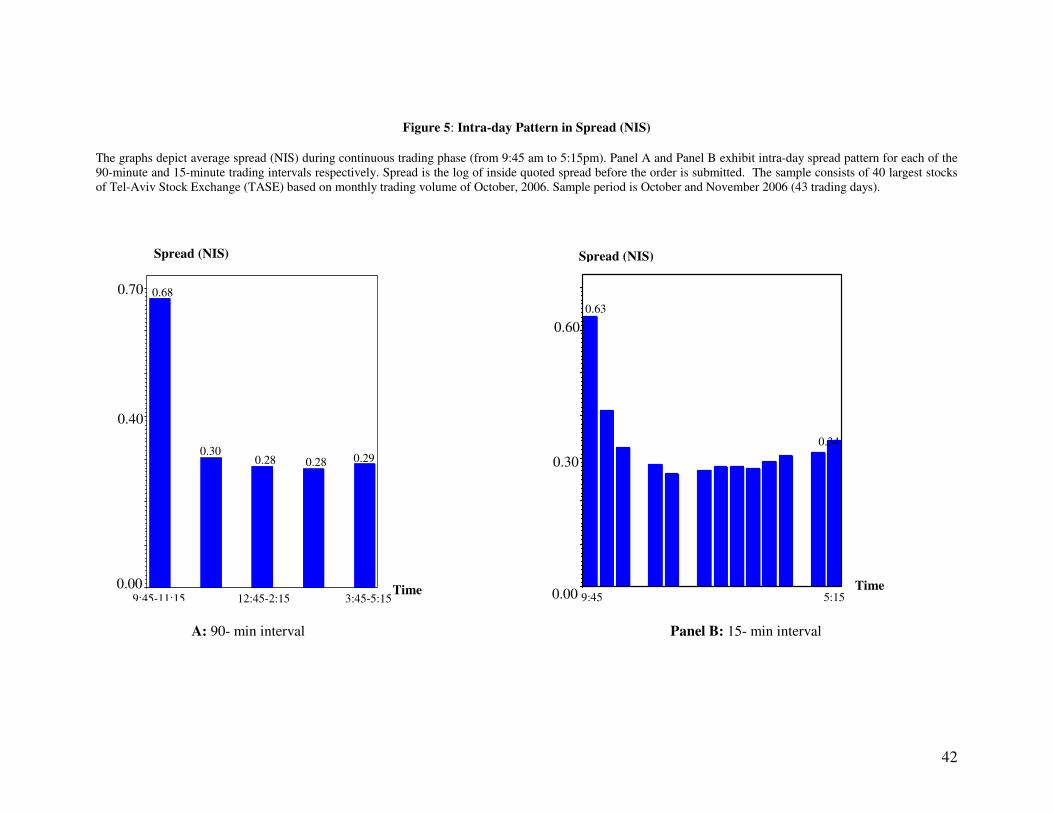
42
Figure 5: Intra-day Pattern in Spread (NIS)
The graphs depict average spread (NIS) during continuous trading phase (from 9:45 am to 5:15pm). Panel A and Panel B exhibit intra-day spread pattern for each of the 90-minute and 15-minute trading intervals respectively. Spread is the log of inside quoted spread before the order is submitted. The sample consists of 40 largest stocks of Tel-Aviv Stock Exchange (TASE) based on monthly trading volume of October, 2006. Sample period is October and November 2006 (43 trading days).
A: 90- min interval Panel B: 15- min interval
9:45-11:15 12:45-2:15 3:45-5:15
Spread (NIS)
Time
0.40
0.70
0.00
0.68
0.30 0.28 0.28 0.29
9:45 5:15 Time
Spread (NIS)
0.63
0.34
0.30
0.60
0.00
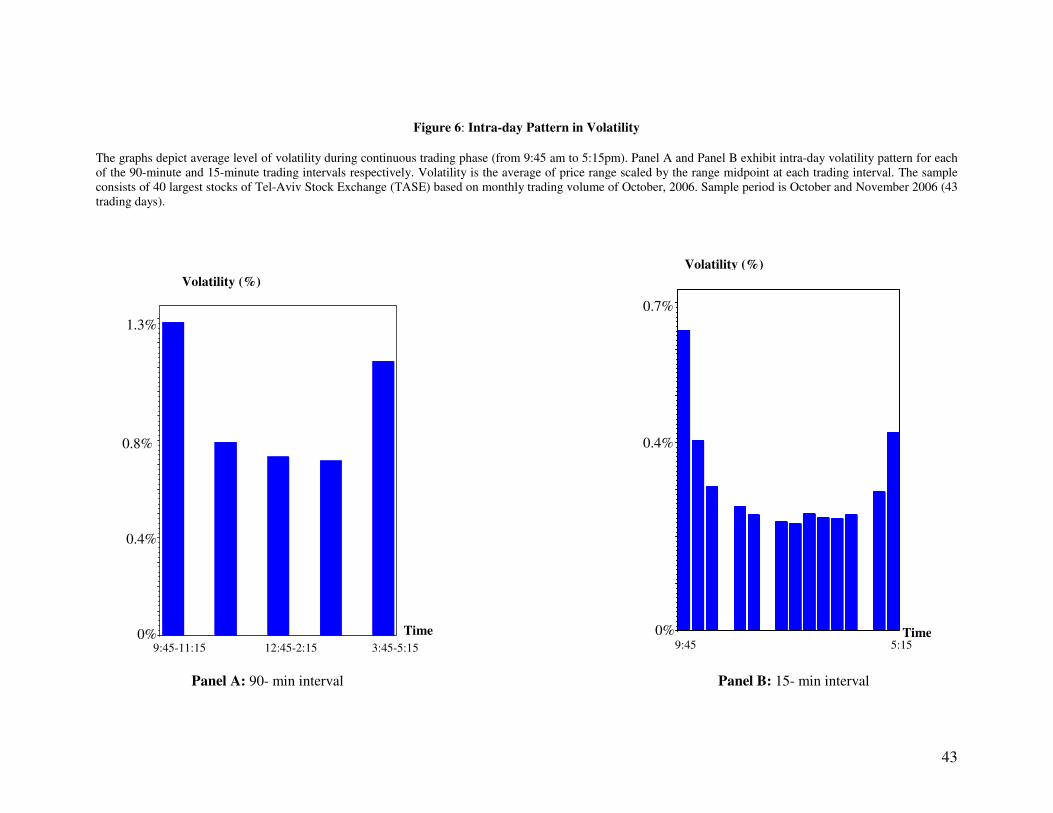
43
Figure 6: Intra-day Pattern in Volatility
The graphs depict average level of volatility during continuous trading phase (from 9:45 am to 5:15pm). Panel A and Panel B exhibit intra-day volatility pattern for each of the 90-minute and 15-minute trading intervals respectively. Volatility is the average of price range scaled by the range midpoint at each trading interval. The sample consists of 40 largest stocks of Tel-Aviv Stock Exchange (TASE) based on monthly trading volume of October, 2006. Sample period is October and November 2006 (43 trading days).
Panel A: 90- min interval Panel B: 15- min interval
Volatility (%)
Time
9:45-11:15 12:45-2:15 3:45-5:15
0.4%
1.3%
0%
0.8%
0%
0.7%
0.4%
Volatility (%)
Time 9:45 5:15