Embed Size (px)
Citation preview
Bellesi, M., de Vivo, L., Koebe, S., Tononi, G., & Cirelli, C. (2018).Sleep and Wake Affect Glycogen Content and Turnover atPerisynaptic Astrocytic Processes. Frontiers in Cellular Neuroscience,12, [308]. https://doi.org/10.3389/fncel.2018.00308
Publisher's PDF, also known as Version of recordLicense (if available):CC BYLink to published version (if available):10.3389/fncel.2018.00308
Link to publication record in Explore Bristol ResearchPDF-document
This is the final published version of the article (version of record). It first appeared online via Frontiers at DOI:10.3389/fncel.2018.00308. Please refer to any applicable terms of use of the publisher.
University of Bristol - Explore Bristol ResearchGeneral rights
This document is made available in accordance with publisher policies. Please cite only thepublished version using the reference above. Full terms of use are available:http://www.bristol.ac.uk/red/research-policy/pure/user-guides/ebr-terms/
ORIGINAL RESEARCHpublished: 11 September 2018doi: 10.3389/fncel.2018.00308
Sleep and Wake Affect GlycogenContent and Turnover at PerisynapticAstrocytic ProcessesMichele Bellesi1,2*, Luisa de Vivo1, Samuel Koebe1, Giulio Tononi1 and Chiara Cirelli1*
1Department of Psychiatry, University of Wisconsin-Madison, Madison, WI, United States, 2Department of Experimentaland Clinical Medicine, Section of Neuroscience and Cell Biology, Università Politecnica delle Marche, Ancona, Italy
Edited by:Arianna Maffei,
Stony Brook University, United States
Reviewed by:Mirko Santello,
Universität Zürich, SwitzerlandMauro DiNuzzo,
University of Copenhagen, Denmark
*Correspondence:Michele Bellesi
[email protected] Cirelli
Received: 08 June 2018Accepted: 23 August 2018
Published: 11 September 2018
Citation:Bellesi M, de Vivo L, Koebe S,
Tononi G and Cirelli C (2018) Sleepand Wake Affect Glycogen Content
and Turnover at PerisynapticAstrocytic Processes.
Front. Cell. Neurosci. 12:308.doi: 10.3389/fncel.2018.00308
Astrocytic glycogen represents the only form of glucose storage in the brain, and oneof the outcomes of its breakdown is the production of lactate that can be used byneurons as an alternative energetic substrate. Since brain metabolism is higher in wakethan in sleep, it was hypothesized that glycogen stores are depleted during wake andreplenished during sleep. Furthermore, it was proposed that glycogen depletion leads tothe progressive increase in adenosine levels during wake, providing a homeostatic signalthat reflects the buildup of sleep pressure. However, previous studies that measuredglycogen dynamics across the sleep/wake cycle obtained inconsistent results, and onlymeasured glycogen in whole tissue. Since most energy in the brain is used to sustainsynaptic activity, here we employed tridimensional electron microscopy to quantifyglycogen content in the astrocytic processes surrounding the synapse. We studiedaxon-spine synapses in the frontal cortex of young mice after ∼7 h of sleep, 7–8 hof spontaneous or forced wake, or 4.5 days of sleep restriction. Relative to sleep, allwake conditions increased the number of glycogen granules around the synapses toa similar extent. However, progressively longer periods of wake were associated withprogressively smaller glycogen granules, suggesting increased turnover. Despite theincreased number of granules, in all wake conditions the estimated amount of glucosewithin the granules was lower than in sleep, indicating that sleep may favor glucosestorage. Finally, chronic sleep restriction moved glycogen granules closer to the synapticcleft. Thus, both short and long wake lead to increased glycogen turnover around corticalsynapses, whereas sleep promotes glycogen accumulation.
Keywords: mouse, cerebral cortex, sleep, sleep deprivation, chronic sleep restriction, glycogen
INTRODUCTION
The human brain has remarkably high energy demands, accounting for ∼20% of the bodymetabolism (Attwell and Laughlin, 2001). Glucose is the main energetic substrate of the brain,and increases in local blood flow and glucose utilization typically follow changes in brain activity(Bélanger et al., 2011).
While local increases in cerebral blood flow are well recognized phenomena, the cellularresponses to energy demand remain controversial. Nerve endings can directly uptake andoxidize glucose under both resting and activated conditions (Patel et al., 2014). Consistent withthese findings, a recent study used two-photon imaging of a near-infrared 2-deoxyglucose analog
Frontiers in Cellular Neuroscience | www.frontiersin.org 1 September 2018 | Volume 12 | Article 308
Bellesi et al. Perisynaptic Glycogen Changes With Sleep and Wake
to estimate cellular glucose uptake, observing that glucoseis taken up preferentially by neurons in awake mice and,following sensory stimulation, in anesthetized mice (Lundgaardet al., 2015). Using genetically-encoded fluorescent biosensors,another study assessed the metabolic responses of individualneurons to stimulation and found increased direct glucoseconsumption by neurons, thus confirming that neurons candirectly utilize glucose as needed (Díaz-García et al., 2017).Other lines of evidence support the ‘‘astrocyte-neuron lactateshuttle’’ (ANLS) hypothesis (Pellerin and Magistretti, 1994;Barros et al., 2009; Chuquet et al., 2010; Magistretti andAllaman, 2018), which proposes that astrocytes primarily uptakeglucose from the blood, and upon glutamatergic stimulation,glucose is converted to lactate in astrocytes, which can be thenextruded into the extracellular space. The released lactate canbe used by neurons as an additional oxidative substrate tosatisfy their energy needs (Pellerin andMagistretti, 1994; Pellerinet al., 2007; Bélanger et al., 2011) and to promote synapticplasticity (Suzuki et al., 2011; Yang et al., 2014; Magistrettiand Allaman, 2018). The exclusive compartmentalization ofglycogen in astrocytes, together with the robust production oflactate upon glycogenolysis, potentially enables the astrocytes tobuffer sudden increases in energy requirements (Bouzier-Soreand Pellerin, 2013).
In astrocytes glucose is stored in the form of glycogen, whichrepresents the only long-term glucose deposit in the brain (Obelet al., 2012). During neuronal activation, glycogen is quicklymobilized to glycolytically produce lactate (Dringen et al., 1993;Walls et al., 2009) or, alternatively, it can promote glucose uptakefrom the interstitium to nearby activated neurons (DiNuzzo et al.,2010). Sustained neuronal activity can lead to the depletion ofglycogen stores in the brain. This finding, together with the factthat overall neuronal activity often decreases during sleep, hasled to the hypothesis that one of the functions of sleep is toreplenish glycogen stores that are progressively depleted duringwake (Benington and Heller, 1995; Scharf et al., 2008). Thus,many attempts have been carried out to measure changes inglycogen content between sleep and wake. However, althoughthere is substantial evidence showing increased expression ofkey transcripts involved in glycogen synthesis during wake (Petitet al., 2002, 2010; Bellesi et al., 2015), direct measurementsof glycogen amount across the sleep/wake cycle have led toinconsistent results (Gip et al., 2002; Kong et al., 2002; Frankenet al., 2003, 2006; Petit et al., 2010). Early experiments using rapidbrain freezing found a large increase of cerebral glycogen contentduring sleep, which dissipated very quickly upon awakening(Karnovsky et al., 1983). More recently, high-energy focusedmicrowave irradiation was used to inactivate enzymes implicatedin the metabolism of glycogen (Gip et al., 2002). With thismethod glycogen levels were found to decrease in the cerebellumof young rats after 6 h of sleep deprivation (SD), increase inthe cerebral cortex of adult rats (p59) after 12 h of SD (Gipet al., 2002), and decrease in the rat forebrain after 12 or 24 hof SD (Kong et al., 2002). With the same microwave irradiationmethod levels of glycogen were found to increase in the cerebralcortex of B6 mice but did not change in AK and D2 mice,while in the latter two strains they decreased in brainstem and
cerebellum (Franken et al., 2003, 2006). No change in glycogenlevels were found in OF1 outbred mice after periods of wakeenforced either by exposing the mice to novel objects and newnesting material, or by administering the wake-promoting drugmodafinil (Petit et al., 2010). In the fly brain glycogen levelsdecrease after 3 h of SD but return to levels comparable tothose measured during sleep after 6 h of SD (Zimmerman et al.,2004).
Since glycogen content critically depends on physicalexercise and behavior, these variable findings may reflecttrue biological differences due to age and animal species.They may also depend on the specific brain region tested.Glycogen levels are heterogeneous in the cerebral tissue (Oeet al., 2016), with different regions showing different ratesof glycogen depletion and production (Scharf et al., 2008),and wake-related increases in neuronal activity and aerobicglycolysis are not the same across the entire brain (Hobsonand McCarley, 1971; Phelps, 1972; Goyal et al., 2014). On theother hand, inconsistent results may also reflect the technicalchallenge of measuring glycogen, which degrades rapidly infresh tissue (Lowry et al., 1964; Fiala et al., 2003). Anelectron microscopy study showed that glycogen granules inastrocytes almost disappear in acute slices when comparedwith perfusion-fixed tissue (Fiala et al., 2003), suggestingthat utilization of fixed tissue may lead to more consistentresults.
Irrespective of the issues mentioned above, most studiesso far have examined how sleep and wake affect glycogenlevels across brain tissues indiscriminately, rather than aroundsynapses, where energetically demanding processes take place(Attwell and Laughlin, 2001). Here, we employ serial-block facescanning electron microscopy (SB-SEM) to quantify glycogencontent surrounding asymmetric (excitatory) synapses in layerII–III of the cerebral cortex of adolescent mice that were asleepfor several hours or mostly awake for hours or days. We focusedon the primary motor cortex, the same region where we hadpreviously described sleep/wake related ultrastructural changesin the cell bodies of pyramidal neurons (de Vivo et al., 2016) andin synapses (de Vivo et al., 2017).
MATERIALS AND METHODS
AnimalsHomozygous B6.Cg-Tg(Thy1-YFP)16Jrs/J transgenic mice ofeither sex (4 week old) were used in this study. Sleep and synapsedynamics, including the analysis of perisynaptic astrocyticprocesses (PAPs), have been extensively characterized in thismouse strain (Maret et al., 2011; de Vivo et al., 2014, 2017;Bellesi et al., 2015, 2017). Mice were housed in groups (4 percage) in environmentally controlled conditions (light/dark 12:12,light on at 8 am, 23± 1◦C; food and water available ad libitumand replaced daily at 8 am). All animal procedures followed theNational Institutes of Health Guide for the Care and Use ofLaboratory Animals and facilities were reviewed and approvedby the IACUC of the University of Wisconsin-Madison and wereinspected and accredited by AAALAC. Mouse protocol number:M005697.
Frontiers in Cellular Neuroscience | www.frontiersin.org 2 September 2018 | Volume 12 | Article 308
Bellesi et al. Perisynaptic Glycogen Changes With Sleep and Wake
Experimental Conditions and Protocols forAcute and Chronic Sleep LossMice of the same age and comparable weight (∼12 g at p25) wererandomly assigned to four experimental groups (Figure 1A):(1) sleeping (S, n = 3)mice were killed during the light phase after6–7 h of sleep and at the end of a long period of sleep (>45 min,interrupted by periods of wake of <4 min); (2) spontaneouslyawake (W, n = 3) mice were killed during the dark phaseafter ∼7 h of wake and at the end of a long period of wake(>1 h, interrupted by periods of sleep of <5 min); (3) acutelySD (n = 3) mice were sacrificed during the light phase after8 h of SD enforced by introducing novel objects and newbedding whenever the animals appeared drowsy. This methodhas been validated in previous studies using EEG-implantedmice(Bellesi et al., 2013, 2015) and leads to a reduction of total sleep>95% during the deprivation procedure; and (4) chronicallysleep restricted (CSR; n = 3) mice were subjected to 4 1
2 daysof chronic sleep restriction using a protocol optimized in ourlaboratory, consisting in exposure to novel objects during theday and forced locomotion on a slowly rotating treadmill duringthe night (see Bellesi et al., 2017 for details). In previousexperiments we found that this method decreases overall sleepduration by ∼70% (de Vivo et al., 2016). S, SD and CSRmice were killed at the same time of day (∼4 pm), whileW mice were killed at ∼4 am (Figure 1A). To standardizethe possible effects of physical exercise and environmentalstressors on glycogen dynamics, during the dark period of the2–4 days prior to the experiment both S and W mice hadaccess to running wheels and were given 2–3 novel objects toexplore.
Video Recordings of Behavioral StatesTo avoid potential tissue damage and inflammation mice werenot implanted with EEG electrodes. Behavioral states in Sand W mice were estimated by quantifying motor activityusing continuous video-monitoring with infrared cameras.As previously described (Maret et al., 2011), this methodconsistently estimates total sleep time with≥90% accuracy, but itcannot differentiate NREM sleep from REM sleep. During the SDprocedure SD and CSR mice were visually monitored by trainedobservers.
Ultrastructural StudiesQuantification of glycogen content and analysis of synapticultrastructure were performed in the same image datasetpreviously used to characterize the dynamics of PAPs in S, SD,W and CSR mice (Bellesi et al., 2015), and a detailed descriptionof the methods (staining, acquisition, and profiles segmentation)is reported there. Immediately before the perfusion, S, SD,W and CSR mice were quickly moved from the recordingchamber to the perfusion room, they were picked by the tail,and gently positioned inside the anesthesia box prefilled with3% isoflurane. After ∼30 s, mice were moved on the perfusiontray equipped with an anesthesia mask and, when the cornealreflex and tail-pinch reflex were lost, the perfusion procedurebegan. All these procedures took a comparable amount of
time (∼1.5 min) in all mice and no signs of distress or painwere noticed. Under anesthesia mice (3 animals/group) wereperfused intracardially with a solution of 0.05 M phosphatebuffered saline (∼5 s followed by 2.5% glutaraldehyde and 2%paraformaldehyde dissolved in 0.1 M sodium cacodylate buffer(41◦C and pH 7.4, 250 ml in about 10 min at 300 mmHg)using a Perfusion One Instrument (Leica Biosystem). It isworth mentioning that the operators (MB and LV) performingthe perfusions were not blind to the experimental condition.However, the procedure was consistently carried out in allmice using the same fixatives, and the time between theincision of the diaphragm and fixatives reaching the tissues wasconstantly <50 s. Brain tissue was sliced using a vibratomeand stained with a solution of 1.5% potassium ferrocyanide/2%osmium tetroxide followed by 1% thiocarbonhydrazide, 2%osmium tetroxide and 1% uranyl acetate at 4◦C. Next, the tissuewas stained with a solution of lead aspartate, dehydrated andembedded with Durcopan resin and ACLAR film. Small volumesof tissue of about ∼1 mm3 were obtained from frontal cortex(AP 1.85 mm; ML 1.5 mm), glued on the tip of a metal pin, andcoated with silver paint to minimize specimen charging duringimaging.
Image AcquisitionImages were acquired using a SIGMATM VP field emissionscanning electron microscope (Carl Zeiss NTS Ltd.) equippedwith 3Viewr Technology (Gatan Inc.), and a backscatteredelectron detector (SBF-SEM). Image series were processed andanalyzed using TrakEM2, a FIJI plug-in (Schindelin et al.,2012). Segmentation of spine heads, axon-spine interface (ASI),astrocytic profiles were performed manually by two operatorsblind to the experimental condition. Small cuboid regions ofinterest (ROI, 2–4 µm per side) of neuropil (layer II–III ofprimary motor cortex; 1.85 mm anterior to Bregma, 1.5 mmlateral) were selected around synapses randomly chosen inthe neuropil. PAPs were recognized based on their distinctiveshapes and the presence of glycogen granules, as well as thefact that they infiltrate among neuronal profiles and oftencontact parts of the synapse. ROIs did not include largedendrites or soma of neurons, glia or endothelial cells. Foreach ROI, astrocytic volume and ROI volume were estimated.Glycogen granules within the astrocytes were also manuallyannotated using the ball tool of TrakEM2. Annotation ofthe EM images was performed by two operators (MB andSK) blind to the experimental condition. Blinding procedureconsisted in renaming file names using a computer-basedshuffle key. The ball size was adjusted to cover the entireelectron dense area occupied by the granule. Glycogen granulesdensity was normalized to the astrocytic volume within eachROI. To estimate the number of glucose residues (GR)stored within glycogen granules, we applied the followingformula: GR = 13∗(2∧(diameter/(2∗L)) − 1), where 13 isthe average number of GR per chain, 2 is the branchingdegree, L is the length of one tier (approximately equalto 1.9 nm; Roach et al., 2012; DiNuzzo, 2013). Glycogengranules distance from ASI was computed by using acustom-made script in TrakEM2, which calculated the shortest
Frontiers in Cellular Neuroscience | www.frontiersin.org 3 September 2018 | Volume 12 | Article 308
Bellesi et al. Perisynaptic Glycogen Changes With Sleep and Wake
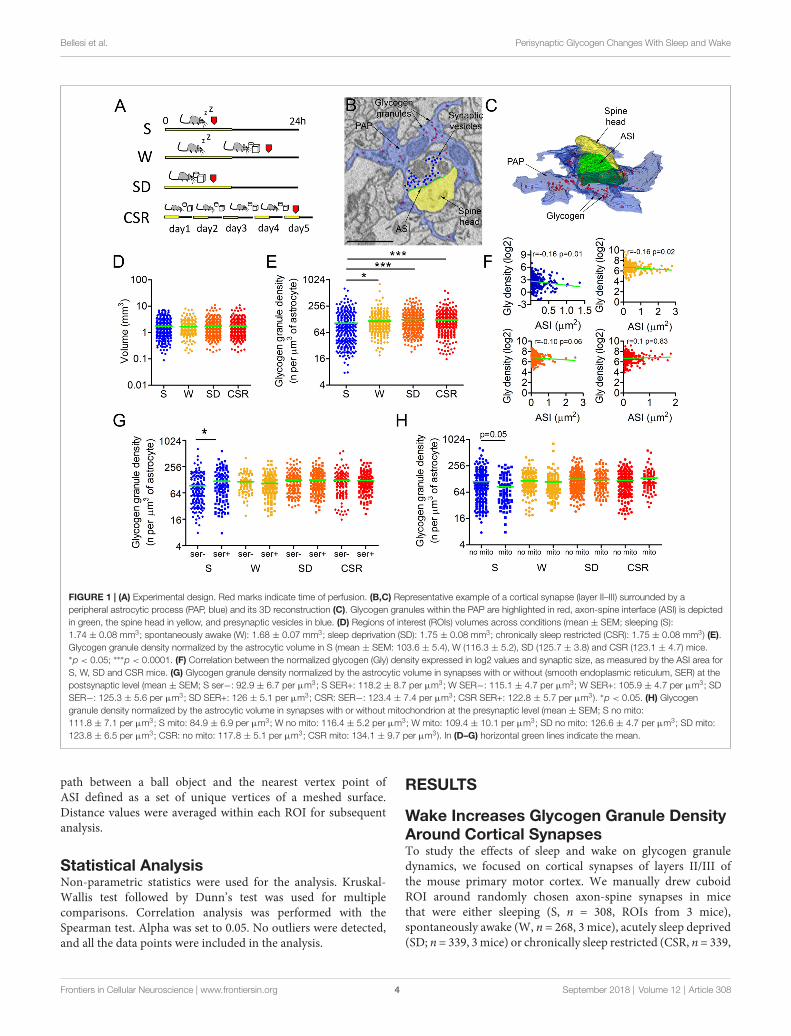
FIGURE 1 | (A) Experimental design. Red marks indicate time of perfusion. (B,C) Representative example of a cortical synapse (layer II–III) surrounded by aperipheral astrocytic process (PAP, blue) and its 3D reconstruction (C). Glycogen granules within the PAP are highlighted in red, axon-spine interface (ASI) is depictedin green, the spine head in yellow, and presynaptic vesicles in blue. (D) Regions of interest (ROIs) volumes across conditions (mean ± SEM; sleeping (S):1.74 ± 0.08 mm3; spontaneously awake (W): 1.68 ± 0.07 mm3; sleep deprivation (SD): 1.75 ± 0.08 mm3; chronically sleep restricted (CSR): 1.75 ± 0.08 mm3) (E).Glycogen granule density normalized by the astrocytic volume in S (mean ± SEM: 103.6 ± 5.4), W (116.3 ± 5.2), SD (125.7 ± 3.8) and CSR (123.1 ± 4.7) mice.∗p < 0.05; ∗∗∗p < 0.0001. (F) Correlation between the normalized glycogen (Gly) density expressed in log2 values and synaptic size, as measured by the ASI area forS, W, SD and CSR mice. (G) Glycogen granule density normalized by the astrocytic volume in synapses with or without (smooth endoplasmic reticulum, SER) at thepostsynaptic level (mean ± SEM; S ser−: 92.9 ± 6.7 per µm3; S SER+: 118.2 ± 8.7 per µm3; W SER−: 115.1 ± 4.7 per µm3; W SER+: 105.9 ± 4.7 per µm3; SDSER−: 125.3 ± 5.6 per µm3; SD SER+: 126 ± 5.1 per µm3; CSR: SER−: 123.4 ± 7.4 per µm3; CSR SER+: 122.8 ± 5.7 per µm3). ∗p < 0.05. (H) Glycogengranule density normalized by the astrocytic volume in synapses with or without mitochondrion at the presynaptic level (mean ± SEM; S no mito:111.8 ± 7.1 per µm3; S mito: 84.9 ± 6.9 per µm3; W no mito: 116.4 ± 5.2 per µm3; W mito: 109.4 ± 10.1 per µm3; SD no mito: 126.6 ± 4.7 per µm3; SD mito:123.8 ± 6.5 per µm3; CSR: no mito: 117.8 ± 5.1 per µm3; CSR mito: 134.1 ± 9.7 per µm3). In (D–G) horizontal green lines indicate the mean.
path between a ball object and the nearest vertex point ofASI defined as a set of unique vertices of a meshed surface.Distance values were averaged within each ROI for subsequentanalysis.
Statistical AnalysisNon-parametric statistics were used for the analysis. Kruskal-Wallis test followed by Dunn’s test was used for multiplecomparisons. Correlation analysis was performed with theSpearman test. Alpha was set to 0.05. No outliers were detected,and all the data points were included in the analysis.
RESULTS
Wake Increases Glycogen Granule DensityAround Cortical SynapsesTo study the effects of sleep and wake on glycogen granuledynamics, we focused on cortical synapses of layers II/III ofthe mouse primary motor cortex. We manually drew cuboidROI around randomly chosen axon-spine synapses in micethat were either sleeping (S, n = 308, ROIs from 3 mice),spontaneously awake (W, n = 268, 3 mice), acutely sleep deprived(SD; n = 339, 3mice) or chronically sleep restricted (CSR, n = 339,
Frontiers in Cellular Neuroscience | www.frontiersin.org 4 September 2018 | Volume 12 | Article 308
Bellesi et al. Perisynaptic Glycogen Changes With Sleep and Wake
3 mice; Figure 1A). Within each ROI, the ASI of the synapse(the direct area of contact between the axonal bouton and thespine head), as well as the surrounding PAPs were manuallysegmented (Figures 1B,C). Astrocytic profiles were recognizeddue to their ability to interdigitate among neuronal structures,a clear cytoplasm, and the presence of numerous granules ofglycogen (Figures 1B,C). PAP detection was facilitated by theability to scroll within the stack along the third-dimension. Apreliminary analysis of all stacks never revealed ultrastructuralsignatures of anoxia or necrosis (Van Reempts, 1984).
First, we confirmed that the amount of neuropil analyzedwas comparable across experimental conditions (p = 0.64,Figure 1D). Then, we calculated the normalized density ofglycogen granules, that is, all glycogen granules were annotatedwithin each ROI and their number was divided by the volumeof the astrocyte within the ROI. We found that the normalizeddensity of glycogen granules was strongly affected by behavioralstate (p < 0.0001), with W (p = 0.01), SD (p < 0.0001), andCSR (p < 0.0001) showing higher densities than S (Figure 1E).Moreover, the normalized density of glycogen granules wasnegatively correlated with the ASI in S (r = −0.16, p = 0.01)and W (r = −0.16, p = 0.02), indicating that after sleepand spontaneous wake small-medium synapses could counton higher number of glycogen granules than large synapses.However, this was no longer the case as the time spentawake increased: after SD the negative correlation was onlya trend (r = −0.1, p = 0.06) and it disappeared after CSR(r = 0.1, p = 0.83), indicating that after extended wake glycogengranules were equally distributed to all synapses (Figure 1F).We recently demonstrated that synapses whose spine headscontain endoplasmic organelles (smooth endoplasmic reticulum,SER) are more likely to undergo sleep-related downscalingcompared to synapses devoid of SER (de Vivo et al., 2017).Endoplasmic elements may mediate the recycling of membranes,glutamate receptors, and other proteins involved in activity-dependent structural changes (Park et al., 2006). Lactate, theby-product of glycogen breakdown, has been involved in synapticplasticity (Gibbs et al., 2006; Suzuki et al., 2011). Thus, wealso compared the density of glycogen granules across groupsseparately in synapses with and without SER (% of total synapses:S = 57.5; W = 35.9; SD = 47.2; CSR = 48.6). In both typesof synapses wake groups had more granules than the sleepgroup, although the effect was stronger in synapses without SER(SER+: p = 0.01; SER−: p < 0.0001). We also assessed whetherthe presence of SER was related to the density of glycogengranules within each experimental group. This was the case inS mice (p = 0.016), while all wake conditions showed comparable(p > 0.05) densities of glycogen granules between SER+ andSER− synapses (Figure 1G).
Within the astrocytes, glycogen breakdown can ultimatelylead to the production of lactate, which in turn can beextruded by these cells through dedicated lactate transporters(Bélanger et al., 2011). Outside the astrocytes, lactate acts asa signaling molecule (Yang et al., 2014) or can be up takenby neurons and used as an energetic substrate (Pellerin et al.,2007), particularly in case of intense synaptic activity (Brownand Ransom, 2015). Mitochondria are also a key source of
energy at the synapse level (Ly and Verstreken, 2006), sincethey host the machinery to fully oxidize glucose and pyruvatederived from lactate dehydrogenation (Pellerin et al., 2007).Thus, we also compared the density of glycogen granules acrossgroups separately in synapses with and without a presynapticmitochondrion (% of total synapses: S = 69.5; W = 66.1;SD = 67.7; CSR = 59.9). We found that in both types ofsynapses the wake groups hadmore granules than the sleep group(Mito+: p < 0.0001; Mito−: p = 0.001). We also tested whether,within each experimental group, the presence of a presynapticmitochondrion was related to the density of glycogen granules.In S mice the density of glycogen granules trended to be higherin synapses lacking the presynaptic mitochondrion (p = 0.05).However, this was not the case during waking: in all wakegroups (W, SD, CSR) synapses with or without a mitochondrionshowed a comparable density of glycogen granules (Figure 1H).This analysis was not applied to post-synaptic sites becausemitochondria, albeit rarely present in the spine head (<1%),were almost always present along the dendrite within 2 µmfrom the point in which the spine neck emerged from theshaft.
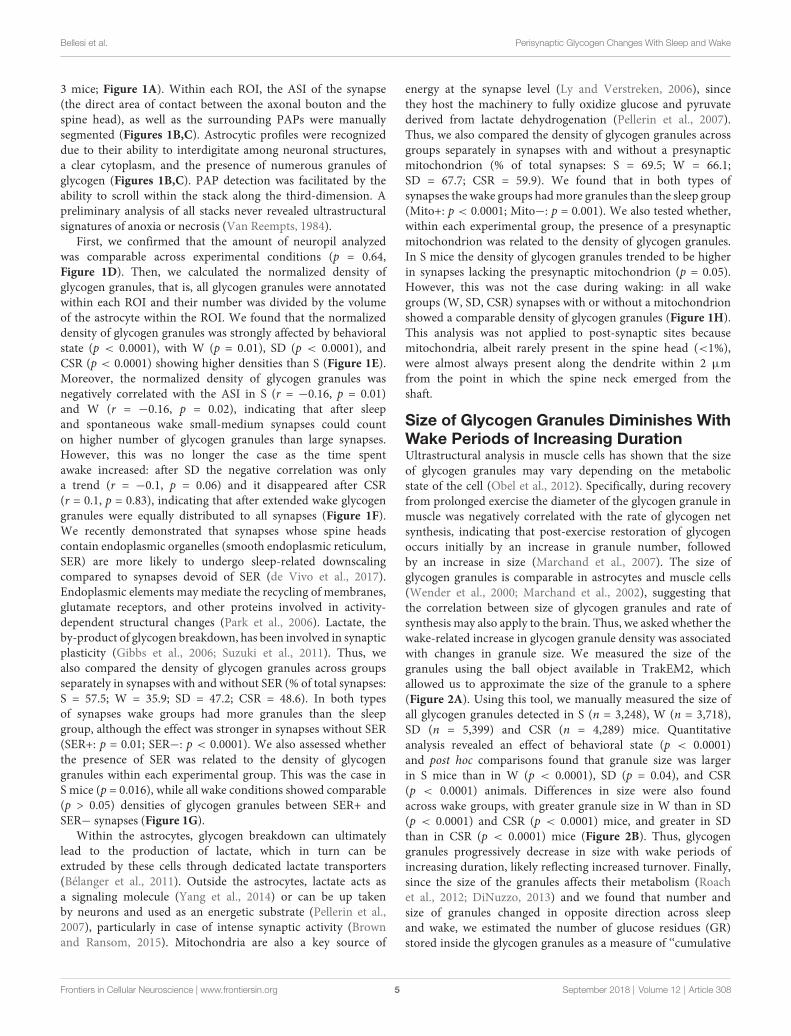
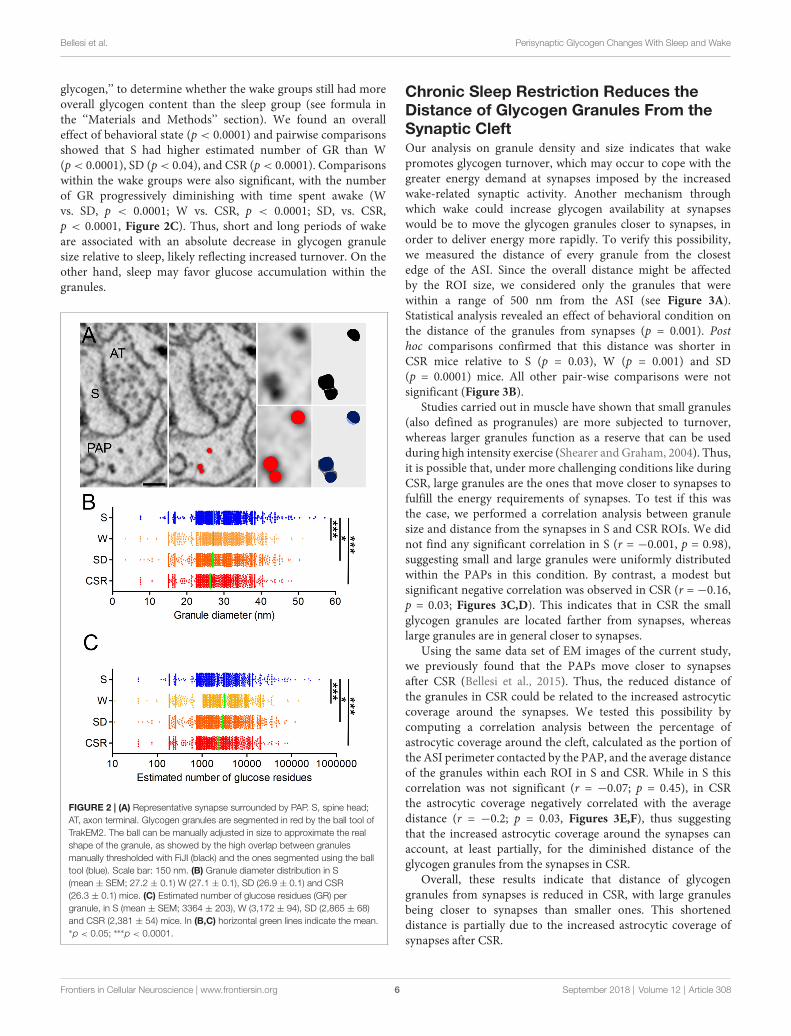
Size of Glycogen Granules Diminishes WithWake Periods of Increasing DurationUltrastructural analysis in muscle cells has shown that the sizeof glycogen granules may vary depending on the metabolicstate of the cell (Obel et al., 2012). Specifically, during recoveryfrom prolonged exercise the diameter of the glycogen granule inmuscle was negatively correlated with the rate of glycogen netsynthesis, indicating that post-exercise restoration of glycogenoccurs initially by an increase in granule number, followedby an increase in size (Marchand et al., 2007). The size ofglycogen granules is comparable in astrocytes and muscle cells(Wender et al., 2000; Marchand et al., 2002), suggesting thatthe correlation between size of glycogen granules and rate ofsynthesis may also apply to the brain. Thus, we asked whether thewake-related increase in glycogen granule density was associatedwith changes in granule size. We measured the size of thegranules using the ball object available in TrakEM2, whichallowed us to approximate the size of the granule to a sphere(Figure 2A). Using this tool, we manually measured the size ofall glycogen granules detected in S (n = 3,248), W (n = 3,718),SD (n = 5,399) and CSR (n = 4,289) mice. Quantitativeanalysis revealed an effect of behavioral state (p < 0.0001)and post hoc comparisons found that granule size was largerin S mice than in W (p < 0.0001), SD (p = 0.04), and CSR(p < 0.0001) animals. Differences in size were also foundacross wake groups, with greater granule size in W than in SD(p < 0.0001) and CSR (p < 0.0001) mice, and greater in SDthan in CSR (p < 0.0001) mice (Figure 2B). Thus, glycogengranules progressively decrease in size with wake periods ofincreasing duration, likely reflecting increased turnover. Finally,since the size of the granules affects their metabolism (Roachet al., 2012; DiNuzzo, 2013) and we found that number andsize of granules changed in opposite direction across sleepand wake, we estimated the number of glucose residues (GR)stored inside the glycogen granules as a measure of ‘‘cumulative
Frontiers in Cellular Neuroscience | www.frontiersin.org 5 September 2018 | Volume 12 | Article 308
Bellesi et al. Perisynaptic Glycogen Changes With Sleep and Wake
glycogen,’’ to determine whether the wake groups still had moreoverall glycogen content than the sleep group (see formula inthe ‘‘Materials and Methods’’ section). We found an overalleffect of behavioral state (p < 0.0001) and pairwise comparisonsshowed that S had higher estimated number of GR than W(p < 0.0001), SD (p < 0.04), and CSR (p < 0.0001). Comparisonswithin the wake groups were also significant, with the numberof GR progressively diminishing with time spent awake (Wvs. SD, p < 0.0001; W vs. CSR, p < 0.0001; SD, vs. CSR,p < 0.0001, Figure 2C). Thus, short and long periods of wakeare associated with an absolute decrease in glycogen granulesize relative to sleep, likely reflecting increased turnover. On theother hand, sleep may favor glucose accumulation within thegranules.
FIGURE 2 | (A) Representative synapse surrounded by PAP. S, spine head;AT, axon terminal. Glycogen granules are segmented in red by the ball tool ofTrakEM2. The ball can be manually adjusted in size to approximate the realshape of the granule, as showed by the high overlap between granulesmanually thresholded with FiJI (black) and the ones segmented using the balltool (blue). Scale bar: 150 nm. (B) Granule diameter distribution in S(mean ± SEM; 27.2 ± 0.1) W (27.1 ± 0.1), SD (26.9 ± 0.1) and CSR(26.3 ± 0.1) mice. (C) Estimated number of glucose residues (GR) pergranule, in S (mean ± SEM; 3364 ± 203), W (3,172 ± 94), SD (2,865 ± 68)and CSR (2,381 ± 54) mice. In (B,C) horizontal green lines indicate the mean.∗p < 0.05; ∗∗∗p < 0.0001.
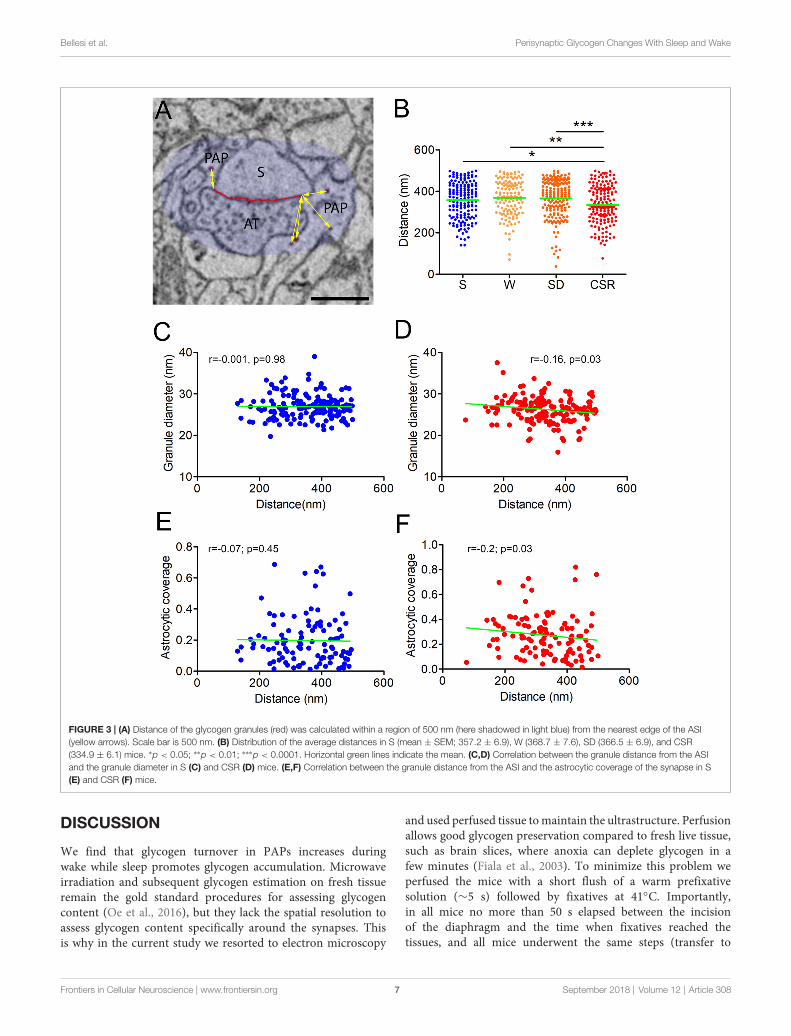
Chronic Sleep Restriction Reduces theDistance of Glycogen Granules From theSynaptic CleftOur analysis on granule density and size indicates that wakepromotes glycogen turnover, which may occur to cope with thegreater energy demand at synapses imposed by the increasedwake-related synaptic activity. Another mechanism throughwhich wake could increase glycogen availability at synapseswould be to move the glycogen granules closer to synapses, inorder to deliver energy more rapidly. To verify this possibility,we measured the distance of every granule from the closestedge of the ASI. Since the overall distance might be affectedby the ROI size, we considered only the granules that werewithin a range of 500 nm from the ASI (see Figure 3A).Statistical analysis revealed an effect of behavioral condition onthe distance of the granules from synapses (p = 0.001). Posthoc comparisons confirmed that this distance was shorter inCSR mice relative to S (p = 0.03), W (p = 0.001) and SD(p = 0.0001) mice. All other pair-wise comparisons were notsignificant (Figure 3B).
Studies carried out in muscle have shown that small granules(also defined as progranules) are more subjected to turnover,whereas larger granules function as a reserve that can be usedduring high intensity exercise (Shearer and Graham, 2004). Thus,it is possible that, under more challenging conditions like duringCSR, large granules are the ones that move closer to synapses tofulfill the energy requirements of synapses. To test if this wasthe case, we performed a correlation analysis between granulesize and distance from the synapses in S and CSR ROIs. We didnot find any significant correlation in S (r = −0.001, p = 0.98),suggesting small and large granules were uniformly distributedwithin the PAPs in this condition. By contrast, a modest butsignificant negative correlation was observed in CSR (r = −0.16,p = 0.03; Figures 3C,D). This indicates that in CSR the smallglycogen granules are located farther from synapses, whereaslarge granules are in general closer to synapses.
Using the same data set of EM images of the current study,we previously found that the PAPs move closer to synapsesafter CSR (Bellesi et al., 2015). Thus, the reduced distance ofthe granules in CSR could be related to the increased astrocyticcoverage around the synapses. We tested this possibility bycomputing a correlation analysis between the percentage ofastrocytic coverage around the cleft, calculated as the portion ofthe ASI perimeter contacted by the PAP, and the average distanceof the granules within each ROI in S and CSR. While in S thiscorrelation was not significant (r = −0.07; p = 0.45), in CSRthe astrocytic coverage negatively correlated with the averagedistance (r = −0.2; p = 0.03, Figures 3E,F), thus suggestingthat the increased astrocytic coverage around the synapses canaccount, at least partially, for the diminished distance of theglycogen granules from the synapses in CSR.
Overall, these results indicate that distance of glycogengranules from synapses is reduced in CSR, with large granulesbeing closer to synapses than smaller ones. This shorteneddistance is partially due to the increased astrocytic coverage ofsynapses after CSR.
Frontiers in Cellular Neuroscience | www.frontiersin.org 6 September 2018 | Volume 12 | Article 308
Bellesi et al. Perisynaptic Glycogen Changes With Sleep and Wake
FIGURE 3 | (A) Distance of the glycogen granules (red) was calculated within a region of 500 nm (here shadowed in light blue) from the nearest edge of the ASI(yellow arrows). Scale bar is 500 nm. (B) Distribution of the average distances in S (mean ± SEM; 357.2 ± 6.9), W (368.7 ± 7.6), SD (366.5 ± 6.9), and CSR(334.9 ± 6.1) mice. ∗p < 0.05; ∗∗p < 0.01; ∗∗∗p < 0.0001. Horizontal green lines indicate the mean. (C,D) Correlation between the granule distance from the ASIand the granule diameter in S (C) and CSR (D) mice. (E,F) Correlation between the granule distance from the ASI and the astrocytic coverage of the synapse in S(E) and CSR (F) mice.
DISCUSSION
We find that glycogen turnover in PAPs increases duringwake while sleep promotes glycogen accumulation. Microwaveirradiation and subsequent glycogen estimation on fresh tissueremain the gold standard procedures for assessing glycogencontent (Oe et al., 2016), but they lack the spatial resolution toassess glycogen content specifically around the synapses. Thisis why in the current study we resorted to electron microscopy
and used perfused tissue tomaintain the ultrastructure. Perfusionallows good glycogen preservation compared to fresh live tissue,such as brain slices, where anoxia can deplete glycogen in afew minutes (Fiala et al., 2003). To minimize this problem weperfused the mice with a short flush of a warm prefixativesolution (∼5 s) followed by fixatives at 41◦C. Importantly,in all mice no more than 50 s elapsed between the incisionof the diaphragm and the time when fixatives reached thetissues, and all mice underwent the same steps (transfer to
Frontiers in Cellular Neuroscience | www.frontiersin.org 7 September 2018 | Volume 12 | Article 308
Bellesi et al. Perisynaptic Glycogen Changes With Sleep and Wake
the perfusion room, anesthesia induction, perfusion, etc., see‘‘Materials and Methods’’ section) within a comparable amountof time. The analysis of the ultrastructure never revealedmanifest signs of anoxia or tissue necrosis in all the brainsamples. Furthermore, our analysis is based on assessingrelative differences among groups. Thus, even though someof the above described procedures (e.g., anesthesia) may affectbrain metabolism (Boretius et al., 2013) and absolute glycogencontent, it is unlikely that the changes in glycogen levelsthat we observe across groups are strongly biased by theseprocedures.
Due to the time-consuming nature of ultrastructural studiesour analysis was restricted to the axo-spine synapses of themouseprimary motor cortex and specifically to layers II/III, becausein this area ultrastructural synaptic changes due to learning andplasticity (Holtmaat and Svoboda, 2009) and to the sleep/wakecycle (de Vivo et al., 2017) are well documented. It remains tobe seen whether these findings extend outside the small areathat we analyzed. Aerobic glycolysis differs across brain regions(Goyal et al., 2014). Moreover, astrocytes in superficial and deepcortical layers differ in morphology and gene expression patterns(Lanjakornsiripan et al., 2018) and glycogen content may changeacross brain regions and cortical layers (Oe et al., 2016). Finally,our analysis did not consider the astrocytic processes close todendrites and axons, whose glycogen content could also beaffected by sleep and wake.
It is well established that glycogen breakdown followsthe release of noradrenaline, serotonin, VIP and otherneurotransmitters (Magistretti et al., 1993), which is typicallyhigher in wake than in sleep. Therefore, one should expectincreased glycogen consumption during wake. On the otherhand, several studies have also shown that wake stimulatesthe production of glycogen, as indicated by the strongupregulation of the messenger RNAs coding for the proteintargeting glycogen (PTG; Petit et al., 2002, 2010; Bellesi et al.,2015), a key enzyme of the metabolic pathway orchestratingglycogen synthesis, and for glycogenin (Petit et al., 2010),a protein leading the synthesis of new glycogen granules.Moreover, a nuclear magnetic resonance spectroscopy studyfound that rats kept awake with sensory stimuli for 5 h at thebeginning of the light phase showed augmented incorporationof [1-(13)C]-labeled glucose into glycogen relative to rats thatwere left undisturbed (Morgenthaler et al., 2009). Glycogenconsumption and synthesis work at different time scales.Glycogen breakdown is a very rapid process controlled by theenzyme glycogen phosphorylase, and does not require ATP(Brown and Ransom, 2015). By contrast, since glucose mustbe phosphorylated by a hexokynase to be used for glycogenformation, the buildup of glycogen is a relatively slow reactionand requires ATP (Hertz and Dienel, 2002). Thus, rapidglycogen consumption takes place following rapid shifts inneuronal activity, such as upon awakening, while glycogenproduction starts and proceeds slowly on the background,likely leading to the coexistence of both glycogen breakdownand glycogen formation during wake. Consistent with thisinterpretation, we found that the size of glycogen granulesdiminishes progressively with the duration of wake, strongly
suggesting that glycogen turnover increases with the time spentawake.
We also found that the distance of glycogen granules fromthe synaptic cleft is specifically reduced after several days ofsubstantial sleep restriction (to∼30% of baseline sleep). Whetherglycogen granules can move within the astrocytes is currentlyunknown, but it is well established that astrocytic peripheralprocesses are extremely motile (Bernardinelli et al., 2014). Ina previous study, we found that a few hours of wake areenough to move these processes closer to synapses (Bellesi et al.,2015). Moreover, we demonstrated that chronic sleep restrictioninduces an expansion of these processes nearby synapses, thusleading to increased astrocytic coverage of the spine head andsynaptic cleft (Bellesi et al., 2015). Here, we found that inCSR mice the astrocytic coverage of synapses is negativelycorrelated with the distance of glycogen granules from thesynaptic cleft. Moreover, we found that among all granules,the larger ones were those closer to the synapse after chronicsleep loss. In the brain, the turnover of glycogen particles occursin the larger granules (outermost tiers), because they containsubstantial amounts of glucose that can be rapidly mobilized(Roach et al., 2012; DiNuzzo, 2013). Recycling vesicles andreestablishing negative membrane potentials are extremely costlyprocesses for the synapse (Attwell and Laughlin, 2001), andchronic sleep loss may require a sustained metabolic effort toprevent synaptic damage and failure (Bellesi et al., 2017). Thus,large granules nearby the synapses could provide the readilyexpandable energy required to meet the increased needs duringsustained wake.
Glucocorticoid stress hormones are known to affect cerebralmetabolism and, specifically, glucose uptake and utilization(Landgraf et al., 1978; Horner et al., 1990; Allaman et al., 2004).in vitro studies found that glycogen content in astrocytes isreduced in the presence of glucocorticoids (Tombaugh et al.,1992; Allaman et al., 2004) and increases after adrenalectomy(Passonneau et al., 1971). Glycogen levels in the rat cerebralcortex did not change after 6 h of sleep loss, but increasedby more than 40% in the cerebral cortex of adrenalectomizedrats (Gip et al., 2002). Thus, there is converging evidence thatglucocorticoids prevent glycogen accumulation and we cannotrule out that the wake-related increase in glycogen turnoverwas due to increased levels of circulating corticosteroids. Wenote, however, that we recently found that relative to sleep,corticosterone plasma levels significantly increased in mice aftershort periods of enforced wake but showed only a trend toincrease after chronic sleep restriction (Bellesi et al., 2018), whilehere we found that glycogen turnover was higher in chronic sleeprestriction than in short SD.
In their original hypothesis, Benington and Heller (1995)proposed that depletion of glycogen during wake would leadto the progressive accumulation of adenosine, creating ahomeostatic signal that reflects the buildup of sleep pressureover the course of wake. By focusing on glycogen content closeto the synapses, we find that several hours of spontaneous orforced wake, as well as chronic sleep restriction, lead to increasedglycogen turnover and an absolute reduction in the estimatednumber of glucose residues within the granules, while sleep
Frontiers in Cellular Neuroscience | www.frontiersin.org 8 September 2018 | Volume 12 | Article 308
Bellesi et al. Perisynaptic Glycogen Changes With Sleep and Wake
promotes glycogen accumulation. In addition, by using electronmicroscopy we also find that some specific ultrastructuralfeatures of glycogen, the size of granules and their distancefrom the synaptic cleft, change according to wake duration, andmay therefore reflect to some extent sleep pressure. Previousfindings in our lab are also consistent with this conclusion.Specifically, in a recent study aimed at characterizing sleep/wakechanges in the astrocytic transcriptome we found that Ppp1r3c,the gene coding for PTG, was strongly upregulated after bothspontaneous wake and short SD relative to sleep (Bellesi et al.,2015). When the two wake conditions were compared to eachother Ppp1r3c expression was also significantly higher after SDthan after spontaneous wake (p = 0.03; W raw expression:10.2 ± 0.17, 4 h SD raw expression: 10.6 ± 0.35; Bellesi et al.,2015), suggesting that PTG-related enzymatic activity increaseswith the duration of wake. These molecular changes, togetherwith the current ultrastructural findings, suggest that glycogenturnover may to some extent reflect the accumulation of sleeppressure during wake.
Besides size, granule shape could be similarly important.Abnormal shape could reflect alterations of the granule structure,such as an inhomogeneity of chain growth owing to aberrantglycogen branching, which can lead to formation of insolubleaggregates (Roach et al., 2012; DiNuzzo et al., 2015). Althoughthese modifications often characterize pathological states(e.g., Lafora disease), it is possible that chronic sleep restrictionmay also lead to alterations in granule structure. In our study,we used a semi-automatic method to segment glycogen granules,consisting in approximating the quasi-spherical shape of
the granule to a sphere. With this method we could reliablyestimate the granule size of thousands of granules, but we couldnot detect deviations in granule eccentricity or other shapeabnormalities of the granules. More sophisticated methodsof segmentation will be required in the future to test thispossibility.
AUTHOR CONTRIBUTIONS
MB designed and performed the experiments, analyzed the data,and wrote the manuscript. LV performed the experiments andcarried out the acquisition of the EM images. SK analyzed theEM images. GT and CC designed the experiments and wrote themanuscript.
FUNDING
This work was supported by National Institutes of Health(NIH) Grants DP 1OD579 (GT), 1R01MH091326 (GT),1R01MH099231 (GT, CC), 1P01NS083514 (GT, CC) and grantsfrom Università Politecnica delle Marche (MB).
ACKNOWLEDGMENTS
We thank Benjamin Jones, Hirotaka Nagai, Midori Nagai, SakikoHonjoh, Alex Rodriguez, Kayla Peelman, Douglas Haswell, andGiovanna Spano for helping with the chronic sleep restrictionexperiments. We also thank Sophia Loschky and AndreaSchroeder for helping with EM image analysis.
REFERENCES
Allaman, I., Pellerin, L., and Magistretti, P. J. (2004). Glucocorticoids modulateneurotransmitter-induced glycogen metabolism in cultured cortical astrocytes.J. Neurochem. 88, 900–908. doi: 10.1046/j.1471-4159.2003.02235.x
Attwell, D., and Laughlin, S. B. (2001). An energy budget for signaling inthe grey matter of the brain. J. Cereb. Blood Flow Metab. 21, 1133–1145.doi: 10.1097/00004647-200110000-00001
Barros, L. F., Courjaret, R., Jakoby, P., Loaiza, A., Lohr, C., and Deitmer, J. W.(2009). Preferential transport and metabolism of glucose in Bergmann gliaover Purkinje cells: a multiphoton study of cerebellar slices. Glia 57, 962–970.doi: 10.1002/glia.20820
Bélanger, M., Allaman, I., and Magistretti, P. J. (2011). Brain energy metabolism:focus on astrocyte-neuron metabolic cooperation. Cell Metab. 14, 724–738.doi: 10.1016/j.cmet.2011.08.016
Bellesi, M., de Vivo, L., Chini, M., Gilli, F., Tononi, G., and Cirelli, C. (2017).Sleep loss promotes astrocytic phagocytosis and microglial activation in mousecerebral cortex. J. Neurosci. 37, 5263–5273. doi: 10.1523/JNEUROSCI.3981-16.2017
Bellesi, M., de Vivo, L., Tononi, G., and Cirelli, C. (2015). Effects of sleep andwake on astrocytes: clues frommolecular and ultrastructural studies. BMC Biol.13:66. doi: 10.1186/s12915-015-0176-7
Bellesi, M., Haswell, J. D., de Vivo, L., Marshall, W., Roseboom, P. H., Tononi, G.,et al. (2018). Myelin modifications after chronic sleep loss in adolescent mice.Sleep 41:5. doi: 10.1093/sleep/zsy034
Bellesi, M., Pfister-Genskow, M., Maret, S., Keles, S., Tononi, G., andCirelli, C. (2013). Effects of sleep and wake on oligodendrocytes and theirprecursors. J. Neurosci. 33, 14288–14300. doi: 10.1523/JNEUROSCI.5102-12.2013
Benington, J. H., and Heller, H. C. (1995). Restoration of brain energy metabolismas the function of sleep. Prog. Neurobiol. 45, 347–360. doi: 10.1016/0301-0082(94)00057-o
Bernardinelli, Y., Muller, D., and Nikonenko, I. (2014). Astrocyte-synapsestructural plasticity. Neural Plast. 2014:232105. doi: 10.1155/2014/232105
Boretius, S., Tammer, R., Michaelis, T., Brockmöller, J., and Frahm, J. (2013).Halogenated volatile anesthetics alter brain metabolism as revealed by protonmagnetic resonance spectroscopy of mice in vivo. Neuroimage 69, 244–255.doi: 10.1016/j.neuroimage.2012.12.020
Bouzier-Sore, A.-K., and Pellerin, L. (2013). Unraveling the complex metabolicnature of astrocytes. Front. Cell. Neurosci. 7:179. doi: 10.3389/fncel.2013.00179
Brown, A. M., and Ransom, B. R. (2015). Astrocyte glycogen as an emergency fuelunder conditions of glucose deprivation or intense neural activity.Metab. BrainDis. 30, 233–239. doi: 10.1007/s11011-014-9588-2
Chuquet, J., Quilichini, P., Nimchinsky, E. A., and Buzsáki, G. (2010).Predominant enhancement of glucose uptake in astrocytes versus neuronsduring activation of the somatosensory cortex. J. Neurosci. 30, 15298–15303.doi: 10.1523/JNEUROSCI.0762-10.2010
de Vivo, L., Bellesi, M., Marshall, W., Bushong, E. A., Ellisman, M. H., Tononi, G.,et al. (2017). Ultrastructural evidence for synaptic scaling across the wake/sleepcycle. Science 355, 507–510. doi: 10.1126/science.aah5982
de Vivo, L., Faraguna, U., Nelson, A. B., Pfister-Genskow, M., Klapperich, M. E.,Tononi, G., et al. (2014). Developmental patterns of sleep slow wave activityand synaptic density in adolescent mice. Sleep 37, 689–700. doi: 10.5665/sleep.3570
de Vivo, L., Nelson, A. B., Bellesi, M., Noguti, J., Tononi, G., and Cirelli, C. (2016).Loss of sleep affects the ultrastructure of pyramidal neurons in the adolescentmouse frontal cortex. Sleep 39, 861–874. doi: 10.5665/sleep.5644
Díaz-García, C. M., Mongeon, R., Lahmann, C., Koveal, D., Zucker, H., andYellen, G. (2017). Neuronal stimulation triggers neuronal glycolysis andnot lactate uptake. Cell Metab. 26, 361.e4–374.e4. doi: 10.1016/j.cmet.2017.06.021
DiNuzzo, M. (2013). Kinetic analysis of glycogen turnover: relevance to humanbrain 13C-NMR spectroscopy. J. Cereb. Blood Flow Metab. 33, 1540–1548.doi: 10.1038/jcbfm.2013.98
Frontiers in Cellular Neuroscience | www.frontiersin.org 9 September 2018 | Volume 12 | Article 308
Bellesi et al. Perisynaptic Glycogen Changes With Sleep and Wake
DiNuzzo, M., Mangia, S., Maraviglia, B., and Giove, F. (2010). Glycogenolysisin astrocytes supports blood-borne glucose channeling not glycogen-derived lactate shuttling to neurons: evidence from mathematicalmodeling. J. Cereb. Blood Flow Metab. 30, 1895–1904. doi: 10.1038/jcbfm.2010.151
DiNuzzo, M., Mangia, S., Maraviglia, B., and Giove, F. (2015). Does abnormalglycogen structure contribute to increased susceptibility to seizures in epilepsy?Metab. Brain Dis. 30, 307–316. doi: 10.1007/s11011-014-9524-5
Dringen, R., Gebhardt, R., and Hamprecht, B. (1993). Glycogen in astrocytes:possible function as lactate supply for neighboring cells. Brain Res. 623,208–214. doi: 10.1016/0006-8993(93)91429-v
Fiala, J. C., Kirov, S. A., Feinberg, M. D., Petrak, L. J., George, P., Goddard, C. A.,et al. (2003). Timing of neuronal and glial ultrastructure disruption duringbrain slice preparation and recovery in vitro. J. Comp. Neurol. 465, 90–103.doi: 10.1002/cne.10825
Franken, P., Gip, P., Hagiwara, G., Ruby, N. F., and Heller, H. C. (2003). Changesin brain glycogen after sleep deprivation vary with genotype. Am. J. Physiol.Regul. Integr. Comp. Physiol. 285, R413–R419. doi: 10.1152/ajpregu.00668.2002
Franken, P., Gip, P., Hagiwara, G., Ruby, N. F., and Heller, H. C. (2006).Glycogen content in the cerebral cortex increases with sleep loss inC57BL/6J mice. Neurosci. Lett. 402, 176–179. doi: 10.1016/j.neulet.2006.03.072
Gibbs, M. E., Anderson, D. G., and Hertz, L. (2006). Inhibition of glycogenolysisin astrocytes interrupts memory consolidation in young chickens. Glia 54,214–222. doi: 10.1002/glia.20377
Gip, P., Hagiwara, G., Ruby, N. F., and Heller, H. C. (2002). Sleep deprivationdecreases glycogen in the cerebellum but not in the cortex of young rats. Am.J. Physiol. Regul. Integr. Comp. Physiol. 283, R54–R59. doi: 10.1152/ajpregu.00735.2001
Goyal, M. S., Hawrylycz, M., Miller, J. A., Snyder, A. Z., and Raichle, M. E. (2014).Aerobic glycolysis in the human brain is associated with development andneotenous gene expression. Cell Metab. 19, 49–57. doi: 10.1016/j.cmet.2013.11.020
Hertz, L., and Dienel, G. A. (2002). Energy metabolism in the brain. Int. Rev.Neurobiol. 51, 1–102. doi: 10.1016/S0074-7742(02)51003-5
Hobson, J. A., and McCarley, R. W. (1971). Cortical unit activity in sleep andwaking. Electroencephalogr. Clin. Neurophysiol. 30, 97–112. doi: 10.1016/0013-4694(71)90271-9
Holtmaat, A., and Svoboda, K. (2009). Experience-dependent structural synapticplasticity in the mammalian brain. Nat. Rev. Neurosci. 10, 647–658.doi: 10.1038/nrn2699
Horner, H. C., Packan, D. R., and Sapolsky, R. M. (1990). Glucocorticoidsinhibit glucose transport in cultured hippocampal neurons and glia.Neuroendocrinology 52, 57–64. doi: 10.1159/000125539
Karnovsky, M. L., Reich, P., Anchors, J. M., and Burrows, B. L. (1983). Changes inbrain glycogen during slow-wave sleep in the rat. J. Neurochem. 41, 1498–1501.doi: 10.1111/j.1471-4159.1983.tb00853.x
Kong, J., Shepel, P. N., Holden, C. P., Mackiewicz, M., Pack, A. I., and Geiger, J. D.(2002). Brain glycogen decreases with increased periods of wakefulness:implications for homeostatic drive to sleep. J. Neurosci. 22, 5581–5587.doi: 10.1523/JNEUROSCI.22-13-05581.2002
Landgraf, R., Mitro, A., and Hess, J. (1978). Regional net uptake of 14C-glucoseby rat brain under the influence of corticosterone. Endocrinol. Exp. 12,119–129.
Lanjakornsiripan, D., Pior, B.-J., Kawaguchi, D., Furutachi, S., Tahara, T.,Katsuyama, Y., et al. (2018). Layer-specific morphological and moleculardifferences in neocortical astrocytes and their dependence on neuronal layers.Nat. Commun. 9:1623. doi: 10.1038/s41467-018-03940-3
Lowry, O. H., Passonneau, J. V., Hasselberger, F. X., and Schulz, D. W. (1964).Effect of ischemia on known substrates and cofactors of the glycolytic pathwayin brain. J. Biol. Chem. 239, 18–30.
Lundgaard, I., Li, B., Xie, L., Kang, H., Sanggaard, S., Haswell, J. D. R., et al. (2015).Direct neuronal glucose uptake heralds activity-dependent increases in cerebralmetabolism. Nat. Commun. 6:6807. doi: 10.1038/ncomms7807
Ly, C. V., and Verstreken, P. (2006). Mitochondria at the synapse. Neuroscientist12, 291–299. doi: 10.1177/1073858406287661
Magistretti, P. J., and Allaman, I. (2018). Lactate in the brain: from metabolicend-product to signalling molecule. Nat. Rev. Neurosci. 19, 235–249.doi: 10.1038/nrn.2018.19
Magistretti, P. J., Sorg, O., and Martin, J.-L. (1993). ‘‘Regulation of glycogenmetabolism in astrocytes: physiological, pharmacological, and pathologicalaspects,’’ in Astrocytes: Pharmacology and Function, ed. S. Murphy (San Diego,CA: Academic Press), 243–265.
Marchand, I., Chorneyko, K., Tarnopolsky, M., Hamilton, S., Shearer, J.,Potvin, J., et al. (2002). Quantification of subcellular glycogen in resting humanmuscle: granule size, number, and location. J. Appl. Physiol. 93, 1598–1607.doi: 10.1152/japplphysiol.00585.2001
Marchand, I., Tarnopolsky, M., Adamo, K. B., Bourgeois, J. M., Chorneyko, K.,and Graham, T. E. (2007). Quantitative assessment of human muscle glycogengranules size and number in subcellular locations during recovery fromprolonged exercise. J. Physiol. 580, 617–628. doi: 10.1113/jphysiol.2006.122457
Maret, S., Faraguna, U., Nelson, A. B., Cirelli, C., and Tononi, G. (2011). Sleep andwaking modulate spine turnover in the adolescent mouse cortex.Nat. Neurosci.14, 1418–1420. doi: 10.1038/nn.2934
Morgenthaler, F. D., Lanz, B. R., Petit, J.-M., Frenkel, H., Magistretti, P. J., andGruetter, R. (2009). Alteration of brain glycogen turnover in the conscious ratafter 5 h of prolonged wakefulness. Neurochem. Int. 55, 45–51. doi: 10.1016/j.neuint.2009.02.023
Obel, L. F., Müller, M. S., Walls, A. B., Sickmann, H. M., Bak, L. K.,Waagepetersen, H. S., et al. (2012). Brain glycogen—new perspectiveson its metabolic function and regulation at the subcellular level. Front.Neuroenergetics 4:3. doi: 10.3389/fnene.2012.00003
Oe, Y., Baba, O., Ashida, H., Nakamura, K. C., and Hirase, H. (2016). Glycogendistribution in the microwave-fixed mouse brain reveals heterogeneousastrocytic patterns. Glia 64, 1532–1545. doi: 10.1002/glia.23020
Park, M., Salgado, J. M., Ostroff, L., Helton, T. D., Robinson, C. G., Harris, K. M.,et al. (2006). Plasticity-induced growth of dendritic spines by exocytictrafficking from recycling endosomes. Neuron 52, 817–830. doi: 10.1016/j.neuron.2006.09.040
Passonneau, J. V., Brunner, E. A., Molstad, C., and Passonneau, R. (1971).The effects of altered endocrine states and of ether anaesthesia onmouse brain. J. Neurochem. 18, 2317–2328. doi: 10.1111/j.1471-4159.1971.tb00187.x
Patel, A. B., Lai, J. C. K., Chowdhury, G. M. I., Hyder, F., Rothman, D. L.,Shulman, R. G., et al. (2014). Direct evidence for activity-dependent glucosephosphorylation in neurons with implications for the astrocyte-to-neuronlactate shuttle. Proc. Natl. Acad. Sci. U S A 111, 5385–5390. doi: 10.1073/pnas.1403576111
Pellerin, L., Bouzier-Sore, A.-K., Aubert, A., Serres, S., Merle, M., Costalat, R., et al.(2007). Activity-dependent regulation of energy metabolism by astrocytes: anupdate. Glia 55, 1251–1262. doi: 10.1002/glia.20528
Pellerin, L., and Magistretti, P. J. (1994). Glutamate uptake into astrocytesstimulates aerobic glycolysis: a mechanism coupling neuronal activityto glucose utilization. Proc. Natl. Acad. Sci. U S A 91, 10625–10629.doi: 10.1073/pnas.91.22.10625
Petit, J.-M., Tobler, I., Allaman, I., Borbély, A. A., and Magistretti, P. J. (2002).Sleep deprivation modulates brain mRNAs encoding genes of glycogenmetabolism. Eur. J. Neurosci. 16, 1163–1167. doi: 10.1046/j.1460-9568.2002.02145.x
Petit, J.-M., Tobler, I., Kopp, C., Morgenthaler, F., Borbély, A. A., andMagistretti, P. J. (2010). Metabolic response of the cerebral cortex followinggentle sleep deprivation and modafinil administration. Sleep 33, 901–908.doi: 10.1093/sleep/33.7.901
Phelps, C. H. (1972). Barbiturate-induced glycogen accumulation in brain.An electron microscopic study. Brain Res. 39, 225–234. doi: 10.1016/0006-8993(72)90797-4
Roach, P. J., Depaoli-Roach, A. A., Hurley, T. D., and Tagliabracci, V. S. (2012).Glycogen and its metabolism: some new developments and old themes.Biochem. J. 441, 763–787. doi: 10.1042/BJ20111416
Scharf, M. T., Naidoo, N., Zimmerman, J. E., and Pack, A. I. (2008). The energyhypothesis of sleep revisited. Prog. Neurobiol. 86, 264–280. doi: 10.1016/j.pneurobio.2008.08.003
Frontiers in Cellular Neuroscience | www.frontiersin.org 10 September 2018 | Volume 12 | Article 308
Bellesi et al. Perisynaptic Glycogen Changes With Sleep and Wake
Schindelin, J., Arganda-Carreras, I., Frise, E., Kaynig, V., Longair, M., Pietzsch, T.,et al. (2012). Fiji: an open-source platform for biological-image analysis. Nat.Methods 9, 676–682. doi: 10.1038/nmeth.2019
Shearer, J., and Graham, T. E. (2004). Novel aspects of skeletal muscle glycogenand its regulation during rest and exercise. Exerc. Sport Sci. Rev. 32, 120–126.doi: 10.1097/00003677-200407000-00008
Suzuki, A., Stern, S. A., Bozdagi, O., Huntley, G. W., Walker, R. H.,Magistretti, P. J., et al. (2011). Astrocyte-neuron lactate transport is requiredfor long-term memory formation. Cell 144, 810–823. doi: 10.1016/j.cell.2011.02.018
Tombaugh, G. C., Yang, S. H., Swanson, R. A., and Sapolsky, R. M. (1992).Glucocorticoids exacerbate hypoxic and hypoglycemic hippocampal injuryin vitro: biochemical correlates and a role for astrocytes. J. Neurochem. 59,137–146. doi: 10.1111/j.1471-4159.1992.tb08884.x
Van Reempts, J. (1984). The hypoxic brain: histological and ultrastructural aspects.Behav. Brain Res. 14, 99–108. doi: 10.1016/0166-4328(84)90177-3
Walls, A. B., Heimbürger, C. M., Bouman, S. D., Schousboe, A., andWaagepetersen, H. S. (2009). Robust glycogen shunt activity in astrocytes:effects of glutamatergic and adrenergic agents. Neuroscience 158, 284–292.doi: 10.1016/j.neuroscience.2008.09.058
Wender, R., Brown, A. M., Fern, R., Swanson, R. A., Farrell, K., and Ransom, B. R.(2000). Astrocytic glycogen influences axon function and survival during
glucose deprivation in central white matter. J. Neurosci. 20, 6804–6810.doi: 10.1523/JNEUROSCI.20-18-06804.2000
Yang, J., Ruchti, E., Petit, J.-M., Jourdain, P., Grenningloh, G., Allaman, I.,et al. (2014). Lactate promotes plasticity gene expression by potentiatingNMDA signaling in neurons. Proc. Natl. Acad. Sci. U S A 111, 12228–12233.doi: 10.1073/pnas.1322912111
Zimmerman, J. E., Mackiewicz, M., Galante, R. J., Zhang, L., Cater, J., Zoh, C., et al.(2004). Glycogen in the brain of Drosophila melanogaster: diurnal rhythm andthe effect of rest deprivation. J. Neurochem. 88, 32–40. doi: 10.1046/j.1471-4159.2003.02126.x
Conflict of Interest Statement: The authors declare that the research wasconducted in the absence of any commercial or financial relationships that couldbe construed as a potential conflict of interest.
Copyright © 2018 Bellesi, de Vivo, Koebe, Tononi and Cirelli. This is an open-accessarticle distributed under the terms of the Creative Commons Attribution License(CC BY). The use, distribution or reproduction in other forums is permitted,provided the original author(s) and the copyright owner(s) are credited and that theoriginal publication in this journal is cited, in accordance with accepted academicpractice. No use, distribution or reproduction is permitted which does not complywith these terms.
Frontiers in Cellular Neuroscience | www.frontiersin.org 11 September 2018 | Volume 12 | Article 308