Embed Size (px)
Citation preview
Slaughterhouses and Increased Crime Rates
An Empirical Analysis of the Spillover From “The Jungle” Into the Surrounding Community
Amy J. FitzgeraldUniversity of WindsorLinda KalofThomas DietzMichigan State University
More than 100 years after Upton Sinclair denounced the massive slaughterhouse complex in Chicago as a “jungle,” qualitative case study research has documented numerous negative effects of slaughterhouses on workers and communities. Of the social problems observed in these communities, the increases in crime have been particularly dramatic. These increases have been theorized as being linked to the demographic characteristics of the workers, social disorganization in the communities, and increased unemployment rates. But these explanations have not been empirically tested, and no research has addressed the possibility of a link between the increased crime rates and the violent work that takes place in the meatpacking industry. This study uses panel analysis of 1994-2002 data on nonmetropolitan counties in states with “right-to-work” laws (a total of 581 counties) to analyze the effect of slaughterhouses on the surround-ing communities using both ordinary least squares and negative binomial regression. The findings indicate that slaughterhouse employment increases total arrest rates, arrests for violent crimes, arrests for rape, and arrests for other sex offenses in comparison with other industries. This suggests the existence of a “Sinclair effect” unique to the violent workplace of the slaugh-terhouse, a factor that has not previously been examined in the sociology of violence.
Keywords: meatpacking industry; slaughterhouses; crime; employment; rural communities
At the turn of the 20th century, Upton Sinclair exposed the devastating work conditions and living environments of those who toiled in Chicago’s stockyard slaughterhouses.
In The Jungle he made a connection between the numerous after-work fights instigated by slaughterhouse workers and the killing and dismembering of animals all day at work:
He [the police officer] has to be prompt—for these two-o’clock-in-the-morning fights, if they once get out of hand, are like a forest fire, and may mean the whole reserves at the station. The thing to do is to crack every fighting head that you can see, before there are so many fighting heads that you cannot crack any of them. There is but scant account kept of cracked heads in back of the [stock] yards, for men who have to crack the heads of animals all day seem to get into the habit, and to practice on their friends, and even on their families, between times (Sinclair, 1905/1946, pp. 18-19).
1
Organization & EnvironmentVolume XX Number X
Month XXXX xx-xx© 2009 SAge Publications
10.1177/1086026609338164http://oae.sagepub.com
hosted athttp://online.sagepub.com
2 Organization & environment
Although the “Sinclair hypothesis”—the propensity for violent crime is increased by work that involves the routine slaughter of other animals—has not been given much atten-tion, geographers, sociologists, and anthropologists have begun to examine the community effects of the migration of slaughterhouses from urban areas to rural communities. As we will detail below, the framing of that work is solidly grounded in community sociology, where work on “boomtowns” resulting from a new industry coming to town has been a topic of research for at least three decades (see Berry, Krannich, & greider, 1990; Camasso & Wilkinson, 1990; Freudenberg, 1981, 1984, 1986; Freudenberg & Jones, 1991; Hunter, Krannich, & Smith, 2002; Krannich, Berry, & greider, 1989; Smith, Krannich, & Hunter, 2001; Wilkinson, Reynolds, Thompson, & Ostresh, 1984; Wilkinson, Thompson, Reynolds, & Ostresh, 1982). The application of the “boomtown” hypothesis and related theories to meatpacking communities undertheorizes the slaughterhouse in that it treats the work of killing animals as more or less the same as other assembly line work. We will demonstrate that a “sociology of the slaughterhouse,” (York, 2004) which attends to the unique charac-teristics of this form of work, is needed.
A number of recent sociological studies have suggested that many social problems and phenomena cannot be adequately understood unless we examine the social role of nonhu-man animals. For example, Arluke and Sanders (1996) and Irvine (2004) suggest that companion animals can play the role of the Median “other” in interactions. Fitzgerald (2005, 2007) and Flynn (2000a, 2000b) demonstrate the importance of companion ani-mals in the dynamics of intimate partner violence. Jerolmack (2007) examines the impor-tance of animals in constructing ethnicity and how some species become constructed as social problems (Jerolmack, 2008). Nibert (2002) and Winders and Nibert (2004) articu-late the myriad ways the oppression of animals and humans are linked within the system of industrialized animal agriculture. Kalof (2007) documents the critical role animals have played in Western society for thousands of years. These and many other recent studies make that case that human interactions with nonhuman animals must be adequately theo-rized to understand a number of key social phenomena. Further, social organizations are frequently at the center of our most complex (and harmful) relations with animals (gaines & Jermier, 2000). In particular, Rémy (2003) and Smith (2002) have demonstrated that the slaughterhouse occupies a contradictory position within society. Formal rules about requir-ing humane slaughter acknowledge that sentient creatures are being killed.1 Yet those who are engaged in the work of the slaughterhouse also develop constructions that allow them to carry out this work. This contradiction does not occur when the subject of the industrial process is not an animal.
In this article, we test the argument—the Sinclair hypothesis—that suggests that the work of industrial animal slaughter with its inherent contradiction has a different effect on local communities than other forms of industrial work. We examine the relationship between slaughterhouse employment levels and crime rates, controlling for the variables commonly proposed in the literature as associated with crime in communities, and we compare the effects of the slaughterhouse industry with other manufacturing industries that are similar in labor force composition, injury and illness rates, but different in that the materials of production are inanimate objects, rather than animals. Our immediate goal is to examine the causes of crime in slaughterhouse communities, including the Sinclair hypothesis, and thereby contribute to the discussion of whether or not this social problem can be understood without taking account of “the animal Other” in human society.
Fitzgerald et al. / Slaughterhouses and Increased Crime Rates 3
The Community Effects of the Contemporary Slaughterhouse Industry
The production and slaughter of animals for human consumption has increased dramati-cally since the time of Sinclair’s writing, facilitated by the “free” market and state policies (Winders & Nibert, 2004). This increase has been accompanied by drastic changes in the slaughterhouse or meatpacking industry—most notable in the past few decades—including corporate consolidation, the relocation of slaughterhouses to rural areas, a depression in wages, and the increased recruitment of immigrant workers (Stull & Broadway, 2004; Winders & Nibert, 2004). These changes have attracted the attention of scholars who have carefully documented three areas of impact: (a) influence on the physical environment and human health in communities where slaughterhouses have been sited, (b) physical impacts on the workers, and (c) social impacts in the communities. Our focus is on the latter category.
ethnographic studies of communities where large slaughterhouses have been sited (such as Finney County, Kansas; Lexington, Nebraska; Perry and Storm Lake, Iowa; guymon, Oklahoma; and Brooks, Alberta) have documented housing shortages (due to the influx of workers into the community), increased demand for social assistance (due to a number of factors, including the low wages paid by the industry, high injury and illness rates, and the high employee turnover rate), and an increase in crime (Broadway, 2000; Stull & Broadway, 2004). Of these social problems, increased crime rates have been the least readily explainable.
The slaughterhouse community studies have documented dramatic increases in crime that have outpaced increases in the population. Increases have been documented for violent crimes (Broadway, 2000; grey, 1998b; Stull & Broadway, 2004), property crimes (grey, 1995), and drug offenses (Horowitz & Miller, 1999). Most of the increases in violent crime rates have been attributed to increases in domestic violence and child abuse (Broadway, 1990, 2000, p. 40; Stull & Broadway, 2004, p. 103).
Crime Increases in Slaughterhouse Communities: Theory
The explanations proposed for the increase in crime rates in slaughterhouse communities have coalesced into three categories grounded in the sociology of community crime: expla-nations based on the demographic characteristics of the workforce, explanations based on population booms and social disorganization, and explanations that point to unemploy-ment. These categories are certainly not mutually exclusive; rather, they represent three strains of thought that have developed rather distinctly in the literature on slaughterhouse communities and in slaughterhouse communities themselves.
Crime as a result of the demographic characteristics of the workforce. Much attention has been directed to the demographic profile of slaughterhouse employees. Whereas the general public, media, and even government officials have focused on the immigration status of slaughterhouse employees in relation to crime (discussed below), the academic literature has focused on the age, gender, and marital status of the workers as posing an increased crimino-genic risk, with young single males most likely to seek employment in the meatpacking indus-try (Broadway, 1990, 1994, 2000, 2001; Broadway & Stull, 2006; Stull & Broadway, 2004).
It is, however, not clear that the bulk of those who move to slaughterhouse communities are single males. Immigration for work purposes generally involves the following process:
4 Organization & environment
solo men are recruited or come to an area for work; later their families follow; and subse-quently other immigrants might follow, using social networks with individuals already settled in the area to find employment (Dalla, ellis, & Cramer, 2005; Martin, Taylor, & Fix, 1996). Although this pattern is characteristic of migrant farmer communities, the immi-grants moving to slaughterhouse communities for work are usually not migrant farm work-ers, although this is not meant to imply that there is never crossover between these groups. The salient point here is that there are fewer solo males and more families in meatpacking towns than in migrant farm worker towns because unlike migrant farm work, slaughter-house jobs offer year-round employment and enough money to make supporting a family more feasible (Martin et al., 1996).
The influx of immigrants into slaughterhouse communities has also been blamed for the increase in crime. The transition to the use of immigrant labor has been a profound and highly contested development in the meatpacking industry (grey, 1998a). Immigrants who relocate to communities to work in slaughterhouses are often scapegoated by the general public, the media, government officials, and the meatpacking industry itself, in an attempt to explain away the resultant social disruption in communities where slaughterhouses have been sited. After a recent influx of slaughterhouses in Nebraska, a group of police officers and govern-ment officials contacted the Immigration and Naturalization Service (INS) Commissioner in Washington with concerns over the increased crime rates, which they attributed to the increase in immigrants in their communities (Bacon, 1999). In Buena Vista County, Iowa, an assumed link between immigration and crime became the central issue of the 1994 election for the county attorney position. The challenger to the 16-year incumbent made the slaugh-terhouse industry’s hiring practices a central theme of his campaign and accused a slaughter-house company of “social pollution” (grey, 1998b). The challenger won the primary. Racial violence has erupted in some locations. For example, there have been reports of cross burn-ings and physical confrontations in meatpacking towns in Iowa, Nebraska, and Kansas (Dalla et al., 2005). This notion that immigration leads to increases in crime is consistent with the assumption of social disorganization theory that population heterogeneity and population influxes result in the weakening of social institutions and crime increases.
Crime as the result of population booms and social disorganization. It has been hypoth-esized that the sheer increase in population in some communities could foster social disor-ganization, bringing about an increase in crime. Popular in studies of boomtowns,2 this hypothesis has also been proposed in studies of slaughterhouse communities (Broadway, 2000, 2007; Broadway & Stull, 2006; Markus, 2005; Stull & Broadway, 2004), and assumes that preboom communities are stable and characterized by social cohesiveness, where social control is made possible by a “high density of acquaintanceship” (Freudenberg, 1986). In areas that experience a population influx, newcomers bring new values that con-flict with those of current residents and may disrupt established networks and support systems (Broadway, 1990), perhaps resulting in a reduction of informal social control and increases in personal disorganization and social isolation, exacerbating the frequency of mental breakdowns, suicide, deviance, and social isolation (Broadway, 2000, p. 40).
Increased crime as a result of unemployment. It has also been proposed that slaughter-house communities experience increased crime rates because the recruitment of workers
Fitzgerald et al. / Slaughterhouses and Increased Crime Rates 5
from outside the community, coupled with high turnover rates in the meatpacking industry, might result in increased unemployment in the community (eisnitz, 1997; Schlosser, 2005). eisnitz (1997) explicitly argues that former slaughterhouse workers may turn to crime due to their unemployment. The empirical research on the relationship between crime and unemployment rates in general (Cantor & Land, 1985), however, has found that the rela-tionship varies by type of crime and is not as straightforward as many assume.
In summary, the demographic characteristics of the workforce, the effects of population influxes on social disorganization, and increased levels of unemployment have all been invoked to explain increased crime rates in communities where slaughterhouses have opened. However, none of these theories have been tested empirically. Additionally, the slaughter-house community literature has not explicitly mentioned the possibility of a link between the violent work undertaken in slaughterhouses and the social disruption in the surrounding com-munities. One exception is Broadway (1990), who suggests that work-related stress might contribute to the increases in crime and occurrences of other depression, divorce, and alcohol-ism. The source of this “work-related stress,” however, has not been interrogated. Although the possibility that the killing and dismembering of thousands of animals a day might con-tribute to work-related stress and crime has not been addressed in the literature on slaughter-house communities, the link has been raised by green criminology scholars.
Green Criminology and the Slaughtering of Animals
“green Criminology” (Lynch, 1990) examines “the study of those harms against humanity, against the environment (including space) and against non-human animals committed by both powerful institutions (e.g. governments, transnational corporations, military apparatuses) and also by ordinary people” (Beirne & South, 2007, p. xiii). Within green criminology explicit attention is paid to animals with the aim of developing a “nonspeciesist criminology” (Beirne, 1999; Cazaux, 1999) concerned with taking harm to animals seriously. Thus far, however, attention has focused exclusively on individual actions against companion animals, such as drawing a link between abuse perpetrated within the family and animal abuse (e.g., Fitzgerald, 2005; Flynn, 2000a, 2000b). Several scholars have argued that attention should also be given to institutionalized practices that result in harm to animals but are considered socially acceptable (Beirne, 2002, 2004, 2007; Beirne & South, 2007; Cazaux, 1999; South & Beirne, 2006). In particular, the potential effects of institutionalized harm to animals on those engaged in such activities needs consideration. This leads us to the Sinclair hypothesis—the work of killing animals in an industrial process may have social and psychological consequences for the workers over and above other characteristics of the work.
For example, Piers Beirne (2004) considers slaughterhouses the ideal site for investigating the institutionalized harm to animals and how violence perpetrated against animals might affect the perpetrators, even though the violence is socially sanctioned. He argues that “[w]henever human-animal relationships are marked by authority and power, and thus by institu-tionalized social distance, there is an aggravated possibility of extra-institutional violence” (2004, p. 54). This proposition parallels studies of other types of work wherein the institution-alized distance and aggression between people can spillover3 into other social contexts, such as studies documenting extra-institutional violence among military personnel (e.g., Allen, 2000; Marshall, Panuzio, & Taft, 2005; Marshall & McShane, 2000; Mercier, 2000; Rosen,
6 Organization & environment
Kaminski, Parmley, Knudson, & Fancher, 2003) and prison guards (Black, 1982; Kauffman, 1988; Stack & Tsoudis, 1997). It also parallels claims made under the “brutalization hypoth-esis.” According to this hypothesis, instead of having a deterrent effect on homicides, the use of the death penalty (a clear example of state-sanctioned violence) increases homicides due to the legitimization of the use of lethal violence. Research testing the hypothesis, however, has had mixed results depending on the inclusion of a lagged effect (King, 1978), whether the measure of homicides is disaggregated to take the relationship between the offender and victim into consideration (Cochran & Chamlin, 2000; Cochran, Chamlin, & Seth, 1994), and whether the studies are longitudinal or cross-sectional (Yang & Lester, 2008).
More specific to the work in slaughterhouses, ethnographic accounts by eisnitz (1997), Fink (1998), and Rémy (2003) have emphasized the contradiction faced by slaughterhouse workers between the rules that regulate the slaughter and the necessity of carrying out the kill-ing in an efficient and routinized way. This contradiction is dramatized by the all-too-frequent abuse of animals during the slaughtering process (see grandin, 1988). Their studies, along with Beirne’s proposition and Sinclair’s 100-year-old hypothesis, draw our attention to the possibility that negative effects of employment in arenas where institutionalized support for violence exists and employees have total power over others (although circumscribed in some regards; see Sykes, 1980) can result even when the “Others” being subjugated are animals. This study provides an initial test of the propositions of Beirne and Sinclair. In particular, we consider whether or not a relationship exists between slaughterhouse employ-ment levels and community crime rates net of what is explained by the typical correlates of crime and that is unique when compared with other similar industries.
Study Objectives and Research Hypotheses
The general objectives of this study are (a) to test the three theories proposed in the lit-erature to explain increases in crime that are applicable to slaughterhouse communities but afford no special theoretical status to slaughterhouse work and (b) to compare the effects of slaughterhouse employment levels on crime rates with the effects of other industries catego-rized mainly as manufacturing and similarly characterized by high immigrant worker con-centrations, low pay, routinized labor, and dangerous conditions but that do not entail killing and dismembering animals, to see if the effects of slaughterhouses are unique or are congru-ent with those of enterprises with similar characteristics. Finding unique effects of slaugh-terhouse employment compared to similar forms of industrial work would point to the type of work undertaken in slaughterhouses as a contributor to the crime increases observed in the communities. Therefore, the general hypothesis tested in this study is as follows:
Hypothesis: Controlling for the variables commonly proposed to explain crime, slaughter-house presence and employment will be associated with increased crime rates. These increases will be greater than those observed from industries that use the same type of labor force, have high injury and illness rates, and entail routinized labor, but do not involve killing and dismembering animals. In particular, rape and family violence will be influenced by slaughterhouse work, net of other factors.
Testing the hypothesis requires ascertaining whether or not the increase in crime in slaughterhouse communities can be explained by the variables proposed in the literature,
Fitzgerald et al. / Slaughterhouses and Increased Crime Rates 7
and if the effects are unique to slaughterhouses or if employment rates in similar industries would result in similar increases in crime. The focus on rape and family violence is sug-gested by scholars such as Adams (1991), Nibert (2002), Patterson (2002), and Spiegel (1996) who posit a connection between the victimization of animals and the victimization of less powerful human groups, such as children and women. It also reflects the claims made by some of the scholars who have studied slaughterhouse communities that the observed crime increases have been propelled by increases in domestic violence and child abuse. Several issues were taken into consideration in designing a study to test this hypoth-esis, and we describe these next.
Research Design and Methods
The unit of analysis for this study is the U.S. county. Only nonmetropolitan counties not adjacent to metropolitan areas were analyzed to remove the potentially confounding effects of urbanization and spillover from metropolitan areas to rural counties documented in previous research (e.g., Lee & Ousey, 2001). Furthermore, rural counties in states with right-to-work laws,4 where most slaughterhouse facilities have been relocated to (Stull and Broadway, 2004), are examined here. The result of these criteria is that 581 counties are analyzed in this study (a complete list is available from the authors). The data were com-piled from six secondary sources, for the period from 1994 to 2002.5 Pooled time-series cross-section (TSCS) techniques were used in analyzing the data, therefore the number of data points is 5,229 (581 counties × 9 years of data).
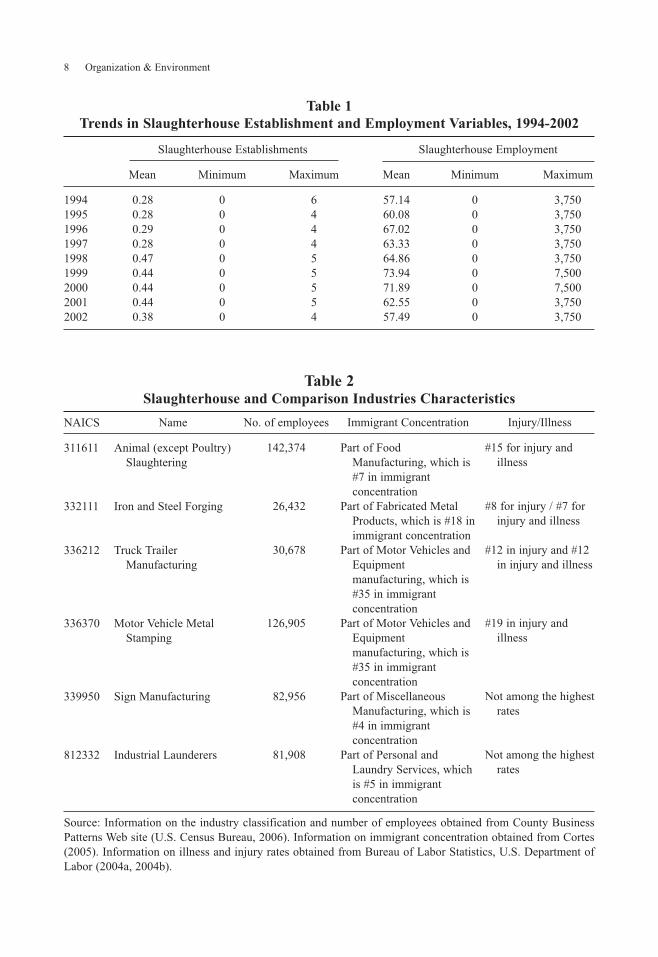
The independent variables are the number of “Animal (except Poultry) Slaughtering” employees in each county for each year and the number of employees in five comparison industries for which bridgeable SIC-NAICS6 data are available. These data were accessed through the U.S. Census Bureau’s County Business Patterns. The number of slaughterhouse employees is used instead of the number of slaughterhouse establishments because it has greater variance (see Table 1) and provides us with more complete information about the magnitude of employment than the number of slaughterhouses, which provides no informa-tion about their size. The same is true of the comparison industries used (see Table 2). These include iron and steel forging, truck trailer manufacturing, motor vehicle metal stamping, sign manufacturing, and industrial laundering. These industries were selected because they are similar to the slaughterhouse industry: They are categorized as manufacturing (with the exception of one industry, which was included due to a high rate of immigrant concentra-tion), the industries are characterized by high immigrant worker concentrations, low pay, routinized labor, and dangerous conditions (Bureau of Labor Statistics, 2004a, 2004b; Cortes, 2005; U.S. Census Bureau, 2006). Unfortunately, comparisons could not be made with agricultural production industries, as the Census Bureau’s County Business Patterns does not record that information.
There are 22 dependent variables in the analyses, including 14 arrest variables and 8 crime report variables drawn from the Uniform Crime Report.7 Some of these variables are of particular theoretical interest because they are violent offenses which are implicated by the hypothesis that violence from the slaughterhouses would spillover into the larger community. The other variables (i.e., property crimes) were identified by factor analysis as grouping together with the variables of most theoretical interest. Additionally, it seemed
8 Organization & environment
Table 1Trends in Slaughterhouse Establishment and Employment Variables, 1994-2002
Slaughterhouse establishments Slaughterhouse employment
Mean Minimum Maximum Mean Minimum Maximum
1994 0.28 0 6 57.14 0 3,7501995 0.28 0 4 60.08 0 3,7501996 0.29 0 4 67.02 0 3,7501997 0.28 0 4 63.33 0 3,7501998 0.47 0 5 64.86 0 3,7501999 0.44 0 5 73.94 0 7,5002000 0.44 0 5 71.89 0 7,5002001 0.44 0 5 62.55 0 3,7502002 0.38 0 4 57.49 0 3,750
Table 2Slaughterhouse and Comparison Industries Characteristics
NAICS
311611
332111
336212
336370
339950
812332
Name
Animal (except Poultry) Slaughtering
Iron and Steel Forging
Truck Trailer Manufacturing
Motor Vehicle Metal Stamping
Sign Manufacturing
Industrial Launderers
No. of employees
142,374
26,432
30,678
126,905
82,956
81,908
Immigrant Concentration
Part of Food Manufacturing, which is #7 in immigrant concentration
Part of Fabricated Metal Products, which is #18 in immigrant concentration
Part of Motor Vehicles and equipment manufacturing, which is #35 in immigrant concentration
Part of Motor Vehicles and equipment manufacturing, which is #35 in immigrant concentration
Part of Miscellaneous Manufacturing, which is #4 in immigrant concentration
Part of Personal and Laundry Services, which is #5 in immigrant concentration
Injury/Illness
#15 for injury and illness
#8 for injury / #7 for injury and illness
#12 in injury and #12 in injury and illness
#19 in injury and illness
Not among the highest rates
Not among the highest rates
Source: Information on the industry classification and number of employees obtained from County Business Patterns Web site (U.S. Census Bureau, 2006). Information on immigrant concentration obtained from Cortes (2005). Information on illness and injury rates obtained from Bureau of Labor Statistics, U.S. Department of Labor (2004a, 2004b).
Fitzgerald et al. / Slaughterhouses and Increased Crime Rates 9
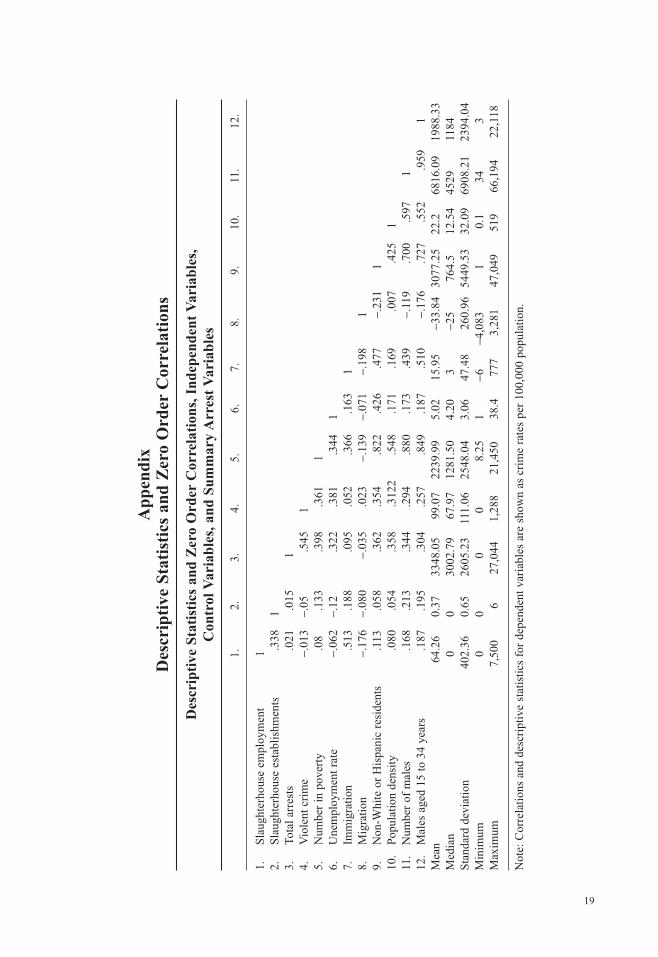
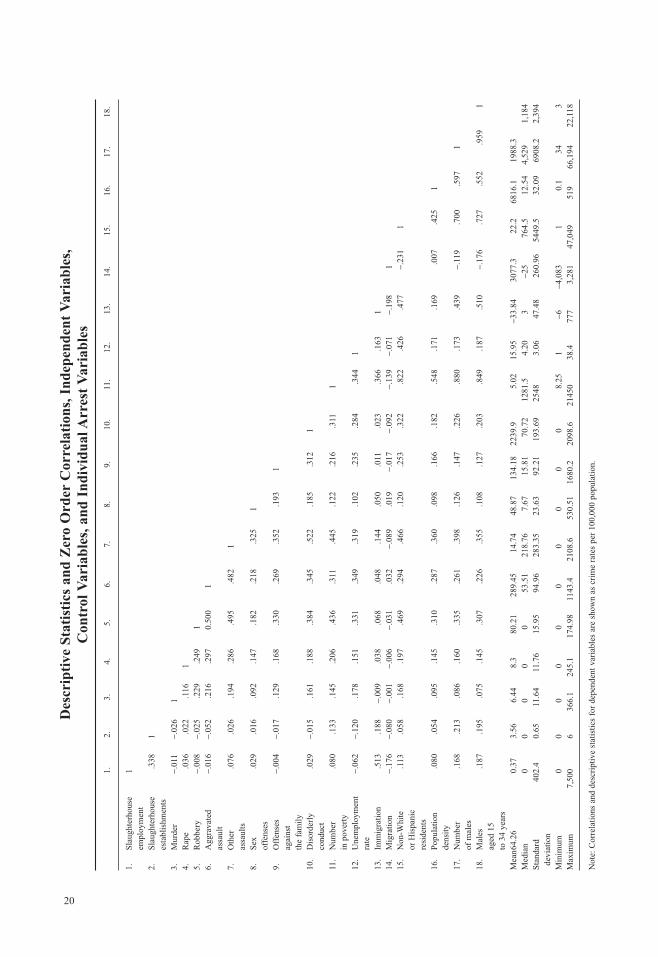
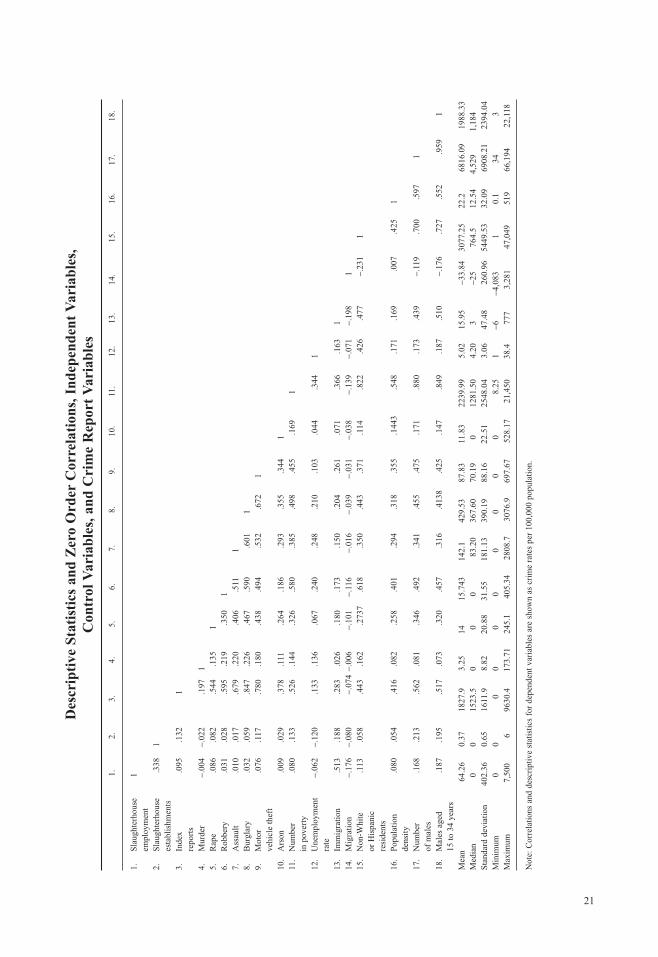
prudent to include property offences in the analyses as the slaughterhouse community stud-ies documented important shifts in these variables. Consistent with the theorized causes of crime increases the following control variables are used: the number of males in the county aged 15 to 34 years, population density, the total number of males, the number of people in poverty, international migration, internal migration, total non-White and/or Hispanic population, and the unemployment rate (the county population is accounted for in the analyses through its use to create rates in the ordinary least squares (OLS) regression models and as the exposure variable in the negative binomial regression models). (Please see the appendix for the descriptive statistics and zero order correlations among the variables used in the analyses).
The statistical approach used in this study was motivated by two factors: (a) the availa-bility of longitudinal data and (b) the count nature of the dependent variables. In response to the first factor, pooled fixed effects TSCS techniques are used. There are many advan-tages to the use of this approach. Notably, it makes it possible to control for all time-invariant county-specific variables (such as history and geographic location) not included in the model but which could potentially result in a spurious relationship between the observed independent variables and the dependent variables (Halaby, 2004; Wooldridge, 2002). Because the dependent variables are counts (often with very small numbers) some of the assumptions of OLS regression cannot adequately be met; specifically the assumptions of homogeneity of error variance and normal error distributions are frequently violated with units of analysis containing small population (such as rural counties; Osgood, 2000). Recent criminological studies examining aggregate crime with expected small counts have instead used regression models based on the Poisson distribution (Krivo & Peterson, 2004; Lee, Martinez, & Rosenfield, 2001; Lee & Ousey, 2001; Osgood, 2000; Rosen et al., 2003). However, the basic Poisson regression model assumes that the variance equals the mean. This assumption is often violated in analyses of crime data. Violating this assumption pro-duces underestimates of the standard errors and misleading significance tests. In instances of overdispersion (where variance exceeds the mean), negative binomial regression (using the Poisson distribution) is preferred, as it allows for overdispersion (Long, 1997; Osgood, 2000). Therefore, negative binomial regression, which is a more conservative approach, is used in the analyses conducted here with individual crime variables as the dependent variable.
For some analyses, crime rate variables were created and factor analyzed to create two scales (arrest rate and report rate scales). Using the scales as dependent variables mitigates the assumption violations of OLS regression, creating a more normal distribution of scores than obtained with the counts or rates for particular crimes. To create the scales the counts were first converted into rates. Then principal components analysis was used to determine the factor structure, followed by iterative principal factors to obtain the factor loadings. The resulting Arrest Rate Scale is made up of the following variables: rape, robbery, burglary, other assaults, forgery, possessing stolen property, vandalism, offences against the family, and disorderly conduct.8 The same process was followed to create the Report Rate Scale.9 The Report Rate Scale is made up of the following variables: reports of rape, robbery, assault, burglary, motor vehicle theft, and arson. Three pooled TSCS models were run with each of the scales in turn as the dependent variable (each with fixed effects): (a) with the number of slaughterhouse workers as the sole independent variable, (b) with the control variables added, and (3) with the comparison industries added.10
10 Organization & environment
Results
The results of the OLS regression models with the Arrest and Report Rate Scales in turn as the dependent variables are described first. Then we describe the results of the negative binomial regression models with individual crime variables as the dependent variables.
OLS Regression Analyses
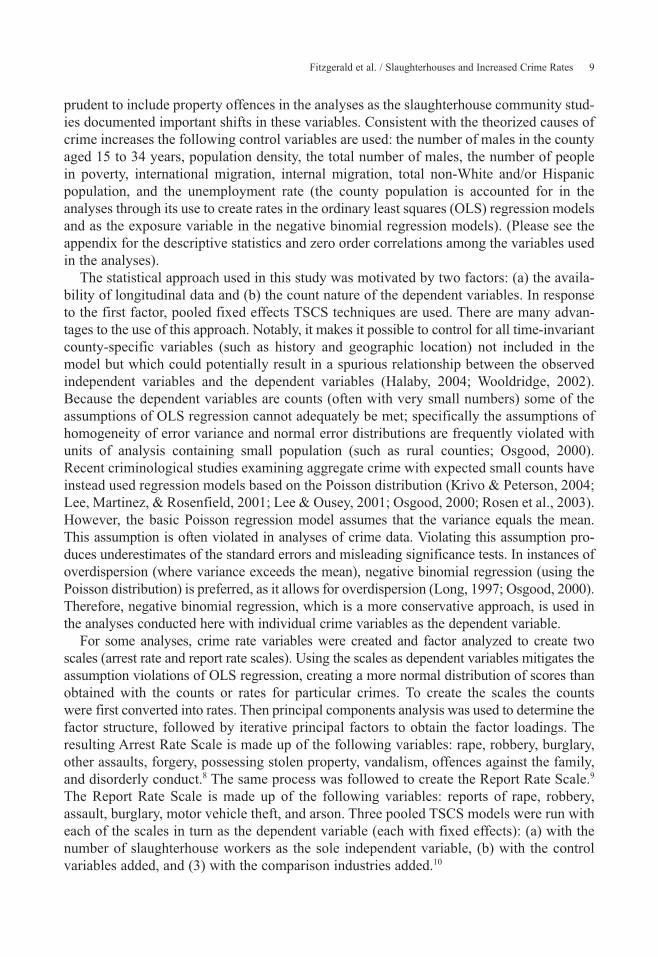
As shown in Tables 3 and 4, the Number of Slaughterhouse employees variable is a significant predictor in all six models. With the Arrest Rate Scale as the dependent variable (Table 3), the Slaughterhouse variable coefficient decreases from 0.019 to 0.013 with the addition of the control variables, but it remains significant. This means that controlling for all of the variables in the model, when the number of slaughterhouse workers increases by 1 the arrest rate scale increases by 0.013 arrests (p < .01).
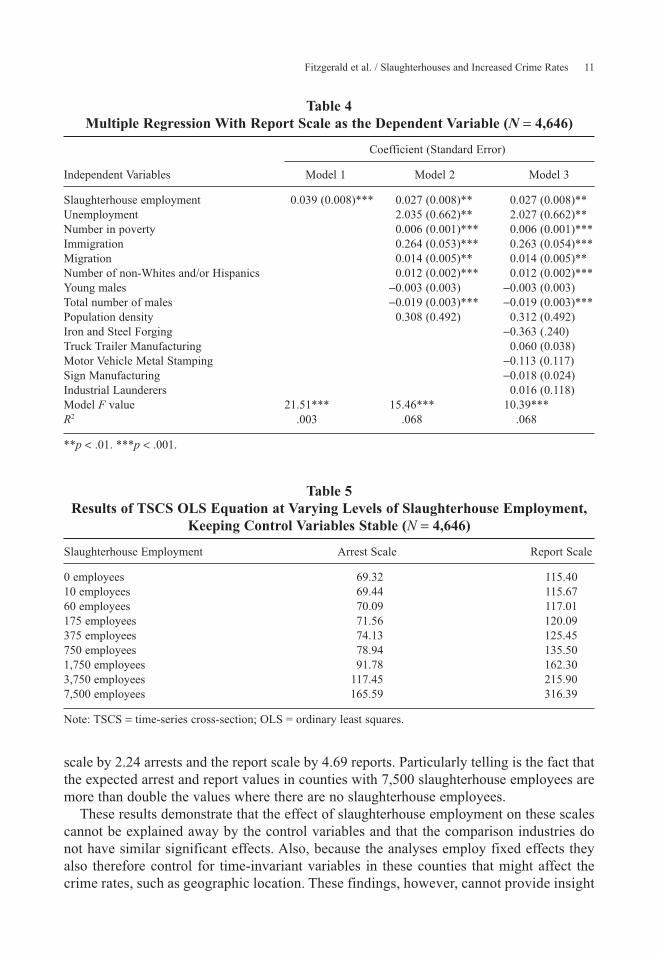
The results are more substantial with the Report Rate Scale as the dependent variable (Table 4). Controlling for all of the variables, the coefficient for slaughterhouse employ-ment is 0.027 (p < .01). It is worth noting that none of the comparison industries have significant effects on the Arrest Rate Scale or Report Rate Scale.
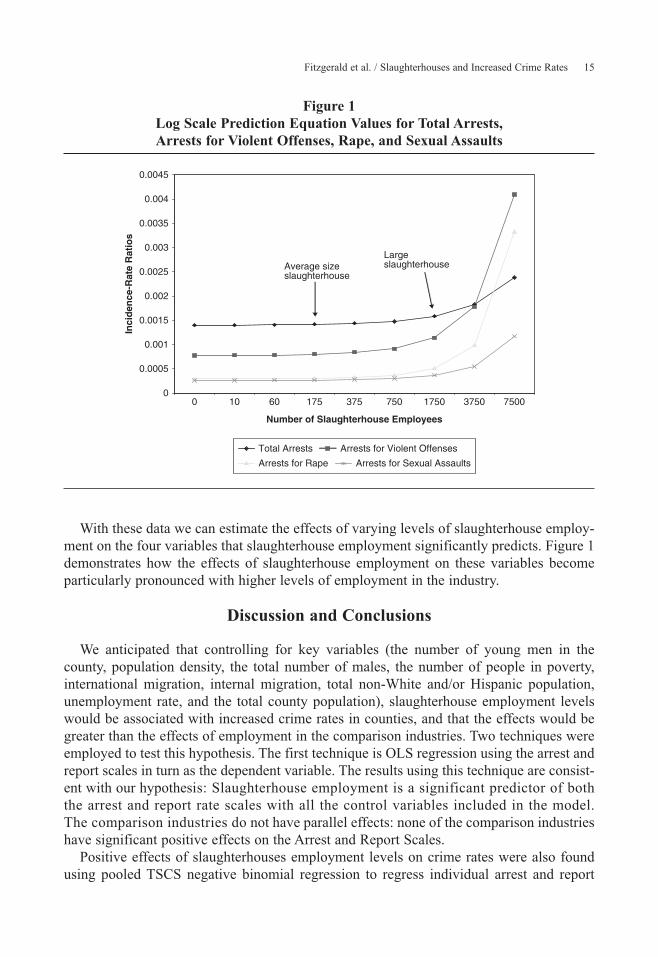
By fixing the control variables at their means and adjusting only the number of slaugh-terhouse employees in a county it is possible to see how different levels of slaughterhouse employment would affect the scales (see Table 5). An average-sized slaughterhouse, which employs 175 people at any given point in time, would be expected to increase the arrest
Table 3Multiple Regression With Arrest Scale as the Dependent Variable (N = 4,646)
Coefficient (Standard error)
Independent Variables Model 1 Model 2 Model 3
Slaughterhouse employment 0.019 (0.004)*** 0.013 (0.004)** 0.013 (0.004)**Unemployment 1.17 (0.346)** 1.164 (0.346)**Number in poverty 0.0003 (0.0007) 0.0003 (0.0007)Immigration 0.072 (0.028)* 0.069 (0.028)*Migration 0.004 (0.003) 0.003 (0.003)Number of non-Whites 0.008 (0.001)*** 0.008 (0.001)*** and/or HispanicsYoung males −0.003 (0.002) −0.003 (0.002)Total number of males −0.009 (0.002)*** −0.009 (0.002)***Population density −0.563 (0.257)* −0.556 (0.257)*Iron and steel forging −0.204 (0.126)Truck trailer manufacturing −0.016 (0.020)Motor vehicle metal stamping −0.035 (0.061)Sign manufacturing −0.011 (0.013)Industrial launderers 0.086 (0.062) Model F value 21.36*** 19.83*** 19.72***R2 .004 .040 .030
*p < .05. **p < .01. ***p < .001.
Fitzgerald et al. / Slaughterhouses and Increased Crime Rates 11
Table 4Multiple Regression With Report Scale as the Dependent Variable (N = 4,646)
Coefficient (Standard error)
Independent Variables Model 1 Model 2 Model 3
Slaughterhouse employment 0.039 (0.008)*** 0.027 (0.008)** 0.027 (0.008)**Unemployment 2.035 (0.662)** 2.027 (0.662)**Number in poverty 0.006 (0.001)*** 0.006 (0.001)***Immigration 0.264 (0.053)*** 0.263 (0.054)***Migration 0.014 (0.005)** 0.014 (0.005)**Number of non-Whites and/or Hispanics 0.012 (0.002)*** 0.012 (0.002)***Young males −0.003 (0.003) −0.003 (0.003)Total number of males −0.019 (0.003)*** −0.019 (0.003)***Population density 0.308 (0.492) 0.312 (0.492)Iron and Steel Forging −0.363 (.240)Truck Trailer Manufacturing 0.060 (0.038)Motor Vehicle Metal Stamping −0.113 (0.117)Sign Manufacturing −0.018 (0.024)Industrial Launderers 0.016 (0.118)Model F value 21.51*** 15.46*** 10.39***R2 .003 .068 .068
**p < .01. ***p < .001.
scale by 2.24 arrests and the report scale by 4.69 reports. Particularly telling is the fact that the expected arrest and report values in counties with 7,500 slaughterhouse employees are more than double the values where there are no slaughterhouse employees.
These results demonstrate that the effect of slaughterhouse employment on these scales cannot be explained away by the control variables and that the comparison industries do not have similar significant effects. Also, because the analyses employ fixed effects they also therefore control for time-invariant variables in these counties that might affect the crime rates, such as geographic location. These findings, however, cannot provide insight
Table 5Results of TSCS OLS Equation at Varying Levels of Slaughterhouse Employment,
Keeping Control Variables Stable (N = 4,646)
Slaughterhouse employment Arrest Scale Report Scale
0 employees 69.32 115.4010 employees 69.44 115.6760 employees 70.09 117.01175 employees 71.56 120.09375 employees 74.13 125.45750 employees 78.94 135.501,750 employees 91.78 162.303,750 employees 117.45 215.907,500 employees 165.59 316.39
Note: TSCS = time-series cross-section; OLS = ordinary least squares.
12 Organization & environment
into how slaughterhouses, the comparison industries, and the control variables affect indi-vidual crime variables. To provide this insight, we used negative binomial regression.
Negative Binomial Regression Analyses
Pooled TSCS negative binomial regression was performed on 11 individual dependent vari-ables (7 arrest variables and 4 report variables).11 These analyses were modeled with county population set as the exposure variable12 and county fixed effects. The same three models were run for each of the dependent variables as was done with the OLS regression analyses.
The regressions were performed on the data for two time periods: the entire time period under study (1994-2002) and the period before custom slaughter facilities were added to the slaugh-terhouse industry category (1994-1997). A few words here regarding this change in classifica-tion are warranted. In 1998, custom slaughtering facilities were added to the Animal (except poultry) Slaughtering category (personal communication with Census Bureau representative, May 2, 2006). Custom slaughter includes (a) slaughter or processing of uninspected food ani-mals for the sole consumption of the owner; (b) slaughtering/processing animals as a custom service for an individual who owns the animal, and uses the meat for his or her own consump-tion. These tend to be very small establishments. This change in classification resulted in an increase in the smaller slaughterhouse facilities from 1997 to 1998 (an increase of 514 facilities employing 1 to 4 people). A potential consequence of this change in classification is that the effects of slaughterhouses on crime in these years could be diluted in the aggregate data by the increase in these small slaughter facilities, an issue that we discuss in more detail below.
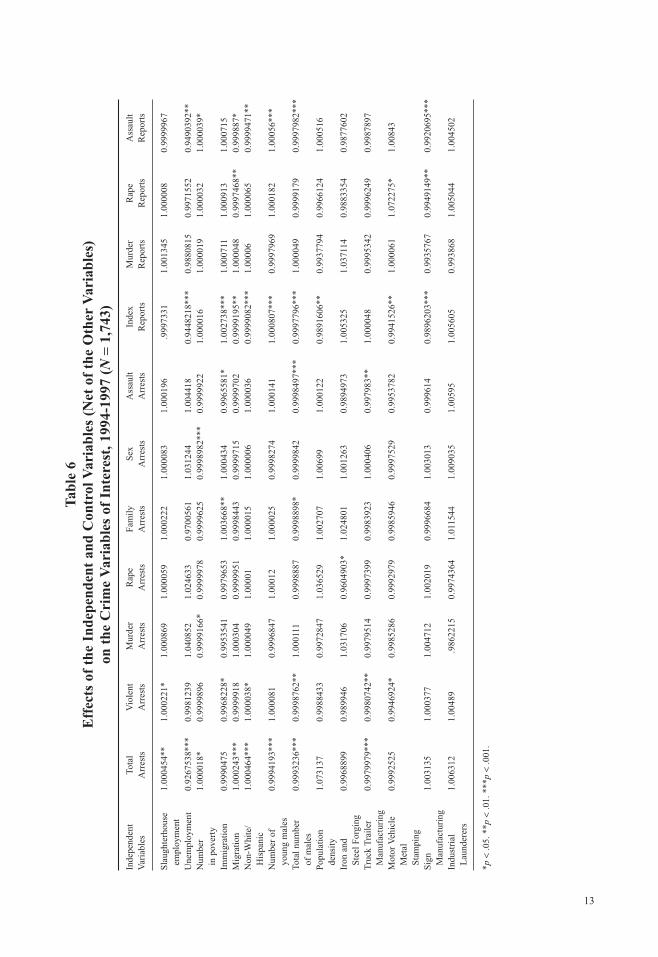
The values reported in Tables 6 and 7 are the incidence-rate ratio (IRR)13 values for the most complete models (Model 3). Analysis of the precustom slaughterhouse period (1994-1997), while controlling for all the control variables, indicates that slaughterhouse employ-ment has a significant positive effect on the total number of arrests and arrests for violent crimes (see Table 6). The IRR value for total number of arrests (1.000454) means that each additional slaughterhouse employee would be expected to increase the total arrest rate by a factor of 1.000454 or approximately 0.05%. Again, although on face value this may not appear impressive, it is important to note that some of the large facilities employ thousands of people, so that the actual effect could be much more substantial. For example, 4,000 slaughterhouse employees would increase the total number of arrests by approximately 2%.
The IRR value for the Arrests for Violent Crimes variable is interpreted to mean that each additional slaughterhouse employee increases the expected number of violent arrests by a factor of 1.000221 or by 0.0221%. Accordingly, 4,000 slaughterhouse employees would be expected to increase the number of arrests for violent offenses by nearly 1%. Note that only one of the comparison industries (motor vehicle metal stamping) has a significant positive effect on any of the crime variables (rape reports) and there are several instances where the comparison industries have significant negative effects.
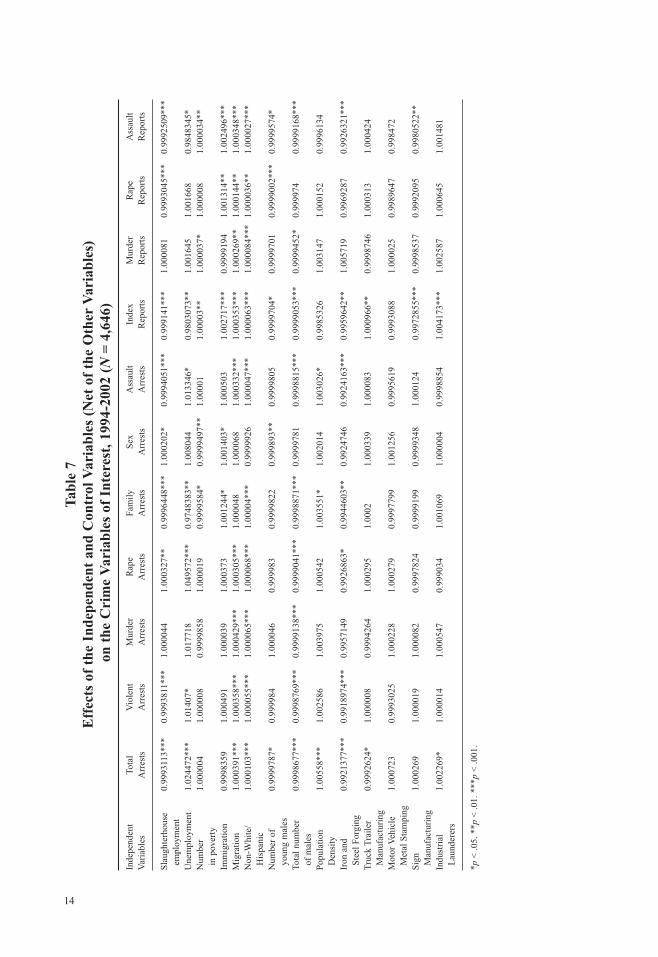
When the entire time period is examined (Table 7), the effect of slaughterhouse employment on total arrests and arrests for violent crimes is no longer significant in the expected direction. This is likely due to the inclusion of the custom slaughter facilities. However, in the analysis of the entire time period, the slaughterhouse employment variable has a significant positive effect on arrests for rape and for other sex offenses (the effects are in the same direction in the previous analysis, but it is possible that they are significant here because of the increase in data points). Additionally, these effects are not found in the comparison industries.
13
Tab
le 6
Eff
ects
of
the
Ind
epen
den
t an
d C
ontr
ol V
aria
ble
s (N
et o
f th
e O
ther
Var
iab
les)
on
th
e C
rim
e V
aria
ble
s of
In
tere
st, 1
994-
1997
(N
= 1
,743
)
Inde
pend
ent
Tota
l V
iole
nt
Mur
der
Rap
e F
amil
y S
ex
Ass
ault
In
dex
Mur
der
Rap
e A
ssau
lt
Var
iabl
es
Arr
ests
A
rres
ts
Arr
ests
A
rres
ts
Arr
ests
A
rres
ts
Arr
ests
R
epor
ts
Rep
orts
R
epor
ts
Rep
orts
Sla
ught
erho
use
1.00
0454
**
1.00
0221
* 1.
0008
69
1.00
0059
1.
0002
22
1.00
0083
1.
0001
96
.999
7331
1.
0013
45
1.00
0008
0.
9999
967
em
ploy
men
tU
nem
ploy
men
t 0.
9267
538*
**
0.99
8123
9 1.
0408
52
1.02
4633
0.
9700
561
1.03
1244
1.
0044
18
0.94
4821
8***
0.
9880
815
0.99
7155
2 0.
9490
392*
*N
umbe
r 1.
0000
18*
0.99
9989
6 0.
9999
166*
0.
9999
978
0.99
9962
5 0.
9998
982*
**
0.99
9992
2 1.
0000
16
1.00
0019
1.
0000
32
1.00
0039
* i
n po
vert
yIm
mig
rati
on
0.99
9047
5 0.
9968
228*
0.
9953
541
0.99
7965
3 1.
0036
68**
1.
0004
34
0.99
6558
1*
1.00
2738
***
1.00
0711
1.
0009
13
1.00
0715
Mig
rati
on
1.00
0243
***
0.99
9991
8 1.
0003
04
0.99
9995
1 0.
9998
443
0.99
9971
5 0.
9999
702
0.99
9919
5**
1.00
0048
0.
9997
468*
* 0.
9998
87*
Non
-Whi
te/
1.00
0464
***
1.00
0038
* 1.
0000
49
1.00
001
1.00
0015
1.
0000
06
1.00
0036
0.
9999
082*
**
1.00
006
1.00
0065
0.
9999
471*
* H
ispa
nic
Num
ber
of
0.99
9419
3***
1.
0000
81
0.99
9684
7 1.
0001
2 1.
0000
25
0.99
9827
4 1.
0001
41
1.00
0807
***
0.99
9796
9 1.
0001
82
1.00
056*
**
you
ng m
ales
Tota
l num
ber
0.99
9323
6***
0.
9998
762*
* 1.
0001
11
0.99
9888
7 0.
9998
898*
0.
9999
842
0.99
9849
7***
0.
9997
796*
**
1.00
0049
0.
9999
179
0.99
9798
2***
o
f m
ales
Pop
ulat
ion
1.07
3137
0.
9988
433
0.99
7284
7 1.
0365
29
1.00
2707
1.
0069
9 1.
0001
22
0.98
9160
6**
0.99
3779
4 0.
9966
124
1.00
0516
d
ensi
tyIr
on a
nd
0.99
6889
9 0.
9899
46
1.03
1706
0.
9604
903*
1.
0248
01
1.00
1263
0.
9894
973
1.00
5325
1.
0371
14
0.98
8335
4 0.
9877
602
Ste
el F
orgi
ngT
ruck
Tra
iler
0.
9979
979*
**
0.99
8074
2**
0.99
7951
4 0.
9997
399
0.99
8392
3 1.
0004
06
0.99
7983
**
1.00
0048
0.
9995
342
0.99
9624
9 0.
9987
897
Man
ufac
turi
ngM
otor
Veh
icle
0.
9992
525
0.99
4692
4*
0.99
8528
6 0.
9992
979
0.99
8594
6 0.
9997
529
0.99
5378
2 0.
9941
526*
* 1.
0000
61
1.07
2275
* 1.
0084
3 M
etal
S
tam
ping
Sig
n 1.
0031
35
1.00
0377
1.
0047
12
1.00
2019
0.
9996
684
1.00
3013
0.
9996
14
0.98
9620
3***
0.
9935
767
0.99
4914
9**
0.99
2069
5***
M
anuf
actu
ring
Indu
stri
al
1.00
6312
1.
0048
9 .9
8622
15
0.99
7436
4 1.
0115
44
1.00
9035
1.
0059
5 1.
0056
05
0.99
3868
1.
0050
44
1.00
4502
L
aund
erer
s
*p <
.05.
**p
< .0
1. *
**p
< .0
01.
14
Tab
le 7
Eff
ects
of
the
Ind
epen
den
t an
d C
ontr
ol V
aria
ble
s (N
et o
f th
e O
ther
Var
iab
les)
o
n t
he
Cri
me
Var
iab
les
of I
nte
rest
, 199
4-20
02 (N
= 4
,646
)
Inde
pend
ent
Tota
l V
iole
nt
Mur
der
Rap
e F
amil
y S
ex
Ass
ault
In
dex
Mur
der
Rap
e A
ssau
lt
Var
iabl
es
Arr
ests
A
rres
ts
Arr
ests
A
rres
ts
Arr
ests
A
rres
ts
Arr
ests
R
epor
ts
Rep
orts
R
epor
ts
Rep
orts
Sla
ught
erho
use
0.99
9311
3***
0.
9993
811*
**
1.00
0044
1.
0003
27**
0.
9996
448*
**
1.00
0202
* 0.
9994
051*
**
0.99
9141
***
1.00
0081
0.
9993
045*
**
0.99
9250
9***
e
mpl
oym
ent
Une
mpl
oym
ent
1.02
4472
***
1.01
407*
1.
0177
18
1.04
9572
***
0.97
4838
3**
1.00
8044
1.
0133
46*
0.98
0307
3**
1.00
1645
1.
0016
68
0.98
4834
5*N
umbe
r 1.
0000
04
1.00
0008
0.
9999
858
1.00
0019
0.
9999
584*
0.
9999
497*
* 1.
0000
1 1.
0000
3**
1.00
0037
* 1.
0000
08
1.00
0034
**
in
pove
rty
Imm
igra
tion
0.
9998
359
1.00
0491
1.
0000
39
1.00
0373
1.
0012
44*
1.00
1403
* 1.
0005
03
1.00
2717
***
0.99
9919
4 1.
0013
14**
1.
0024
96**
*M
igra
tion
1.
0003
91**
* 1.
0003
58**
* 1.
0004
29**
* 1.
0003
05**
* 1.
0000
48
1.00
0068
1.
0003
32**
* 1.
0003
53**
* 1.
0002
69**
1.
0001
44**
1.
0003
48**
*N
on-W
hite
/ 1.
0001
03**
* 1.
0000
55**
* 1.
0000
65**
* 1.
0000
68**
* 1.
0000
4***
0.
9999
926
1.00
0047
***
1.00
0063
***
1.00
0084
***
1.00
0036
**
1.00
0027
***
His
pani
cN
umbe
r of
0.
9999
787*
0.
9999
84
1.00
0046
0.
9999
83
0.99
9982
2 0.
9998
93**
0.
9999
805
0.99
9970
4*
0.99
9970
1 0.
9999
002*
**
0.99
9957
4*
you
ng m
ales
Tota
l num
ber
0.99
9867
7***
0.
9998
769*
**
0.99
9913
8***
0.
9999
041*
**
0.99
9887
1***
0.
9999
781
0.99
9881
5***
0.
9999
053*
**
0.99
9945
2*
0.99
9974
0.
9999
168*
**
of
mal
esP
opul
atio
n 1.
0055
8***
1.
0025
86
1.00
3975
1.
0005
42
1.00
3551
* 1.
0020
14
1.00
3026
* 0.
9985
326
1.00
3147
1.
0001
52
0.99
9613
4 D
ensi
tyIr
on a
nd
0.99
2137
7***
0.
9918
974*
**
0.99
5714
9 0.
9926
863*
0.
9944
603*
* 0.
9924
746
0.99
2416
3***
0.
9959
642*
* 1.
0057
19
0.99
6928
7 0.
9926
321*
**
Ste
el F
orgi
ngT
ruck
Tra
iler
0.
9992
624*
1.
0000
08
0.99
9426
4 1.
0002
95
1.00
02
1.00
0339
1.
0000
83
1.00
0966
**
0.99
9874
6 1.
0003
13
1.00
0424
M
anuf
actu
ring
Mot
or V
ehic
le
1.00
0723
0.
9993
025
1.00
0228
1.
0002
79
0.99
9779
9 1.
0012
56
0.99
9561
9 0.
9993
088
1.00
0025
0.
9989
647
0.99
8472
M
etal
Sta
mpi
ngS
ign
1.00
0269
1.
0000
19
1.00
0082
0.
9997
824
0.99
9919
9 0.
9999
348
1.00
0124
0.
9972
855*
**
0.99
9853
7 0.
9992
095
0.99
8052
2**
Man
ufac
turi
ngIn
dust
rial
1.
0022
69*
1.00
0014
1.
0005
47
0.99
9034
1.
0010
69
1.00
0004
0.
9998
854
1.00
4173
***
1.00
2587
1.
0006
45
1.00
1481
L
aund
erer
s
*p <
.05.
**p
< .0
1. *
**p
< .0
01.
Fitzgerald et al. / Slaughterhouses and Increased Crime Rates 15
Figure 1Log Scale Prediction Equation Values for Total Arrests, Arrests for Violent Offenses, Rape, and Sexual Assaults
0 10 60 175 375 750 1750 3750 7500
Number of Slaughterhouse Employees
Inci
den
ce-R
ate
Rat
ios
Average size slaughterhouse
Large slaughterhouse
0
0.0005
0.001
0.0015
0.002
0.0025
0.003
0.0035
0.004
0.0045
Total Arrests Arrests for Violent Offenses
Arrests for Rape Arrests for Sexual Assaults
With these data we can estimate the effects of varying levels of slaughterhouse employ-ment on the four variables that slaughterhouse employment significantly predicts. Figure 1 demonstrates how the effects of slaughterhouse employment on these variables become particularly pronounced with higher levels of employment in the industry.
Discussion and Conclusions
We anticipated that controlling for key variables (the number of young men in the county, population density, the total number of males, the number of people in poverty, international migration, internal migration, total non-White and/or Hispanic population, unemployment rate, and the total county population), slaughterhouse employment levels would be associated with increased crime rates in counties, and that the effects would be greater than the effects of employment in the comparison industries. Two techniques were employed to test this hypothesis. The first technique is OLS regression using the arrest and report scales in turn as the dependent variable. The results using this technique are consist-ent with our hypothesis: Slaughterhouse employment is a significant predictor of both the arrest and report rate scales with all the control variables included in the model. The comparison industries do not have parallel effects: none of the comparison industries have significant positive effects on the Arrest and Report Scales.
Positive effects of slaughterhouses employment levels on crime rates were also found using pooled TSCS negative binomial regression to regress individual arrest and report
16 Organization & environment
variables. In the results derived from the entire time period, and controlling for the extrane-ous variables, slaughterhouse employment has significant effects on arrests for rape and arrests for sex offenses. Of the comparison industries, only iron and steel forging demon-strates a significant effect on arrests for rape, but it is a negative one. Thus, controlling for the other variables, an increase in employment in iron and steel forging is associated with a decrease in arrests for rape.
The effects of slaughterhouse employment on the arrests for rape and other sex offenses are not significant in the analysis of the data prior to the inclusion of custom slaughter facilities (1994-1997). This is not surprising given that the analysis of the entire time period includes more than double the number of observations than the period before the inclusion of custom slaughter facilities. For the analyses of the entire time period (1994-2002), 4,646 observations are analyzed (581 counties × 8 years [8 years of observations instead of 9 are included in the analyses as the result of the one year lag] − 2 missing cases = 4,646]. For the analyses of the time period before custom slaughter facilities were added to the slaugh-terhouse categorization (1994-1997), 1,743 observations are analyzed (581 counties − 3 years = 1,743). Slaughterhouse employment is a significant predictor of two variables for the period before custom slaughter facilities were added to the slaughterhouse categoriza-tion: total arrests and violent arrests. Only one of the comparison industries (Truck Trailer Manufacturing) has a significant effect on the total arrests variable, but it is a negative effect and therefore an increase in the number of truck trailer employees in these counties would be expected to decrease the number of total arrests.
The IRR value for the slaughterhouse employment variable in predicting violent arrests is 1.0002 (rounded), controlling for the other variables. Two of the comparison industries (Truck Trailer Manufacturing and Motor Vehicle Metal Stamping) have significant effects on violent arrests, but both are negative. Again, we would therefore expect that an increase in the number of employees in these industries would be associated with a decrease in the number of arrests for violent offenses. Thus, the results of the pooled TSCS OLS regression and pooled TSCS negative binomial regression both demonstrate that slaughterhouse employment does have significant positive and unique effects on the Arrest and Report Rate Scales, as well as on rates of total arrests, arrests for violent crimes, arrests for rape, and arrests for other sex offences, controlling for the number of young men in the county, population density, the total number of males, the number of people in poverty, international migration, internal migration, total non-White and/or Hispanic population, the unemployment rate, and the total county population.
The effect of slaughterhouse employment on offenses against the family was significant and negative for the analysis of the entire time period, and positive but not significant for the analysis of the 1994-1997 data. The negative effect found in the 1994-2002 analysis may be the result of including the custom slaughter facilities. It is also worth noting that the Offenses Against the Family variable consists of unlawful nonviolent acts by family members against each other (U.S. Department of Justice and Federal Bureau of Investigation, 2004). Therefore, there is not a clear measure of family violence in the Uniform Crime Reports that includes violence against family members. Perhaps the inclusion of violent forms of offenses against the family in this variable would have made the effects of slaugh-terhouse employment clearer. Additionally, we cannot assess the effect of slaughterhouse employment on reports of offenses against the family, because, as previously mentioned, only data on reports for Part I or Index offenses are collected (including murder, rape, robbery, aggravated assault, burglary, larceny, motor vehicle theft, and arson).
Fitzgerald et al. / Slaughterhouses and Increased Crime Rates 17
Increases in slaughterhouse employment had a significant positive effect on rape arrests across the entire time period under study. However, this effect was not significant when fewer observations were analyzed for the period before custom slaughter facilities were added (1994-1997). Similarly, slaughterhouse employment did not have a significant effect on reports of rape for the years 1994 to 1997. Slaughterhouse employment did have a significant negative effect on the rape reports variable for the analysis of the entire time period. It is pos-sible that this result was impacted by the inclusion of the custom slaughter facilities.14
The significant positive effect of slaughterhouse employment on sex offenses is also note-worthy. Although this variable excludes forcible rape and prostitution, it does include sexual attacks on males, incest, indecent exposure, statutory rape, and “crimes against nature” (U.S. Department of Justice and Federal Bureau of Investigation, 2004). Many of these offenses are perpetrated against those with less power, and we interpret this as evidence that that the work done within slaughterhouses might spillover to violence against other less powerful groups, such as women and children. Further, the positive effects of slaughterhouse employment on rape and other sexual assaults were not observed in the comparison industry analyses.15
The results presented here therefore demonstrate significant and unique effects of slaughterhouse employment on several crime variables. These effects are not found in the comparison industries, and they cannot be explained by unemployment, social disorgani-zation, and demographic variables. Additionally, the differences in the results before and after custom slaughter facilities were added to the slaughterhouse category also suggests that the industrialization of slaughter has the strongest adverse effects, whereas the addi-tion of the smaller, custom slaughter facilities likely adds “noise” to the analyses and may even be adding the effects of social capital (related to small businesses and small-scale agriculture). given the highly stochastic nature of the arrest and report variables in rural counties, the findings presented here are quite suggestive.
A few words on the performance of the control variables are in order. Recall that the control variables have gathered into three groupings in the literature: demographic, social disorganization, and unemployment. The control variables with the most explanatory power in predicting the crime variables in this study include the unemployment variable and some of the social disorganization variables (specifically migration and immigration). The effects of the demographic variables were largely contradictory and close to zero. The arguments that have been used to explain the slaughterhouse effect overall find limited substantiation here, again supporting the claim that there is something unique about slaughterhouse work.
The major limitation of our study is the reliance on Uniform Crime Report (UCR) data. Although many studies of crime rely on the UCR for their data (such as Kawachi, Kennedy, & Wilkinson, 1999; Krivo & Peterson, 2004; Lee & Ousey, 2001; Wilkinson, Reynolds, et al., 1984), shortcomings of the data have been identified. For instance, official statistics obviously exclude those crimes that law enforcement officials are not aware of. However, for some offenses, such as motor vehicle theft and homicide (Kawachi et al., 1999), and serious crimes more generally (Sampson, 1987), the undercount is trivial. There are also problems related to the ability of victims and witnesses to recall and report accurate information, limitations of police resources for making arrests, and inconsistencies in the deployment of resources and enforcement of laws across geographic areas (Krivo & Peterson, 2004; Sampson & groves, 1989). The validity of official statistics has been questioned particularly in areas undergoing rapid growth. It is possible that increases in official crime rates in growing areas are the result of increases in police staff, additions which are common in boomtowns. It is also possible that
18 Organization & environment
increases in crime rates in boomtowns might be partly due to increased reports by law enforce-ment officials in an attempt to justify increasing their resources (gold, 1982). On the other hand, residents in stable areas have been known to assert that the police record even minor incidents because their time is not occupied with serious offenses (Freudenberg & Jones, 1991), thus potentially increasing crime rates at the less severe end of the spectrum. Some have suggested that victimization data be used instead of arrest and report data; however, victimiza-tion data are more limited and few differences have been found between the arrest rates of the UCR and offending rates estimated from the national victimization survey (Sampson, 1987). Despite the critiques of official arrest and report data, these data are the best sources of sys-tematic and timely offense information at the county level (Miles-Doan, 1998).
Our results cannot be generalized to counties in states without right-to-work laws and to counties in or adjacent to metropolitan areas. Subsequent research expanding these delimi-tations might provide interesting information about the effects of labor unions and urbani-zation on social disruption in communities surrounding slaughterhouses.
Finally, the aggregated level of the data poses three limitations: (a) There may be inconsist-encies in reporting across counties and the small number of certain types of crime (such as homicide) may make reliable estimates difficult (Pridemore, 2005). However, given the scope of this study and the need for comparable crime data at a fairly low level of aggregation, there are no viable alternatives to using official crime data at the county level. (a) Because of spatial aggregation, the effects of slaughterhouses might be muted and thus make the analysis rather conservative. (c) These data provide a broad picture, but do not enable gaining a clear under-standing of the dynamics in these communities, such as who is actually committing the crimes, or if some jobs in slaughterhouses are more problematic than others. Thus, although this study does not permit one to draw conclusions about the individuals who work in slaughterhouses, it nonetheless is a first step in better understanding what is occurring in slaughterhouse communities. It is therefore an important complement to micro-level survey or ethnographic research that would permit a more nuanced analysis of what is occurring in the work and life experiences of those involved in the slaughterhouse industry but would not allow the detection of overall patterns and control for alternative theoretical explanations.
In conclusion, despite some limitations, our research makes valuable theoretical and empirical contributions to a developing sociology of the slaughterhouse. This study is the first to test the theories proposed to explain increased crime in slaughterhouse communities,16 providing evidence that elaborates on the case study research that initially documented increased crime in communities where large slaughterhouses were sited. The inclusion of comparison industries as well as standard predictors of crime rates in our analyses supports the claim that slaughterhouses have a unique and insidious effect on the surrounding com-munities. Although studies have found that employment in the manufacturing sector in general has suppressant effects on crime (e.g., Lee & Ousey, 2001), this is clearly not the case for the slaughterhouse subsector of manufacturing. Meaningful theoretical and empir-ical distinctions can and ought to be drawn between slaughterhouse employment and other types of manufacturing employment. In particular, our results lend support to the argument, first articulated by Sinclair, and since elaborated by Beirne, that the industrial slaughter-house is different in its effects from other industrial facilities. We believe that this is another of a growing list of social problems and phenomena that are undertheorized unless explicit attention is paid to the social role of nonhuman animals.
19
Ap
pen
dix
Des
crip
tive
Sta
tist
ics
and
Zer
o O
rder
Cor
rela
tion
s
Des
crip
tive
Sta
tist
ics
and
Zer
o O
rder
Cor
rela
tion
s, I
nd
epen
den
t V
aria
ble
s,
Con
trol
Var
iab
les,
an
d S
um
mar
y A
rres
t V
aria
ble
s
1.
2.
3.
4.
5.
6.
7.
8.
9.
10
. 11
. 12
.
1.
Sla
ught
erho
use
empl
oym
ent
1
2.
S
laug
hter
hous
e es
tabl
ishm
ents
.3
38
1
3.
Tota
l arr
ests
.0
21
.015
1
4.
Vio
lent
cri
me
−.01
3 −.
05
.545
1
5.
N
umbe
r in
pov
erty
.0
8 .1
33
.398
.3
61
1
6.
U
nem
ploy
men
t rat
e −.
062
−.12
.3
22
.381
.3
44
1
7.
Imm
igra
tion
.5
13
.188
.0
95
.052
.3
66
.163
1
8.
Mig
rati
on
−.17
6 −.
080
−.03
5 .0
23
−.13
9 −.
071
−.19
8 1
9.
N
on-W
hite
or
His
pani
c re
side
nts
.113
.0
58
.362
.3
54
.822
.4
26
.477
−.
231
1
10
. P
opul
atio
n de
nsit
y .0
80
.054
.3
58
.312
2 .5
48
.171
.1
69
.007
.4
25
1
11.
Num
ber
of m
ales
.1
68
.213
.3
44
.294
.8
80
.173
.4
39
−.11
9 .7
00
.597
1
12.
Mal
es a
ged
15 to
34
year
s .1
87
.195
.3
04
.257
.8
49
.187
.5
10
−.17
6 .7
27
.552
.9
59
1M
ean
64.2
6 0.
37
3348
.05
99.0
7 22
39.9
9 5.
02
15.9
5 −3
3.84
30
77.2
5 22
.2
6816
.09
1988
.33
Med
ian
0 0
3002
.79
67.9
7 12
81.5
0 4.
20
3 −2
5 76
4.5
12.5
4 45
29
1184
Sta
ndar
d de
viat
ion
402.
36
0.65
26
05.2
3 11
1.06
25
48.0
4 3.
06
47.4
8 26
0.96
54
49.5
3 32
.09
6908
.21
2394
.04
Min
imum
0
0 0
0 8.
25
1 −6
−4
,083
1
0.1
34
3M
axim
um
7,50
0 6
27,0
44
1,28
8 21
,450
38
.4
777
3,28
1 47
,049
51
9 66
,194
22
,118
Not
e: C
orre
lati
ons
and
desc
ript
ive
stat
isti
cs f
or d
epen
dent
var
iabl
es a
re s
how
n as
cri
me
rate
s pe
r 10
0,00
0 po
pula
tion
.
20
Des
crip
tive
Sta
tist
ics
and
Zer
o O
rder
Cor
rela
tion
s, I
nd
epen
den
t V
aria
ble
s,
Con
trol
Var
iab
les,
an
d I
nd
ivid
ual
Arr
est
Var
iab
les
1.
2.
3.
4.
5.
6.
7.
8.
9.
10
. 11
. 12
. 13
. 14
. 15
. 16
. 17
. 18
.
1.
Sla
ught
erho
use
1
em
ploy
men
t2.
S
laug
hter
hous
e .3
38
1
esta
blis
hmen
ts3.
M
urde
r −.
011
−.02
6 1
4.
Rap
e .0
36
.022
.1
16
1
5.
Rob
bery
−.
008
−.02
5 .2
29
.249
1
6.
Agg
rava
ted
−.01
6 −.
052
.216
.2
97
0.50
0 1
as
saul
t7.
O
ther
.0
76
.026
.1
94
.286
.4
95
.482
1
assa
ults
8.
Sex
.0
29
.016
.0
92
.147
.1
82
.218
.3
25
1
offe
nses
9.
Off
ense
s −.
004
−.01
7 .1
29
.168
.3
30
.269
.3
52
.193
1
agai
nst
th
e fa
mil
y10
. D
isor
derl
y .0
29
−.01
5 .1
61
.188
.3
84
.345
.5
22
.185
.3
12
1
cond
uct
11.
Num
ber
.080
.1
33
.145
.2
06
.436
.3
11
.445
.1
22
.216
.3
11
1
in
pov
erty
12.
Une
mpl
oym
ent
−.06
2 −.
120
.178
.1
51
.331
.3
49
.319
.1
02
.235
.2
84
.344
1
ra
te13
. Im
mig
rati
on
.513
.1
88
−.00
9 .0
38
.068
.0
48
.144
.0
50
.011
.0
23
.366
.1
63
1
14
. M
igra
tion
−.
176
−.08
0 −.
001
−.00
6 −.
031
.032
−.
089
.019
−.
017
−.09
2 −.
139
−.07
1 −.
198
1
15.
Non
-Whi
te
.113
.0
58
.168
.1
97
.469
.2
94
.466
.1
20
.253
.3
22
.822
.4
26
.477
−.
231
1
or
His
pani
c
resi
dent
s16
. P
opul
atio
n .0
80
.054
.0
95
.145
.3
10
.287
.3
60
.098
.1
66
.182
.5
48
.171
.1
69
.007
.4
25
1
dens
ity
17.
Num
ber
.168
.2
13
.086
.1
60
.335
.2
61
.398
.1
26
.147
.2
26
.880
.1
73
.439
−.
119
.700
.5
97
1
of
mal
es18
. M
ales
.1
87
.195
.0
75
.145
.3
07
.226
.3
55
.108
.1
27
.203
.8
49
.187
.5
10
−.17
6 .7
27
.552
.9
59
1
aged
15
to
34
year
sM
ean 6
4.26
0.
37
3.56
6.
44
8.3
80.2
1 28
9.45
14
.74
48.8
7 13
4.18
22
39.9
5.
02
15.9
5 −3
3.84
30
77.3
22
.2
6816
.1
1988
.3M
edia
n 0
0 0
0 0
53.5
1 21
8.76
7.
67
15.8
1 70
.72
1281
.5
4.20
3
−25
764.
5 12
.54
4,52
9 1,
184
Sta
ndar
d 40
2.4
0.65
11
.64
11.7
6 15
.95
94.9
6 28
3.35
23
.63
92.2
1 19
3.69
25
48
3.06
47
.48
260.
96
5449
.5
32.0
9 69
08.2
2,
394
dev
iati
onM
inim
um
0 0
0 0
0 0
0 0
0 0
8.25
1
−6
−4,0
83
1 0.
1 34
3
Max
imum
7,
500
6 36
6.1
245.
1 17
4.98
11
43.4
21
08.6
53
0.51
16
80.2
20
98.6
21
450
38.4
77
7 3,
281
47,0
49
519
66,1
94
22,1
18
Not
e: C
orre
lati
ons
and
desc
ript
ive
stat
isti
cs f
or d
epen
dent
var
iabl
es a
re s
how
n as
cri
me
rate
s pe
r 10
0,00
0 po
pula
tion
.
21
Des
crip
tive
Sta
tist
ics
and
Zer
o O
rder
Cor
rela
tion
s, I
nd
epen
den
t V
aria
ble
s,
Con
trol
Var
iab
les,
an
d C
rim
e R
epor
t V
aria
ble
s
1.
2.
3.
4.
5.
6.
7.
8.
9.
10
. 11
. 12
. 13
. 14
. 15
. 16
. 17
. 18
.
1.
Sla
ught
erho
use
1
em
ploy
men
t2.
S
laug
hter
hous
e .3
38
1
esta
blis
hmen
ts3.
In
dex
.095
.1
32
1
re
port
s4.
M
urde
r −.
004
−.02
2 .1
97
1
5.
Rap
e .0
86
.082
.5
44
.135
1
6.
Rob
bery
.0
31
.028
.5
95
.219
.3
50
1
7.
Ass
ault
.0
10
.017
.6
79
.220
.4
06
.511
1
8.
Bur
glar
y .0
32
.059
.8
47
.226
.4
67
.590
.6
01
1
9.
Mot
or
.076
.1
17
.780
.1
80
.438
.4
94
.532
.6
72
1
ve
hicl
e th
eft
10.
Ars
on
.009
.0
29
.378
.1
11
.264
.1
86
.293
.3
55
.344
1
11
. N
umbe
r .0
80
.133
.5
26
.144
.3
26
.580
.3
85
.498
.4
55
.169
1
in p
over
ty12
. U
nem
ploy
men
t −.
062
−.12
0 .1
33
.136
.0
67
.240
.2
48
.210
.1
03
.044
.3
44
1
rate
13.
Imm
igra
tion
.5
13
.188
.2
83
.026
.1
80
.173
.1
50
.204
.2
61
.071
.3
66
.163
1
14.
Mig
rati
on
−.17
6 −.
080
−.07
4 −.
006
−.10
1 −.
116
−.01
6 −.
039
−.03
1 −.
038
−.13
9 −.
071
−.19
8 1
15
. N
on-W
hite
.1
13
.058
.4
43
.162
.2
737
.618
.3
50
.443
.3
71
.114
.8
22
.426
.4
77
−.23
1 1
or H
ispa
nic
re
side
nts
16.
Pop
ulat
ion
.080
.0
54
.416
.0
82
.258
.4
01
.294
.3
18
.355
.1
443
.548
.1
71
.169
.0
07
.425
1
de
nsit
y17
. N
umbe
r .1
68
.213
.5
62
.081
.3
46
.492
.3
41
.455
.4
75
.171
.8
80
.173
.4
39
−.11
9 .7
00
.597
1
of m
ales
18.
Mal
es a
ged
.187
.1
95
.517
.0
73
.320
.4
57
.316
.4
138
.425
.1
47
.849
.1
87
.510
−.
176
.727
.5
52
.959
1
15
to 3
4 ye
ars
Mea
n 64
.26
0.37
18
27.9
3.
25
14
15.7
43
142.
1 42
9.53
87
.83
11.8
3 22
39.9
9 5.
02
15.9
5 −3
3.84
30
77.2
5 22
.2
6816
.09
1988
.33
Med
ian
0 0
1523
.5
0 0
0 83
.20
367.
60
70.1
9 0
1281
.50
4.20
3
−25
764.
5 12
.54
4,52
9 1,
184
Sta
ndar
d de
viat
ion
402.
36
0.65
16
11.9
8.
82
20.8
8 31
.55
181.
13
390.
19
88.1
6 22
.51
2548
.04
3.06
47
.48
260.
96
5449
.53
32.0
9 69
08.2
1 23
94.0
4M
inim
um
0 0
0 0
0 0
0 0
0 0
8.25
1
−6
−4,0
83
1 0.
1 34
3
Max
imum
7,
500
6 96
30.4
17
3.71
24
5.1
405.
34
2808
.7
3076
.9
697.
67
528.
17
21,4
50
38.4
77
7 3,
281
47,0
49
519
66,1
94
22,1
18
Not
e: C
orre
lati
ons
and
desc
ript
ive
stat
isti
cs f
or d
epen
dent
var
iabl
es a
re s
how
n as
cri
me
rate
s pe
r 10
0,00
0 po
pula
tion
.
22 Organization & environment
Notes
1. Similar contradictions have been noted in examinations of vivisection (see Adams, 2000; Balcombe, 2000; Dunayer, 2000; Fox, 2000). Animals are used in experiments precisely because they share many charac-teristics and qualities with humans, and all the while linguistic devices are employed to distance the experi-menters from their subjects.
2. Boomtown communities are characterized by the following features: They experience unprecedented population growth within a short amount of time; relatedly, they experience expanded employment opportuni-ties; and they also experience heavy demands on social services (Camasso & Wilkinson 1990).
3. The use of the term spillover here derives from the cultural spillover of violence theory developed by Larry Baron and Murray Straus (1987, 1988; Baron, Straus, & Jaffe 1988). The central tenet of this theory is that
The more a society tends to endorse the use of physical force to attain socially approved ends—such as order in the schools, crime control, and military dominance--the greater the likelihood that this legitima-tion of force will be generalized to other spheres in life, such as the family and relations between the sexes, where force is less approved socially. (Baron et al., 1988, p. 80)
Although the authors did not specifically discuss the slaughter of animals as part of this process, we argue here that it is a possibility.
4. In these states, employees cannot be required to join or pay dues to a union and may resign from the union at any time, but still enjoy the benefits of the collective agreement. The following are the right-to-work states included in the analyses in this study: Alabama, Arizona, Arkansas, georgia, Idaho, Iowa, Kansas, Louisiana, Mississippi, Nebraska, Nevada, North Carolina, North Dakota, Oklahoma, South Carolina, South Dakota, Tennessee, Texas, Utah, Virginia, and Wyoming.
5. This time period is used because due to reporting changes in the Uniform Crime Report data, data prior to 1994 are not comparable with data from later years, and at the time of the study some of the demographic variables were not yet available at the county level for 2003 and later.
6. In 1998, the classification of industries changed from the Standard Industrial Classification (SIC) system to the North American Industry Classification System (NAICS), and only some industries remain comparable across the time period.
7. The arrest variables used include the following: Total arrests, Violent offenses, Murder, Rape, Offenses against the family, Sex offenses, Assault, Robbery, Burglary, Forgery, Possessing stolen property, Vandalism, Other assaults, and Disorderly conduct. The report variables used include: Index offenses, Murder, Rape, Assault, Robbery, Burglary, Motor vehicle theft, and Arson.
8. The factor loadings are all above the commonly accepted minimum values of 0.3 to 0.4 and the Chronbach’s alpha for the scale is .6728.
9. Again, all of the loadings for these variables were above the acceptable range and Chronbach’s alpha was .6062.
10. As is commonly done in panel studies, in the analyses here the Slaughterhouse employment variable and the comparison industry variables were lagged 1 year because their impact on crime would likely not be felt in the same year in these counties. More likely, the impact would be felt the following year (especially in cases where the industry opened or expanded late in the year).
11. The variables analyzed include the following: Total number of arrests, Arrests for violent crimes, Arrests for murder, Arrests for rape, Arrests for offenses against the family, Arrests for sex offenses (excluding rape), Arrests for aggravated assault, Total reports for index offenses, Reports of murder, Reports of rape, and Reports of assault.
12. Negative binomial regression requires that an exposure variable be identified to differentiate across cases differences in the possibility of being “exposed” to the effect. Long and Freese (2006) use the example of time as an exposure variable. In this study, however, it is not time that differentiates the likelihood of crime in the counties but the differences across counties in population (a larger number of people makes the possibility of offending or being victimized greater). Therefore, we set county population as the exposure variable. Including the exposure variable adds the natural log of the size of the population at risk to the model. Thus, in essence, the model analyzes per capita rates of crime instead of merely counts of crime even though the dependent variable is
Fitzgerald et al. / Slaughterhouses and Increased Crime Rates 23
a count, not a rate. This is standard practice in the quantitative criminology literature (Osgood, 2000). Using the population as the exposure variable also permits an acknowledgement in the model that rates based on larger populations have greater precision, which addresses the issue of heterogeneity of variance, which is problem-atic in the use of OLS regression on count variables (Krivo & Peterson, 2004; Osgood, 2000)
13. The IRR values can be interpreted as the multiplicative factor by which a one unit change in the independ-ent variable affects the dependent variable, controlling for the other variables. Therefore, an IRR value below one indicates that the predictor variable (controlling for the other variables) decreases the incidence-rate, which demonstrates a negative effect. Accordingly, an IRR value above one indicates an increase in the incidence-rate, or a positive effect.
14. The change in classification to include small custom slaughterhouses in the slaughterhouse category may affect these analyses in two ways. If the years after the reclassification are included, due to the way the County Business Patterns categorizes the employee data (e.g., 1-19, 20-99) instead of reporting the exact number of employees, the inclusion of small custom slaughter facilities could artificially increase the number of slaughter-house workers in counties since the midpoint of the ranges are used in the analyses, therefore diluting the pos-sible effect of slaughterhouse employment. In addition, work at a custom slaughterhouse may be episodic, involving the slaughter of a relatively small number of animals in any given time period rather than the routinized slaughter of the larger facilities. This means that workers may be less exposed to slaughter. If the years after the reclassification are excluded, then these problems are avoided but the sample size is reduced from 4,646 to 1,743, reducing the power of the analysis. Although this seems like a large sample, given the highly stochastic nature of crime in rural communities, substantial power is required to see significant effects. Unfortunately, there is no way to disaggregate the slaughterhouse data and exclude these facilities from the analysis.
15. It is also possible that if violent offenses committed by family members were included in the offenses against the family category that the effect of slaughterhouse employment on offenses against the family would have been positive and significant (instead of positive but not significant for the period prior to the inclusion of custom slaughter facilities).
16. This study should not, however, be considered the definitive testing of these theories, or predictive models of crime in general. Different operationalizations of the theories might have resulted in slightly different findings. Further, The R2 values of the models are low; however, the purpose of this research was to control for the variables implicated in the theorized causes in the literature to assess the effects of slaughterhouse employ-ment. It is also worth noting that there is some degree of multicolinearity among the variables. Specifically, the total number of males, number of young males, and the number of people in poverty have variance inflation factor (VIF) values greater than 4 (the values are 19.25, 15.64, and 8.01, respectively). Because this colinearity is entirely among control variables, it has no important effect on the estimates of the effects of slaughterhouse employment (the VIF value of the lagged slaughterhouse employment variable is 1.47).
References
Adams, C. (1991). The sexual politics of meat: A feminist-vegetarian critical theory. New York: Continuum.Adams, C. J. (2000). A feeling for the language: Comments on Dunayer’s “In the Name of Science.”
Organization and Environment, 13, 453-459.Allen, L. C. (2000). The influence of military training and combat experience on domestic violence. In P. Mercier
& J. Mercier (eds.), Battle cries on the homefront: Violence in the military family (pp. 81-103). Springfield, IL: Charles C. Thomas.
Arluke, A., & Sanders, C. R. (1996). Regarding animals. Philadelphia: Temple University Press.Bacon, D. (1999). ethnic cleansing hits immigrant workers, organizers, in Midwest meatpacking: INS declares
war on labor. The Nation, 268, 18-23.Balcombe, J. (2000). Verbal vivisection: Comments on Dunayer’s “In the Name of Science.” Organization and
Environment, 13, 460-462.Baron, L., & Straus, M. A. (1987). Four theories of rape: A macrosociological analysis. Social Problems, 34,
467-489.Baron, L., & Straus, M. A. (1988). Cultural and economic sources of homicide in the United States. Sociological
Quarterly, 29, 371-390.
24 Organization & environment
Baron, L., Straus, M. A., & Jaffe, D. (1988). Legitimate violence, violent attitudes, and rape: A test of the cul-tural spillover theory. Annals of the New York Academy of Sciences, 528, 79-110.
Beirne, P. (1999). For a nonspeciesist criminology: Animal abuse as an object of study. Criminology, 37, 117-147.Beirne, P. (2002). Criminology and animal studies: A sociological view. Society and Animals, 10, 382-386.Beirne, P. (2004). From animal abuse to interhuman violence? A critical review of the progression thesis.
Society and Animals, 12, 39-65.Beirne, P. (2007). Animal rights, animal abuse, and green criminology. In P. Beirne & N. South (eds.), Issues
in green criminology: Confronting harms against environments, humanity, and other animals (pp. 55-83). Portland, OR: Willan.
Beirne, P., & South, N. (2007). Approaching green criminology. In P. Beirne & N. South (eds.), Issues in green criminology: Confronting harms against environments, humanity, and other animals (pp. xiii-xxii). Portland, OR: Willan.
Berry, e. H., Krannich, R. S., & greider, T. (1990). A longitudinal analysis of neighboring in rapidly changing rural places. Journal of Rural Studies, 6, 175-186.
Black, R. (1982). Stress and the correctional officer. Police Stress, 5, 10-16.Broadway, M. (2007). Meatpacking and the transformation of rural communities: A comparison of Brooks,
Alberta and garden City, Kansas. Rural Sociology, 72, 560-582.Broadway, M., & Stull, D. D. (2006). Meat processing and garden City, KS: Boom and bust. Journal of Rural
Studies, 22, 55-66.Broadway, M. J. (1990). Meatpacking and its social and economic consequences for garden City, Kansas in the
1980s. Urban Anthropology, 19, 321-344.Broadway, M. J. (1994). What happens when the meatpackers come to town? Small Town, 24, 24-28.Broadway, M. J. (2000). Planning for change in small towns or trying to avoid the slaughterhouse blues.
Journal of Rural Studies, 16, 37-46.Broadway, M. J. (2001). Bad to the bone: The social costs of beef-packing’s move to rural Alberta. In R. epp
& D. Whitson (eds.), Writing off the rural West: Globalization, governments, and the transformation of rural communities (pp. 39-51). edmonton, Canada: University of Alberta Press.
Bureau of Labor Statistics, U.S. Department of Labor. (2004a). Table SNR01: Highest incidence rates of total nonfatal occupational injury and illness cases, private industry, 2003 (Vol. 2005). Washington, DC: Author.
Bureau of Labor Statistics, U.S. Department of Labor. (2004b). Table SNR06: Highest incidence rates of total nonfatal occupational injury cases, private industry, 2003 (Vol. 2005). Washington, DC: Author.
Camasso, M. J., & Wilkinson, K. P. (1990). Severe child maltreatment in ecological perspective: The case of the western energy boom. Journal of Social Service Research, 13, 1-18.
Cantor, D., & Land, K. C. (1985). Unemployment and crime rates in post-World War II United States: A theo-retical and empirical analysis. American Sociological Review, 50, 317-332.
Cazaux, g. (1999). Beauty and the beast: Animal abuse from a nonspeciesist criminological perspective. Crime, Law and Social Change, 31, 105-126.
Cochran, J. K., & Chamlin, M. (2000). Deterence and brutalization: The dual effects of executions. Justice Quarterly, 17, 685-706.
Cochran, J. K., Chamlin, M., & Seth, M. (1994). Deterence or brutalization? An impact assessment of Oklahoma’s return to capital punishment. Criminology, 32, 107-134.
Cortes, K. (2005). Do immigrants benefit from an increase in the minimum wage rate? An analysis by immi-grant industry concentration (Vol. 2005). Berkeley: University of California Press.
Dalla, R. L., ellis, A., & Cramer, S. C. (2005). Immigration and rural America: Latinos’ perceptions of work and residence in three meatpacking communities. Community, Work & Family, 8, 163-185.
Dunayer, J. (2000). In the name of science: The language of vivisection. Organization and Environment, 13, 432-452.
eisnitz, g. (1997). Slaughterhouse: The shocking story of greed, neglect, and inhumane treatment inside the U.S. meat industry. New York: Prometheus.
Fink, D. (1998). Cutting into the meatpacking line: Workers and change in the rural Midwest. Chapel Hill: University of North Carolina Press.
Fitzgerald, A. (2005). Animal abuse and family violence: Researching the interrelationships of abusive power. Lewiston, NY: edwin Mellen Press.
Fitzgerald et al. / Slaughterhouses and Increased Crime Rates 25
Fitzgerald, A. (2007). “They gave me a reason to live”: The protective effects of companion animals on the suicidality of abused women. Humanity and Society, 31, 355-378.
Flynn, C. (2000a). Battered women and their animal companions: Symbolic interaction between human and non-human animals. Society and Animals, 8, 99-127.
Flynn, C. (2000b). Woman’s best friend: Pet abuse and the role of companion animals in the lives of battered women. Violence Against Women, 6, 162-177.
Fox, M. A. (2000). The case against animal experimentation: Comments on Dunayer’s “In the Name of Science.” Organization and Environment, 13, 463-467.
Freudenberg, W. R. (1981). Women and men in an energy boomtown: Adjustment, alienation and adaptation. Rural Sociology, 46, 220-244.
Freudenberg, W. R. (1984). Boomtown’s youth: Differential impacts of rapid community growth upon adoles-cents and adults. American Sociological Review, 49, 697-705.
Freudenberg, W. R. (1986). The density of acquaintanceship: An overlooked variable in community research? American Journal of Sociology, 92, 27-63.
Freudenberg, W. R., & Jones, R. e. (1991). Criminal behavior and rapid community growth: examining the evidence. Rural Sociology, 56, 619-645.
gaines, J., & Jermier, J. M. (2000). Animal inequality and organizations: Introduction. Organization and Environment, 13, 426-428.
gold, R. L. (1982). Commentary. Pacific Sociological Review, 25, 349-356.grandin, T. (1988). Commentary: Behavior of slaughter plant and auction employees toward the animals.
Anthrozoos, 1, 205-213.grey, M. (1995). Pork, poultry and newcomers in Storm Lake, Iowa. In D. D. Stull & M. J. Broadway (eds.),
Any way you cut it: Meat processing and small-town America (pp. 109-127). Lawrence: University Press of Kansas.
grey, M. A. (1998a). Handbook for creating sustainable multiethnic food-producing communities. Ames: Iowa State University extension.
grey, M. A. (1998b). Meatpacking in Storm Lake, Iowa: A community in transition. In K. M. Thu & e. P. Durrenberger (eds.), Pigs, profits, and rural communities (pp. 57-72). Albany: State University of New York Press.
Halaby, C. N. (2004). Panel models in sociological research: Theory into practice. Annual Review of Sociology, 30, 507-544.
Horowitz, R., & Miller, M. J. (1999). Immigrants in the Delmarva poultry processing industry: The changing face of Georgetown, Delaware, and Environs. east Lansing: Julian Samora Research Institute, Michigan State University.
Hunter, L. M., Krannich, R. S., & Smith, M. D. (2002). Rural migration, rapid growth, and fear of crime. Rural Sociology, 67, 71-89.
Irvine, L. (2004). If you tame me: Understanding our connection with animals. Philadelphia: Temple University Press.
Jerolmack, C. (2007). Animal practices, ethnicity, and community: The Turkish pigeon handlers of Berlin. American Sociological Review, 72, 874-894.
Jerolmack, C. (2008). How pigeons became rats: The cultural-spatial logic of problem animals. Social Problems, 55, 72-94.
Kalof, L. (2007). Looking at animals in human history. London: Reaktion Books.Kauffman, K. (1988). Prison officers and their world. Cambridge, MA: Harvard University Press.Kawachi, I., Kennedy, B. P., & Wilkinson, R. g. (1999). Crime: Social disorganization and relative depravation.
Social Science and Medicine, 48, 719-731.King, D. (1978). The brutalization effect: execution publicity and the incidence of homicide in South Carolina.
Social Forces, 57, 683-687.Krannich, R. S., Berry, e. H., & greider, T. (1989). Fear of crime in rapidly changing rural communities:
A longitudinal analysis. Rural Sociology, 54, 195-212.Krivo, L. J., & Peterson, R. D. (2004). Labor market conditions and violence crime among youths and adults.
Sociological Perspectives, 47, 485-505.Lee, M. R., & Ousey, g. C. (2001). Size matters: examining the link between small manufacturing, socioeconomic
deprivation, and crime rates in nonmetropolitan communities. Sociological Quarterly, 42, 581-602.
26 Organization & environment
Lee, M. T., Martinez, R., & Rosenfield, R. (2001). Does immigration increase homicide? Negative evidence from three border cities. Sociological Quarterly, 42, 559-580.
Long, J. S., & Freese, J. (2006). Regression models for categorical dependent variables using Stata. College Station, TX: Stata Press.
Long, S. J. (1997). Regression models for categorical and limited dependent variables. Thousand Oaks, CA: Sage.
Lynch, M. (1990). The greening of criminology. Critical Criminologist, 2, 1-5.Markus, e. (2005). Meat market: Animals, ethics, and money. Boston: Brio Press.Marshall, A. D., Panuzio, J., & Taft, C. T. (2005). Intimate partner violence among military veterans and active
duty servicemen. Clinical Psychology Review, 25, 862-876.Marshall, D., & McShane, M. (2000). First to fight: Domestic violence and the subculture of the Marine Corps.
In P. Mercier & J. Mercier (eds.), Battle cries on the homefront: Violence in the military family (pp. 15-29). Springfield, IL: Charles C. Thomas.
Martin, P., Taylor, J. e., & Fix, M. (1996). Immigration and the changing face of rural America: Focus on the Midwestern states (Occasional Paper No. 21). east Lansing, MI: Julian Samora Research Institute.
Mercier, P. J. (2000). Violence in the military family. In P. Mercier & J. Mercier (eds.), Battle cries on the homefront: Violence in the military family (pp. 3-11). Springfield, IL: Charles C. Thomas.
Miles-Doan, R. (1998). Violence between spouses and intimates: Does neighborhood context matter? Social Forces, 77, 623-645.
Nibert, D. (2002). Animal rights/human rights: entanglements of oppression and liberation. Lanham, MD: Rowman & Littlefield.
Osgood, D. W. (2000). Poisson-based regression analysis of aggregate crime rates. Journal of Quantitative Criminology, 16, 21-43.
Patterson, C. (2002). Eternal Treblinka: Our treatment of animals and the Holocaust. New York: Lantern Books.
Pridemore, W. A. (2005). A cautionary note on using county-level crime and homicide data. Homicide Studies, 9, 256-268.
Rémy, C. (2003). Une mise à mort industrielle “humaine”? L’abattoir ou l’impossible objectivation des ani-maux. Politix, 16, 51-73.
Rosen, L. N., Kaminski, R. J., Parmley, A. M., Knudson, K. H., & Fancher, P. (2003). The effects of peer group climate on intimate partner violence among married male U.S. army soldiers. Violence Against Women, 9, 1045-1071.
Sampson, R. (1987). Urban black violence: The effect of male joblessness and family disruption. American Journal of Sociology, 93, 348-382.
Sampson, R., & groves, W. B. (1989). Community structure and crime: Testing social disorganization theory. American Journal of Sociology, 94, 774-802.
Schlosser, e. (2005). Fast food nation: The dark side of the all-American meal. New York: Houghton Mifflin. (Original work published 2001)
Sinclair, U. (1946). The Jungle. New York: Viking Press. (Original work published 1905)Smith, M. (2002). The “ethical” space of the abattoir: On the (in)human(e) slaughter of other animals. Human
Ecology Review, 9, 49-58.Smith, M. D., Krannich, R. S., & Hunter, L. M. (2001). growth, decline, stability, and disruption: A longitudi-
nal analysis of social well-being in four western rural communities. Rural Sociology, 66, 425-450.South, N., & Beirne, P. (2006). Introduction. In N. South & P. Beirne (eds.), Green criminology (pp. xiiv-xxvii).
Burlington, VT: Ashgate.Spiegel, M. (1996). The dreaded comparison: Race and animal slavery. Philadelphia: New Society.Stack, S. J., & Tsoudis, O. (1997). Suicide risk among correctional officers: A logistic regression analysis.
Archives of Suicide Research, 3, 183-186.Stull, D., & Broadway, M. (2004). Slaughterhouse blues: The meat and poultry industry in North America.
Toronto, Ontario, Canada: Wadsworth.Sykes, g. M. (1980). The defects of total power. In B. M. Crouch (ed.), The keepers: Prison guards and con-
temporary corrections (pp. 225-246). Springfield, IL: Thomas Books.U.S. Census Bureau, ePCD. (2006). County business patterns (Vol. 2006). Washington, DC: Author.
Fitzgerald et al. / Slaughterhouses and Increased Crime Rates 27
U.S. Department of Justice and Federal Bureau of Investigation. (2004). Uniform crime reporting handbook. Washington, DC: Author.
Wilkinson, K. P., Reynolds, R., Thompson, J. g., & Ostresh, L. M. (1984). Violent crime in the western energy development region. Sociological Perspectives, 27, 241-256.
Wilkinson, K. P., Thompson, L.M., Reynolds, R., & Ostresh, L. M. (1982). Local disruption and western energy development: A critical review. Pacific Sociological Review, 25, 275-296.
Winders, B., & Nibert, D. (2004). Consuming the surplus: expanding “meat” consumption and animal oppres-sion. International Journal of Sociology and Social Policy, 24, 76-96.
Wooldridge, J. M. (2002). Econometric analysis of cross section and panel data. Cambridge: MIT Press.Yang, B., & Lester, D. (2008). The deterrent effect of executions: A meta-analysis thirty years after ehrlich.
Journal of Criminal Justice, 36, 453-460.York, R. (2004). Humanity and inhumanity: Toward a sociology of the slaughterhouse. Organization and
Environment, 17, 260-265.
Amy J. Fitzgerald is an assistant professor in the Department of Sociology, Anthropology and Criminology at the University of Windsor in Ontario, Canada. Her research interests include examining the implications of animal slaughtering on communities, green criminology more generally, and gendered violence. Her recent publications include The Animals Reader: The Essential Classic and Contemporary Writings (2007) and Animal Abuse and Family Violence: Researching the Interrelationships of Abusive Power (2005).
Linda Kalof is a professor of sociology at Michigan State University. She studies the cultural representations of humans and other animals and the links between culture and nature. Her publications include Looking at Animals in Human History (2007), A Cultural History of Animals in Antiquity (2007), The Animals Reader: The Essential Classic and Contemporary Writings (2007) and The Earthscan Reader in Environmental Values (2005).
Thomas Dietz is a professor of sociology and crop and soil science, Director of the environmental Science and Policy Program, and Assistant Vice President for environmental Research at Michigan State University. His research interests include the anthropogenic drivers of environmental change, deliberation in environmental policy and the social psychology of environmental concern.