Embed Size (px)
Citation preview
Slapton Coastal Zone Management Main Study Volume 1: Phase 1 Report (I)
Prepared by Scott Wilson For Slapton Line Partnership
August 2006
DOCUMENT APPROVAL FORM
Document Title: Slapton Coastal Zone Management Main Study Volume 1: Phase 1 Report (I) Author: Scott Wilson, with University of Plymouth, Roger Tym and Partners and Dr Mark Lee. Amendments Record and Author Approvals: Version Date Description Prepared Reviewed Approved 1 July 2004 Draft Scott Wilson
University of Plymouth Atlantic Consultants Dr Mark Lee
Dr Damon O’Brien E Williams R Hein
D C Dales
2 October 2004 Scott Wilson University of Plymouth Atlantic Consultants Dr Mark Lee
Dr Damon O’Brien E Williams R Hein
D C Dales
3 October 2004 Revised with minor comments
Scott Wilson University of Plymouth Atlantic Consultants Dr Mark Lee
Dr Damon O’Brien E Williams R Hein
D C Dales
4 August 2006 Re-titled as Volume 1
Scott Wilson University of Plymouth Roger Tym and Partners Dr Mark Lee
Dr Damon O’Brien E Williams R Hein
D C Dales
Project D101963 This document has been prepared in accordance with the scope of Scott Wilson’s appointment with its client and is subject to the terms of that appointment. It is addressed to and for the sole use and reliance of Scott Wilson’s client. Scott Wilson accepts no liability for any use of this document other than by its client and only for the purposes, stated in the document, for which it was prepared and provided. No person other than the client may copy (in whole or in part) use or rely on the contents of this document, without the prior written permission of the Company Secretary of Scott Wilson Ltd. Any advice, opinions, or recommendations within this document should be read and relied upon only in the context of the document as a whole. The contents of this document are not to be construed as providing legal, business or tax advice or opinion. © Scott Wilson Group plc 2006 Scott Wilson Ltd. Scott House Basing View Basingstoke RG21 4JG [email protected] Tel: 01256 461161
Preface The Slapton Coastal Zone Management Study has been commissioned by the Slapton Line Partnership.
The Slapton Line Partnership is made up of the following organisations:
English Nature Devon County Council South Hams District Council Whitley Wildlife Conservation Trust Slapton Ley Field Centre Environment Agency Defra
The Partnership has been formed to decide how best to deal with potential future erosion of Slapton
Line and its effect on the road, the environment, and the community.
The objective of this study is to compile a single reference document that will form the basis for all future
decision-making that affects the shingle ridge.
Scott Wilson has undertaken the study in collaboration with the University of Plymouth, Roger Tym and
Partners and Dr Mark Lee.
The University of Plymouth provided material for the chapters on coastal processes and modelling,
Roger Tym and Partners focused on the socio-economic aspects of the study and Dr Mark Lee provided
specialist geomorphology information.
This report should be read in conjunction with Volumes 2,3 and 4. Volume 2 provides figures to
accompany Volume 1. Volume 3 is the Phase 2 Report and Volume 4 the overall Executive Summary.
Contents
Preface
1 Phase 1 Executive Summary 1-1
2 Introduction 2-1
3 Consultation 3-1
4 Ecology Baseline 4-1
5 Geomorphology Baseline 5-1
6 Archaeology and Cultural Heritage Baseline 6-1
7 Landscape Character and Visual Receptor Baseline 7-1
8 Socio-Economic Baseline 8-1
9 Transportation Baseline 9-1
10 Literature Review and Historical Change 10-1
11 Conceptual Beach Process Model 11-1
12 Option Development 12-1
13 Environmental Appraisal 13-1
14 Option Economic Appraisal 14-1
15 Option Appraisal 15-1
16 Funding Review 16-1
17 Conclusions 17-1
18 The Way Forward 18-1
Appendices A Futurecoast B Consultation Responses C SSSI Designation D References
Slapton Coastal Zone Management Main Study Volume 1: Phase 1 Report (I)
August 2006, Scott Wilson 11-
1 Phase 1 Executive Summary
1.1 This report presents the findings of the Phase 1 Report for the Slapton Coastal Zone
Management Main Study. This report has been prepared by Scott Wilson on behalf of the
Slapton Line Partnership. The terms of reference for the study were set out in detail in the brief
for the study.
1.2 This report forms part of the Slapton Coastal Zone Management Main Study. Phase 2 will
address refining the range of shoreline management options, and will result in selection of the
final preferred shoreline management option.
Aim 1.3 The aim of the Main Study is to provide a comprehensive evaluation of the issues relating to
coastal processes at Slapton Sands for the purposes of determining an appropriate shoreline
management response to the recent erosion and from this, to establish a robust long-term
coastal zone management strategy for the area. The objective of the Study is therefore to
compile a single reference document that will form the basis for all future decision making that
affects the shingle ridge.
Background 1.4 The A379 offers an important transport link between local communities, as well as providing a
secondary emergency route into Dartmouth. The principal emergency route is via the A381 and
A3122, narrow lanes offer the only other alternative, suitable for small vehicles only.
1.5 In previous years storms have caused significant damage to the shingle ridge, forcing road
closure. The winter of 2000/2001 was no exception; a series of storms caused the loss of 5m of
shingle beachhead over a length of 1000m. The erosion undermined a 200m section of the
A379 that runs along the shingle ridge. This resulted in closure of the road.
1.6 Following the damage to the Coast Road, the worst affected section was realigned. The
realignment extended over a length of about 200metres and moved the road approximately
20metres landwards. In addition some 12,000 tonnes of shingle were transported from the
Strete Gate area and deposited in front of the affected area at Slapton, with shingle ‘bastions’
formed at each end of the protected length. Since 2001 there has been an accretion of shingle
on the beach at the affected locations.
Slapton Coastal Zone Management Main Study Volume 1: Phase 1 Report (I)
August 2006, Scott Wilson 21-
Data Collection and Environmental Baseline 1.7 For the Phase 1 report a review was made of the data available. From the review it was
decided to undertake a programme of surveys to provide base data for the Study. The surveys
included:
• Topographic survey of the road and beach
• Hydrographic survey of the sea bed in the southern part of Start Bay and over Skerries Bank
• Sidescan sonar survey of the seabed
• Origin and destination traffic survey on the A379
1.8 In addition a programme of profile monitoring was started to supplement the monitoring already
undertaken by the Field Studies Centre, South Hams District Council and the Environment
Agency.
1.9 An environmental baseline was prepared, using a combination of previously published reports,
data held by key stakeholders, and observations from filed inspections. The Baseline was
addressed under the following headings:
Ecology
Geomorphology
Archaeology and Cultural Heritage
Landscape
Socio-Economics
Transportation
Coastal Processes and Geomorphology 1.10 A detailed study was also made of the coastal processes affecting the shingle barrier. The
study of coastal processes is in far greater detail than has previously been undertaken. This
study included:
An assessment of the wave climate, based on transformation inshore using a numerical wave
model of offshore data from the Meteorological Office
Analysis of water levels using data from Devonport
Analysis of wind data
Modelling of sediment transport along the beach and in the cross-shore direction
Slapton Coastal Zone Management Main Study Volume 1: Phase 1 Report (I)
August 2006, Scott Wilson 31-
Modelling of breach probability
Assessment of historical changes in beach position and rates of erosion
1.11 The key beach processes affecting Slapton Sands are:
Short-term storm impacts
Medium term longshore transport gradients
Long-term sea level rise causing the shingle barrier to rollback landwards
1.12 Each of these processes was studied. Short- and medium-term impacts are coastal process
issues, whereas long-term changes are best considered within a geomorphological framework.
1.13 The cross-shore profile predicted by Powell’s model, at the time and location of the road
collapse in January 2001, shows that the storm event was of a sufficient severity (wave height)
and occurred in conjunction with a sufficiently high still water level to impact on the crest of the
shingle ridge. The breach prediction model of Bradbury suggests that at the time of the road
collapse in January 2001, the loss of road was due to beach cut back not due to the mechanism
of over washing and roll back. The sensitivity tests showed that neither a sea level rise of
250mm, nor a reduction in barrier cross-sectional area of 30% would significantly increase the
chances of this mechanism becoming dominant.
1.14 The January 2001 erosion event can clearly be categorised as cut-back of the edge of the
shingle barrier as indicated on Figure 10.25 in Volume 2, and not as a breach of the barrier.
1.15 Examination of aerial photographs from 1999 shows that, compared to adjacent areas, the face
of the shingle ridge was further seawards at the central car park and at the location where the
road was undermined. Therefore these areas had steeper beaches and were at higher risk of
greater erosion than other areas.
1.16 Large changes in beach areas and shoreline position occur over medium term time scales
(weeks, months). The observed trends in the amount of beach volume above the mid and high
water lines have been of gradual increase to the north of Strete Gate, decrease at the road
collapse location and more gradual decrease at Torcross. However, these trends are based on
a data set which is probably statistically unreliable.
1.17 Longshore transport rates have been calculated based on a new and comprehensive analysis of
4 year’s data, which includes the effect of varying water levels and thus the influence of the
Skerries Bank on the waves and sediment movements. The results show that high rates of net
annual sediment transport do occur (of the order of 150,000 m3 per annum), but that the rate
and direction varies from year to year and with location along the frontage. Averaged over the 4-
Slapton Coastal Zone Management Main Study Volume 1: Phase 1 Report (I)
August 2006, Scott Wilson 41-
year period, the net transport rates are lower (about 75,000 m3), indicating landward retreat at
Torcross and accretion at Strete Gate over this period. Given that a 4-year record is short
compared to the expected natural variability of climate over decadal time scales, these results
should not be extrapolated to decadal time scales.
1.18 Results from a numerical model demonstrate that quite large changes in the shoreline position
(of the order of 5 to 10m) can occur in medium term periods (weeks, months). Model results
show that at the time of the road collapse in January 2001, the shoreline position around the
location of the collapsed road had receded by about 4m from 1st October 2000 to 10th January
2001.
1.19 At the time of the road collapse event in January 2001, the beach volumes above mid and high
water levels at the location were at the lowest recorded value in the 31-year record.
1.20 The storm was an unusual combination of moderately high water levels at Spring tide and a
sustained period of high waves from the east. Based on analysis of wind speeds, wind direction,
and storm duration from a data set from 1980 to 2004, it is estimated that the storm had a return
period of approximately 25 years. The storm of 1995, which was notable but did not cause such
extensive damage, was identified by the same analysis of wind data as being the second most
severe storm in the 24-year period.
1.21 The overall assessment of the January 2001 event is that it was caused by a combination of
beach line recession due to differential longshore transport rates in the preceding autumn and
the occurrence of a severe storm, which further cut back the beach profile, with the beach crest
reaching road level.
1.22 Because the storm coincided with a period when the beach was at a historically narrow state, its
observed effect on infrastructure (road, car park) was greater than it may have otherwise have
been.
1.23 Figure 11.51 (Volume 2) shows areas at risk at any time from a single storm event. Using the
2001 storm event, when 5m width of shingle ridge was eroded, it is assumed that a similar event
of 1 in 25 year return period would have a similar erosion impact. Therefore a 5m setback from
the vegetated crest line has generally been drawn. However, the extent of erosion expected to
occur at any particular point along the beach is a function of two other main variables: beach
steepness (the steeper the beach, the more likely is erosion of the crest); and the presence of
defences (these inhibit erosion of the crest). The steepest beaches occur in the central area
near the car park and previous road realignment.
1.24 The figure shows that the main areas at risk are (south to north):
The length of road immediately north of the rock revetment, including the length where the
rock revetment is badly degraded
Slapton Coastal Zone Management Main Study Volume 1: Phase 1 Report (I)
August 2006, Scott Wilson 51-
The central car park
The two road sections north of the car park where the new road alignment joins the original
road alignment
1.25 Long-term barrier retreat rates have been estimated, based on a conceptual model of the long-
term evolution of the Slapton Sands coastline, and a numerical formulation relating sea level
rise to barrier retreat rate. The retreat rates calculated are not precise, and for the present day
are somewhat higher than observed sustained retreat rates.
1.26 Mean sea level is predicted to be at least 20 cm higher by 2080 (low emission scenario) and
may be as high as 80 cm above present level (high emission scenario). The most conservative
estimate indicates that water levels that today occur once every 7-8 years are expected to
occur, by 2080, about 3 times per year.
1.27 The historical data analysis suggests that in overall terms the Slapton Sands shingle ridge has
been largely stable over the last century, but with some net beach accretion at Strete gate and
recession at Torcross. Long-term net erosion rates for the crest of the barrier are low, with a
best estimate over 100 years of 0.1m/year for the centre of the Bay. Analysis of a number of
maps and photographs for different periods of time between 1890 and the present day all
indicate little overall movement of the crest. However, over shorter time periods rates of 0.4-
0.6m have been found.
1.28 The geomorphologically based estimates for long-term barrier retreat give values of 0.3m/year
at the present day, increasing to at least 0.4m/year due to sea level rise.
1.29 The maps shown as Figures 11.52(a-g)(Volume 2), show areas at risk within different time
epochs along the shingle bank. In accordance with guidance for Shoreline Management Plans,
three epochs have been used: 0-20 years, 20-50 years and 50-100 years. The retreat rates
used in preparing these maps are those of a ‘Low Emission Scenario’ and are applicable to the
next 100 years.
1.30 The rates used in the Low Emission Scenario are derived from the geomorphology-based
retreat rates from the low emission scenario for climate change and sea level rise up to year
100. The geomorphology-based projection suggests more rapid rate in years 50-100, of the
order of a further 30m.
1.31 In the geomorphology-based projections for the high emission scenario both sea level rise and
retreat rates over years 50-100 are predicted to accelerate rapidly and are higher still. These are
displayed on Figures 11.53 (a-g) (Volume 2).
1.32 In using the maps the following should be noted:
Slapton Coastal Zone Management Main Study Volume 1: Phase 1 Report (I)
August 2006, Scott Wilson 61-
The projections are indicative, with a considerable degree of uncertainty, despite any
appearance of precision.
The retreat rates used (even for the lower emission scenario) are higher than the long-term
historical change, which has actually occurred. Therefore the low emission scenario
mapping should be regarded as a mid-range projection, rather than a lower-bound
projection.
Erosion may occur landward of the ‘At Risk’ areas in particularly severe events.
If the high emission scenario becomes reality, or indeed if any scenario occurs other than
the low emission scenario, then the ‘At Risk’ areas will rapidly project landwards after year
100.
The projections are long-term averages, and will only occur if a given period of time has the
expected number of severe storm events. It is the severe storm events, which drive retreat
of the barrier.
The maps show the projected line of the barrier crest as a continuous smooth line.
However, this should not be interpreted as indicating that the whole length of the crest will
necessarily follow this alignment. Rather, it indicates how far landward the crest might be
at any point along the beach.
1.33 It has been postulated by various authors that the shingle bank is likely to break down
irreversibly and breach, forming tidal inlets, within the next 30 to 50 years. This is considered to
be highly unlikely. Neither of the storm events that have occurred in the last 10 years, has had
a major impact on the shingle barrier height or width, nor has come close to causing a breach of
the barrier. The current probability for a breach is considered to be much less than 1 in 100
years.
1.34 Sea level rise and increased storminess will increase the rate of erosion and the risk of a major
recession event, but the risk of a breach of the shingle bank will remain low over the next 20 or
50 years.
1.35 Possibly after 50 years, and probably beyond 100 years, a No Intervention scenario will result in
breakdown of the shingle barrier, with breaching and forming of intermittent tidal inlets.
1.36 Retreat of the shingle barrier will eventually result in lowered beaches in front of Torcross, and
leave the northern part of Torcross exposed to wave attack. Protection of Torcross will require
an extension of the sea wall to link up with the retreated barrier location.
Option Development and Evaluation 1.37 The following broad scale options were considered for this study:
Slapton Coastal Zone Management Main Study Volume 1: Phase 1 Report (I)
August 2006, Scott Wilson 71-
Do nothing (also described as ‘No Active Intervention’)
Do minimum (keep the coast road for a limited period)
Hold the line (keep the coast road)
Advance the line
Managed realignment of the coast road
1.38 At the Strategic level, advance the line was discarded as it offered no advantages and would be
excessively costly. All other options were considered further. The hold the line option would
involve a commitment to maintain the road on the shingle barrier, either by realignment to
accommodate erosion or by provision of defences.
1.39 A number of options for keeping the coast road were considered:
Beach nourishment
Beach recycling
Revetment
Sheet piled retaining wall
1.40 Three options for realignment were considered. One option would be to keep the road on the
Slapton Line but relocate it further back, thereby increasing the distance between the beach and
the road. This could be done in stages to spread out the cost and to deal with the most
vulnerable sections first. In the long term the beach is likely to eventually erode entirely, leading
to a breach of the barrier beach and hence the road. This option, which could be either a
reactive or a proactive realignment, has been evaluated and found to be feasible and to have
the minimum cost of any option.
1.41 One alternative option would be to relocate the route inland of the Ley, using the existing road
network wherever possible and upgrading over time as and when finances allowed. The most
radical solution would be to build an entirely new road to the west of the Ley although even if the
latter option was technically and environmentally viable it would probably be prohibitively
expensive.
1.42 A third option would be to abandon the use of the coast road, and make limited upgrades to the
existing inland road network. The upgraded road would remain single carriageway and would
be unsuitable for heavy vehicles.
1.43 A preliminary assessment has been made of eligibility for funding from DEFRA as a coast
protection project. The assessment of the economics of each option was undertaken in
Slapton Coastal Zone Management Main Study Volume 1: Phase 1 Report (I)
August 2006, Scott Wilson 81-
accordance with the methodology of DEFRA for coastal defence projects. The assessment was
a preliminary exercise, using only outline traffic data and excluding environmental and socio-
economic costs and benefits.
1.44 Based on these figures, the proactive or reactive Managed Realignment on the barrier option
would be the preferred option, and such a scheme would meet the benefit-cost and priority
scoring requirements of DEFRA within the next 5 years. All other options would fail to meet the
criteria.
1.45 It was estimated that a technically viable scheme to hold the road for 50 years, and protect
Torcross for 100 years, would have a cost in the order of £4.5m over the 50-year period at
present day prices.
1.46 Since this work was undertaken DEFRA have advised that although it might meet their
economic criteria, they would probably not fund the road protection part of the option, as their
primary function is protection of people, property and environment. Therefore the cost would
have to be borne by the members of the Slapton Line Partnership or through funding from other
sources. Initial comments from Devon County Council suggest that DfT funding is likely to be
concentrated on major urban area schemes of regional priority, and that sustaining the coast
road is unlikely to be seen as a priority highway project, and therefore opportunity for funding is
likely to be very limited or unavailable. It is likely that DEFRA funding would be available for the
works required to protect Torcross, as the shingle barrier retreats, however DEFRA currently
provide only a 35% grant aid contribution.
1.47 At this stage investigations have not been made into availability of other sources of funding.
However the scoping study refers to alternative funding opportunities. More work is required
into this, once the Phase 2 approach has been finalised. However, it is critical that the
Partnership comes to a decision in principle on the level of funding that it will be able to provide,
since it is unlikely that other sources will provide the entire level of funding required to keep the
road.
1.48 An outline environmental assessment has been made of the impact of all eight options
identified. The evaluation method used for environmental impact is an abbreviated version of
the TAG methodology using four environmental criteria (ecology, geomorphology, landscape,
heritage and archaeology) and two socio-economic criteria (social & community issues and
business impacts). A business questionnaire has been issued in order to quantify impacts of
the options on local business both qualitatively and quantitatively. However, returns were not
available at the time of preparation of this report.
1.49 The key impacts of the no intervention option are in the socio-economic and traffic areas. Main
socio-economic impacts are provisionally:
Slapton Coastal Zone Management Main Study Volume 1: Phase 1 Report (I)
August 2006, Scott Wilson 91-
Intermittent breaching of A379 will cause diversions and disruption to access/accessibility
of services. Examples of these disruptions include bus services, travel to work times,
emergency service access.
Longer term loss of road and necessary use of other roads may increase drive times to
services/facilities e.g. schools, workplace, doctors etc
Use of minor roads may cause difficulties for larger vehicles – buses, vans, and lorries.
Lack of planned approach to change and consequential disruption to traffic movements will
lead to confusion and difficulties for residents and service providers e.g. bus companies.
The perception of Slapton and Torcross as more isolated communities will increase i.e. not
on main road link between Kingsbridge and Dartmouth. This may be significant.
Unplanned nature of road diversions will be difficult for businesses to manage. May affect
trade especially for businesses reliant on passing trade e.g. B&B’s and village stores.
Ultimate loss of main road link will increase the ‘isolation’ of the villages – may lead to
reduction in trade. Loss of trade may be as a result of reduced passing trade – may be
experienced by B&B’s, local stores, Ley (visitor attraction). Also may be as a result of
increasing access difficulties – problems with supply chains to/from local businesses.
Dependant on the importance of the Ley in its freshwater state to tourists, there may be a
reduction in visitor numbers.
Some of these adverse impacts may be mitigated by strategic restructuring of the way in which
community services are organised and will be delivered.
1.50 There is also the potential for positive impacts to be associated with the severance of the road.
It is possible that some specialist businesses, e.g. recreational pursuits & natural history related,
may actually benefit from the closure if it is perceived by some visitors that the area has been
enhanced by the closure. The creation of new wildlife environments will attract specialist
interest, and may be of interest to a more general market if actively marketed and interpreted.
Any positive benefits are likely to be realised in the longer term and may require some initial
capital investment in a "replacement" tourist infrastructure (e.g. new visitor centres).
Furthermore, if the changes to the road structure inland include suitable parking and walking
trail development then it may be possible to add to leisure and tourism use of the countryside in
the area. If this work takes in existing local businesses then some economic benefits can be
gained.
1.51 An origins and destinations traffic survey was undertaken during July 2004, and combined with
traffic data obtained previously showed that whilst the route between Kingsbridge and
Slapton Coastal Zone Management Main Study Volume 1: Phase 1 Report (I)
August 2006, Scott Wilson 101-
Dartmouth via Slapton Ley is not required for all through traffic it does perform an important
local movement function and helps maintain the livelihood of businesses reliant on passing
trade.
1.52 The No Intervention option will therefore generate significant adverse impacts in the socio-
economic and transport contexts. The assessment of ecological, geo-morphological, landscape
and archaeological impacts for the no intervention option is however more balanced.
1.53 An integrated approach to assessing the options has been developed which combines the
technical, environmental and socio-economic aspects. A scoring system was developed which
gives potential scores across a range of issues, and then determines an actual score for each
option. The higher the score, the more acceptable the solution.
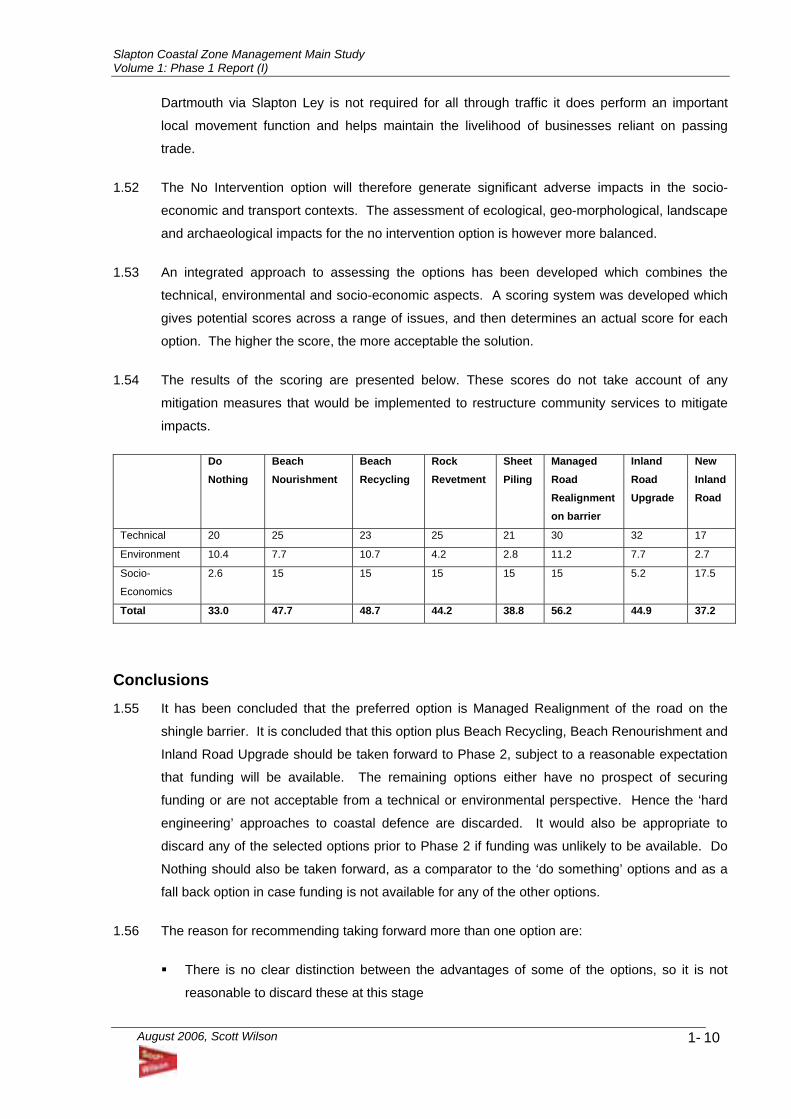
1.54 The results of the scoring are presented below. These scores do not take account of any
mitigation measures that would be implemented to restructure community services to mitigate
impacts.
Do Nothing
Beach Nourishment
Beach Recycling
Rock Revetment
Sheet Piling
Managed Road Realignment on barrier
Inland Road Upgrade
New Inland Road
Technical 20 25 23 25 21 30 32 17
Environment 10.4 7.7 10.7 4.2 2.8 11.2 7.7 2.7
Socio-
Economics
2.6 15 15 15 15 15 5.2 17.5
Total 33.0 47.7 48.7 44.2 38.8 56.2 44.9 37.2
Conclusions 1.55 It has been concluded that the preferred option is Managed Realignment of the road on the
shingle barrier. It is concluded that this option plus Beach Recycling, Beach Renourishment and
Inland Road Upgrade should be taken forward to Phase 2, subject to a reasonable expectation
that funding will be available. The remaining options either have no prospect of securing
funding or are not acceptable from a technical or environmental perspective. Hence the ‘hard
engineering’ approaches to coastal defence are discarded. It would also be appropriate to
discard any of the selected options prior to Phase 2 if funding was unlikely to be available. Do
Nothing should also be taken forward, as a comparator to the ‘do something’ options and as a
fall back option in case funding is not available for any of the other options.
1.56 The reason for recommending taking forward more than one option are:
There is no clear distinction between the advantages of some of the options, so it is not
reasonable to discard these at this stage
Slapton Coastal Zone Management Main Study Volume 1: Phase 1 Report (I)
August 2006, Scott Wilson 111-
The final preferred option needs to allow for the, as yet unknown, impacts of climate
change and occurrence of severe storms. Therefore the final option may have more than
one ‘strand’ to it, combining elements of several options.
The Way Forward 1.57 It is recommended that Consultation is undertaken on the findings of this report. It is suggested
that this should be through a presentation to the Slapton Line Partnership Advisory Forum, and
through a 2-day open exhibition held in Slapton. The exhibition would give members of the
Forum and the public at larger the opportunity to assess the report and to meet members of the
Scott Wilson study team and put forward views directly. A questionnaire would be prepared to
provide a basis for statistical assessment of comments. This should be supplemented with
publication of this executive summary on the web and placement of a number of copies of the
report in local libraries or council offices.
1.58 Following consultation Phase 2 Study should proceed. The purpose of Phase 2 is to identify the
single preferred option. The Study will need to consider the carried forward options sufficiently
for a preferred option to be selected, funding availability having been taken into account.
1.59 In the longer term, beach profile monitoring should be continued. This is critical to improving the
data set on beach width variability and long-term trends. Consideration should be given to
whether local people and groups can help with this. Also, it will be necessary to keep options
under review in order to take account of the new data collected. For example, under the
managed realignment option, a trigger point would be reached at some point in the future when
work on realignment would cease and a new option (e.g. inland road upgrade) taken forward.
1.60 The monitoring should be undertaken in conjunction with aerial photography undertaken every
year. Photography provides additional data on changes in position of the line of vegetation.
Slapton Coastal Zone Management Main Study Volume 1: Phase 1 Report (I)
August 2006, Scott Wilson
2-1
2 Introduction
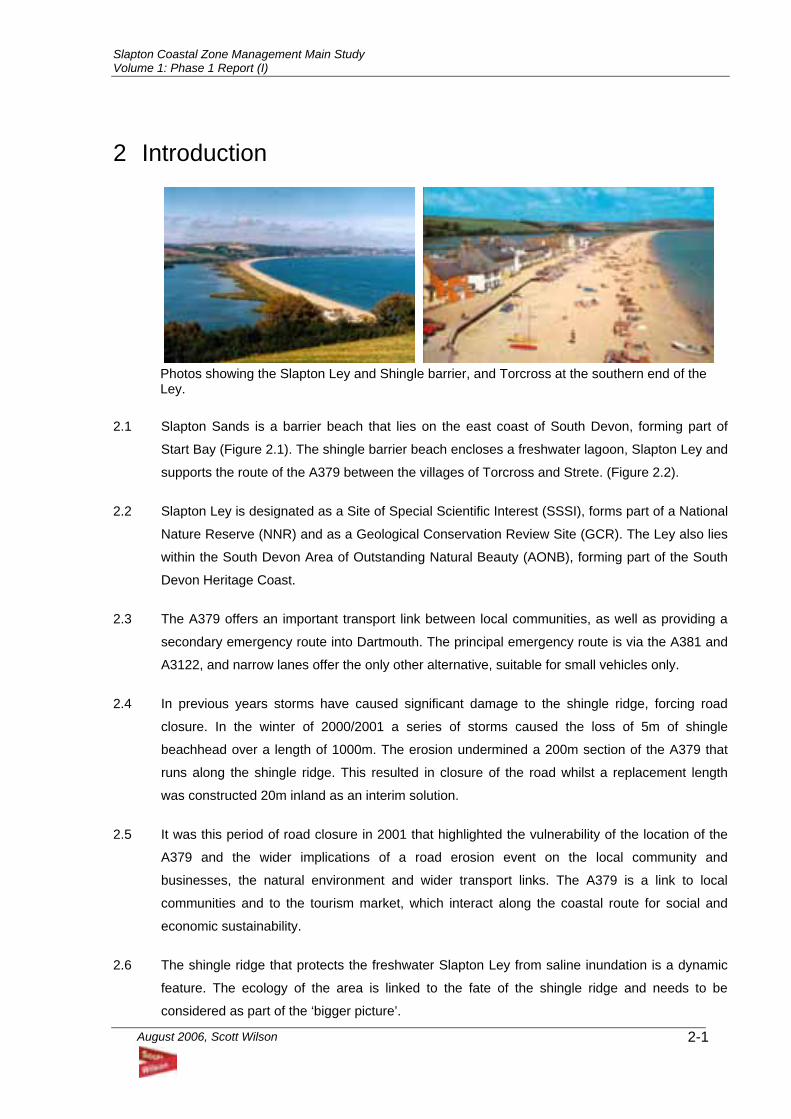
Photos showing the Slapton Ley and Shingle barrier, and Torcross at the southern end of the Ley.
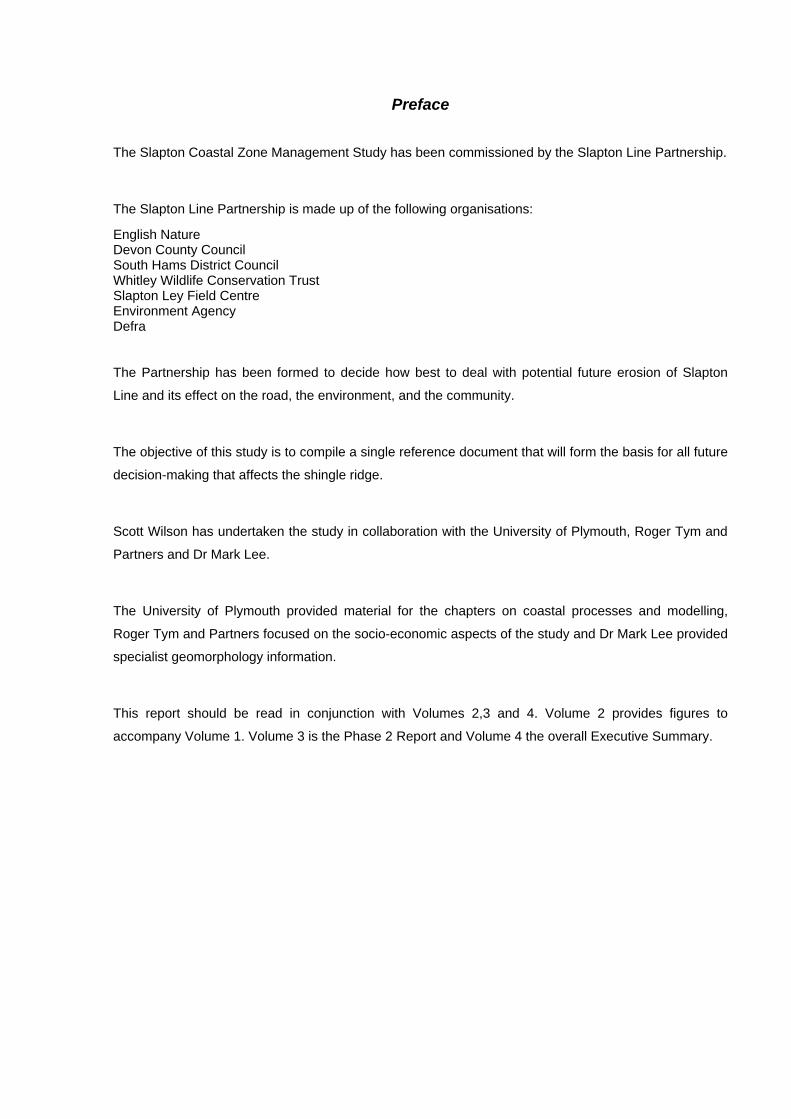
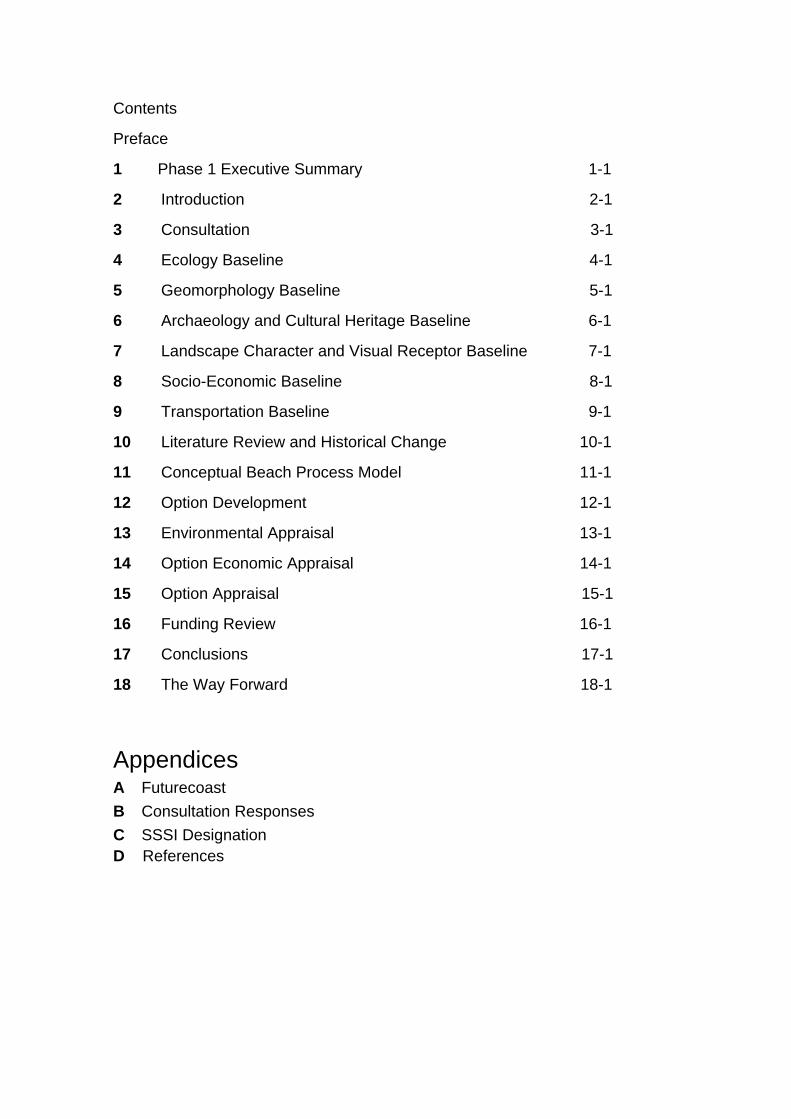
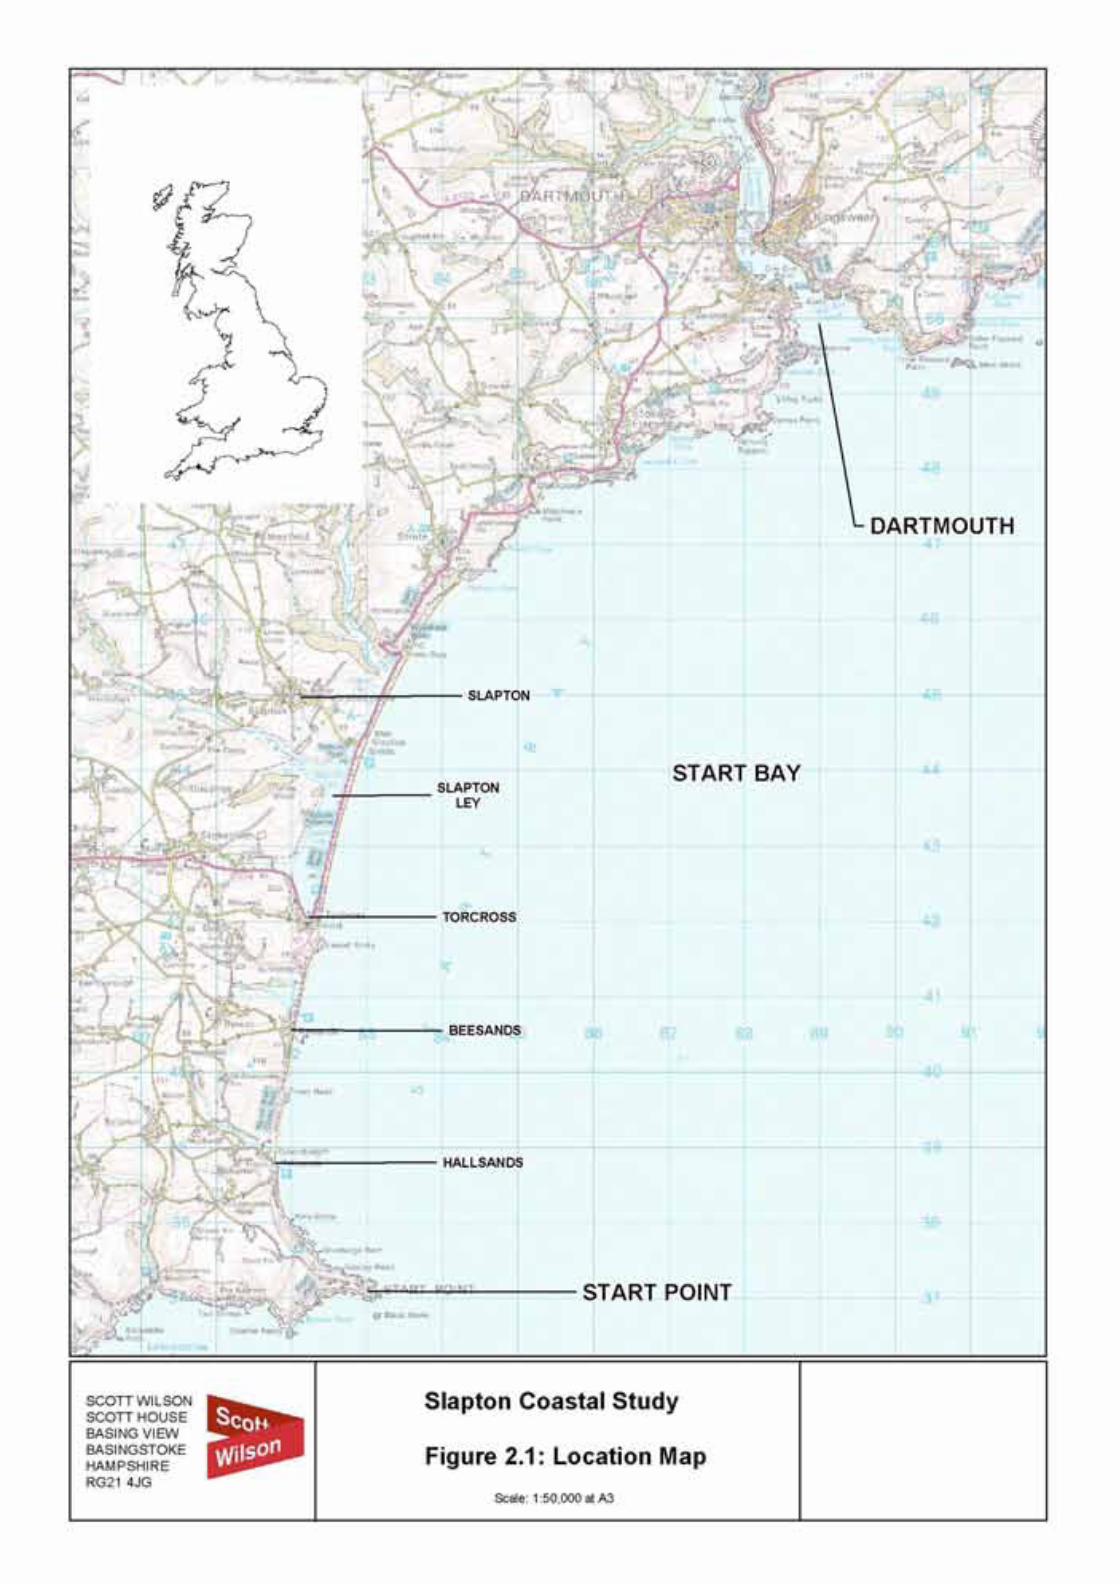
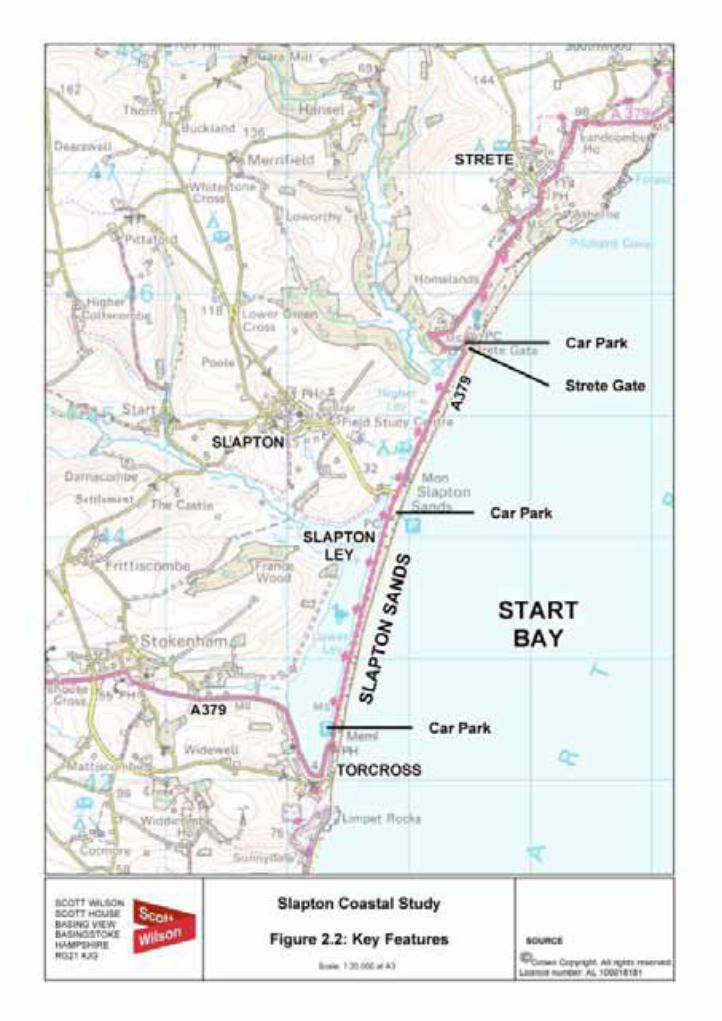
2.1 Slapton Sands is a barrier beach that lies on the east coast of South Devon, forming part of
Start Bay (Figure 2.1). The shingle barrier beach encloses a freshwater lagoon, Slapton Ley and
supports the route of the A379 between the villages of Torcross and Strete. (Figure 2.2).
2.2 Slapton Ley is designated as a Site of Special Scientific Interest (SSSI), forms part of a National
Nature Reserve (NNR) and as a Geological Conservation Review Site (GCR). The Ley also lies
within the South Devon Area of Outstanding Natural Beauty (AONB), forming part of the South
Devon Heritage Coast.
2.3 The A379 offers an important transport link between local communities, as well as providing a
secondary emergency route into Dartmouth. The principal emergency route is via the A381 and
A3122, and narrow lanes offer the only other alternative, suitable for small vehicles only.
2.4 In previous years storms have caused significant damage to the shingle ridge, forcing road
closure. In the winter of 2000/2001 a series of storms caused the loss of 5m of shingle
beachhead over a length of 1000m. The erosion undermined a 200m section of the A379 that
runs along the shingle ridge. This resulted in closure of the road whilst a replacement length
was constructed 20m inland as an interim solution.
2.5 It was this period of road closure in 2001 that highlighted the vulnerability of the location of the
A379 and the wider implications of a road erosion event on the local community and
businesses, the natural environment and wider transport links. The A379 is a link to local
communities and to the tourism market, which interact along the coastal route for social and
economic sustainability.
2.6 The shingle ridge that protects the freshwater Slapton Ley from saline inundation is a dynamic
feature. The ecology of the area is linked to the fate of the shingle ridge and needs to be
considered as part of the ‘bigger picture’.
Slapton Coastal Zone Management Main Study Volume 1: Phase 1 Report (I)
August 2006, Scott Wilson
2-2
Activities Previously Undertaken 2.7 A Scoping Study was completed by Atkins Consultants in October 2002. This identified the
issues relating to coastal processes at Slapton Sands, and presented a summary of past and
current research and information required for the Slapton Coastal Zone Management Main
Study.
2.8 A consultation exercise was undertaken as part of the Scoping Study. A letter of invitation to
comment was issued to national, regional and local groups with an existing or potential interest
in the study area. Refer to Chapter 4 for summaries of this consultation.
2.9 A steering group known as The Slapton Line Technical Group, whose members include Local
and Statutory Authorities, landowners and directly interested parties, has been established to
consider the issues and progress to a long-term coastal management strategy for the site.
2.10 The Slapton Advisory Forum has been established to provide consultation and communication
with the local community, business representatives and service providers by means of public
forums, quarterly newsletters and an up to date website.
Report Terminology 2.11 Throughout this report, ‘Keep the Coast Road’ refers to a ‘Hold the Line’ terminology used in the
Shoreline Management Plan (SMP).
2.12 Generally the term ‘breach’ is used in this report to refer to a breach of the barrier. In a few
cases the term ‘breach’ has been applied to the 2001 event. In these cases it means damage to
the road, not a breach of the shingle barrier.
2.13 The terms ‘shingle bank’ and ‘barrier’ have been used interchangeably.
Slapton Coastal Zone Management Main Study Volume 1: Phase 1 Report (I)
August 2006, Scott Wilson
2-3
Study Objectives 2.14 The aim of this Study is to provide an evaluation of the issues relating to coastal processes at
Slapton Sands for the purposes of determining an appropriate shoreline management response
to the recent erosion and from this, to establish a robust long-term coastal zone management
strategy for the area. The objective of the Study is therefore to compile a single reference
document that will form the basis for all future decision-making that affects the shingle ridge.
2.15 This report presents the findings of the Phase 1: Determining the Shoreline Management
Approach, which forms part of the Slapton Coastal Zone Management Main Study. Phase 2 will
refine the range of shoreline management options and develop alternative coastal management
options, whilst Phase 3 will select the final preferred shoreline management option.
2.16 The objective of the Phase 1 report is defined as follows from the study brief:
• Complete data sets sufficiently to determine socio-economic and environmental impacts and
opportunities for the No Active Intervention, and Limited Intervention Options.
• Determine if Hold the Line (Keep the Coast Road) is a viable option.
• Provide information required to assess the Hold the Line (Keep the Coast Road) option and
identify further information needed to assess the alternative management options in Phase
2.
Present Management 2.17 The existing coastal management policy from the Lyme Bay and South Devon Shoreline
Management Plan (1998), is to Selectively Hold the Line by maintaining existing defences.
2.18 Following the last road erosion event in 2001, the district and county councils undertook
emergency measures to realign the road. However as set out in the Devon County Council
Contingency Plan 2004, the council’s policy is that it will repair minor damages (not requiring
planning permission) to the road in the event of erosion. However, longer- term measures to
replace severed roads, in the event of significant storm damage, would depend upon the scale
and location of the erosion event and the magnitude of the works involved.
2.19 Therefore it can be considered that currently there is no defined long-term policy.
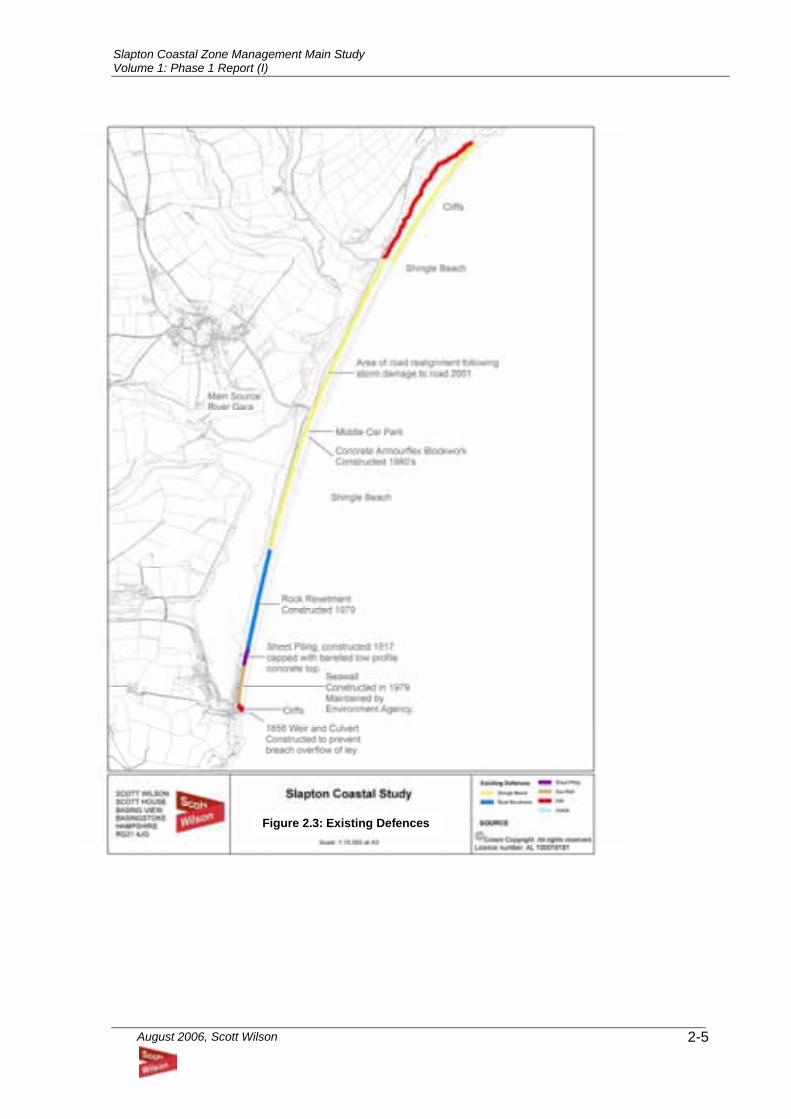
2.20 The existing defences can be seen in Figure 2.3 and in the photos overleaf, and include:
• A sea wall at Torcross, originally constructed in 1979 and modified in 2000 by the
Environment Agency (319m in length).
• Sheet piling, capped with concrete top (143m) constructed to the north of Torcross in 1917.

Slapton Coastal Zone Management Main Study Volume 1: Phase 1 Report (I)
August 2006, Scott Wilson
2-4
• A rock revetment (795m), between Torcross and the middle car park, constructed in 1979.
• Concrete ‘armourflex’ block work in front of the middle car park (330m), installed in
conjunction with surface improvements in the late 1980’s. This was significantly damaged
during the storms of 2000/2001.
• Shingle bastions in the area of the shingle bank that previously experienced significant
damage during the storms of 2000/2001.
• Natural defences in the form of the shingle beach and cliffs.
Slapton Coastal Zone Management Main Study Volume 1: Phase 1 Report (I)
August 2006, Scott Wilson
2-5
Figure 2.3: Existing Defences
Slapton Coastal Zone Management Main Study Volume 1: Phase 1 Report (I)
August 2006, Scott Wilson
2-6
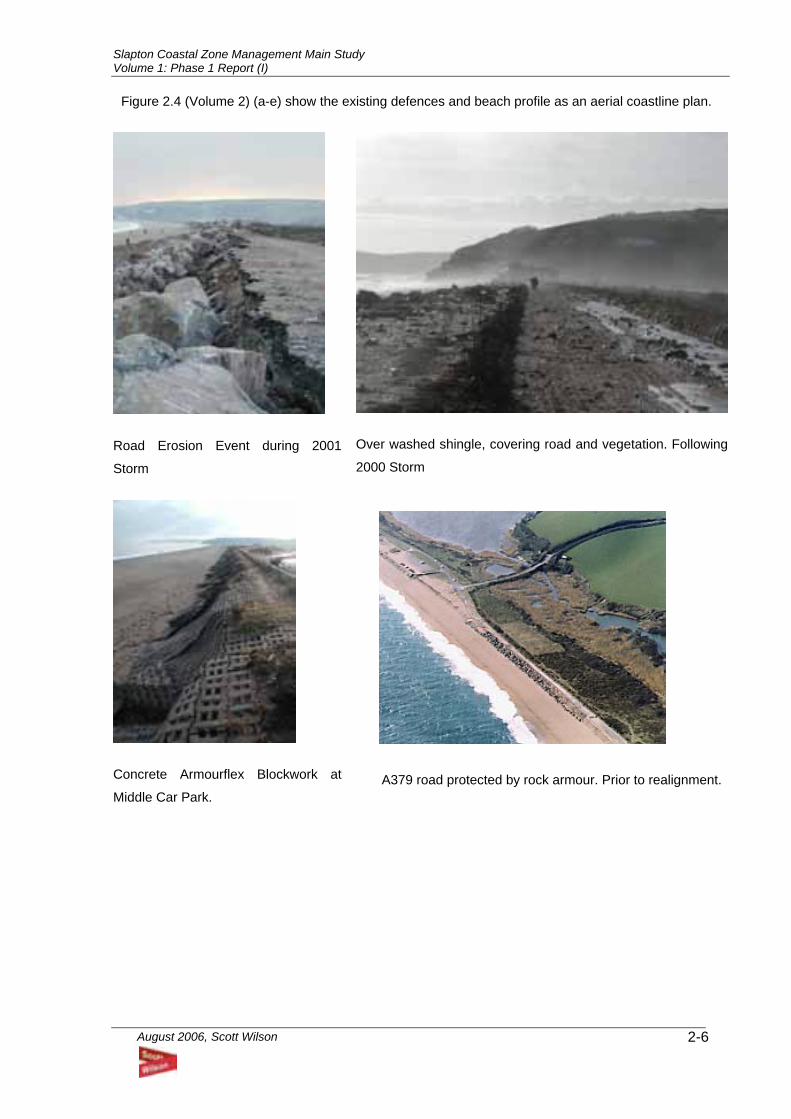
Figure 2.4 (Volume 2) (a-e) show the existing defences and beach profile as an aerial coastline plan.
Road Erosion Event during 2001
Storm
Over washed shingle, covering road and vegetation. Following
2000 Storm
Concrete Armourflex Blockwork at
Middle Car Park.
A379 road protected by rock armour. Prior to realignment.
Slapton Coastal Zone Management Main Study Volume 1: Phase 1 Report (I)
August 2006, Scott Wilson 3- 1
3 Consultation
3.1 At the start of the study, a general request for information on the Slapton area was made to a
number of organisations. These included the UK Met. Office, the UK Hydrographic Office, the
Ordnance Survey, the Environment Agency and members of the Slapton Partnership. This was
followed up by requests for specific data.
3.2 The following section summarises the types of information obtained. These have been
reviewed within the relevant topic chapters.
Data Reviewed 3.3 Relevant documents were highlighted in the Scoping Study Literature Search. In addition to
these papers, data sets and specific documents were supplied from Local Authorities and
Statutory bodies.
3.4 Documents supplied included
• Scoping documents
• Maps, historical and present day, including Admiralty charts.
• Images, aerial photographs, road erosion and oblique images.
• English Nature reports, including designation information for the Slapton area and related
MSc’s
• Local council literature, including the local plan and A379 Slapton Sands Interim
Reinstatement Environmental Statement and the Shoreline Management Plan.
• Field Studies Centre data sets of sediment size and beach profiles.
• Environment Agency data sets of beach profiles from Torcross
• Archaeological and historic monuments listings obtained from the National Monument
Records and English Heritage.
• Phase 1 habitat information, and locally important ecological site information from the Devon
Biological Records Centre.
3.5 These documents have been used for reference and form the basis of this report and
subsequent field study data collections.
Slapton Coastal Zone Management Main Study Volume 1: Phase 1 Report (I)
August 2006, Scott Wilson 3- 2
Previous consultation 3.6 As part of the Scoping Study, national, regional and local groups with an existing or potential
interest in the study area were given the opportunity to express their views. A generic
consultation letter was issued to the list of consultees presented in Appendix B. Responses from
the scoping study consultation exercise can be seen in Appendix B. The main comments are
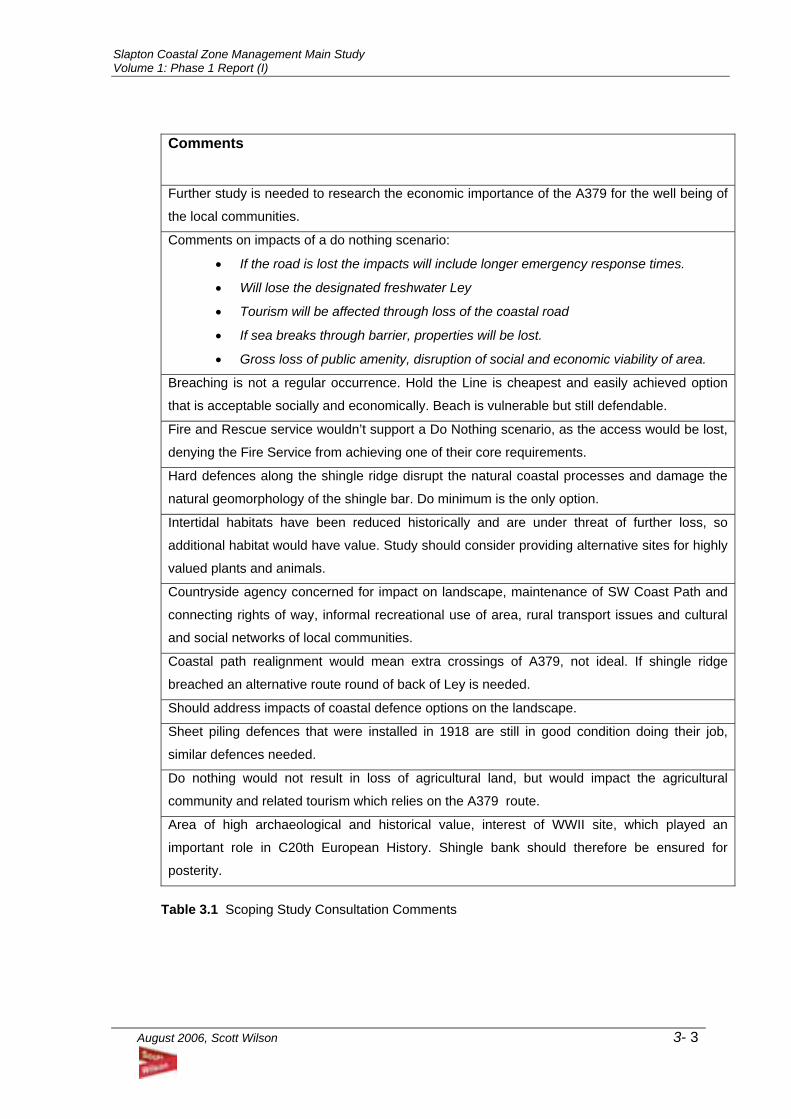
summarised in Table 3.1.
Public Forums/ Meetings 3.7 During the course of the Study there has been one public meeting and two Advisory Forum
meetings at which members of the Study team have outlined the scope and methodology of the
Study and some initial findings.
Business Survey 3.8 A survey of potential impacts of road closure on local businesses is being undertaken. Results
of this will be available in late October 2004.
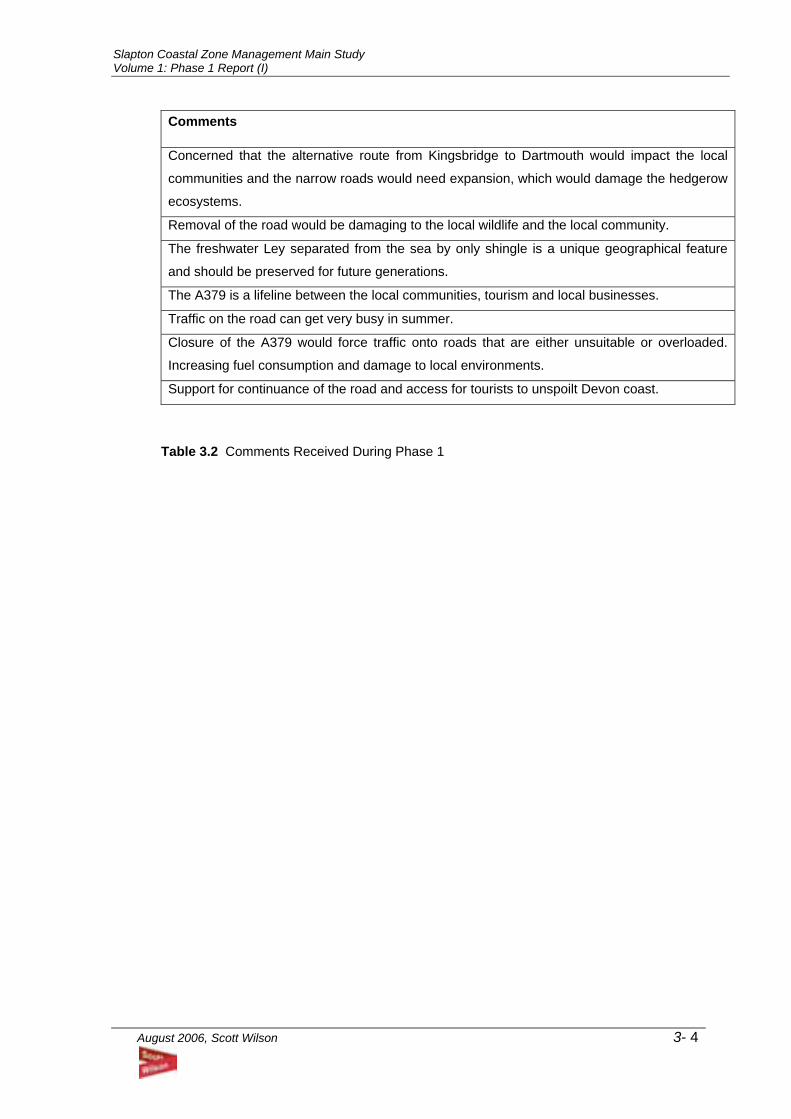
Summary of Views 3.9 Following the commissioning of Scott Wilson to conduct the Slapton Coastal Zone Management
Main Study, national, regional and local interested parties have expressed their views on the
Slapton Line proposals previously outlined in the Scoping Study. These views have been
expressed in emails, letters and phone calls following public forums and press releases on the
study. A copy of the correspondence can be seen in Appendix B, and is summarised in Table
3.2.
3.10 It is recommended that Consultation is undertaken on the findings of this report. It is suggested
that this should be through a presentation to the Slapton Line Partnership Advisory Forum, and
through a 2-day open exhibition held in Slapton. The exhibition would give members of the
Forum and the public at large, the opportunity to assess the report and to meet members of the
Scott Wilson study team and put forward views directly. A questionnaire would be prepared to
provide a basis for statistical assessment of comments.
Slapton Coastal Zone Management Main Study Volume 1: Phase 1 Report (I)
August 2006, Scott Wilson 3- 3
Comments Further study is needed to research the economic importance of the A379 for the well being of
the local communities.
Comments on impacts of a do nothing scenario:
• If the road is lost the impacts will include longer emergency response times.
• Will lose the designated freshwater Ley
• Tourism will be affected through loss of the coastal road
• If sea breaks through barrier, properties will be lost.
• Gross loss of public amenity, disruption of social and economic viability of area.
Breaching is not a regular occurrence. Hold the Line is cheapest and easily achieved option
that is acceptable socially and economically. Beach is vulnerable but still defendable.
Fire and Rescue service wouldn’t support a Do Nothing scenario, as the access would be lost,
denying the Fire Service from achieving one of their core requirements.
Hard defences along the shingle ridge disrupt the natural coastal processes and damage the
natural geomorphology of the shingle bar. Do minimum is the only option.
Intertidal habitats have been reduced historically and are under threat of further loss, so
additional habitat would have value. Study should consider providing alternative sites for highly
valued plants and animals.
Countryside agency concerned for impact on landscape, maintenance of SW Coast Path and
connecting rights of way, informal recreational use of area, rural transport issues and cultural
and social networks of local communities.
Coastal path realignment would mean extra crossings of A379, not ideal. If shingle ridge
breached an alternative route round of back of Ley is needed.
Should address impacts of coastal defence options on the landscape.
Sheet piling defences that were installed in 1918 are still in good condition doing their job,
similar defences needed.
Do nothing would not result in loss of agricultural land, but would impact the agricultural
community and related tourism which relies on the A379 route.
Area of high archaeological and historical value, interest of WWII site, which played an
important role in C20th European History. Shingle bank should therefore be ensured for
posterity.
Table 3.1 Scoping Study Consultation Comments
Slapton Coastal Zone Management Main Study Volume 1: Phase 1 Report (I)
August 2006, Scott Wilson 3- 4
Comments
Concerned that the alternative route from Kingsbridge to Dartmouth would impact the local
communities and the narrow roads would need expansion, which would damage the hedgerow
ecosystems.
Removal of the road would be damaging to the local wildlife and the local community.
The freshwater Ley separated from the sea by only shingle is a unique geographical feature
and should be preserved for future generations.
The A379 is a lifeline between the local communities, tourism and local businesses.
Traffic on the road can get very busy in summer.
Closure of the A379 would force traffic onto roads that are either unsuitable or overloaded.
Increasing fuel consumption and damage to local environments.
Support for continuance of the road and access for tourists to unspoilt Devon coast.
Table 3.2 Comments Received During Phase 1
Slapton Coastal Zone Management Main Study Volume 1: Phase 1 Report (I)
August 2006, Scott Wilson
4-1
4 Ecology Baseline
Introduction 4.1 The Ecology baseline for Slapton Ley and its immediate environs has been well documented
through the activities of the Slapton Ley Field Centre and other organisations and individuals
who have studied the various floral and faunal groups at this important wildlife site. The site
was first designated as a Site of Special Scientific Interest (SSSI) in 1952 and subsequently as
a National Nature Reserve (NNR) in 1993. The key features of interest within the NNR are
documented in the main part of this chapter.
4.2 The importance of the shingle bar in geo-morphological terms has long been appreciated (see
Chapter 5) although it is only more recently that its ecological value has been fully appreciated.
Much of the recent baseline has been documented in detail as a result of the 2000/2001 road
erosion event, the subsequent road realignment and other studies (including supplementary
studies to this project). The results of these studies of the habitats and species of the shingle
bar are documented in brief where appropriate in the remainder of this chapter.
4.3 Beyond the immediate environs of the NNR, the ecology baseline is much more poorly defined.
However, a Phase 1 Habitat survey was undertaken for the entire area in the 1980’s. Whilst it
appreciated that this survey is likely to be out of date, it provides a useful habitat overview
particularly for areas to the west of the Ley1.
4.4 This chapter provides a summary of the most important features of Slapton Ley and its environs.
It does not document in detail all features of interest or identify all of those species that occur
within the area of study. A bibliography provided in Appendix D documents in greater detail the
ecology baseline of the Ley.
4.5 Figure 4.1 provides an aerial view of the study area, including Slapton Ley. The red perimeter
line provides the 3km boundary line for the purpose of this study.
1 The areas to the west of the Ley are of potential importance in the context of potential road improvements or even new road corridors that might be required in the long term under some Slapton Line management scenarios.

Slapton Coastal Zone Management Main Study Volume 1: Phase 1 Report (I)
August 2006, Scott Wilson
4-2
Slapton Coastal Zone Management Main Study Volume 1: Phase 1 Report (I)
August 2006, Scott Wilson
4-3
Relevant legislation 4.6 The following legislation is relevant to species and habitats within the study site:
• The Wildlife and Countryside Act 1981 (as amended);
• The Countryside and Rights of Way Act 2000 (CRoW Act);
• The Conservation (Natural Habitats, &c.) Regulations 1994; and
• The National Parks and Access to the Countryside Act 1949.
4.7 In addition, the UK Biodiversity Action Plan (BAP) and Devon BAP are relevant to habitats and
species within the site. The importance of biodiversity conservation is given a statutory basis
within the CRoW Act, requiring government departments to have regard for biodiversity in
carrying out their functions, and to take positive steps to further the conservation of Biodiversity
Action Plan habitats and species.
Baseline Data Collection Methodology Spatial and Temporal Scope
4.8 The potential approaches to the long-term management of the Slapton Coastal Zone are varied
and the consequences of these approaches are similarly varied. At one extreme, an
abandonment option or "managed retreat" option, might require improved roads, or even new
roads, to the west of Slapton Ley in the long term. At the other extreme, a hold the line
approach would only require consideration of the immediate vicinity of the shingle ridge. In
order to provide a standardised approach for data search and baseline documentation a 3km
radius circle centred on the central beach car park has been used (see Figure 4.1). Whilst this
limit is to some extent arbitrary it does include the entire SSSI/NNR, the lower parts of the
valleys of the Rivers Gara and Start and the minor road network immediately west of the Ley.
4.9 Where potential future route corridors, west of the Ley are identified (existing routes or new
routes, see Chapter 9) and if the proposed strategy requires these to be considered, additional
study beyond the 3km radius may be necessary. Additionally, further detailed survey work in
the vicinity of any proposed routes could be required.
4.10 The temporal (historic) scope of the baseline collection is limited only in as far as species and
populations that are known or thought to be locally extinct are excluded from the assessment.
The consequent scope of the assessment of options will be temporally defined.
Slapton Coastal Zone Management Main Study Volume 1: Phase 1 Report (I)
August 2006, Scott Wilson
4-4
Consultees & Data Sources
4.11 The following organisations were contacted to obtain baseline ecological data for the study area:
• English Nature;
• Devon Biological Records Centre;
• Devon County Council;
• Slapton Ley Field Centre & Whitely Wildlife Conservation Trust (Keith Chell);
• Devon Birdwatching and Preservation Society;
• Marine Biological Association UK;
• Marine Conservation Society; and
• RSPB.
Survey
4.12 A Phase 1 habitat survey (JNCC, 1993) was undertaken, in support of the Environmental
Statement for the realigned A379, of those areas visible from areas with public access in
January 2004 to update a Phase 1 habitat survey undertaken in the 1980’s (obtained from the
Devon Biological Records Centre) in conjunction with aerial photography from 2002.
Ecology Baseline Designated Sites2 4.13 Statutory and non-statutory designated sites within the study area are mapped on Figure 4.2
and described below:
Slapton Ley Site of Special Scientific Interest (SSSI)
4.14 Slapton Ley was designated as a Site of Special Scientific Interest (SSSI) in 1954 and again in
1982 under the Wildlife and Countryside Act 1981 (as amended) for both its biological and
coastal geomorphological importance. This act provides English Nature with a duty to notify
land as SSSI where they are of the opinion that it is of special interest by way of its flora, fauna,
geological features or physiographical features. The Wildlife and Countryside Act requires
English Nature’s consent for owners or occupiers to carry out or permit to be carried out any
operation specified in the notification as likely to damage the special interest of the site.
4.15 The Wildlife and Countryside Act 1981 has since been strengthened by the introduction of the
Countryside and Rights of Way Act 2000. English Nature now has enforcement powers to
Slapton Coastal Zone Management Main Study Volume 1: Phase 1 Report (I)
August 2006, Scott Wilson
4-5
prosecute where offences have been committed in relation to SSSIs. The act also places a duty
on Local Authorities to further the conservation and enhancement of SSSIs both in carrying out
their operations, and in exercising their decision-making functions.
4.16 Slapton Ley SSSI was renotified in February 2004 to include a larger area and to amend the
reasons for designation. English Nature has consulted owners and occupiers, who are given
four months to make objections and representations about the notification of a new SSSI. When
owners and occupiers are notified, they receive a package of information to explain the legal
implications of a notification, including:
• a citation detailing the reasons for notification;
• a statement of English Nature's views on the management of the SSSI;
• a list of operations requiring English Nature's consent for the SSSI;
• and a map showing the SSSI.
4.17 The confirmation of the SSSI notification was agreed by English Nature’s Council in September
2004. Following public consultation the boundary map, citation (area of SSSI only) and “Views
About Management” (VAM) have been changed. English Nature maintains that hard defences
would damage both the biological and geomorphological interests of the SSSI, but that soft
engineering options may well be appropriate. In the case of Slapton Ley SSSI, in relation to the
shingle bar, the VAM states “Slapton Ley is a mosaic of habitats and features formed as a result
of dynamic coastal processes. These processes continually create, modify and remove the
geomorphological features and their associated habitats. Active process sites are important
because the coastal processes are still occurring, allowing us to understand how coastal
geomorphological features and habitats develop and respond to pressures such as sea level
rise. Management should enable the uninterrupted continuation of the active coastal processes
and the consequent development of features and habitats. Management of the barrier-beach
should aim to allow coastal processes to operate without interruption, enabling the gradual
landward migration and flexing of the beach in response to sea level rise. For the management
of the coastal road English Nature looks to the development and implementation of a strategy in
partnership with other interested parties, that facilitates the on-going conservation of the special
interest features of the SSSI as part of the integrated coastal zone management of the area”.
4.18 It should be noted that Section 28G of the Wildlife and Countryside Act 1981 (as inserted by the
Countryside and Rights of Way Act 2000) places a duty on local authorities to take
“…reasonable steps, consistent with the proper exercise of the authority’s functions to further
2 Sourced directly from Atkins Consultants Ltd (2002). Slapton Line Coast Protection: Scoping Study, Volume I of II.
Slapton Coastal Zone Management Main Study Volume 1: Phase 1 Report (I)
August 2006, Scott Wilson
4-6
the conservation and enhancement of the flora, fauna or geological or physical graphical
features by reason of which the site is of special scientific interest.”.
4.19 The legislation provides full protection to an SSSI at the point at which it is notified, however,
any objections or issues that owners and occupiers raise within the four-month period are then
considered by English Nature's Council before they decide whether to confirm, modify or
withdraw a notification.
4.20 The re-notified SSSI now covers approximately 254.72ha. The reasons for notification are as
follows:
• Coastal Geomorphology. Slapton Ley is nationally important for its coastal
geomorphology comprising a shingle barrier beach enclosing a lagoon. It has been well
studied and its dynamics are better known than in many other sites, demonstrating the
links between seabed features and shoreline landforms. The sediments within the lagoon
show the historic development of the site since Holocene times.
• Vegetated shingle. The total area of vegetated shingle is approximately 26 ha. It is the
largest area of vegetated shingle in Devon and the only one included within an SSSI in
south Devon. It contains a mosaic of vegetation communities from the exposed foreshore
to the grass and scrub communities adjacent to the Ley.
• Open water. The coastal lagoon at Slapton Ley is the largest natural freshwater lake in
south-west England.
• Reed-bed, tall-herb fen and fen woodland. This is a mosaic of habitats including fen
woodland, reed-bed and fen. These habitats have formed as a result of sedimentation
within the open water of the Ley and in the lower ends of the valleys feeding the Ley. The
total area occupied by this mosaic habitat in the SSSI is 50 ha.
• Breeding bird assemblage of ‘Lowland open waters and their margins’. There is a rich
assemblage of breeding birds associated with the fen and open water areas. This includes
large populations of sedge warbler (Acrocephalus schoenobaenus) and reed warbler (A.
scirpaceus). Slapton Ley is one of the most important breeding areas for these species in
South Devon.
• Breeding Cetti’s warbler (nationally important breeding bird). Slapton Ley supports an
average of 39 singing male Cetti’s warblers (Cettia cetti). This represents 7.1% of the
Great Britain breeding population. Slapton Ley is a nationally important site for this
species.
• Non-breeding passage birds. Numbers of migrating swallows (Hirundo rustica) and sand
martins (Riparia riparia) have regularly peaked in autumn at 10,000 and 500 birds
respectively. Ringing studies conducted at the site since 1960 have confirmed that large
Slapton Coastal Zone Management Main Study Volume 1: Phase 1 Report (I)
August 2006, Scott Wilson
4-7
numbers of sedge warblers and reed warblers also pass through the reed-beds before
their autumn migration.
• Wintering bittern (nationally important wintering bird). Slapton Ley supports an
average of one wintering bittern (Botaurus stellaris), representing 1% of the Great Britain
wintering population. Slapton Ley is a nationally important site for this species.
• Vascular plant assemblage (including strapwort). Slapton Ley’s vascular plant
assemblage is important because of the presence of both the Schedule 8 plant strapwort
(Corrigiola litoralis) and the nationally scarce plant toadflax-leaved St John’s-wort
(Hypericum linariifolium). The former is present at Slapton at its only native UK locality.
• Lichen assemblage. Slapton Ley has a rich lichen flora associated with the fen and
woodland habitats surrounding the Ley. A survey undertaken in March 2003 found four
Red Data Book species.
4.21 The SSSI Citation Sheet included within the 2004 notification package is provided in Appendix C
4.22 The biological interest at Slapton has led to the site being designated as a National Nature
Reserve, and the geomorphological interest is recognised in its designated as a Geological
Conservation Review Site. These designations are considered in turn below.
Slapton Ley National Nature Reserve (NNR)
4.23 Slapton Ley was designated a NNR in 1993 and is managed by the Field Studies Council on
behalf of the Whitley Wildlife Conservation Trust. NNRs represent some of the best examples
of SSSIs, owned by or managed in agreement with English Nature. Byelaws in relation to the
protection of the NNR may be introduced by English Nature.
4.24 The NNR comprises 192ha of Slapton Ley SSSI. The reasons for designation are as follows:
• Slapton Ley is the largest natural freshwater lake in South West England;
• The shingle barrier is a nationally important example of a bay bar;
• Slapton Ley demonstrates better than any other site in the British coast, the
links between seabed features and shoreline landforms;
• The reedbeds and rich fen and willow carr vegetation of the Leys support a
very diverse flora and fauna with one national rarity;
• There are over 2000 species of macro and micro fungi, 29 of which are
described are new to science;
• Slapton Ley is an important staging post for wintering and passage birds.
4.25 Management plans for Slapton Ley NNR have been prepared in 1988, 1993 and 1998.
Slapton Coastal Zone Management Main Study Volume 1: Phase 1 Report (I)
August 2006, Scott Wilson
4-8
Geological Conservation Review Site 4.26 Slapton Ley SSSI is also recognised as a Geological Conservation Review Site. Geological
Conservation Review (GCR) was a major step forward in earth heritage conservation. It was
designed to identify those sites of national and international importance needed to show all the
key scientific elements of the earth heritage of Britain. The sites selected-GCR sites- forms the
basis of statutory geological and geomorphological site conservation in Britain. The results of
the Geological Conservation Review programme are being published in a series of 42 volumes,
the Geological Conservation Review Series, each of which provides a public record of the
evaluation of each Geological Conservation Review site placed in a national and, where
appropriate, international context.
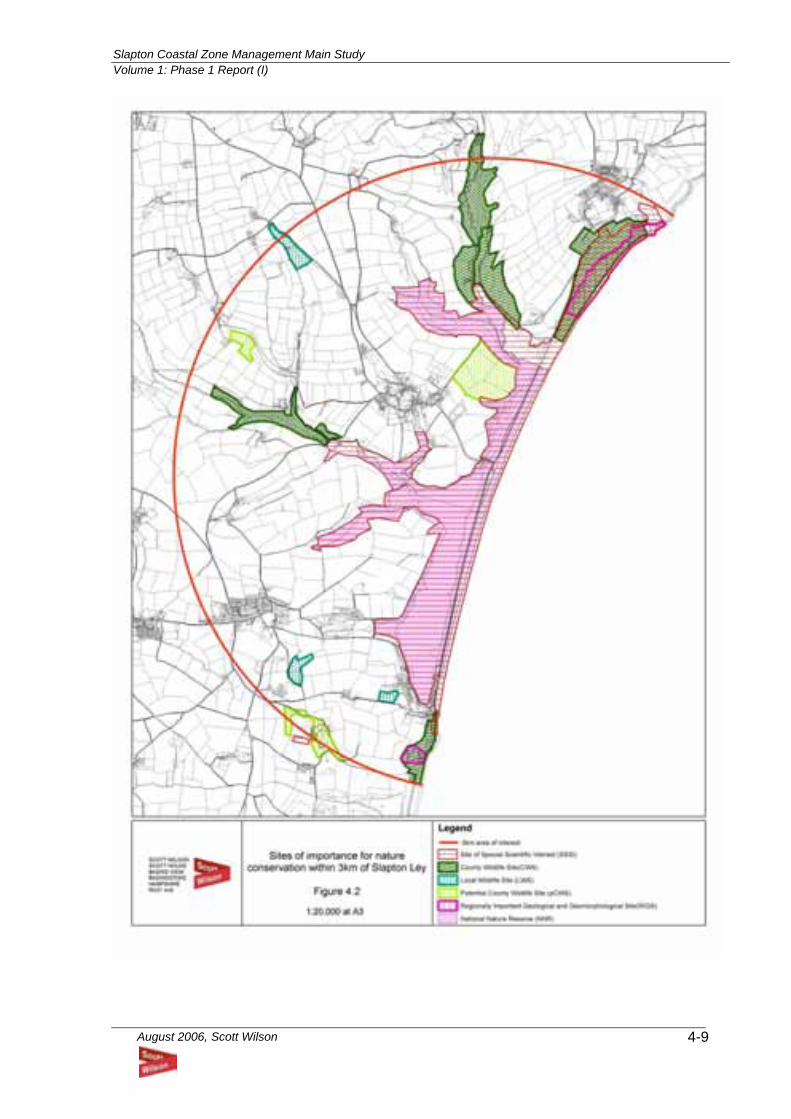
4.27 A number of Local Wildlife Sites (LWS), County Wildlife Sites (CWS) and Regionally Important
Geological and Geomorphological Sites (RIGS) lie within the study area. These are presented
in Table 4.1 and mapped on Figure 4.2. Such locally designated sites receive protection under
the Devon Structure Plan Policy CO10: Protection of Nature Conservation Sites and Species,
and policy ENV7: Local Nature Conservation Sites of the South Hams District Local Plan
Review 1995-2011. This policy states that “Development that would harm, either directly or
indirectly, the wildlife or geological interest of a:
• County Wildlife Site;
• Local Nature Reserve;
• County Geological Site; or
• site of equivalent importance
will not be permitted unless the need for, or benefits of, the development clearly outweigh the
need to safeguard the substantive wildlife or geological value of the site. Where such
development is permitted habitat management or compensatory habitat provision will be
required in appropriate circumstances”.
Slapton Coastal Zone Management Main Study Volume 1: Phase 1 Report (I)
August 2006, Scott Wilson
4-9
Slapton Coastal Zone Management Main Study Volume 1: Phase 1 Report (I)
August 2006, Scott Wilson
4-10
Slapton Coastal Zone Management Main Study Volume 1: Phase 1 Report (I)
August 2006, Scott Wilson
4-11
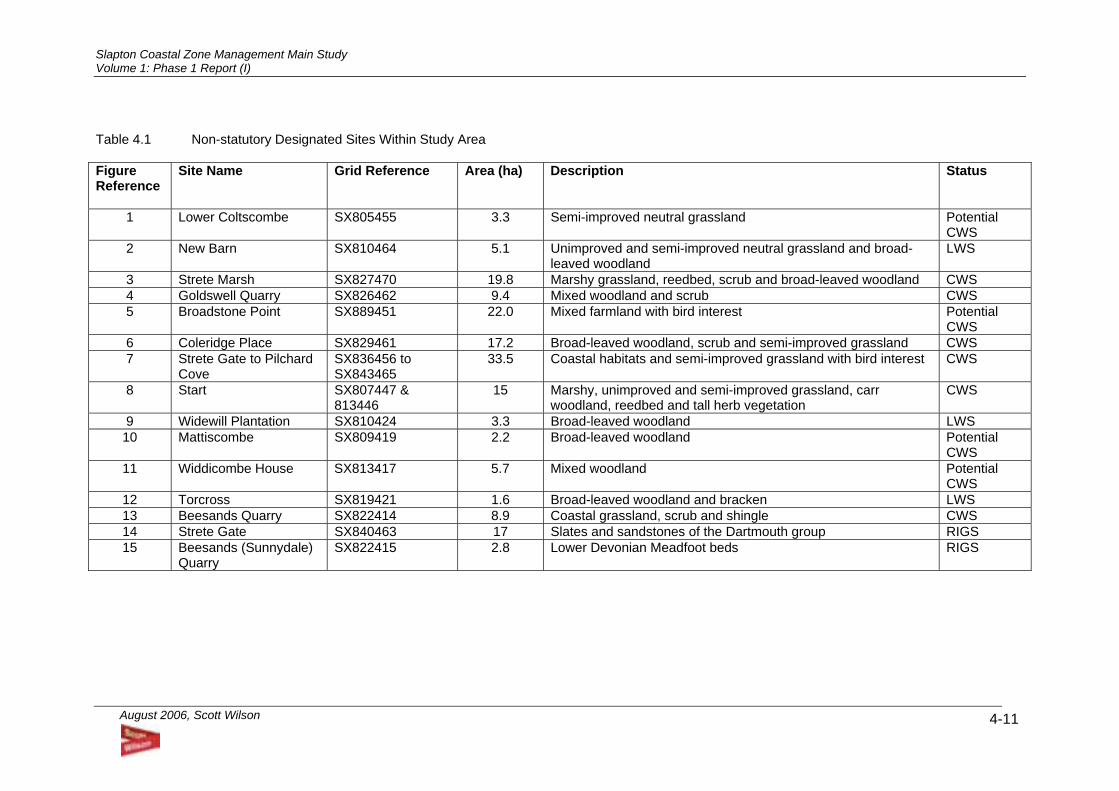
Table 4.1 Non-statutory Designated Sites Within Study Area Figure Reference
Site Name Grid Reference Area (ha) Description
Status
1 Lower Coltscombe SX805455 3.3 Semi-improved neutral grassland Potential CWS
2 New Barn SX810464 5.1 Unimproved and semi-improved neutral grassland and broad-leaved woodland
LWS
3 Strete Marsh SX827470 19.8 Marshy grassland, reedbed, scrub and broad-leaved woodland CWS 4 Goldswell Quarry SX826462 9.4 Mixed woodland and scrub CWS 5 Broadstone Point SX889451 22.0 Mixed farmland with bird interest Potential
CWS 6 Coleridge Place SX829461 17.2 Broad-leaved woodland, scrub and semi-improved grassland CWS 7 Strete Gate to Pilchard
Cove SX836456 to SX843465
33.5 Coastal habitats and semi-improved grassland with bird interest CWS
8 Start SX807447 & 813446
15 Marshy, unimproved and semi-improved grassland, carr woodland, reedbed and tall herb vegetation
CWS
9 Widewill Plantation SX810424 3.3 Broad-leaved woodland LWS 10 Mattiscombe SX809419 2.2 Broad-leaved woodland Potential
CWS 11 Widdicombe House SX813417 5.7 Mixed woodland Potential
CWS 12 Torcross SX819421 1.6 Broad-leaved woodland and bracken LWS 13 Beesands Quarry SX822414 8.9 Coastal grassland, scrub and shingle CWS 14 Strete Gate SX840463 17 Slates and sandstones of the Dartmouth group RIGS 15 Beesands (Sunnydale)
Quarry SX822415 2.8 Lower Devonian Meadfoot beds RIGS
Slapton Coastal Zone Management Main Study Volume 1: Phase 1 Report (I)
August 2006, Scott Wilson
4 - 12
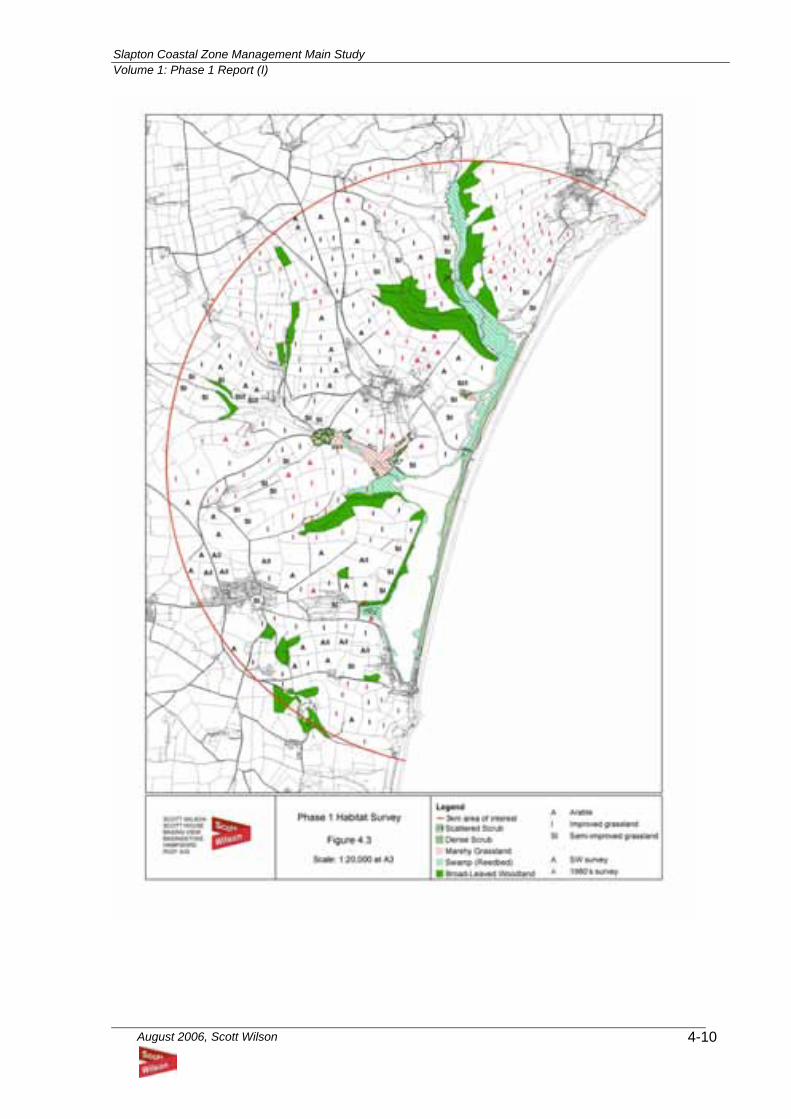
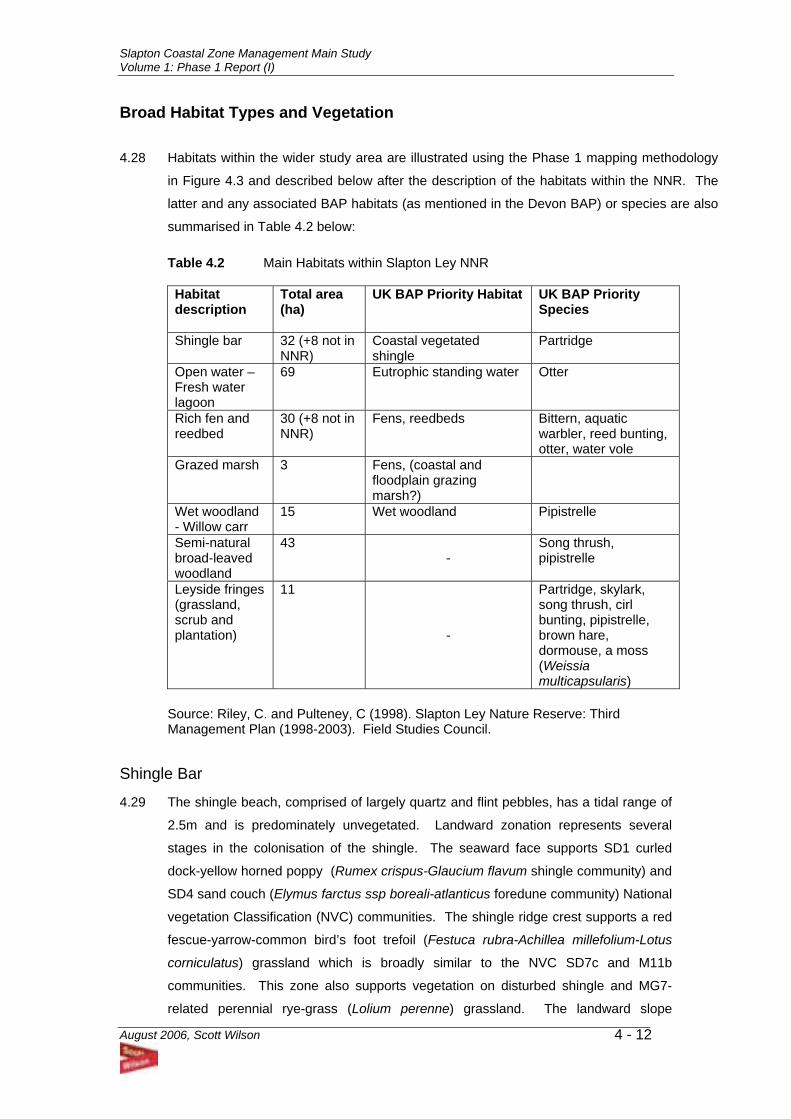
Broad Habitat Types and Vegetation 4.28 Habitats within the wider study area are illustrated using the Phase 1 mapping methodology
in Figure 4.3 and described below after the description of the habitats within the NNR. The
latter and any associated BAP habitats (as mentioned in the Devon BAP) or species are also
summarised in Table 4.2 below:
Table 4.2 Main Habitats within Slapton Ley NNR Habitat description
Total area (ha)
UK BAP Priority Habitat UK BAP Priority Species
Shingle bar 32 (+8 not in NNR)
Coastal vegetated shingle
Partridge
Open water – Fresh water lagoon
69 Eutrophic standing water Otter
Rich fen and reedbed
30 (+8 not in NNR)
Fens, reedbeds Bittern, aquatic warbler, reed bunting, otter, water vole
Grazed marsh 3 Fens, (coastal and floodplain grazing marsh?)
Wet woodland - Willow carr
15 Wet woodland Pipistrelle
Semi-natural broad-leaved woodland
43 -
Song thrush, pipistrelle
Leyside fringes (grassland, scrub and plantation)
11
-
Partridge, skylark, song thrush, cirl bunting, pipistrelle, brown hare, dormouse, a moss (Weissia multicapsularis)
Source: Riley, C. and Pulteney, C (1998). Slapton Ley Nature Reserve: Third Management Plan (1998-2003). Field Studies Council.
Shingle Bar
4.29 The shingle beach, comprised of largely quartz and flint pebbles, has a tidal range of
2.5m and is predominately unvegetated. Landward zonation represents several
stages in the colonisation of the shingle. The seaward face supports SD1 curled
dock-yellow horned poppy (Rumex crispus-Glaucium flavum shingle community) and
SD4 sand couch (Elymus farctus ssp boreali-atlanticus foredune community) National
vegetation Classification (NVC) communities. The shingle ridge crest supports a red
fescue-yarrow-common bird’s foot trefoil (Festuca rubra-Achillea millefolium-Lotus
corniculatus) grassland which is broadly similar to the NVC SD7c and M11b
communities. This zone also supports vegetation on disturbed shingle and MG7-
related perennial rye-grass (Lolium perenne) grassland. The landward slope
Slapton Coastal Zone Management Main Study Volume 1: Phase 1 Report (I)
August 2006, Scott Wilson
4 - 13
supports MG1a (Arrhenatherum elatis grassland, Festuca rubra sub-community,
Raphanus raphanistrum ssp maritimum variant), W22 blackthorn (Prunus spinosa)
scrub, W23 gorse (Ulex europaeus, Anthoxanthum odoratum sub-community) scrub,
W25a bracken-bramble (Pteridium aquilinum-Rubus fruticosis underscrub,
Hyacinthoides non-scripta sub-community) and ash (Fraxinus excelsior) scrub
communities. Maps showing the distribution of vegetation communities along the
shingle bank are presented in Appendix C (Source: Wessex Environmental
Associates 2002).
4.30 The shingle vegetation within the SSSI/NNR is considered by English Nature to be in
“unfavourable declining” condition due in part to the stabilisation of the bar partly as a
result of the presence of the existing road, restricting the mobility of the shingle
distorting the natural zonation pattern of the shingle vegetation. There is also
excessive trampling in some of the more sensitive areas.
Open Water- Freshwater Lagoon
4.31 The freshwater coastal lagoon is the largest natural lake in southwest England and
supports an aquatic plant flora characteristic of this habitat type. The Lower Ley is
predominantly shallow open water with associated areas of reedbed, tall-herb fen and
fen woodland. The nature of Higher and Lower Leys are quite different with species
like intermediate water-starwort (Callitriche hamulata) and ivy-leaved duckweed
(Lemna trisulca) far more common in the Upper Ley. The open water areas of the
upper Ley appear to have suffered less from nutrient enrichment and thus support a
wider range of interesting macrophytes, including soft hornwort (Ceratophyllum
submersum) at its only Devon site. Slapton Ley is the only site in Devon site for fan-
leaved water-crowfoot (Ranunculus circinatus).
4.32 This feature of the SSSI/NNR is considered by English Nature to be in “unfavourable
no change” condition due to eutrophication. This is being addressed by South West
Water under the AMP3 programme.
Rich Fen and Reedbed
4.33 The site supports a range of fen communities, many dominated by common reed.
The shores of the Lower Ley support common reed (Phragmites australis) with
important plants growing on areas of exposed mud. Bare stony shores support low-
growing plants such as strapwort which does not occur at any other locality in Britain.
The Upper Ley comprises predominantly of reedbed, reed-swamp and fen woodland.
The NVC communities of the Upper and Lower Ley wetland areas are: Phragmites
australis swamp and reed beds (S4); Sparganium erectum swamp (S14) including the
Phalaris arundinaceae sub-community (S14d); Glyceria fluitans water margin
vegetation (S22) and Alopecurus geniculatus subcommunity (S22c); Phragmites
Slapton Coastal Zone Management Main Study Volume 1: Phase 1 Report (I)
August 2006, Scott Wilson
4 - 14
australis - Urtica dioica tall-herb fen (S26), Oenanthe crocata sub-community (S26c)
and Epilobium sub-community (S26d).
Grazed Marsh
4.34 These occur at several places alongside the higher Ley particularly at Little Marsh
and Ironbridge Causeway. Species include meadow sweet (Filipendula ulmaria), bog
stitchwort (Stellaria uliginoasa) and southern marsh orchid (Dactylorrhiza
praetermissa).
Wet Woodland – Willow Carr
4.35 Grey willow (Salix cinerea) carr is particularly well-developed on the floating islands in
the Higher Ley, in the Start Marches and in the Gara Delta. Mature carr is also
present at Slapton Wood marsh. The following NVC wet woodland communities have
been recorded: Salix cinerea -Galium palustre woodland (W1); Alnus glutinosa -
Carex paniculata woodland (W5) and Phragmites australis sub-community (W5a);
Alnus glutinosa - Urtica dioica woodland (W6) including the Sambucus nigra sub-
community (W6d).
Semi-natural Broad-leaved Woodland
4.36 The majority of the semi-natural woodland is mature plantation, over-mature
plantation and derelict plantation, and has been classified as W10 oak-bracken-
bramble (Quercus robur-Pteridium aquilinium-Rubus fruticosus) woodland. Sweet
chestnut (Castanea sativa) is common in Slapton Wood whilst both pedunculate oak
(Quercus robur) and sessile oak (Quercus petraea) also occur.
Farmland Mosaic
4.37 Outside of the SSSI and adjacent wetland areas, habitats predominately comprise
small arable fields and improved grassland, bordered by hedgerows which are likely
to be locally important for nature conservation. The improved grassland areas
typically equate to MG7 Lolium perenne leys within the NVC. Where river valley
sides are steeper the communities are typically less improved and at least locally
tend towards MG6 perennial rye-grass-crested dog’s-tail (Lolium perenne-Cynosurus
cristatus) grassland. More locally still, small areas of semi-improved grassland are
present that approximate to MG5 crested dog’s-tail-common knapweed grassland
(Cynosurus cristatus-Centaurea nigra). Areas of reedbed usually dominated by
common reed are associated with the river valleys broadly equating to the S4 NVC
community. Areas of woodland are also associated with the river valleys,
predominately oak woods (W10) and willow carr (W1).
Slapton Coastal Zone Management Main Study Volume 1: Phase 1 Report (I)
August 2006, Scott Wilson
4 - 15
Species
4.38 The Wildlife and Countryside Act (1981) as amended by the Countryside and Rights
of Way Act 2000 includes provision for the protection of a range of species. Other
legislation relevant to the site includes the Conservation (Habitats, &c.) Regulations
1994. This provides a mechanism in Great Britain for the implementation of the EC
Directive 92/43/EEC on the conservation of natural habitats and of wild fauna and
flora (commonly known as the “Habitats Directive”). The act makes it an offence
deliberately to kill, capture, or disturb a European Protected Species, or to damage or
destroy the breeding site or resting place of such an animal. Such protected species
known to occur within the study area include bats and otter.
Mammals
4.39 The following mammal species, with legal protection, are recorded the NNR:
• badger (on the inner shore of the higher Ley with one main sett recorded in this location
in January 2004); protected by the Protection of Badgers Act 1992;
• bat species (foraging over the reed beds of the Higher Ley), which are protected under
Schedule 5 of the Wildlife and Countryside Act 1981 (as amended) and the
Conservation (Natural Habitats, &c.) Regulations 1994;
• otter, which are protected under Schedule 5 of the Wildlife and Countryside Act 1981
(as amended) and the Conservation (Natural Habitats, &c.) Regulations 1994;
• dormouse, which are protected under Schedule 5 of the Wildlife and Countryside Act
1981(as amended) and the Conservation (Natural Habitats, &c.) Regulations 1994; and
• water vole which are protected under Schedule 5 of the Wildlife and Countryside Act
1981 (as amended) and have been recorded in the past although there have been no
recent sightings.
4.40 Otter are present throughout the year around the fringes of the Leys and are believed
to breed within the NNR. Dormouse breed within woodland and the fringes of the
Ley, and in gorse on the backslope of the shingle bar.
4.41 Badger and Otter have also been recorded within the study area, outside of the NNR.
A range of bats species, all protected under the Wildlife and Countryside Act 1981 (as
amended) and the Conservation (Natural Habitats, &c.) Regulations 1994 have been
recorded within the study area, outside of the NNR, including:
• lesser horseshoe bat (Rhinolophus hipposideros) a UK BAP species;
• greater horseshoe bat (Rhinolophus ferrumequinum) a Devon BAP species; and
• whiskered bat (Myotis mystacinus)
Slapton Coastal Zone Management Main Study Volume 1: Phase 1 Report (I)
August 2006, Scott Wilson
4 - 16
4.42 A range of small mammals have also been recorded outside of the NNR including
common shrew (Sorex araneus), pygmy shrew (Sorex minutus) and water shrew
(Neomys fodiens). It is also likely that dormouse occurs outside the NNR in suitable
woodlands, areas of scrub and the less managed hedgelines.
Birds
4.43 The NNR supports a nationally important assemblage of breeding birds, including a
nationally important population of Cetti’s warbler breeding in the fen woodland around
the fringes of the Ley. A heronry is also present within the NNR in the Hartshorn
plantation adjacent to the Lower Ley.
4.44 The NNR is also important for non-breeding passage and wintering birds. The
reedbeds on the fringes of the Ley are important to both migrant and wintering birds
particularly in the autumn for large numbers of swallow, sand martin (Riparia riparia),
reed warblers and sedge warbler (A. schoenobaenus). Bittern also regularly use the
site in winter. The internationally threatened aquatic warbler (A. paludicola) is
occasionally recorded on autumn migration.
4.45 Birds recorded within the NNR which are listed under the EC Birds Directive, 1979,
include:
• bittern;
• mute swan (Cygnus olor);
• water rail (Rallus aquaticus);
• coot (Fulica atra);
• marsh harrier (Circus aeruginosus);
• common Snipe (Callinago gallinago);
• kingfisher (Alcedo atthis); and
• Dartford warbler (Sylvia undata).
4.46 Birds recorded within the NNR, which are listed under the Wildlife and Countryside
Act, 1981 (as amended), include:
• bittern;
• moorhen (Gallinula chloropus);
• coot;
• marsh harrier;
• common snipe;
Slapton Coastal Zone Management Main Study Volume 1: Phase 1 Report (I)
August 2006, Scott Wilson
4 - 17
• barn owl (Tyto alba);
• kingfisher;
• bearded tit (Panurus biarmicus);
• Cetti’s warbler;
• Dartford warbler; and
• cirl bunting (Embezeria schoeniculus).
4.47 Data on bird species outside of the NNR is limited, with no records obtained from the
Devon Biodiversity Records Centre. Hobby has been recorded within the study area,
with Raven breed also located in Slapton Wood. Both raven and common buzzards
were recorded within the wider study area during the site visit in January 2004 and
are assumed to breed locally.
4.48 Cirl Buntings are known to be present within the wider study area including the
vicinity of Slapton Village.
Reptiles and amphibians
4.49 Adder (Vipera berus), slow-worm (Anguis fragilis), grass snake (Natrix helvetica) and
viviparous lizard (Lacerta vivipara), all protected by Schedule 5 of the Wildlife and
Countryside Act 1981 (as amended), have been recorded on the shingle ridge.
4.50 Toads are common within the NNR, whilst other amphibians include frog, smooth
newt and palmate newt.
4.51 Grass snake and slowworm, both protected under the Wildlife and Countryside Act
1981 (as amended) has been recorded outside of the NNR, but within the study area.
Toad and common frog have also been recorded within the study area outside of the
NNR.
Fish
4.52 Bregazzi et al (1982) provide a description of the history and management of the
fishery at Slapton Ley. Slapton Ley is an important local coarse fishery with species
including pike, perch, roach, rudd and eel. Small numbers of three-spined
stickleback, lamprey species, bullhead and stone loach have been recorded from the
River Gara and small numbers of brown trout migrate into the Ley. No records of fish
outside of the NNR were obtained.
Slapton Coastal Zone Management Main Study Volume 1: Phase 1 Report (I)
August 2006, Scott Wilson
4 - 18
Invertebrates
4.53 The NNR is important for invertebrates with large numbers of moth, butterfly and
dragonfly species recorded. In 1998, the Invertebrate Site Register listed 88
invertebrate species for Slapton Ley many of which are considered to be notable.
Two uncommon species of mollusc have previously been recorded although not in
recent years. A survey in 1996 revealed that the NNR has 100 species of oribatids
(moss mites) including six species newly recorded in Britain. In 1992 a new species
of millipede was discovered. A literature review and survey of invertebrates of the
shingle bar in 2003 (Alexander 2003) highlights the regional (possibly national)
importance of the shingle bar for invertebrates, with a mix of shingle, sand dune, dry
heath and grassland species. The overall condition of the invertebrate fauna on the
shingle bar was reported to be good although being locally degraded by trampling,
compaction and possibly nutrient enrichment. A range of Red Data Book and
Nationally Scarce invertebrates have been recorded on the shingle bar. The key
species are associated with the open shingle on the foreshore and sparsely
vegetated shingle crest. Whilst the landward slope supports grassland fauna of more
local significance, although may be of greater significance in providing over-wintering
habitats for the open shingle invertebrates. Table 4.3 presents notable invertebrate
species recorded within the NNR.
4.54 Records of invertebrate species outside of the NNR are limited. A range of common
butterfly species has been recorded within CWSs in the study area. Great green-
bush cricket, the largest UK orthopteran and a Devon BAP species, has been
recorded in Beesands Quarry CWS.
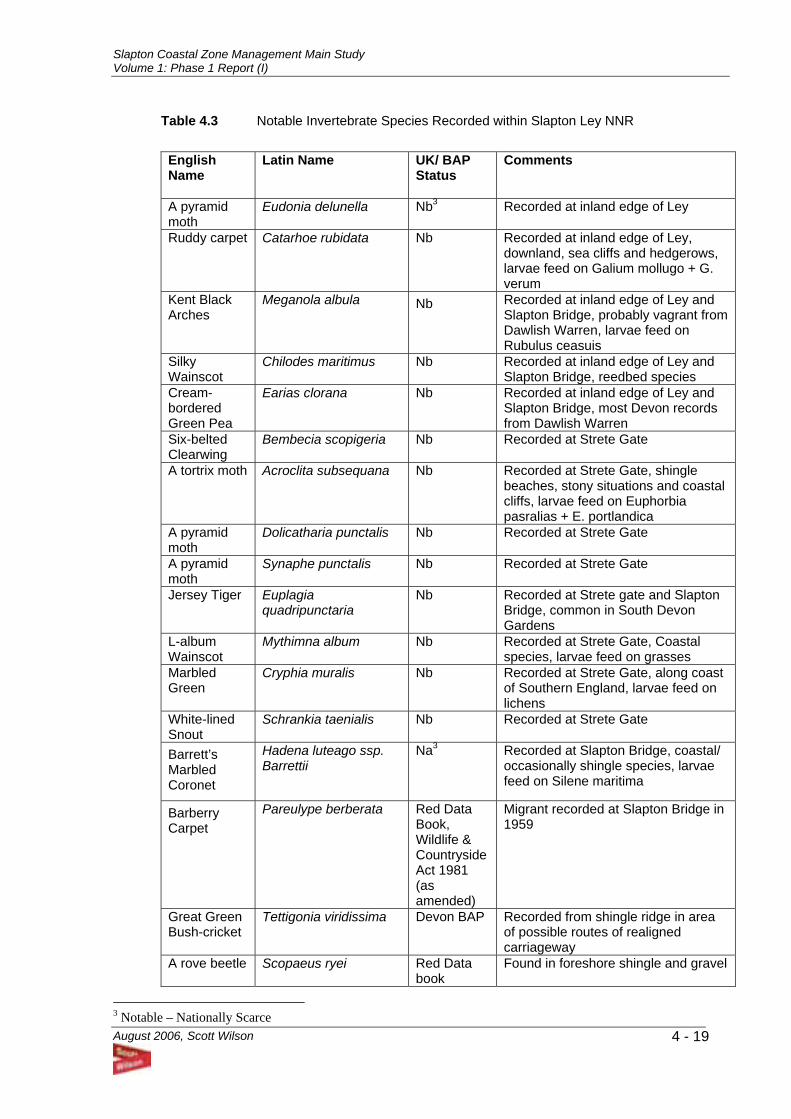
Slapton Coastal Zone Management Main Study Volume 1: Phase 1 Report (I)
August 2006, Scott Wilson
4 - 19
Table 4.3 Notable Invertebrate Species Recorded within Slapton Ley NNR English Name
Latin Name UK/ BAP Status
Comments
A pyramid moth
Eudonia delunella Nb3 Recorded at inland edge of Ley
Ruddy carpet Catarhoe rubidata Nb Recorded at inland edge of Ley, downland, sea cliffs and hedgerows, larvae feed on Galium mollugo + G. verum
Kent Black Arches
Meganola albula Nb Recorded at inland edge of Ley and Slapton Bridge, probably vagrant from Dawlish Warren, larvae feed on Rubulus ceasuis
Silky Wainscot
Chilodes maritimus Nb Recorded at inland edge of Ley and Slapton Bridge, reedbed species
Cream-bordered Green Pea
Earias clorana Nb Recorded at inland edge of Ley and Slapton Bridge, most Devon records from Dawlish Warren
Six-belted Clearwing
Bembecia scopigeria Nb Recorded at Strete Gate
A tortrix moth Acroclita subsequana Nb Recorded at Strete Gate, shingle beaches, stony situations and coastal cliffs, larvae feed on Euphorbia pasralias + E. portlandica
A pyramid moth
Dolicatharia punctalis Nb Recorded at Strete Gate
A pyramid moth
Synaphe punctalis Nb Recorded at Strete Gate
Jersey Tiger Euplagia quadripunctaria
Nb Recorded at Strete gate and Slapton Bridge, common in South Devon Gardens
L-album Wainscot
Mythimna album Nb Recorded at Strete Gate, Coastal species, larvae feed on grasses
Marbled Green
Cryphia muralis Nb Recorded at Strete Gate, along coast of Southern England, larvae feed on lichens
White-lined Snout
Schrankia taenialis Nb Recorded at Strete Gate
Barrett’s Marbled Coronet
Hadena luteago ssp. Barrettii
Na3 Recorded at Slapton Bridge, coastal/ occasionally shingle species, larvae feed on Silene maritima
Barberry Carpet
Pareulype berberata Red Data Book, Wildlife & Countryside Act 1981 (as amended)
Migrant recorded at Slapton Bridge in 1959
Great Green Bush-cricket
Tettigonia viridissima Devon BAP Recorded from shingle ridge in area of possible routes of realigned carriageway
A rove beetle Scopaeus ryei Red Data book
Found in foreshore shingle and gravel
3 Notable – Nationally Scarce
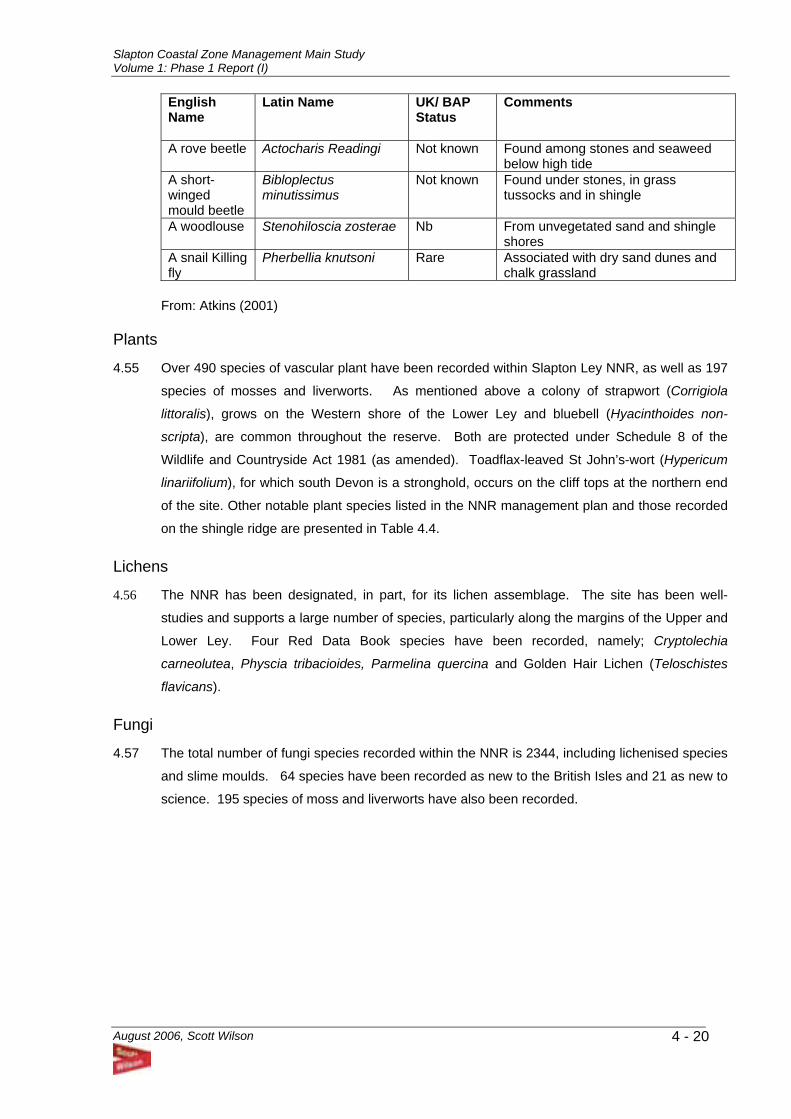
Slapton Coastal Zone Management Main Study Volume 1: Phase 1 Report (I)
August 2006, Scott Wilson
4 - 20
English Name
Latin Name UK/ BAP Status
Comments
A rove beetle Actocharis Readingi Not known Found among stones and seaweed below high tide
A short-winged mould beetle
Bibloplectus minutissimus
Not known Found under stones, in grass tussocks and in shingle
A woodlouse Stenohiloscia zosterae Nb From unvegetated sand and shingle shores
A snail Killing fly
Pherbellia knutsoni Rare Associated with dry sand dunes and chalk grassland
From: Atkins (2001)
Plants
4.55 Over 490 species of vascular plant have been recorded within Slapton Ley NNR, as well as 197
species of mosses and liverworts. As mentioned above a colony of strapwort (Corrigiola
littoralis), grows on the Western shore of the Lower Ley and bluebell (Hyacinthoides non-
scripta), are common throughout the reserve. Both are protected under Schedule 8 of the
Wildlife and Countryside Act 1981 (as amended). Toadflax-leaved St John’s-wort (Hypericum
linariifolium), for which south Devon is a stronghold, occurs on the cliff tops at the northern end
of the site. Other notable plant species listed in the NNR management plan and those recorded
on the shingle ridge are presented in Table 4.4.
Lichens
4.56 The NNR has been designated, in part, for its lichen assemblage. The site has been well-
studies and supports a large number of species, particularly along the margins of the Upper and
Lower Ley. Four Red Data Book species have been recorded, namely; Cryptolechia
carneolutea, Physcia tribacioides, Parmelina quercina and Golden Hair Lichen (Teloschistes
flavicans).
Fungi
4.57 The total number of fungi species recorded within the NNR is 2344, including lichenised species
and slime moulds. 64 species have been recorded as new to the British Isles and 21 as new to
science. 195 species of moss and liverworts have also been recorded.
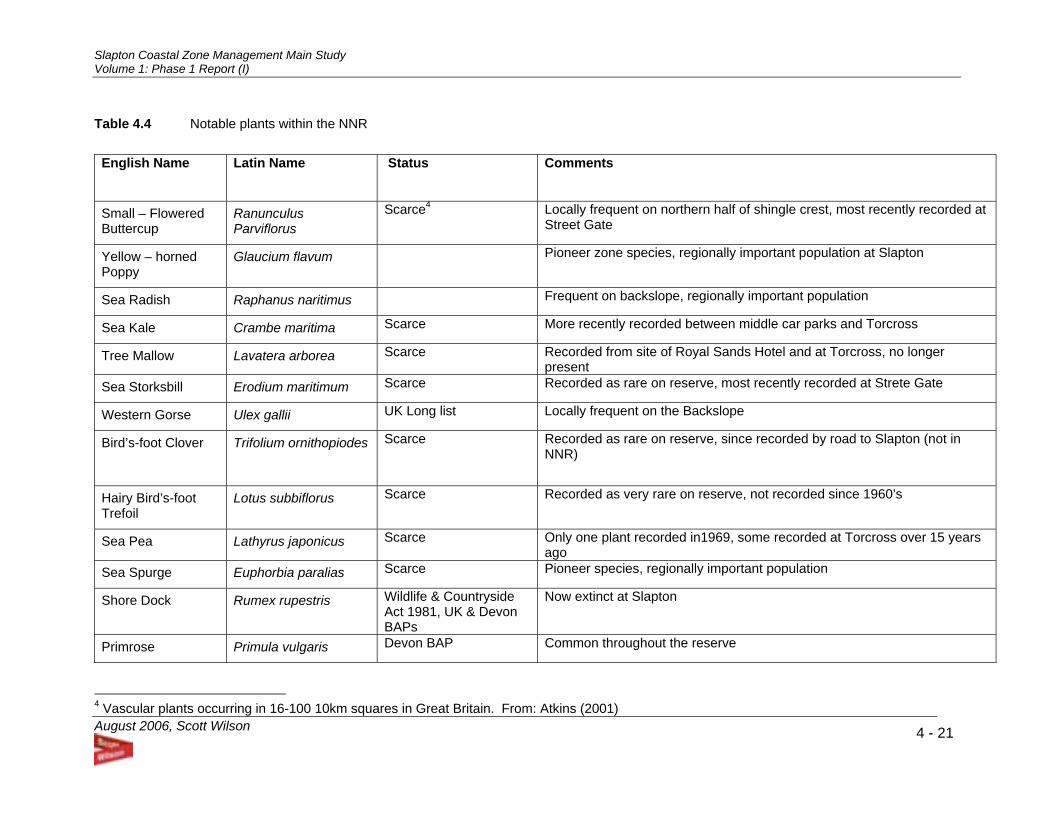
Slapton Coastal Zone Management Main Study Volume 1: Phase 1 Report (I)
August 2006, Scott Wilson
4 - 21
Table 4.4 Notable plants within the NNR English Name
Latin Name
Status Comments
Small – Flowered Buttercup
Ranunculus Parviflorus
Scarce4 Locally frequent on northern half of shingle crest, most recently recorded at Street Gate
Yellow – horned Poppy
Glaucium flavum Pioneer zone species, regionally important population at Slapton
Sea Radish Raphanus naritimus Frequent on backslope, regionally important population
Sea Kale Crambe maritima Scarce More recently recorded between middle car parks and Torcross
Tree Mallow Lavatera arborea Scarce Recorded from site of Royal Sands Hotel and at Torcross, no longer present
Sea Storksbill Erodium maritimum Scarce Recorded as rare on reserve, most recently recorded at Strete Gate
Western Gorse Ulex gallii UK Long list Locally frequent on the Backslope
Bird’s-foot Clover
Trifolium ornithopiodes Scarce Recorded as rare on reserve, since recorded by road to Slapton (not in NNR)
Hairy Bird’s-foot Trefoil
Lotus subbiflorus Scarce Recorded as very rare on reserve, not recorded since 1960’s
Sea Pea Lathyrus japonicus Scarce Only one plant recorded in1969, some recorded at Torcross over 15 years ago
Sea Spurge Euphorbia paralias Scarce Pioneer species, regionally important population
Shore Dock Rumex rupestris Wildlife & Countryside Act 1981, UK & Devon BAPs
Now extinct at Slapton
Primrose Primula vulgaris Devon BAP Common throughout the reserve
4 Vascular plants occurring in 16-100 10km squares in Great Britain. From: Atkins (2001)
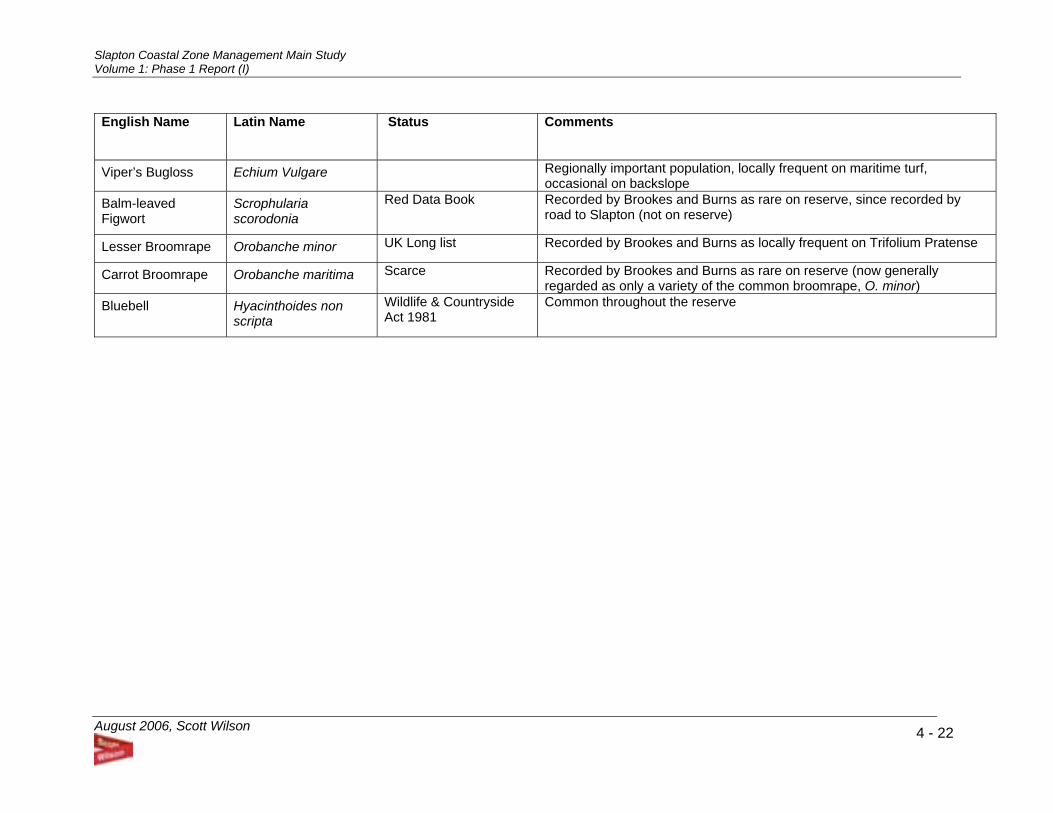
Slapton Coastal Zone Management Main Study Volume 1: Phase 1 Report (I)
August 2006, Scott Wilson
4 - 22
English Name
Latin Name
Status Comments
Viper’s Bugloss Echium Vulgare Regionally important population, locally frequent on maritime turf, occasional on backslope
Balm-leaved Figwort
Scrophularia scorodonia
Red Data Book Recorded by Brookes and Burns as rare on reserve, since recorded by road to Slapton (not on reserve)
Lesser Broomrape Orobanche minor UK Long list Recorded by Brookes and Burns as locally frequent on Trifolium Pratense
Carrot Broomrape Orobanche maritima Scarce Recorded by Brookes and Burns as rare on reserve (now generally regarded as only a variety of the common broomrape, O. minor)
Bluebell Hyacinthoides non scripta
Wildlife & Countryside Act 1981
Common throughout the reserve
Slapton Coastal Zone Management Main Study Volume 1: Phase 1 Report (I)
August 2006, Scott Wilson
4 - 23
Summary 4.58 The ecology of the Slapton Ley NNR & SSSI has been well studied. This chapter has attempted
to summarise the data available for the site as well as the wider study area. The NNR support
habitats and species of national importance including several BAP priority habitats, namely;
shingle vegetation, reed bed, and wet woodland. The site also supports otter and dormouse,
both of which are protected under national and international legislation. Nationally important
populations of breeding and wintering birds, and a number of notable plants and invertebrates
are also present. As is implicit in the designation, all parts of the NNR can be regarded as of
National Importance for nature conservation.
4.59 Outside of the NNR/SSSI the wider study area predominately comprises improved grassland
and arable fields bordered by hedgerows. This habitat mosaic, which is more diverse on valley
sides compared to the plateau tops, is likely to be locally important with respect to nature
conservation. Key areas, of Country importance, for nature conservation outside of the
NNR/SSSI have been designated as County Wildlife Sites. These include areas of broad-
leaved woodland, marshy grassland and reed bed. Baseline data, other than for the habitat
types identified within this study is limited and if any proposed options for the study were to
impact on areas west of the NNR (e.g. new road improvements) additional specialist survey,
particularly for protected species (such as dormouse, badger, reptiles, cirl bunting) could be
required.
Slapton Coastal Zone Management Main Study Volume 1: Phase 1 Report (I)
August 2006, Scott Wilson
5-1
5 Geomorphology Baseline
Introduction 5.1 This Chapter summarises the geomorphological baseline of the Slapton Line and the
surrounding features with a particular focus on the barrier beach and the coastal processes.
These features characterise what is an important geomorphological site as recognised in part,
within the SSSI designation (see Chapter 4 and Appendix C for more details of the designation).
The baseline is essential in enabling understanding of how potential coastal zone management
options for the Slapton Line could impact upon this important dynamic resource. The
surrounding geology is also identified on an accompanying figure.
5.2 The Chapter concludes with a geomorphologically-based projection of evolution of the barrier,
assuming no human intervention.
Setting: Start Bay 5.3 Slapton Sands is one of a series of shingle barrier beaches along the east-facing shoreline of
Start Bay: Hallsands, Beesands, Slapton Sands and Blackpool Sands (Figure 5.1). These
beaches are composed predominantly of fine gravels and small pebbles (i.e. between –1 and –
4 Φ; around 1-15mm). Flint is the dominant sediment type. There is a gradual decrease in
beach crest height and coarsening of the beach material towards the south.
5.4 These beaches can be regarded as swash aligned i.e. the beach planform is adjusted to an
orientation that minimises the angle between shoreline and approaching wave crest so limiting
net longshore sediment transport (see Davies 1972). Seabed features include (Figure 5.1):
• a pronounced break of slope at an average depth of –42 m OD, around 0.5-3km offshore.
This has been interpreted as an ancient coastline that may have been exposed during
periods of lower sea level in the mid-Pleistocene (Robinson 1961).
• a second break in the bedrock slope at -28m OD off Slapton Sands.
• a series of infilled channels cut around 7m into the bedrock platform and extending offshore
from the landward drainage systems.
• “the Skerries”, an offshore bank that extends north-eastwards for over 6.5km and appears to
be linked to Start Point (maximum height is –4.8m OD, but generally the crest height is
around –7.5m to –9.0m OD. Waves from all directions, except north-east, are believed to
break on the bank at low water.
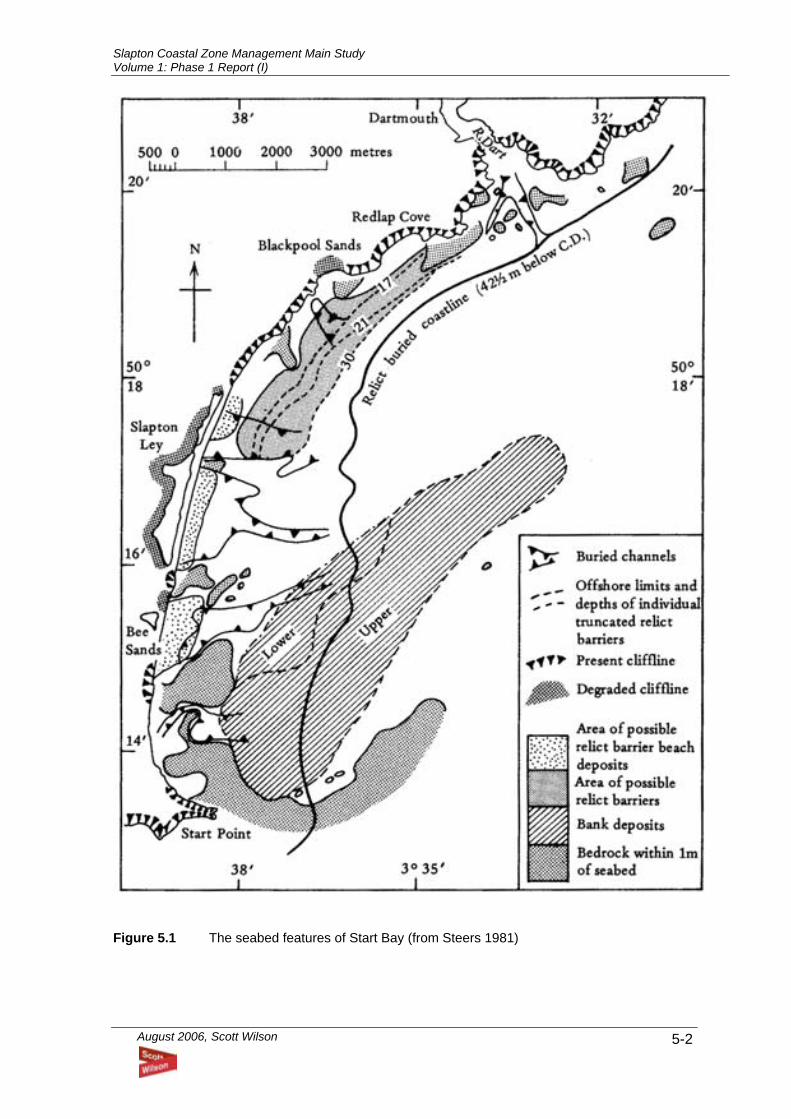
Slapton Coastal Zone Management Main Study Volume 1: Phase 1 Report (I)
August 2006, Scott Wilson
5-2
Figure 5.1 The seabed features of Start Bay (from Steers 1981)
Slapton Coastal Zone Management Main Study Volume 1: Phase 1 Report (I)
August 2006, Scott Wilson
5-3
Slapton Sands: Form 5.5 Slapton Sands comprises a 3.5km long gravel-dominated, swash-aligned barrier beach that
extends between Torcross and Strete Gate. The barrier encloses two important wetland areas:
• the Lower Ley which is a perched, freshwater lake, covering an area of 0.77km2 and up to
500m wide with a maximum depth of –4.0m OD. Lake levels are controlled by a culvert and
weir at Torcross. The widest part of the lake, around the entrance of the Start River, is
known as “Ireland Bay”.
• The Higher Ley supports rich fen vegetation and wet willow woodland (carr).
5.6 Lakebed sedimentation rates are around 0.8-1.2 cm/year (Heathwaite 1993). This has
contributed to the relatively recent influx of phosphorous and nitrogen into the lake, modifying its
status from eutrophic to hypertrophic and increasing the susceptibility to algal blooms;
5.7 The barriers and wetlands lie seaward of an undulating, dissected plateau developed in Lower
Devonian slates of the Meadfoot Group and, around Slapton village, Permian breccias and
sandstones (Figure 5.2). This plateau is drained by a number of small streams that flow into the
wetlands (River Gara, Start River and Stokely Stream) before entering the sea through the
culvert at Torcross. The water in the Ley also infiltrates through the shingle bank to the sea.
5.8 North of Strete Gate the gravel beach extends as a fringing beach, backed by a cliff line (the
Strete Gate to Pilchard Cove cliff line). The cliff line is developed in Lower Devonian
metamorphosed argillaceous sediments of the Dartmouth Group (Figure 5.2). These beds
include a sequence of slates, with occasional sandstones. The cliffs are likely to be capped by a
mantle of coarse periglacial head deposits (i.e. gravels and stones).
5.9 The beach crest varies from around 8mOD at Pilchard Cove to 5.5mOD at Torcross. The width
of the shingle barrier varies from 100-140m from the Ley to low tide. The gradient of the
intertidal beach persists below low-tide level to about –7.5m OD. It then slopes gently to reach
–14.5m OD at about 600m offshore. Barrier beach deposits extend for about 500m offshore
(Kelland 1975). It has been estimated that the beach contains around 6.9Mm3 of material,
representing 66% of the shingle within the four Start Bay barriers. The beach ridge carries a
road, the A379, between the two villages of Strete and Torcross and which, via a bridge across
the Ley, connects with the village of Slapton.
5.10 The Ley contains a variable sequence of deposits, in descending order (Morey, 1976, 1980):
1. An upper layer of lacustrine muds of terriginous detrital origin. These muds form seal the
lake floor and seaward margin, reducing seepage through the barrier.
Slapton Coastal Zone Management Main Study Volume 1: Phase 1 Report (I)
August 2006, Scott Wilson
5-4
2. A layer of muddy sand, thickening seawards, containing shell fragments. This unit is
believed to represent a short-lived marine incursion following a breach of the barrier
(Mottershead 1997);
3. Fen peats (1.3m thick); an early reed swamp stage gradually changes to a Carex-
dominated fen community. The top of the peat has been dated at 1813 ± 40 years BP and
the base at 2889 ± 50 years BP.
4. Thin brown organic silt with a sharp lower boundary, but passing upwards into fen peats.
The presence of pollen of Chenopodium and Phragmites suggests a local transition from
vestigial saltmarsh to reed swamp.
5. Light-grey silty estuarine muds which may be an extension of the lower bay deposits
(Hails, 1975). The fauna suggests a salinity gradient with restricted water circulation
behind a growing barrier or spit.
6. Extensive sheets of washover fan gravels derived from the barrier occur within the lagoon
sediments.
Slapton barrier stratigraphy 5.11 In 1999 a team from the University of Plymouth and Site Investigations Services Ltd. collected
two cores (SS-99-1 and SS-99-2) from the central part of the barrier ridge (Figure 5.2). Two
years later Devon County Council commissioned the collection of core SS-01-3 by Geotechnical
Engineering Ltd. as part of the impact assessment of the A379 diversion. All cores were logged
and analysed by Anthony Massey as part of his PhD study (Massey, 2004).
5.12 Core SS-01-3 (Figure 5.3) is located near the site of the 2001 breach at SX 82987 44563, 30m
west-north-west of the old A379 road near the Higher Ley reedswamp perimeter. The core
bottomed out in slate at 15.44m depth. Between 13.90 and 9.42m the sediments are
predominantly silts and clays, with occasional shells and plant material. The upper 9.42m of the
core consists of gravel. Gravel size is generally less than 30mm in diameter, but layers occur
with pebble sizes up to 50mm diameter.
5.13 Core SS-99-1 (Figure 5.4) is located at SX 82698 43880 approximately 45m west north west of
the A379 road opposite Ireland Bay and is 19.70m long. At the base we recovered 40cm of
fractured slate. Silts and clays were found between 19.30 and 9.10m. They are overlain by
gravel up to 50mm in diameter.
5.14 Core SS-99-2 (Figure 5.5) is located at SX 82576 43318 about 600m south south-west of core
SS-99-1 and 15m west north west of the A379 road near the shore of the Lower Ley. The core
reached fractured bedrock at 16.23m and is 16.50m long. The uppermost 7.5m of gravel were
discarded in the field. Silts and clays were found up to 7.65m. Within the silts and clays, a unit of
sand and gravel was found between 12.42 and 10.75m depth. Gravels were up to 50mm in
diameter.
Slapton Coastal Zone Management Main Study Volume 1: Phase 1 Report (I)
August 2006, Scott Wilson
5-5
5.15 The three cores show that the transition between the upper unit of gravel and underlying silts
and clays occurs at a level of approximately 4m below OD (Figure 5.6). The thickness of the
gravel unit varies between 7.65m and 9.42m. The thickest gravel was found near the site of the
breach, suggesting that the depth of gravel is not a limiting factor in controlling the breach
potential of Slapton Sands. The cores show changes in pebble size through the core (Figure
5.8), reflecting variations in energy conditions. The silt and clay unit is between 3.58m and
10.20m thick. All cores reached bedrock between 8.34m and 14.83m below OD.
5.16 On the basis of a radiocarbon date on the lowest peat in the Ley, Morey (1976, 1983) concluded
that tidal influence in the Slapton back barrier ceased about 3000 years ago. The silts and clays
found in our cores extend under the Ley (Morey, 1976, 1983) and further offshore (Hails, 1975).
They contain microfossils (foraminifera) that are characteristic of salt marsh and tidal flat
environments. From this litho- and biostratigraphical evidence Massey (2004) concluded that,
prior to 3000 years ago, the Ley was an intertidal environment, fronted by a discontinuous
barrier system.
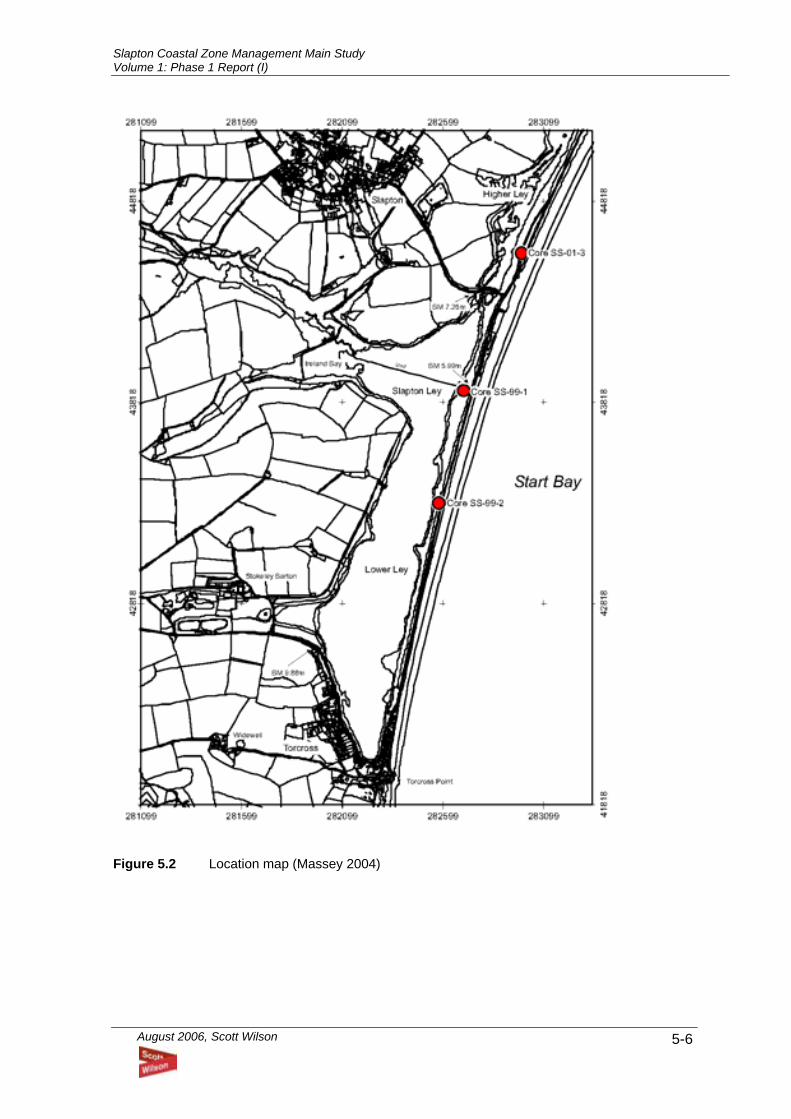
Slapton Coastal Zone Management Main Study Volume 1: Phase 1 Report (I)
August 2006, Scott Wilson
5-6
Figure 5.2 Location map (Massey 2004)
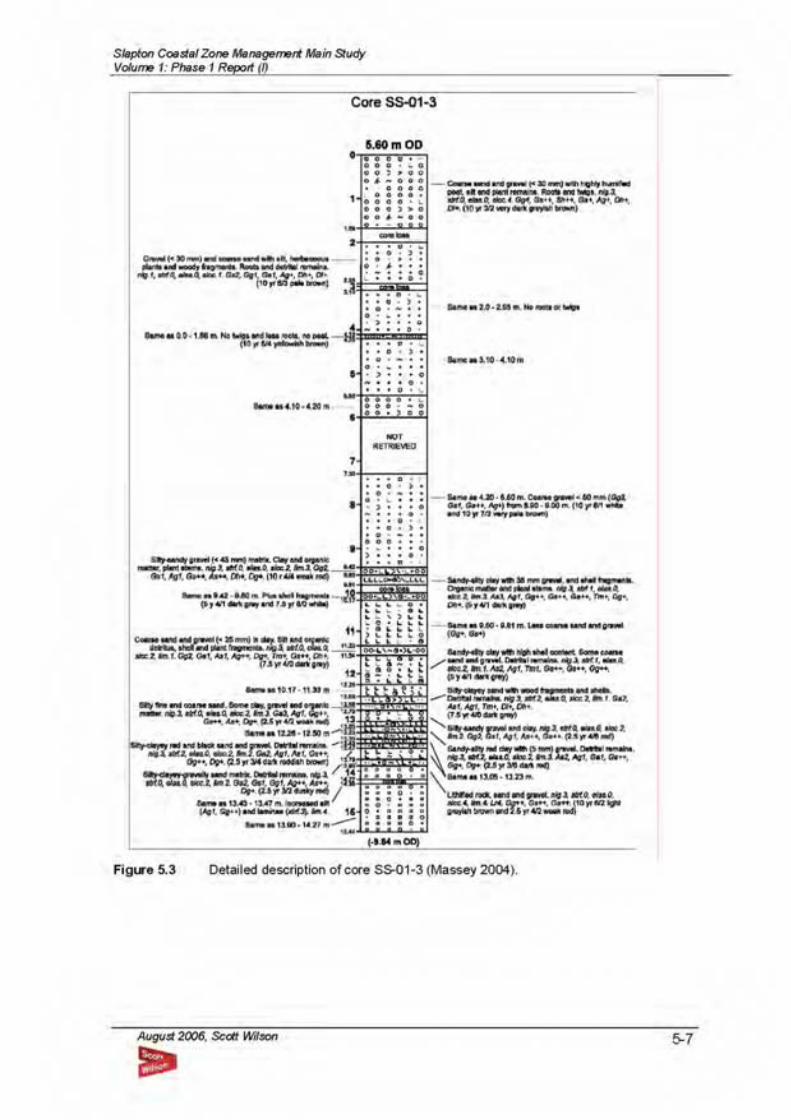
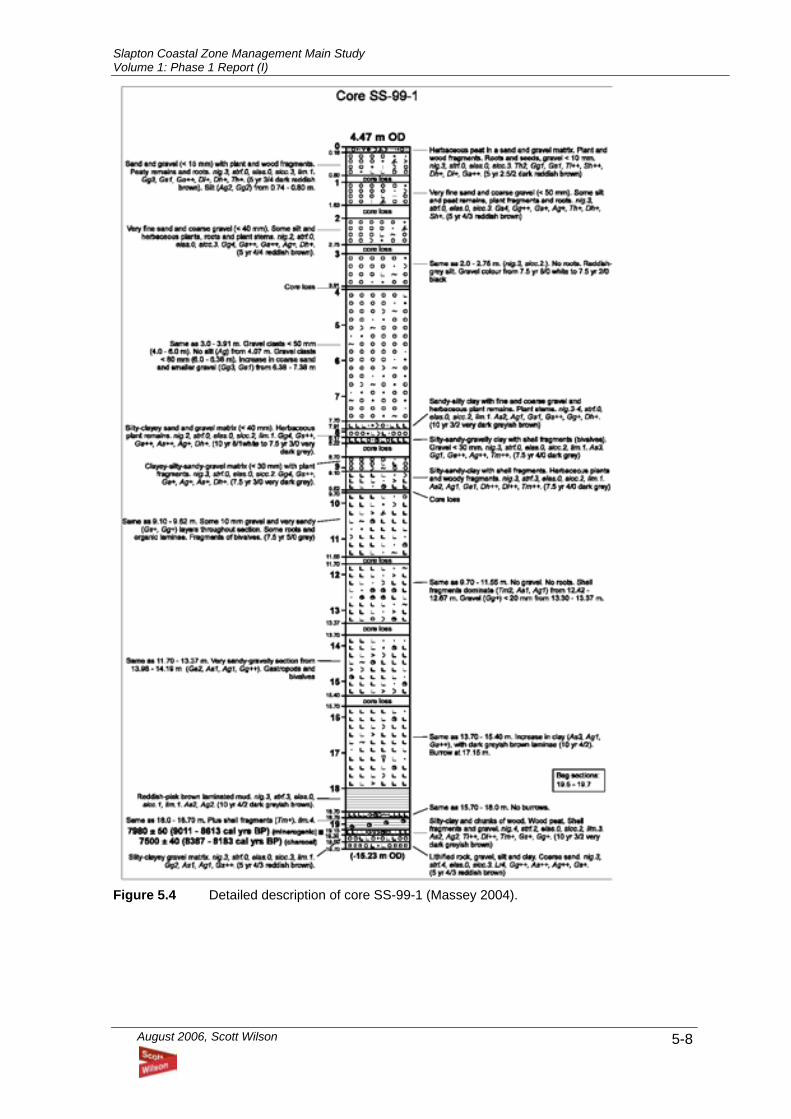
Slapton Coastal Zone Management Main Study Volume 1: Phase 1 Report (I)
August 2006, Scott Wilson
5-8
Figure 5.4 Detailed description of core SS-99-1 (Massey 2004).
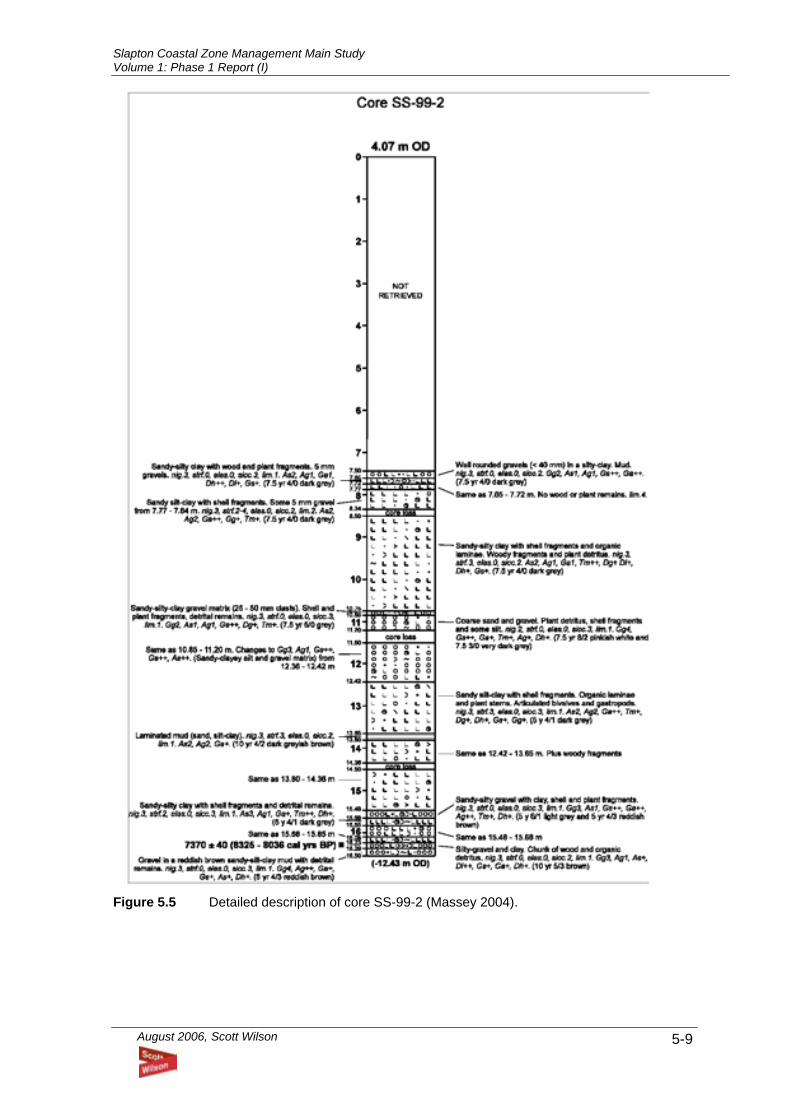
Slapton Coastal Zone Management Main Study Volume 1: Phase 1 Report (I)
August 2006, Scott Wilson
5-9
Figure 5.5 Detailed description of core SS-99-2 (Massey 2004).
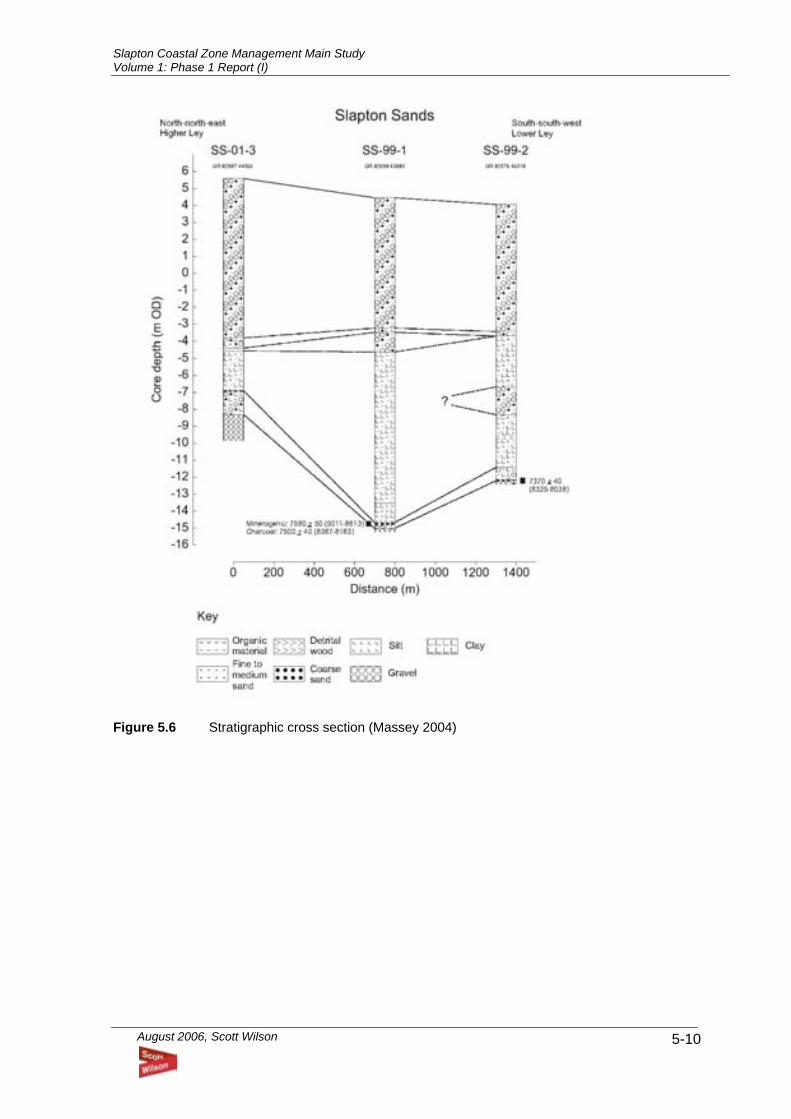
Slapton Coastal Zone Management Main Study Volume 1: Phase 1 Report (I)
August 2006, Scott Wilson
5-10
Figure 5.6 Stratigraphic cross section (Massey 2004)
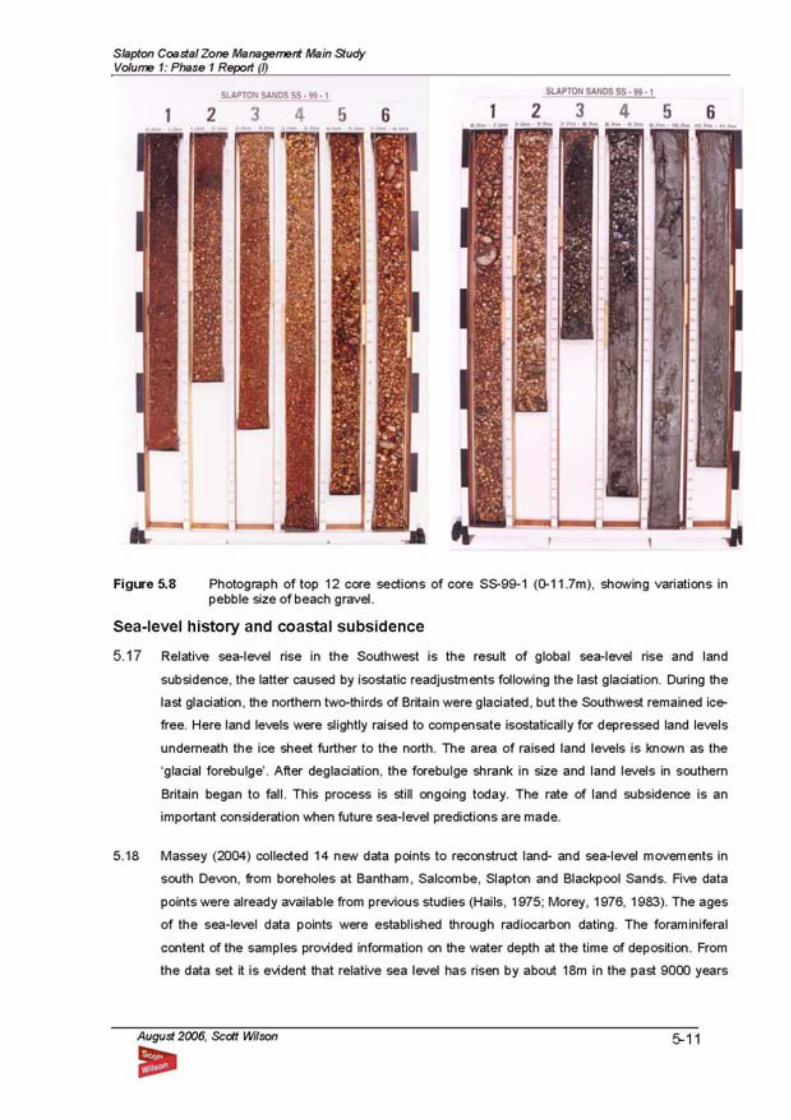
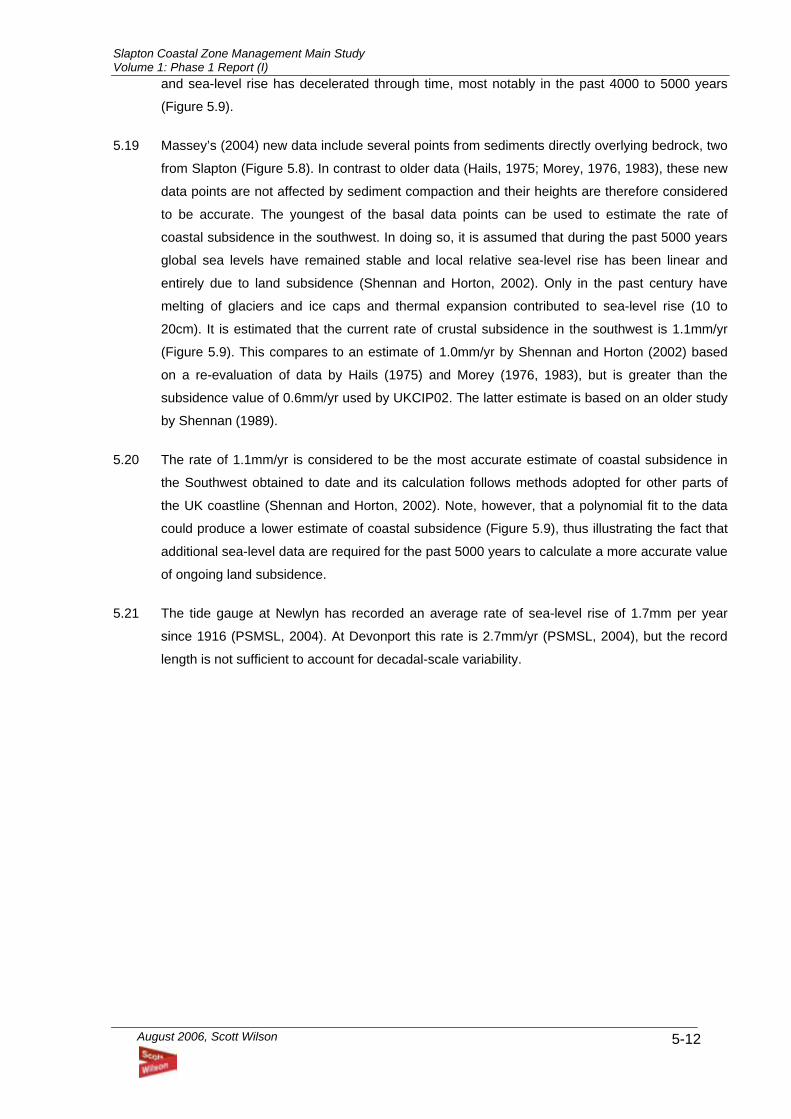
Slapton Coastal Zone Management Main Study Volume 1: Phase 1 Report (I)
August 2006, Scott Wilson
5-12
and sea-level rise has decelerated through time, most notably in the past 4000 to 5000 years
(Figure 5.9).
5.19 Massey’s (2004) new data include several points from sediments directly overlying bedrock, two
from Slapton (Figure 5.8). In contrast to older data (Hails, 1975; Morey, 1976, 1983), these new
data points are not affected by sediment compaction and their heights are therefore considered
to be accurate. The youngest of the basal data points can be used to estimate the rate of
coastal subsidence in the southwest. In doing so, it is assumed that during the past 5000 years
global sea levels have remained stable and local relative sea-level rise has been linear and
entirely due to land subsidence (Shennan and Horton, 2002). Only in the past century have
melting of glaciers and ice caps and thermal expansion contributed to sea-level rise (10 to
20cm). It is estimated that the current rate of crustal subsidence in the southwest is 1.1mm/yr
(Figure 5.9). This compares to an estimate of 1.0mm/yr by Shennan and Horton (2002) based
on a re-evaluation of data by Hails (1975) and Morey (1976, 1983), but is greater than the
subsidence value of 0.6mm/yr used by UKCIP02. The latter estimate is based on an older study
by Shennan (1989).
5.20 The rate of 1.1mm/yr is considered to be the most accurate estimate of coastal subsidence in
the Southwest obtained to date and its calculation follows methods adopted for other parts of
the UK coastline (Shennan and Horton, 2002). Note, however, that a polynomial fit to the data
could produce a lower estimate of coastal subsidence (Figure 5.9), thus illustrating the fact that
additional sea-level data are required for the past 5000 years to calculate a more accurate value
of ongoing land subsidence.
5.21 The tide gauge at Newlyn has recorded an average rate of sea-level rise of 1.7mm per year
since 1916 (PSMSL, 2004). At Devonport this rate is 2.7mm/yr (PSMSL, 2004), but the record
length is not sufficient to account for decadal-scale variability.
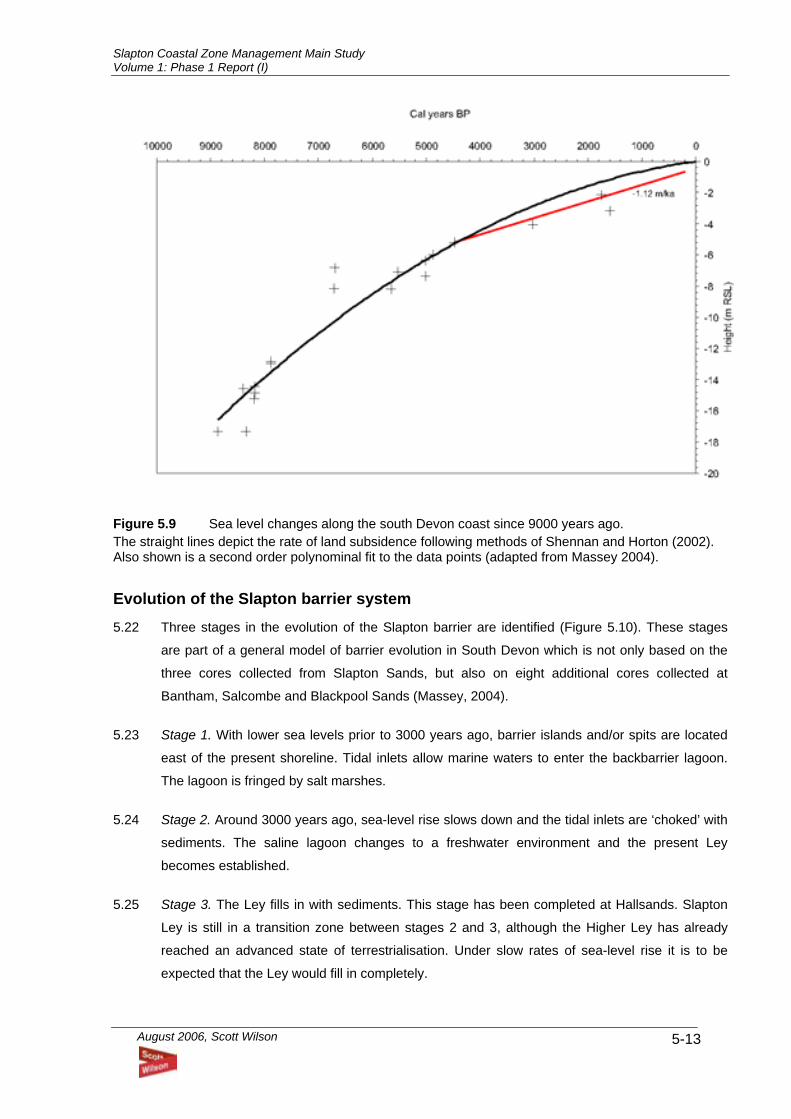
Slapton Coastal Zone Management Main Study Volume 1: Phase 1 Report (I)
August 2006, Scott Wilson
5-13
Figure 5.9 Sea level changes along the south Devon coast since 9000 years ago. The straight lines depict the rate of land subsidence following methods of Shennan and Horton (2002). Also shown is a second order polynominal fit to the data points (adapted from Massey 2004).
Evolution of the Slapton barrier system 5.22 Three stages in the evolution of the Slapton barrier are identified (Figure 5.10). These stages
are part of a general model of barrier evolution in South Devon which is not only based on the
three cores collected from Slapton Sands, but also on eight additional cores collected at
Bantham, Salcombe and Blackpool Sands (Massey, 2004).
5.23 Stage 1. With lower sea levels prior to 3000 years ago, barrier islands and/or spits are located
east of the present shoreline. Tidal inlets allow marine waters to enter the backbarrier lagoon.
The lagoon is fringed by salt marshes.
5.24 Stage 2. Around 3000 years ago, sea-level rise slows down and the tidal inlets are ‘choked’ with
sediments. The saline lagoon changes to a freshwater environment and the present Ley
becomes established.
5.25 Stage 3. The Ley fills in with sediments. This stage has been completed at Hallsands. Slapton
Ley is still in a transition zone between stages 2 and 3, although the Higher Ley has already
reached an advanced state of terrestrialisation. Under slow rates of sea-level rise it is to be
expected that the Ley would fill in completely.
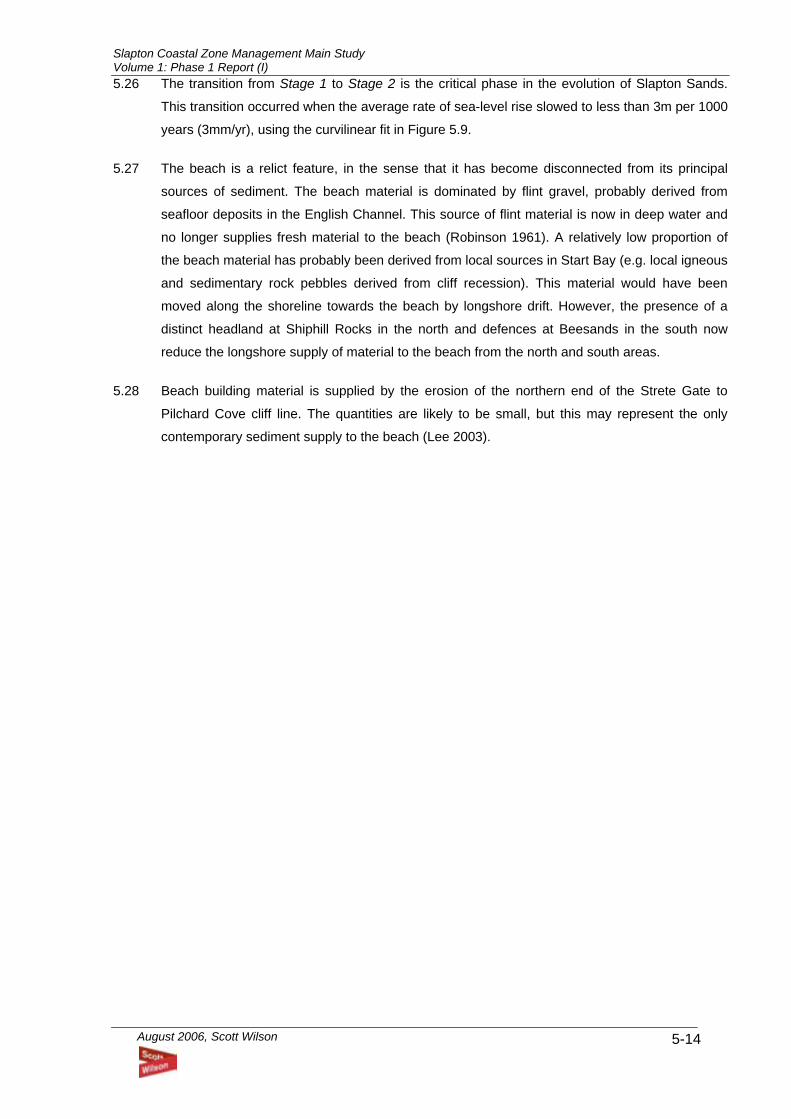
Slapton Coastal Zone Management Main Study Volume 1: Phase 1 Report (I)
August 2006, Scott Wilson
5-14
5.26 The transition from Stage 1 to Stage 2 is the critical phase in the evolution of Slapton Sands.
This transition occurred when the average rate of sea-level rise slowed to less than 3m per 1000
years (3mm/yr), using the curvilinear fit in Figure 5.9.
5.27 The beach is a relict feature, in the sense that it has become disconnected from its principal
sources of sediment. The beach material is dominated by flint gravel, probably derived from
seafloor deposits in the English Channel. This source of flint material is now in deep water and
no longer supplies fresh material to the beach (Robinson 1961). A relatively low proportion of
the beach material has probably been derived from local sources in Start Bay (e.g. local igneous
and sedimentary rock pebbles derived from cliff recession). This material would have been
moved along the shoreline towards the beach by longshore drift. However, the presence of a
distinct headland at Shiphill Rocks in the north and defences at Beesands in the south now
reduce the longshore supply of material to the beach from the north and south areas.
5.28 Beach building material is supplied by the erosion of the northern end of the Strete Gate to
Pilchard Cove cliff line. The quantities are likely to be small, but this may represent the only
contemporary sediment supply to the beach (Lee 2003).
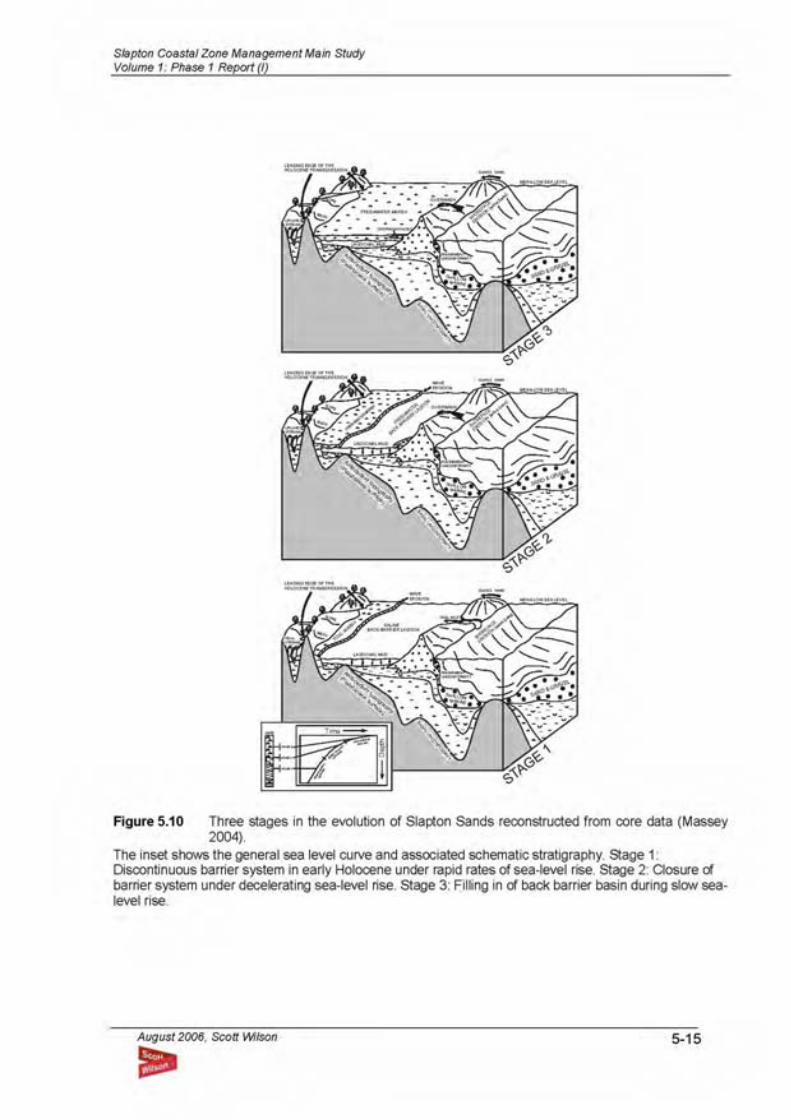
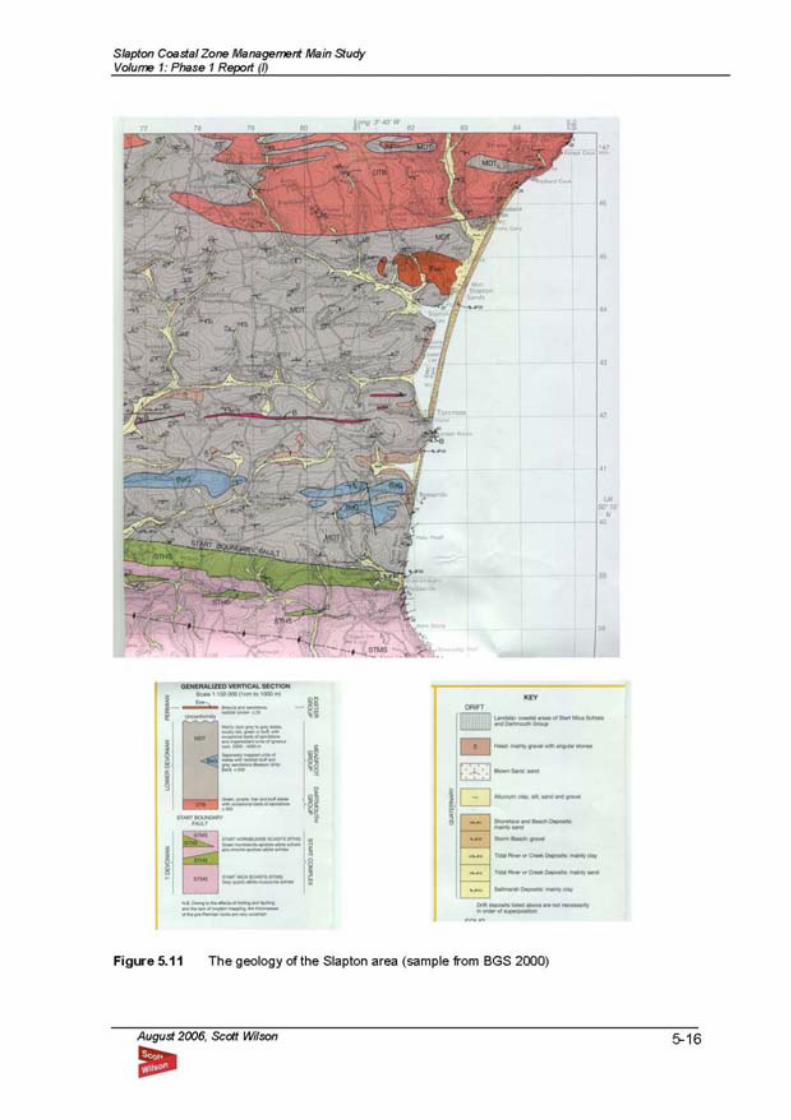
Slapton Coastal Zone Management Main Study Volume 1: Phase 1 Report (I)
August 2006, Scott Wilson
5-17
Slapton Sands: Contemporary Behaviour 5.29 The barrier beach ridge has experienced periodic wash-over caused by storm waves and this
has allowed the whole landform to transgress landward (roll-over) and rise in crest height, in
response to rising sea levels. Wash-over fans are seen along the length of the beach although
these are poorly developed compared to many similar systems (e.g. Chesil Beach).
5.30 A number of processes are at work on the Slapton shoreline:
• Short-term changes in beach profile due to storms, acting over a period of several days.
These storms may cause cut-back of the seaward edge of the shingle crest, or changes in
crest elevation
• Overtopping, in which wave action throws sediment and water onto the crest
• Overflowing, or overwashing, where extremely high water levels coincident with wave action
cause water to flow over the crest of the ridge. This can cause significant changes to the
crest and backslope of the ridge.
• Medium-term changes in beach width and profile due to longshore transport, occurring over
a period of months or several years
• Long-term landward retreat; the barrier beach responds to sea level by “roll-over” and by
increasing its crest height. This process involves overwashing, transferring sediment from
the shore-face to the back barrier area. This is an episodic rather than a continuous
process.
• Planform change; as the barrier beach is pinned by hard rock cliffs at either end (Strete and
Torcross), landward retreat results in a gradual increase in both curvature and length.
Pethick (2001) noted that since the total volume of sediment is fixed, so the volume of
sediment per unit beach length will decrease as the barrier extends.
5.31 Figure 10.25 in Volume 2 illustrates the short-term processes.
5.32 Contemporary beach behaviour involves brief episodes of overwashing and erosion, followed by
longer periods of recovery during which the “damage” caused by storm events is “healed” during
overtopping events (Orford 2001). The extent to which the beach can recover from a particular
storm is conditional on the precise timing and sequence of subsequent storm events. Areas of
“damage” (i.e. crest lowering) can be the focus of future overwashing events and, ultimately,
become vulnerable to erosion events.
5.33 As this system is believed to be a closed sediment system, receiving no additional beach
building material, the changes in beach height and curvature that occur in response to sea-level
rise are at the expense of changes in beach width. The volume of beach material stays the
same; it is simply re-organised to adjust to changing sea level.
Slapton Coastal Zone Management Main Study Volume 1: Phase 1 Report (I)
August 2006, Scott Wilson
5-18
5.34 Pethick (2001) suggested that the Slapton beach system is probably entering the breakdown
stage of the Carter-Orford model for gravel barriers (Orford et al 1996). The barrier would
become increasingly vulnerable to crest erosion, as breakdown is generally associated with a
lack of sediment volume in the beach face that can be mobilised to “heal” the effects of storm
action. In the short-term there would be considerable uncertainty about the potential for crest
erosion, reflecting the random nature of storm event sequences. Over a 50-year period there will
be periods of barrier stability separated by overwashing events during major storms during
which localised crest erosion may occur. The probability of this erosion will be increasing over
time because of the progressive decline in beach width.
5.35 Porlock barrier beach, Somerset was considered by Pethick (2001) as a useful analogue to the
Slapton barrier. At Porlock breaching occurred in 1996 and a tidal lagoon developed extremely
rapidly. Using this Porlock as an example, Pethick (2001) suggested that the tidal prism that
would be generated by a breach at Slapton would be around 400,000m3; this volume of water
entering the Ley in the less than 3hours available on the high tide could result in a breach width
of around 50m.
Geomorphological Interest 5.36 The barrier beach and lagoon system have been designated as:
• Site of Special Scientific Interest
• National Nature Reserve
• Area of Outstanding Natural Beauty
• Heritage Coast
• Geological Conservation Review Site
5.37 Slapton is an important site for coastal geomorphology. It is a classic shingle bar enclosing a
lagoon, Slapton Ley. To the north, the bar is backed by an in-filled former arm of the lagoon and
by cliffs of lower Devonian slates and grits. Very little local material occurs in the beach, which
consists of flint and chert shingle. There are few such features on the coast of Britain, and along
the English Channel, Slapton provides an unusual combination of shingle material and an
easterly aspect. Slapton has been the focus of considerable research interest and is a major site
for educational studies.
5.38 The cliff line and beach north of Strete Gate is also of geomorphological interest because it
forms part of an inter-linked physical system i.e. a cliff-beach system. The linkage involves two
important activities:
• the beach provides natural coast protection to the cliffs;
• the cliffs supply sediment to the beach.
Slapton Coastal Zone Management Main Study Volume 1: Phase 1 Report (I)
August 2006, Scott Wilson
5-19
Slapton Sands: Projected Evolution Introduction
5.39 The objective of this section is to provide a detailed projection for Slapton and adjacent
beaches, assuming that the existing defences remain in place, but without repair or
maintainance, and that there is no further road maintenance (i.e. a “do nothing” scenario).
5.40 A discussion of the shingle beach evolution pathways is presented to provide a conceptual
framework for evaluating the potential changes that might occur at Slapton. This is based on
the ideas presented in Cowell and Thom (1994), Forbes et al (1995) and Orford et al (1996).
The future evolution pathways are discussed with reference to:
• the current beach conditions, past evolutionary trends and constraints to future evolution;
• the barrier migration potential, inlet stability and the residual effectiveness of the coastal
defences.
5.41 These ideas are then brought together as a conceptual evolution model, which sets out the
changes that are expected to occur along particular sections of the beach, over a series of
discrete time steps.
Conceptual Framework
5.42 Shingle beaches can evolve towards a series of distinct states: barrier beaches, barrier island
and inlet complexes and fringing beaches. The transition between states will be associated with
storm events. However, the evolving beach form (e.g. changing shoreline orientation or crest
height) will also influence sediment transport processes and, hence, future beach behaviour.
The constraints imposed by the geological and topographic setting (e.g. headlands and high
ground inland of lagoons) will also have a major influence on the evolution pathways.
5.43 There can be considerable uncertainties associated with shingle beach evolution. However,
during a storm event there is the possibility that there will be a change in beach state (Table 5.1
and Figure 5.12). Some changes are more likely than others. The likelihood that the beach will
evolve along a particular pathway will be influenced by:
• the current state of the beach system;
• the environmental conditions, including the rate of relative sea-level rise and sediment
availability;
• the geological and topographic setting.
5.44 The chance of particular state change occurring will vary over time, as the beach form and
sediment transport processes change. For example, the chance of the transition from a barrier
to an island/inlet complex will vary with changes in the overwashing ratio (the proportion of
Slapton Coastal Zone Management Main Study Volume 1: Phase 1 Report (I)
August 2006, Scott Wilson
5-20
waves of sufficient magnitude to generate overwash events). This is a function of the wave
climate and the barrier crest height relative to sea level.
5.45 Some states are effectively evolutionary dead-ends. For example, once a fringing beach has
developed at the foot of an eroding cliff line the evolutionary options are severely restricted
unless the relative sea-level change (i.e. eustatic or isostatic) is sufficient to cause inundation of
the hinterland and allow barrier or island/inlet development.
Table 5.1 Beach States and Evolution Options Current State
Process
Future State
Landward migration Barrier Landward migration Fringing beach (attachment onto
hinterland slopes) Overstepping Fringing beach
Barrier
Breach Island and inlet complex Tidal flows Island and inlet complex Longshore transport Barrier (breach infill)
Island and Inlet Complex Landward migration Fringing beach (attachment onto
hinterland slopes) Landward migration Fringing beach Flooding of hinterland (rising sea-level)
Barrier Fringing beach
Flooding of hinterland (rising sea-level)
Island and inlet complex
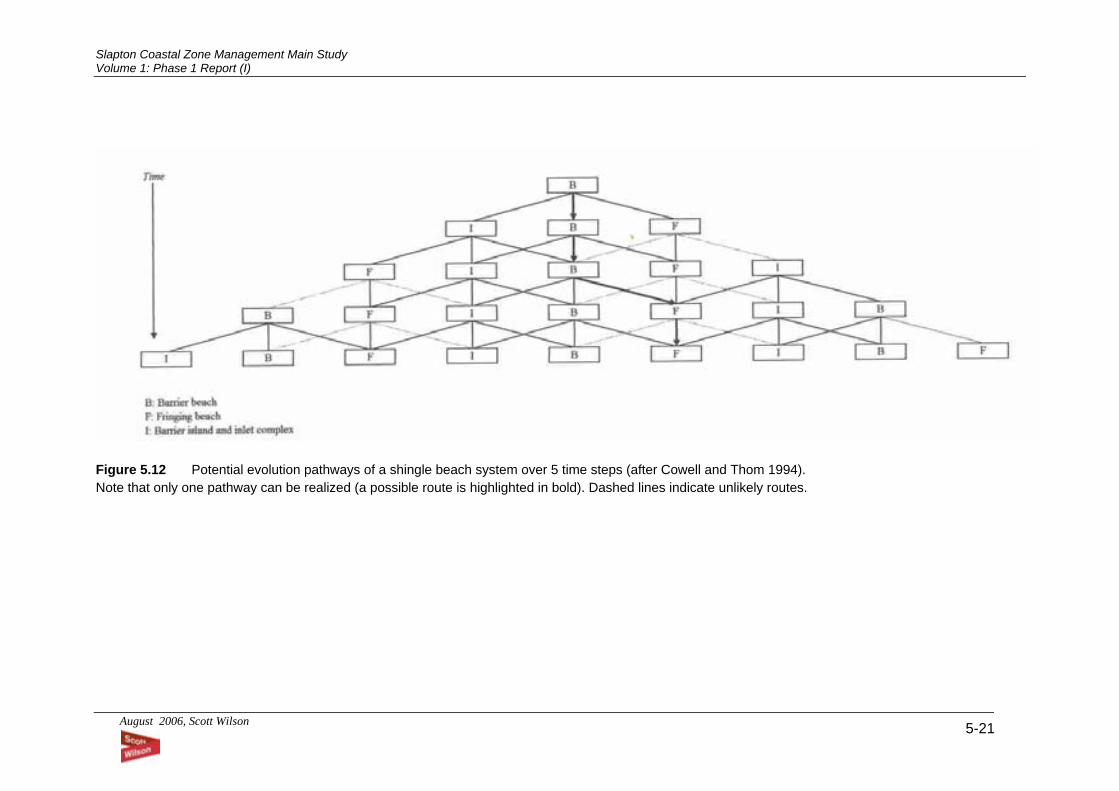
Slapton Coastal Zone Management Main Study Volume 1: Phase 1 Report (I)
August 2006, Scott Wilson 5-21
Figure 5.12 Potential evolution pathways of a shingle beach system over 5 time steps (after Cowell and Thom 1994). Note that only one pathway can be realized (a possible route is highlighted in bold). Dashed lines indicate unlikely routes.
Slapton Coastal Zone Management Main Study Volume 1: Phase 1 Report (I)
August 2006, Scott Wilson
5-22
Slapton Beach: Current Conditions
5.46 The present-day beach comprises a gravel-dominated, swash-aligned barrier beach that
extends between Torcross and Pilchard Cove. The beach can be sub-divided into three distinct
morphological units ( see Figure 5.13):
• Unit 1 a fringing beach, backed by a cliffline (the Strete Gate to Pilchard Cove cliffline;
1.25km). The cliffline is developed in Lower Devonian metamorphosed argillaceous
sediments of the Dartmouth Group. The cliffs have a composite profile comprising a steep to
near-vertical lower seacliff and a slacker upper section (i.e. the “slope over wall” typical of
the periglacial-shaped clifflines of south-west England).
• Unit 2 a barrier beach extending from Strete Gate to Slapton Bridge (1.4km) backed by the
Higher Ley which supports rich fen vegetation and wet willow woodland (carr). The River
Gara drains into the Higher Ley. The road has been set back landward toward the ley, in the
area of the damage that occurred during the January 2001 storms (Unit 2a). Some boulders
were in place during construction as a hard defence but these have since been removed.
• Unit 3 a barrier beach extending from Slapton Bridge to Torcross (2.3km) backed by the
Lower Ley, a perched, freshwater lake. The Start River and Stokely Stream flow into the
Ley. The water levels in the Ley are controlled by a culvert and weir at Torcross. The widest
part of the lake, around the entrance of the Start River, is known as “Ireland Bay”. A series
of coast protection elements have been constructed along the southern part of this unit (Unit
3a; extending around 1.2km north from Torcross Point).
5.47 Amongst the more significant factors that can be expected to influence future beach behaviour
are:
• The beach was formed in the early to mid-Holocene and is now a relict feature, in the sense
that it has become disconnected from its principal sources of sediment. The beach material
is dominated by flint gravel, probably derived from seafloor deposits in the English Channel.
This source of flint material is now in deep water and no longer supplies fresh material to the
beach (Robinson 1961).
• The evolutionary history of the beach has involved the transition between different states.
Prior to 3000 years ago, the system comprised a barrier island and inlet complex, located
east of the present shoreline. Around 3000 years ago the tidal inlets were blocked by beach
sediments, forming a continuous barrier beach. This transition is believed to be associated
with a slow-down in the rate of sea-level rise (Massey 2004).
• It is believed that the barrier has migrated landwards throughout the last 3000+ years, in
response to rising sea-levels during this time period. At some date in the last 3000 years the
northern section of the beach migrated back to the foot of the Strete Gate to Pilchard Cove
cliffline and became a fringing beach.
Slapton Coastal Zone Management Main Study Volume 1: Phase 1 Report (I)
August 2006, Scott Wilson
5-23
• The contemporary evolution of the beach has involved brief episodes of overwashing and
crest erosion, followed by longer periods of recovery during which the “damage” caused by
storm events is “healed” during overtopping events. For example, during the storms of
December 2000 waves reached the road; one car was engulfed by a large wave (Slapton
Ley National Nature Reserve, undated). Around 50 tons of shingle was transported onto the
road (it was later moved back by the local authority). In January 2001 there was severe
storm damage to a section of the road north of the Monument (Unit 2), where the road was
undermined for a 100m section. Around 500 tons of shingle was transported onto the road,
including some larger material.
• Job (2001) presents evidence that, between 1972 and 1995, the beach face has retreated
by 10m (Unit 2; Strete Gate), 28m (Unit 3; Middle Car Park) and 17m (Unit 3a; Torcross).
The mean retreat rate in the centre of the barrier beach, at Middle Car Park, was shown to
be 1.2m per year. There is, however, no evidence of barrier migration over this period i.e.
the landward movement of the entire barrier system.
• There have been no reported breach incidents i.e. the development of inlets allowing tidal
exchanges between the sea and the Leys.
• Retreat of the fringing beach (Unit 1) has been negligible (<1m/100 years; Lee 2003).
• The future evolutionary pathways are constrained by the hinterland topography. The beach
system is backed by eastwards plunging ridges that form part of an undulating, dissected
plateau developed in Lower Devonian slates of the Meadfoot Group and, around Slapton
village, Permian breccias and sandstones. The hill slopes are likely to be mantled by
periglacial head deposits. These head deposits extend beneath the beach, as confirmed by
the presence of reddish-brown gravels in the boreholes described in Massey (2004). Note
that the 2001 storm damage was reported to have exposed the underlying geology
(presumably head deposits) beneath the beach face.
• The ridges are potential future anchor points for the beach. Anchoring will result in the
transition from a barrier or island/inlet state to a fringing beach. Note that the ridge foot
behind the Higher Ley (Unit 2) has a crenulated form, whereas the ridge foot behind the
Lower Ley (Unit 3) is smooth.
• The plateau is drained by a number of small streams that flow through narrow floodplains
into the Leys (River Gara, Start River and Stokely Stream). These floodplains are potential
low-lying wetland sites (i.e. lake/lagoon or fen carr habitats) across which the beach could
continue to migrate.
• Coast protection works will act as anchor points on the shoreline. The defences will ensure
that the protected sections will remain static, whilst the adjacent unprotected sections will be
able to respond to storm events and sea-level rise. The net result will be “two speed” barrier
evolution and the sub-division of the barrier beach into a series of sediment sub-cells.
Unprotected sub-cells will be affected by erosion on the updrift sections, feeding the
Slapton Coastal Zone Management Main Study Volume 1: Phase 1 Report (I)
August 2006, Scott Wilson
5-24
continued sediment supply to the down-drift sections. This process has been described as
“cannibalisation” (Orford et al 1996).
Slapton Beach: Potential for Future Evolution
5.48 The future evolutionary pathways available for the beach system will be determined by:
• landward barrier migration; this will define the potential for the barrier to roll-over in response
to rising sea-levels;
• the distance between the barrier and the hinterland slopes; this will determine the timeframe
over which the barrier will evolve into a fringing beach, anchored against the hinterland slopes.
The rate of barrier migration will determine the timescale over which these changes could be
expected to occur on different sections of the beach;
• inlet stability; this will determine whether a breach in the barrier fronting the Lower Ley (Unit 3)
could remain open i.e. the potential for the barrier to change to an island/inlet complex.
• the performance of the coast protection structures; this will determine the time period over
which the barrier beach migrates as a “two speed” structure and is affected by fragmentation
into sub-cells and internal cannibalisation.
5.49 Barrier beaches tend to respond to sea-level rise by “roll-over” and by increasing the crest
height (e.g. Orford et al 1995). This process involves overwashing, transferring sediment from
the shore-face to the back barrier area. This is an episodic rather than a continuous process.
McKenna et al (1995) have reviewed the impact of these recent sea-level changes on shingle
beaches on the west coast of Britain. A number of responses were identified:
• Type 1; beaches which have been progressively driven onshore under rising sea-level. For
example, at Westward Ho! the barrier retreats around 0.3m for every 1mm rise in sea-level
• Type 2; beaches which remained static and then underwent a period of rapid retreat. At Aber
Mawr, in Wales, the beach remained stationary until the 1960s after which it retreated some
50m.
5.50 Comparison of barrier retreat rates in Europe and Canada by Orford et al., (1995) suggests that
the retreat efficiency (the change in retreat rate per unit increase in the rate of sea-level rise) is
related to the barrier size or barrier inertia (i.e. cross sectional area x crest height). Figure 5.14
presents the relationship between retreat efficiency and barrier inertia. From this relationship,
the Slapton barrier (cross sectional area of around 450m2 and crest height of 6m, inertia =
2700m3/m) might be expected to have a retreat efficiency of around 0.2.
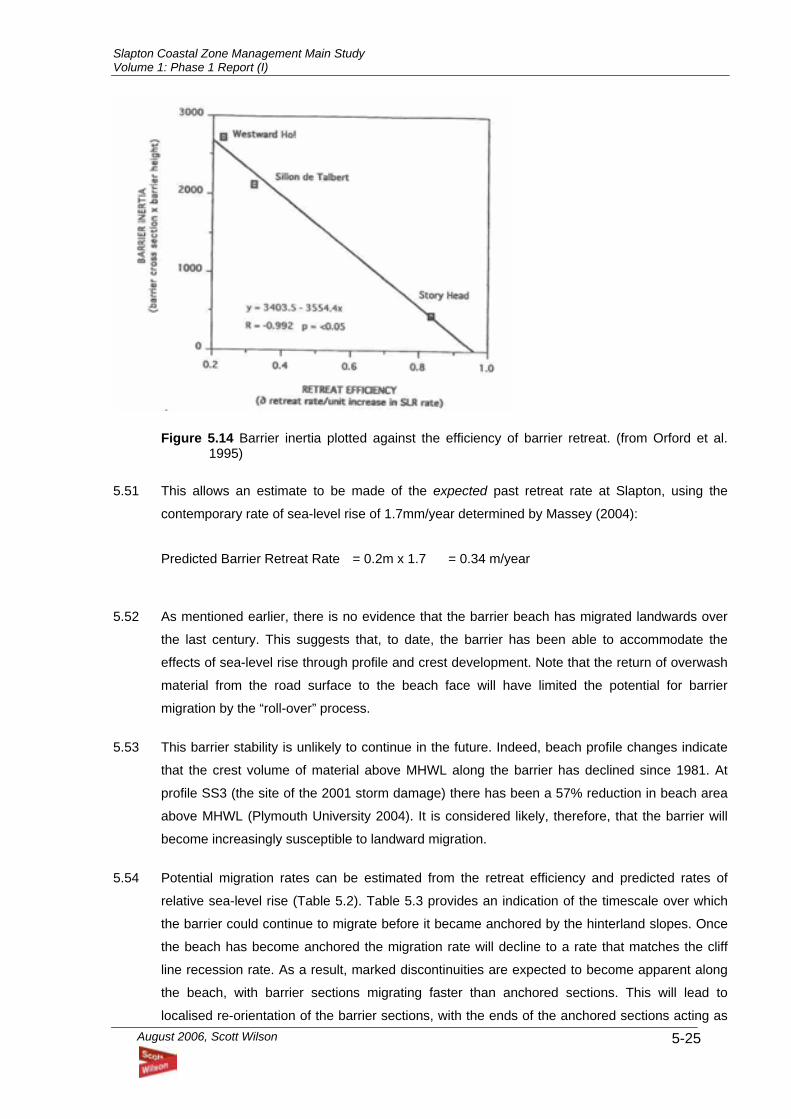
Slapton Coastal Zone Management Main Study Volume 1: Phase 1 Report (I)
August 2006, Scott Wilson
5-25
Figure 5.14 Barrier inertia plotted against the efficiency of barrier retreat. (from Orford et al. 1995)
5.51 This allows an estimate to be made of the expected past retreat rate at Slapton, using the
contemporary rate of sea-level rise of 1.7mm/year determined by Massey (2004):
Predicted Barrier Retreat Rate = 0.2m x 1.7 = 0.34 m/year
5.52 As mentioned earlier, there is no evidence that the barrier beach has migrated landwards over
the last century. This suggests that, to date, the barrier has been able to accommodate the
effects of sea-level rise through profile and crest development. Note that the return of overwash
material from the road surface to the beach face will have limited the potential for barrier
migration by the “roll-over” process.
5.53 This barrier stability is unlikely to continue in the future. Indeed, beach profile changes indicate
that the crest volume of material above MHWL along the barrier has declined since 1981. At
profile SS3 (the site of the 2001 storm damage) there has been a 57% reduction in beach area
above MHWL (Plymouth University 2004). It is considered likely, therefore, that the barrier will
become increasingly susceptible to landward migration.
5.54 Potential migration rates can be estimated from the retreat efficiency and predicted rates of
relative sea-level rise (Table 5.2). Table 5.3 provides an indication of the timescale over which
the barrier could continue to migrate before it became anchored by the hinterland slopes. Once
the beach has become anchored the migration rate will decline to a rate that matches the cliff
line recession rate. As a result, marked discontinuities are expected to become apparent along
the beach, with barrier sections migrating faster than anchored sections. This will lead to
localised re-orientation of the barrier sections, with the ends of the anchored sections acting as
Slapton Coastal Zone Management Main Study Volume 1: Phase 1 Report (I)
August 2006, Scott Wilson
5-26
hinge points. Over time, the beach will become fragmented into sub-cells, within which localised
patterns of erosion and accretion will become established (i.e. cannibalisation).
Table 5.2 Estimated Barrier Migration Rates
Scenario Relative Sea-Level Rise by 2080 (cm)*
Relative Sea-Level Rise (mm/year)
Retreat Efficiency
Estimated Barrier Migration Rate (m/year)
Low emission scenario
23 2.5 0.2 0.5
High emission scenario
36 4 0.2 0.8
Note: * sea-level rise based on a report by UKCIP 02, Climate change scenarios for the UK (2002). Commissioned by DEFRA.
5.55 It should be noted that all projected sea level increases due to global warming show an
accelerating sea level rise, not a step change. Therefore under all scenarios the rate of sea
level rise starts at current rates (1.7mm/year as estimated by Massey) and then accelerates.
5.56 The additional increase in Barrier Migration Rate arising from the high emission scenario will not
start to be significant until year 50. Therefore even under the high emission scenario, the rate of
retreat over the first 50 years is still only 0.6m/year. After this it increases rapidly.
5.57 Using the factor of 0.2 as proposed earlier gives the following retreat distances:
• Low and high emission scenarios: 8m and 10m respectively by year 20,
• Low emission scenario: 20m by year 50
• High emission scenario: 30m by year 50
• Low emission scenario: 50m by year 100
• High emission scenario: 80m by year 100
5.58 Migration is unlikely to be a gradual process, proceeding at a uniform annual rate. Periods of
rapid retreat should be expected, separated by periods during which the barrier remains
stationary. It is possible that overstepping may occur, especially if the rate of sea-level rise is
similar to that predicted under the high emissions scenario. Overstepping would involve the
rapid onshore movement of the upper part of the barrier whilst the lower part would remain
stranded on the seabed (i.e. drowned).
Slapton Coastal Zone Management Main Study Volume 1: Phase 1 Report (I)
August 2006, Scott Wilson
5-27
Table 5.3 Estimated Barrier Migration Timescales Beach Unit Distance to
Hinterland Slopes (m)
Low emission scenario: Migration Timescale (Years)
High emission scenario: Migration Timescale (Years)
2 (Strete Gate to Slapton Bridge)
Max: 150m Min: 50m
Max: 300 Min: 100
Max:150 Min: 80
3 (Slapton Bridge to Torcross)
Max: 400m Mid: 200m* Min: 75m
Max: 800 Mid: 400* Min: 150
Max:200 Mid: 150 Min: 100
Note: * The “mid” point refers to the hinterland slopes on the south side of Ireland Bay.
5.59 Forbes et al (1991) suggest that overstepping is related to the combination of reduced beach
volumes and very shallow back-barrier lake or lagoon levels. Such conditions will become more
likely as the barrier migrates landward, especially after Unit 3 becomes anchored to the
hinterland at the southern end of Unit 2. As the unanchored section of the barrier continues to
roll landward, so its curvature and length would increase. Since the total volume of sediment is
fixed, so the volume of sediment per unit beach length decreases. This will increase the
potential for overstepping.
5.60 The potential for the transition between the current barrier beach and an island/inlet complex is
a function of the stability of the inlets created during breach events (i.e. during major storms). A
simple measure of inlet stability has been developed by Bruun and Gerritsen (1960) and Bruun
et al (1978):
Stability Rating = P/M, where P is the tidal prism and M is the total annual littoral drift. The
stability of an inlet is rated good, less satisfactory and unstable as given in Table 5.4.
Table 5.4 Inlet Stability Ratings (Bruun et al 1978)
P/M Ratio Comment
P/M >150 Conditions are relatively good, little bar and good flushing P/M 100-150
Conditions become less satisfactory, and offshore bar formation becomes more pronounced
P/M 50-100 Entrance bar may be rather large, but there is usually a channel through the bar
P/M 20-50 All inlets are typical “bar-bypassers” P/M <20 Descriptive of cases where the entrances become unstable
“overflow channels” rather than permanent inlets
Slapton Coastal Zone Management Main Study Volume 1: Phase 1 Report (I)
August 2006, Scott Wilson
5-28
5.61 The tidal prism of a tidal lagoon behind Unit 3 (i.e. the Lower Ley area) has been estimated to
be 400,000m3 (Pethick 2001), whereas the longshore sediment transport rates are in the order
of 75,000m3 (Plymouth University 2004). This yields an inlet stability rating of 5, indicative of an
unstable channel rather than a permanent inlet. This suggests that it is unlikely that a breach
would remain as a permanent inlet. Indeed, if barrier migration proceeds, then the intertidal area
of the Lower Ley and, hence the tidal prism, will decrease, further reducing the stability rating.
5.62 Under a “do nothing” scenario there would be no further investment in the coast protection
works i.e. no maintenance or repairs (including the return of overwashed shingle from the road
surface to the beach face). Under these management conditions it is likely that the defences
would have a relatively short-term influence on beach behaviour. This timescale can be
envisaged as comprising the residual life of the structures (i.e. the timescale over which they will
continue to perform their coast protection function of preventing crest and beach face erosion)
and an extended life period during which they continue to restrict the rate of barrier migration.
Slapton Beach: Conceptual Evolution Model
5.63 Figure 5.7 (Volume II) presents a conceptual model of the future evolution of Slapton beach,
5.64 based on the following assumptions:
• there will be no future investment in coastal defences or road maintenance (i.e. a “do
nothing” scenario);
• the barrier will migrate inland in response to sea-level rise. The migration rate will be a
function of the retreat efficiency and the rate of sea-level rise;
• barrier breaching will not lead to permanent inlet formation;
• existing coast protection structures will have no influence on the barrier migration rates
after 50 years at latest;
• low emissions scenario
Table 5.5 summarises the expected trends and conditions within each of the three beach units.
5.65 It is predicted that the barrier beach sections (Units 2 and 3) will be progressively transformed
into fringing beaches as they migrate landwards and become anchored against the hinterland
slopes. This process is expected to occur over the next 80-800 years, depending on the rate of
sea-level rise and the barrier retreat efficiency. These changes would lead to the blocking of the
Gara, Start and Stokely Stream valleys, where lakes and marshes are expected to form.
5.66 Beach evolution will be effected by a combination of overtopping and overwashing events during
storms. The potential for barrier overstepping is expected to increase with time. Breaches can

Slapton Coastal Zone Management Main Study Volume 1: Phase 1 Report (I)
August 2006, Scott Wilson
5-29
be expected along the barrier sections, although these are unlikely to become permanent
features because of the low tidal prism of the back-barrier lakes/lagoons.
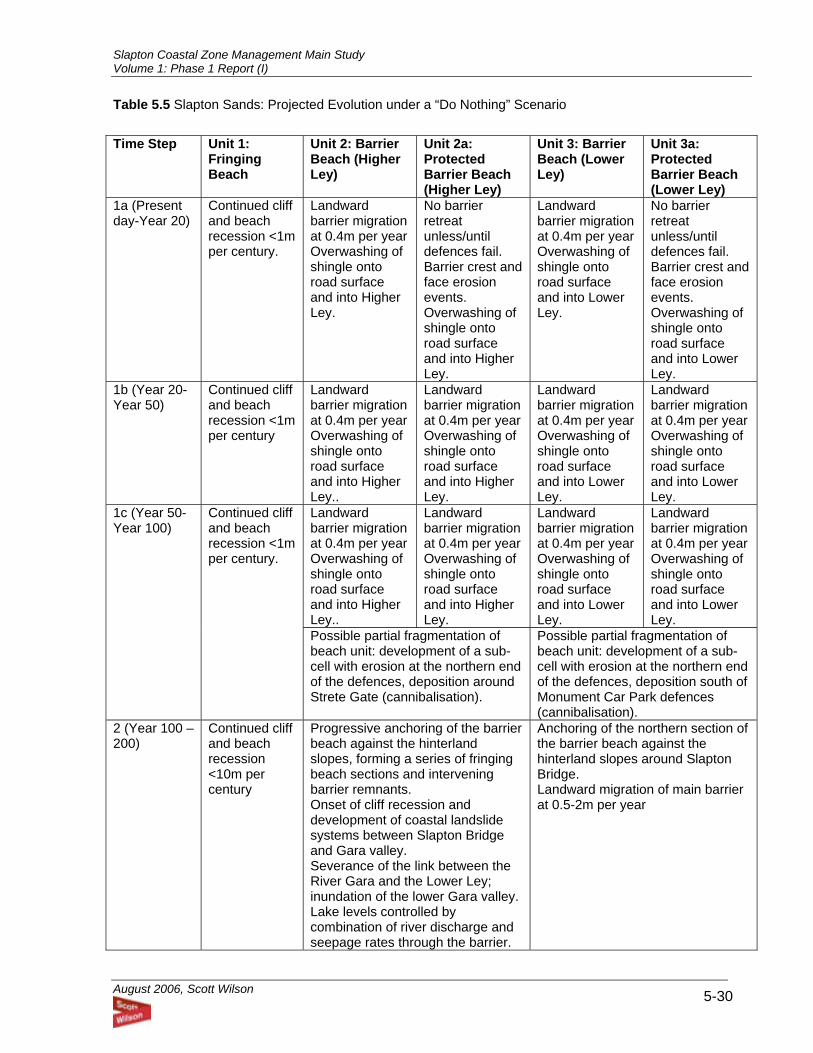
Slapton Coastal Zone Management Main Study Volume 1: Phase 1 Report (I)
August 2006, Scott Wilson
5-30
Table 5.5 Slapton Sands: Projected Evolution under a “Do Nothing” Scenario Time Step Unit 1:
Fringing Beach
Unit 2: Barrier Beach (Higher Ley)
Unit 2a: Protected Barrier Beach (Higher Ley)
Unit 3: Barrier Beach (Lower Ley)
Unit 3a: Protected Barrier Beach (Lower Ley)
1a (Present day-Year 20)
Continued cliff and beach recession <1m per century.
Landward barrier migration at 0.4m per year Overwashing of shingle onto road surface and into Higher Ley.
No barrier retreat unless/until defences fail. Barrier crest and face erosion events. Overwashing of shingle onto road surface and into Higher Ley.
Landward barrier migration at 0.4m per year Overwashing of shingle onto road surface and into Lower Ley.
No barrier retreat unless/until defences fail. Barrier crest and face erosion events. Overwashing of shingle onto road surface and into Lower Ley.
1b (Year 20-Year 50)
Continued cliff and beach recession <1m per century
Landward barrier migration at 0.4m per year Overwashing of shingle onto road surface and into Higher Ley..
Landward barrier migration at 0.4m per year Overwashing of shingle onto road surface and into Higher Ley.
Landward barrier migration at 0.4m per year Overwashing of shingle onto road surface and into Lower Ley.
Landward barrier migration at 0.4m per year Overwashing of shingle onto road surface and into Lower Ley.
1c (Year 50-Year 100)
Continued cliff and beach recession <1m per century.
Possible partial fragmentation of beach unit: development of a sub-cell with erosion at the northern end of the defences, deposition around Strete Gate (cannibalisation).
Possible partial fragmentation of beach unit: development of a sub-cell with erosion at the northern end of the defences, deposition south of Monument Car Park defences (cannibalisation).
2 (Year 100 – 200)
Continued cliff and beach recession <10m per century
Progressive anchoring of the barrier beach against the hinterland slopes, forming a series of fringing beach sections and intervening barrier remnants. Onset of cliff recession and development of coastal landslide systems between Slapton Bridge and Gara valley. Severance of the link between the River Gara and the Lower Ley; inundation of the lower Gara valley. Lake levels controlled by combination of river discharge and seepage rates through the barrier.
Anchoring of the northern section of the barrier beach against the hinterland slopes around Slapton Bridge. Landward migration of main barrier at 0.5-2m per year
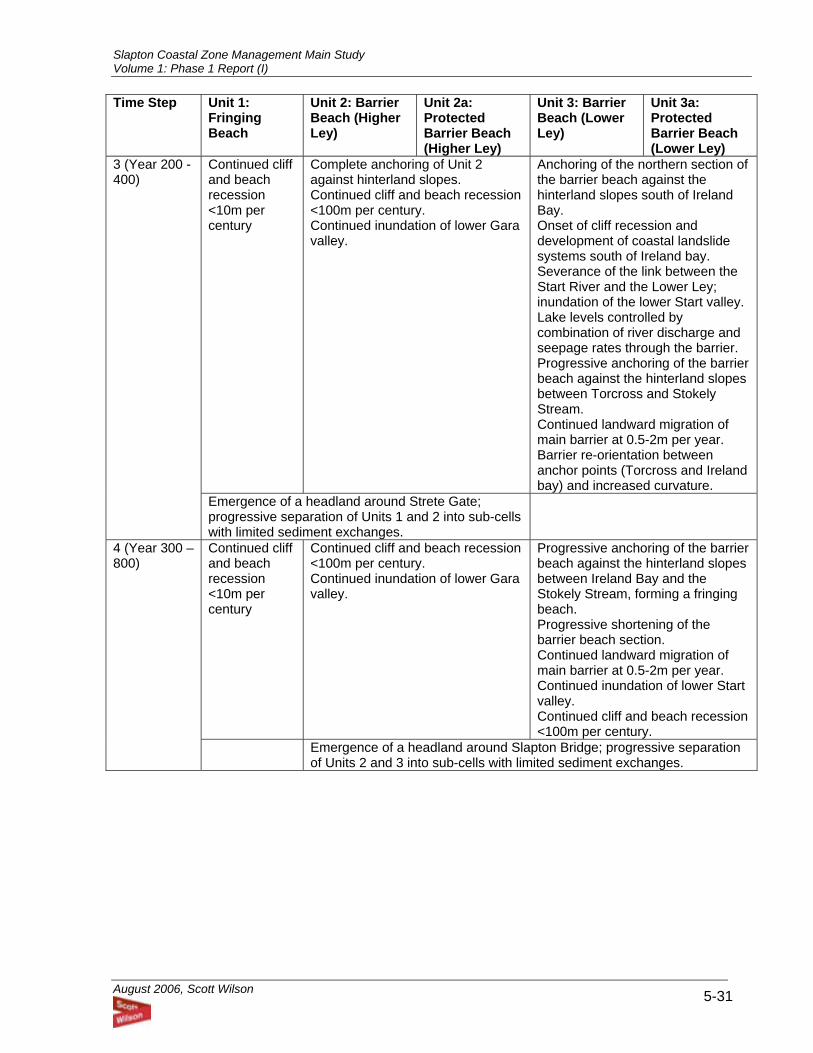
Slapton Coastal Zone Management Main Study Volume 1: Phase 1 Report (I)
August 2006, Scott Wilson
5-31
Time Step Unit 1: Fringing Beach
Unit 2: Barrier Beach (Higher Ley)
Unit 2a: Protected Barrier Beach (Higher Ley)
Unit 3: Barrier Beach (Lower Ley)
Unit 3a: Protected Barrier Beach (Lower Ley)
Continued cliff and beach recession <10m per century
Complete anchoring of Unit 2 against hinterland slopes. Continued cliff and beach recession <100m per century. Continued inundation of lower Gara valley.
Anchoring of the northern section of the barrier beach against the hinterland slopes south of Ireland Bay. Onset of cliff recession and development of coastal landslide systems south of Ireland bay. Severance of the link between the Start River and the Lower Ley; inundation of the lower Start valley. Lake levels controlled by combination of river discharge and seepage rates through the barrier. Progressive anchoring of the barrier beach against the hinterland slopes between Torcross and Stokely Stream. Continued landward migration of main barrier at 0.5-2m per year. Barrier re-orientation between anchor points (Torcross and Ireland bay) and increased curvature.
3 (Year 200 - 400)
Emergence of a headland around Strete Gate; progressive separation of Units 1 and 2 into sub-cells with limited sediment exchanges.
4 (Year 300 – 800)
Continued cliff and beach recession <10m per century
Continued cliff and beach recession <100m per century. Continued inundation of lower Gara valley.
Progressive anchoring of the barrier beach against the hinterland slopes between Ireland Bay and the Stokely Stream, forming a fringing beach. Progressive shortening of the barrier beach section. Continued landward migration of main barrier at 0.5-2m per year. Continued inundation of lower Start valley. Continued cliff and beach recession <100m per century.
Emergence of a headland around Slapton Bridge; progressive separation of Units 2 and 3 into sub-cells with limited sediment exchanges.
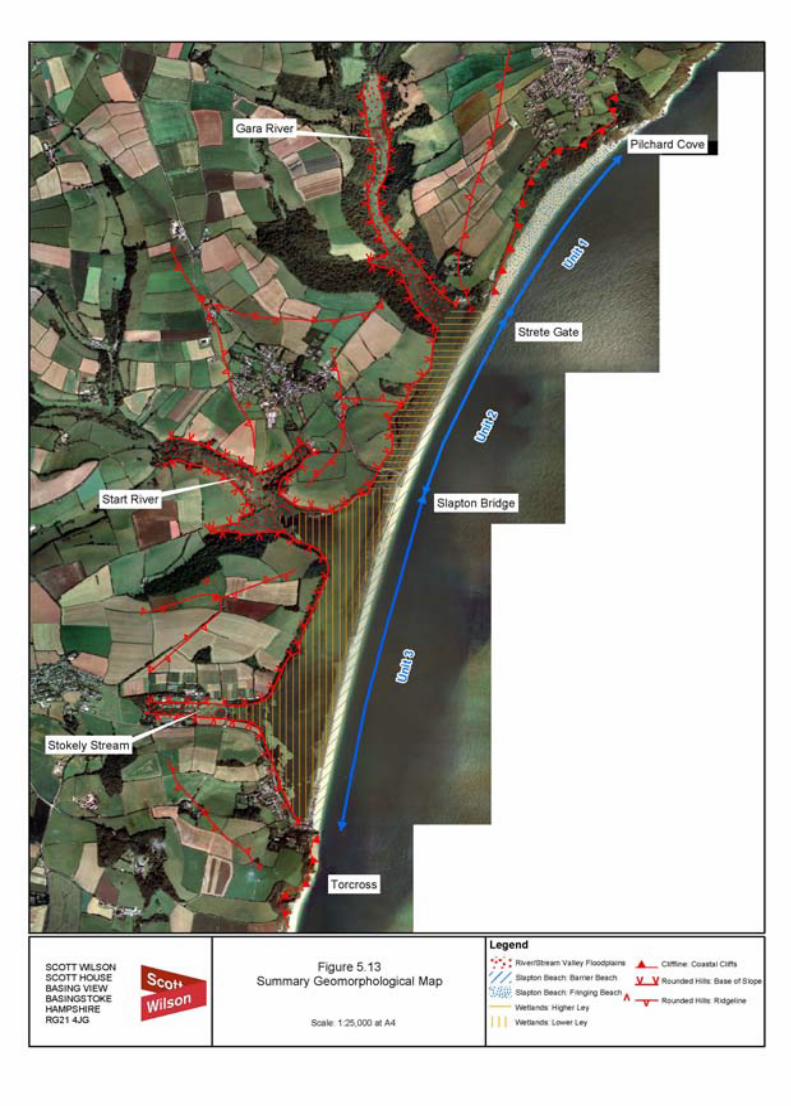
Slapton Coastal Zone Management Main Study Volume 1: Phase 1 Report (I)
August 2006, Scott Wilson 6-1
6 Archaeology and Cultural Heritage Baseline
Introduction 6.1 This Chapter identifies the archaeological & cultural heritage resources within a 3km study
radius of the centre of the Study area. The baseline search has been undertaken in accordance
with the guidelines set out by the Institute of Field Archaeologists (IFA, 1999). The sites are
characterised in terms of their date/period and whether they are Listed or Scheduled.
Methodology 6.2 The baseline search identifies the archaeological constraints associated with potential
management options. The baseline search required the following steps to be taken:
• Contact the County Archaeologist as appropriate and obtain from the relevant Sites and
Monuments Record (SMR), information on the location of designated sites and other
recorded sites within the area.
• Identify any potential archaeological constraints associated with the possible management
options including all Scheduled Ancient Monuments, other notable individual recorded
remains, or groups of remains of lesser importance. Sites of previous finds were also noted
as they may indicate that an area could contain potentially important buried remains.
6.3 The principal sources of information consulted as part of the baseline search were:
• Devon Sites and Monuments Record
• National Monuments Record
• Internet searches using English Heritage and multi-agency sites
6.4 A full list of the sites of archaeological/cultural heritage interest are listed in Table 6.1 and
mapped on Figures 6.1 and 6.2.
Archaeological Sites 6.5 Within the study area there exist an extensive range of sites ranging from the prehistoric to post-
medieval period. These consist of buried and standing remains and suggest that the area has
seen significant settlement activity. A number of sites are Scheduled, Listed or form part of a
group, which suggests intensive activity within some areas of the study.
Slapton Coastal Zone Management Main Study Volume 1: Phase 1 Report (I)
August 2006, Scott Wilson 6-2
Scheduled Monuments 6.6 Within the study area there are two Scheduled Ancient Monuments (Site no. 53 and 55) ranging
in date from the Late Bronze Age/Early Iron Age to the Post-medieval period.
53. Slapton Castle Hillfort SX80794434 SAM 33744 This monument consists of a univallate hillfort, aligned along a north to east southwest spur.
55. Chantry College SX82184502 SAM 24844 The monument includes a chantry college situated on the northern edge of the village of
Slapton. The college was in use from the late 14th century to the mid 16th century. The
upstanding remains consist of a ruined tower, which formed the western end of the chantry
church of the college. The buried remains are more extensive.
Listed Structures 6.7 There are 8 Listed buildings within the study area including bridges, crosses and churches.
These range in date from the medieval to post-medieval period and are generally classified as
Grade II.
Groups of sites 6.8 Within the study area there are number of sites dating to the same period, which are clustered
near to each other. This would suggest extensive activity within this area and increases the
potential for further sites to be discovered.
Group 1 (Site no. 9, 34, 40, 47, 53, 103 and 104)
Located in-between Stokenham and Slapton are a number of sites dating to the prehistoric
period. These sites consist of Mesolithic, Neolthic and Bronze Age flint scatters, earthworks and
defensive sites.
Group 2 (Site no. 115-116) Located immediately to the west of Slapton are a group of prehistoric standing stones. Group 3 (Site no. 4, 19, 20, 25, 27, 57, 75 and 109) Located within the village of Slapton are a number of sites dating between the medieval and
post-medieval period. The majority of these consist of standing structures including barns, inns
and chapels.
Group 4 (Site no. 22, 83, 66, 73, 74, 82, 95, 111, 113,117 and 118) Situated immediately below Stokenham are a number of sites dating to the medieval and post-
medieval period. The predominance of these consists of standing structures including a moat,
priory, manor house, prison and a smithy.
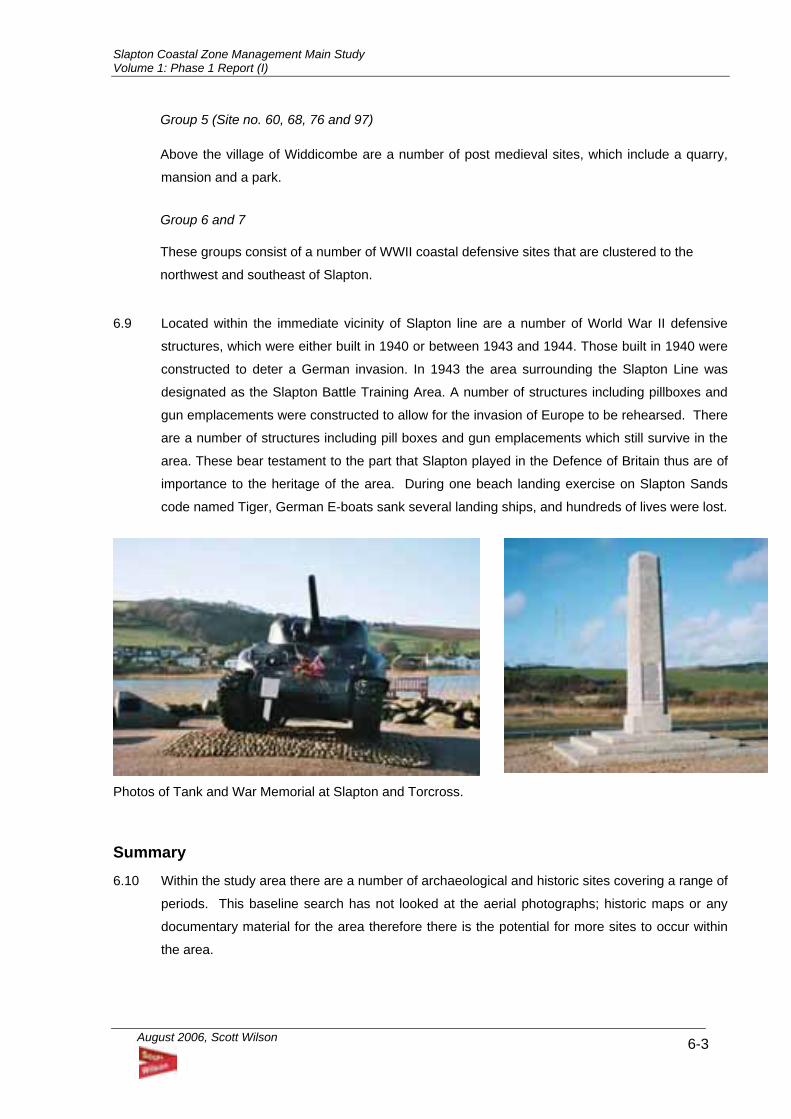
Slapton Coastal Zone Management Main Study Volume 1: Phase 1 Report (I)
August 2006, Scott Wilson 6-3
Group 5 (Site no. 60, 68, 76 and 97) Above the village of Widdicombe are a number of post medieval sites, which include a quarry,
mansion and a park.
Group 6 and 7 These groups consist of a number of WWII coastal defensive sites that are clustered to the
northwest and southeast of Slapton.
6.9 Located within the immediate vicinity of Slapton line are a number of World War II defensive
structures, which were either built in 1940 or between 1943 and 1944. Those built in 1940 were
constructed to deter a German invasion. In 1943 the area surrounding the Slapton Line was
designated as the Slapton Battle Training Area. A number of structures including pillboxes and
gun emplacements were constructed to allow for the invasion of Europe to be rehearsed. There
are a number of structures including pill boxes and gun emplacements which still survive in the
area. These bear testament to the part that Slapton played in the Defence of Britain thus are of
importance to the heritage of the area. During one beach landing exercise on Slapton Sands
code named Tiger, German E-boats sank several landing ships, and hundreds of lives were lost.
Photos of Tank and War Memorial at Slapton and Torcross.
Summary 6.10 Within the study area there are a number of archaeological and historic sites covering a range of
periods. This baseline search has not looked at the aerial photographs; historic maps or any
documentary material for the area therefore there is the potential for more sites to occur within
the area.
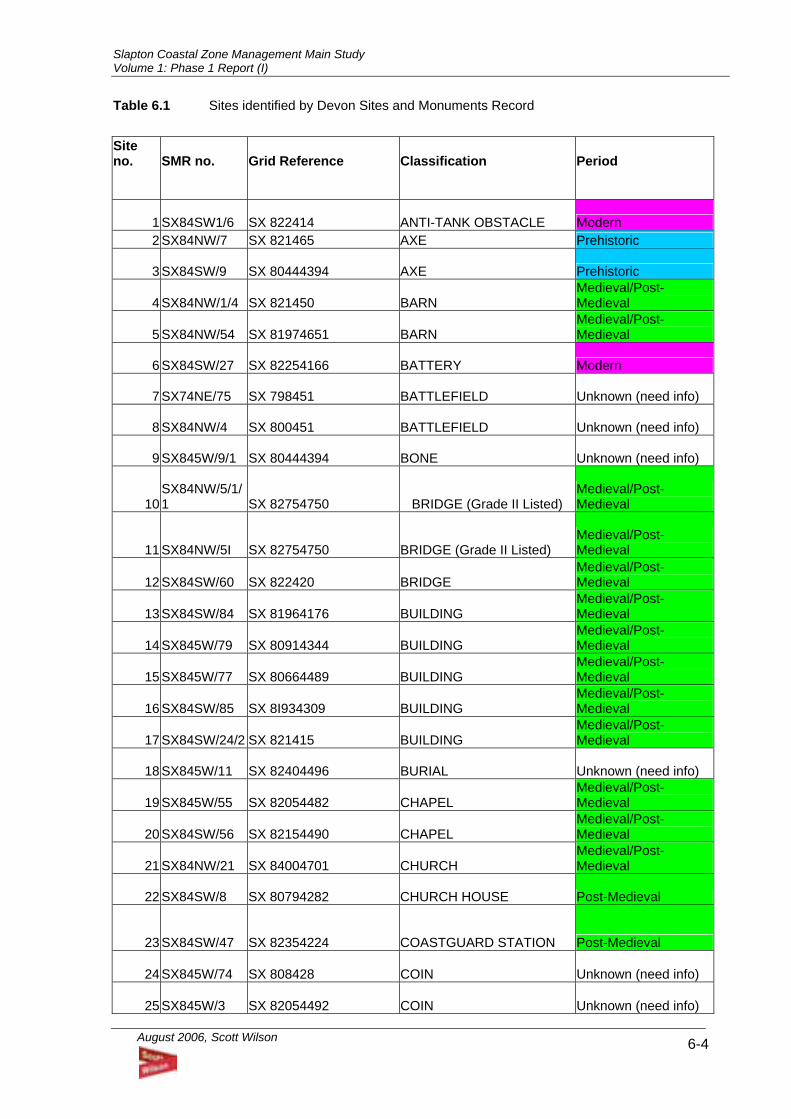
Slapton Coastal Zone Management Main Study Volume 1: Phase 1 Report (I)
August 2006, Scott Wilson 6-4
Table 6.1 Sites identified by Devon Sites and Monuments Record Site no.
SMR no.
Grid Reference
Classification
Period
1 SX84SW1/6 SX 822414 ANTI-TANK OBSTACLE Modern 2 SX84NW/7 SX 821465 AXE Prehistoric
3 SX84SW/9 SX 80444394 AXE Prehistoric
4 SX84NW/1/4 SX 821450 BARN Medieval/Post-Medieval
5 SX84NW/54 SX 81974651 BARN Medieval/Post-Medieval
6 SX84SW/27 SX 82254166 BATTERY Modern
7 SX74NE/75 SX 798451 BATTLEFIELD Unknown (need info)
8 SX84NW/4 SX 800451 BATTLEFIELD Unknown (need info)
9 SX845W/9/1 SX 80444394 BONE Unknown (need info)
10 SX84NW/5/1/1 SX 82754750 BRIDGE (Grade II Listed)
Medieval/Post-Medieval
11 SX84NW/5I SX 82754750 BRIDGE (Grade II Listed) Medieval/Post-Medieval
12 SX84SW/60 SX 822420 BRIDGE Medieval/Post-Medieval
13 SX84SW/84 SX 81964176 BUILDING Medieval/Post-Medieval
14 SX845W/79 SX 80914344 BUILDING Medieval/Post-Medieval
15 SX845W/77 SX 80664489 BUILDING Medieval/Post-Medieval
16 SX84SW/85 SX 8I934309 BUILDING Medieval/Post-Medieval
17 SX84SW/24/2 SX 821415 BUILDING Medieval/Post-Medieval
18 SX845W/11 SX 82404496 BURIAL Unknown (need info)
19 SX845W/55 SX 82054482 CHAPEL Medieval/Post-Medieval
20 SX84SW/56 SX 82154490 CHAPEL Medieval/Post-Medieval
21 SX84NW/21 SX 84004701 CHURCH Medieval/Post-Medieval
22 SX84SW/8 SX 80794282 CHURCH HOUSE Post-Medieval
23 SX84SW/47 SX 82354224 COASTGUARD STATION Post-Medieval
24 SX845W/74 SX 808428 COIN Unknown (need info)
25 SX845W/3 SX 82054492 COIN Unknown (need info)
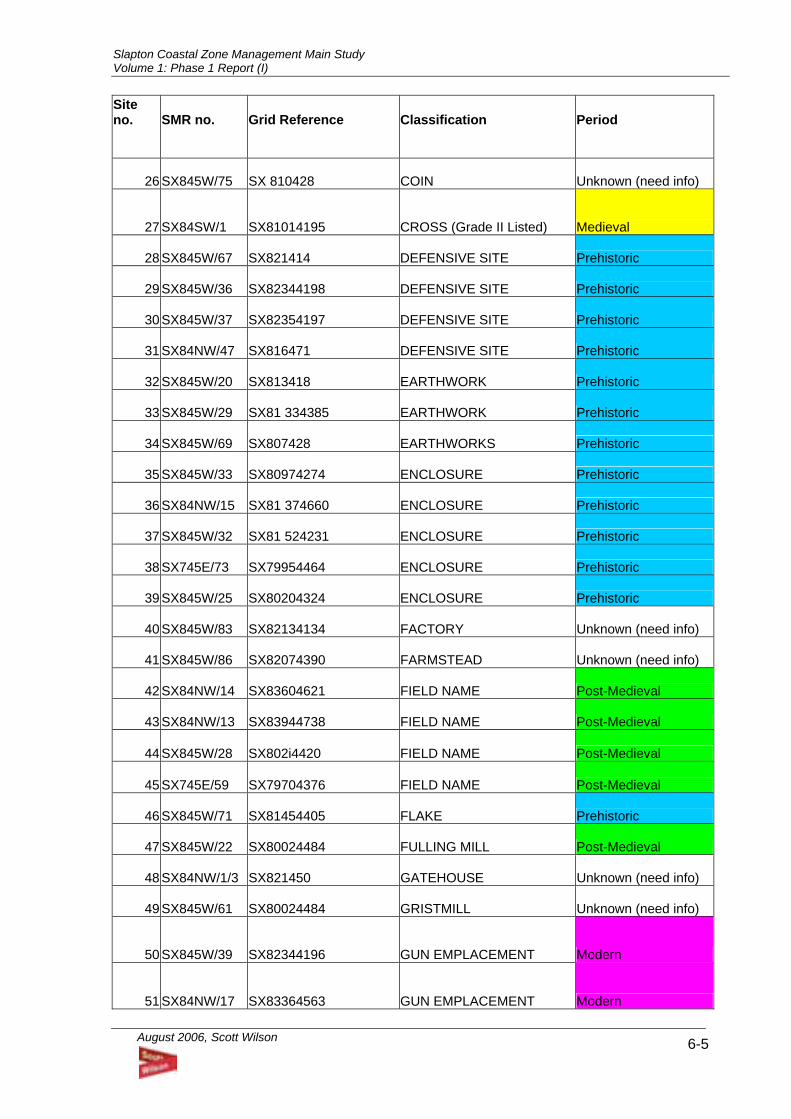
Slapton Coastal Zone Management Main Study Volume 1: Phase 1 Report (I)
August 2006, Scott Wilson 6-5
Site no.
SMR no.
Grid Reference
Classification
Period
26 SX845W/75 SX 810428 COIN Unknown (need info)
27 SX84SW/1 SX81014195 CROSS (Grade II Listed) Medieval
28 SX845W/67 SX821414 DEFENSIVE SITE Prehistoric
29 SX845W/36 SX82344198 DEFENSIVE SITE Prehistoric
30 SX845W/37 SX82354197 DEFENSIVE SITE Prehistoric
31 SX84NW/47 SX816471 DEFENSIVE SITE Prehistoric
32 SX845W/20 SX813418 EARTHWORK Prehistoric
33 SX845W/29 SX81 334385 EARTHWORK Prehistoric
34 SX845W/69 SX807428 EARTHWORKS Prehistoric
35 SX845W/33 SX80974274 ENCLOSURE Prehistoric
36 SX84NW/15 SX81 374660 ENCLOSURE Prehistoric
37 SX845W/32 SX81 524231 ENCLOSURE Prehistoric
38 SX745E/73 SX79954464 ENCLOSURE Prehistoric
39 SX845W/25 SX80204324 ENCLOSURE Prehistoric
40 SX845W/83 SX82134134 FACTORY Unknown (need info)
41 SX845W/86 SX82074390 FARMSTEAD Unknown (need info)
42 SX84NW/14 SX83604621 FIELD NAME Post-Medieval
43 SX84NW/13 SX83944738 FIELD NAME Post-Medieval
44 SX845W/28 SX802i4420 FIELD NAME Post-Medieval
45 SX745E/59 SX79704376 FIELD NAME Post-Medieval
46 SX845W/71 SX81454405 FLAKE Prehistoric
47 SX845W/22 SX80024484 FULLING MILL Post-Medieval
48 SX84NW/1/3 SX821450 GATEHOUSE Unknown (need info)
49 SX845W/61 SX80024484 GRISTMILL Unknown (need info)
50 SX845W/39 SX82344196 GUN EMPLACEMENT Modern
51 SX84NW/17 SX83364563 GUN EMPLACEMENT Modern
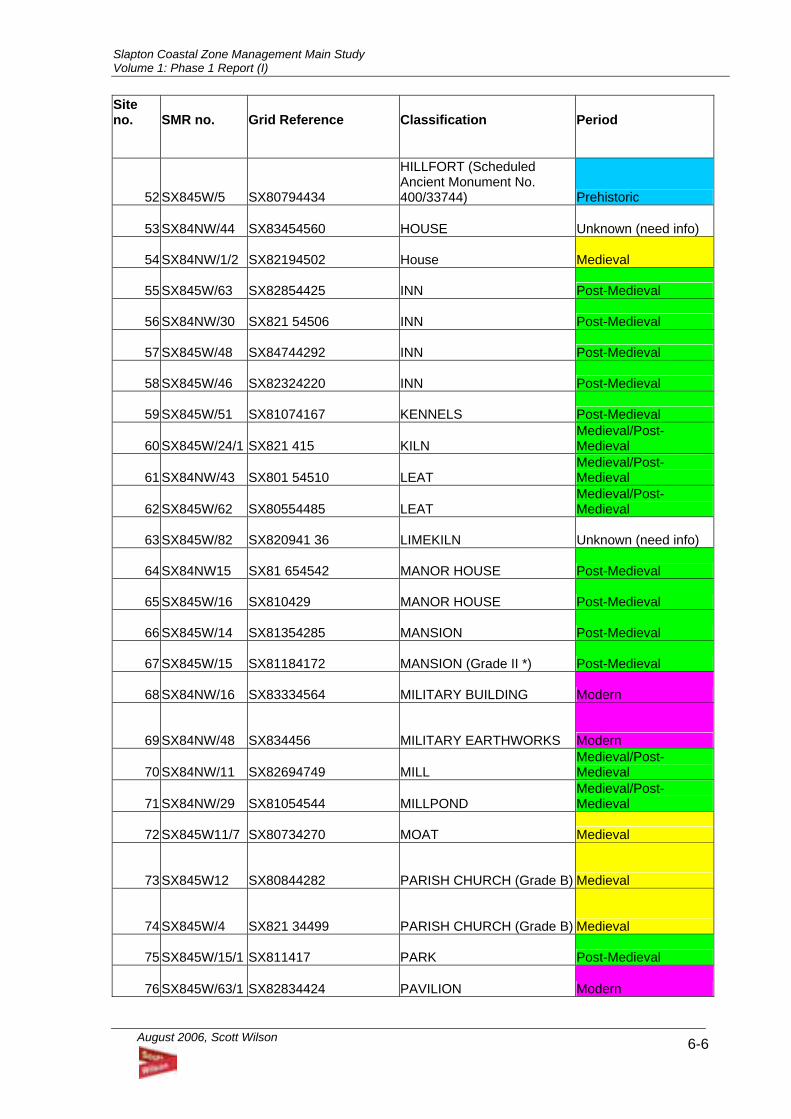
Slapton Coastal Zone Management Main Study Volume 1: Phase 1 Report (I)
August 2006, Scott Wilson 6-6
Site no.
SMR no.
Grid Reference
Classification
Period
52 SX845W/5 SX80794434
HILLFORT (Scheduled Ancient Monument No. 400/33744) Prehistoric
53 SX84NW/44 SX83454560 HOUSE Unknown (need info)
54 SX84NW/1/2 SX82194502 House Medieval
55 SX845W/63 SX82854425 INN Post-Medieval
56 SX84NW/30 SX821 54506 INN Post-Medieval
57 SX845W/48 SX84744292 INN Post-Medieval
58 SX845W/46 SX82324220 INN Post-Medieval
59 SX845W/51 SX81074167 KENNELS Post-Medieval
60 SX845W/24/1 SX821 415 KILN Medieval/Post-Medieval
61 SX84NW/43 SX801 54510 LEAT Medieval/Post-Medieval
62 SX845W/62 SX80554485 LEAT Medieval/Post-Medieval
63 SX845W/82 SX820941 36 LIMEKILN Unknown (need info)
64 SX84NW15 SX81 654542 MANOR HOUSE Post-Medieval
65 SX845W/16 SX810429 MANOR HOUSE Post-Medieval
66 SX845W/14 SX81354285 MANSION Post-Medieval
67 SX845W/15 SX81184172 MANSION (Grade II *) Post-Medieval
68 SX84NW/16 SX83334564 MILITARY BUILDING Modern
69 SX84NW/48 SX834456 MILITARY EARTHWORKS Modern
70 SX84NW/11 SX82694749 MILL Medieval/Post-Medieval
71 SX84NW/29 SX81054544 MILLPOND Medieval/Post-Medieval
72 SX845W11/7 SX80734270 MOAT Medieval
73 SX845W12 SX80844282 PARISH CHURCH (Grade B) Medieval
74 SX845W/4 SX821 34499 PARISH CHURCH (Grade B) Medieval
75 SX845W/15/1 SX811417 PARK Post-Medieval
76 SX845W/63/1 SX82834424 PAVILION Modern
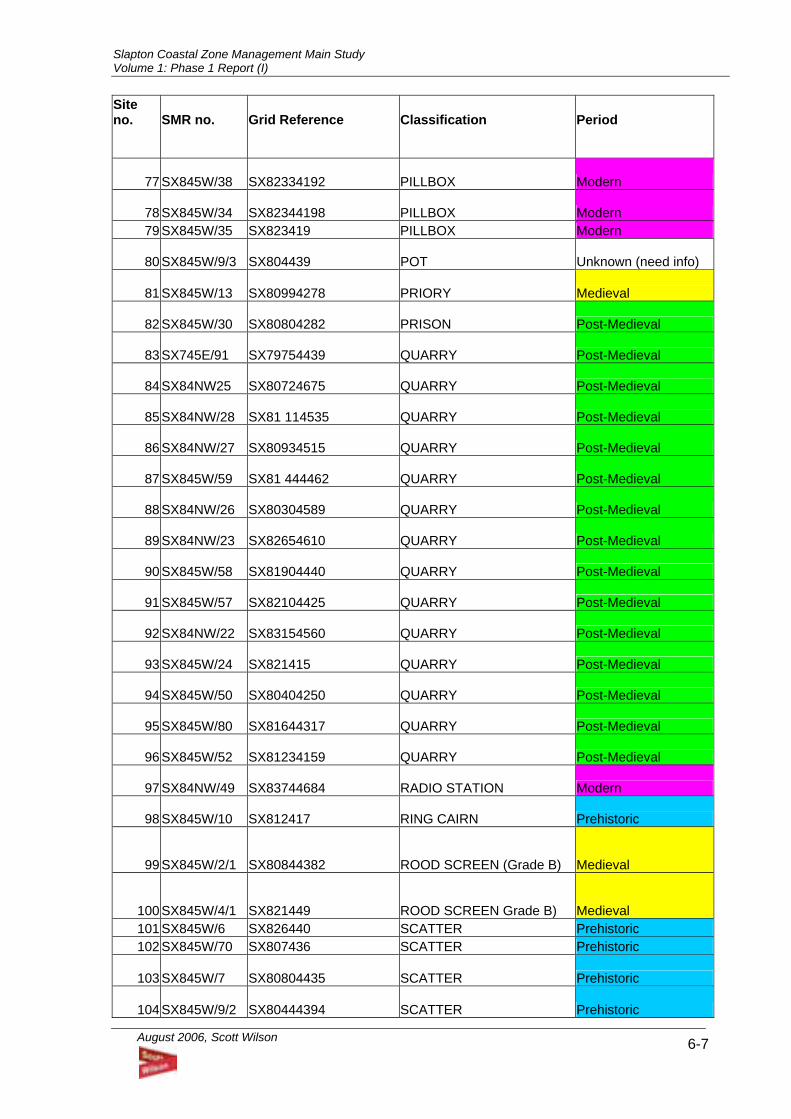
Slapton Coastal Zone Management Main Study Volume 1: Phase 1 Report (I)
August 2006, Scott Wilson 6-7
Site no.
SMR no.
Grid Reference
Classification
Period
77 SX845W/38 SX82334192 PILLBOX Modern
78 SX845W/34 SX82344198 PILLBOX Modern 79 SX845W/35 SX823419 PILLBOX Modern
80 SX845W/9/3 SX804439 POT Unknown (need info)
81 SX845W/13 SX80994278 PRIORY Medieval
82 SX845W/30 SX80804282 PRISON Post-Medieval
83 SX745E/91 SX79754439 QUARRY Post-Medieval
84 SX84NW25 SX80724675 QUARRY Post-Medieval
85 SX84NW/28 SX81 114535 QUARRY Post-Medieval
86 SX84NW/27 SX80934515 QUARRY Post-Medieval
87 SX845W/59 SX81 444462 QUARRY Post-Medieval
88 SX84NW/26 SX80304589 QUARRY Post-Medieval
89 SX84NW/23 SX82654610 QUARRY Post-Medieval
90 SX845W/58 SX81904440 QUARRY Post-Medieval
91 SX845W/57 SX82104425 QUARRY Post-Medieval
92 SX84NW/22 SX83154560 QUARRY Post-Medieval
93 SX845W/24 SX821415 QUARRY Post-Medieval
94 SX845W/50 SX80404250 QUARRY Post-Medieval
95 SX845W/80 SX81644317 QUARRY Post-Medieval
96 SX845W/52 SX81234159 QUARRY Post-Medieval
97 SX84NW/49 SX83744684 RADIO STATION Modern
98 SX845W/10 SX812417 RING CAIRN Prehistoric
99 SX845W/2/1 SX80844382 ROOD SCREEN (Grade B) Medieval
100 SX845W/4/1 SX821449 ROOD SCREEN Grade B) Medieval 101 SX845W/6 SX826440 SCATTER Prehistoric 102 SX845W/70 SX807436 SCATTER Prehistoric
103 SX845W/7 SX80804435 SCATTER Prehistoric
104 SX845W/9/2 SX80444394 SCATTER Prehistoric
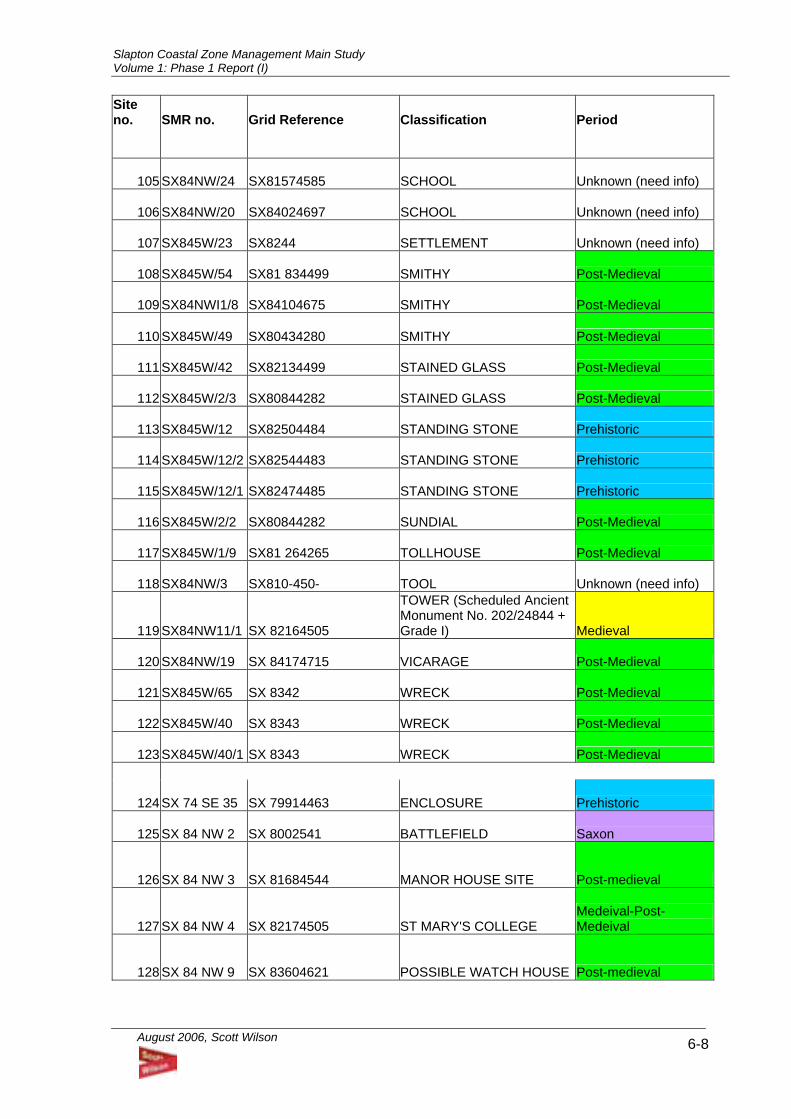
Slapton Coastal Zone Management Main Study Volume 1: Phase 1 Report (I)
August 2006, Scott Wilson 6-8
Site no.
SMR no.
Grid Reference
Classification
Period
105 SX84NW/24 SX81574585 SCHOOL Unknown (need info)
106 SX84NW/20 SX84024697 SCHOOL Unknown (need info)
107 SX845W/23 SX8244 SETTLEMENT Unknown (need info)
108 SX845W/54 SX81 834499 SMITHY Post-Medieval
109 SX84NWI1/8 SX84104675 SMITHY Post-Medieval
110 SX845W/49 SX80434280 SMITHY Post-Medieval
111 SX845W/42 SX82134499 STAINED GLASS Post-Medieval
112 SX845W/2/3 SX80844282 STAINED GLASS Post-Medieval
113 SX845W/12 SX82504484 STANDING STONE Prehistoric
114 SX845W/12/2 SX82544483 STANDING STONE Prehistoric
115 SX845W/12/1 SX82474485 STANDING STONE Prehistoric
116 SX845W/2/2 SX80844282 SUNDIAL Post-Medieval
117 SX845W/1/9 SX81 264265 TOLLHOUSE Post-Medieval
118 SX84NW/3 SX810-450- TOOL Unknown (need info)
119 SX84NW11/1 SX 82164505
TOWER (Scheduled Ancient Monument No. 202/24844 + Grade I) Medieval
120 SX84NW/19 SX 84174715 VICARAGE Post-Medieval
121 SX845W/65 SX 8342 WRECK Post-Medieval
122 SX845W/40 SX 8343 WRECK Post-Medieval
123 SX845W/40/1 SX 8343 WRECK Post-Medieval
124 SX 74 SE 35 SX 79914463 ENCLOSURE Prehistoric
125 SX 84 NW 2 SX 8002541 BATTLEFIELD Saxon
126 SX 84 NW 3 SX 81684544 MANOR HOUSE SITE Post-medieval
127 SX 84 NW 4 SX 82174505 ST MARY'S COLLEGE Medeival-Post-Medeival
128 SX 84 NW 9 SX 83604621 POSSIBLE WATCH HOUSE Post-medieval
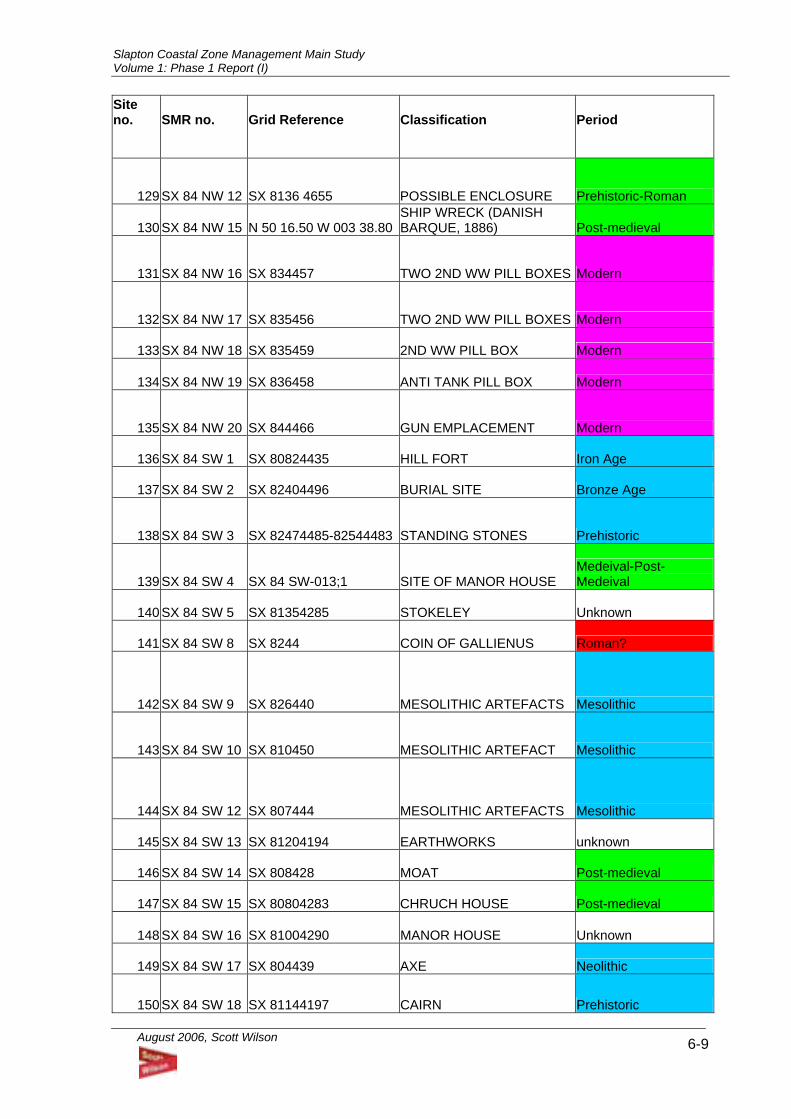
Slapton Coastal Zone Management Main Study Volume 1: Phase 1 Report (I)
August 2006, Scott Wilson 6-9
Site no.
SMR no.
Grid Reference
Classification
Period
129 SX 84 NW 12 SX 8136 4655 POSSIBLE ENCLOSURE Prehistoric-Roman
130 SX 84 NW 15 N 50 16.50 W 003 38.80SHIP WRECK (DANISH BARQUE, 1886) Post-medieval
131 SX 84 NW 16 SX 834457 TWO 2ND WW PILL BOXES Modern
132 SX 84 NW 17 SX 835456 TWO 2ND WW PILL BOXES Modern
133 SX 84 NW 18 SX 835459 2ND WW PILL BOX Modern
134 SX 84 NW 19 SX 836458 ANTI TANK PILL BOX Modern
135 SX 84 NW 20 SX 844466 GUN EMPLACEMENT Modern
136 SX 84 SW 1 SX 80824435 HILL FORT Iron Age
137 SX 84 SW 2 SX 82404496 BURIAL SITE Bronze Age
138 SX 84 SW 3 SX 82474485-82544483 STANDING STONES Prehistoric
139 SX 84 SW 4 SX 84 SW-013;1 SITE OF MANOR HOUSE Medeival-Post-Medeival
140 SX 84 SW 5 SX 81354285 STOKELEY Unknown
141 SX 84 SW 8 SX 8244 COIN OF GALLIENUS Roman?
142 SX 84 SW 9 SX 826440 MESOLITHIC ARTEFACTS Mesolithic
143 SX 84 SW 10 SX 810450 MESOLITHIC ARTEFACT Mesolithic
144 SX 84 SW 12 SX 807444 MESOLITHIC ARTEFACTS Mesolithic
145 SX 84 SW 13 SX 81204194 EARTHWORKS unknown
146 SX 84 SW 14 SX 808428 MOAT Post-medieval
147 SX 84 SW 15 SX 80804283 CHRUCH HOUSE Post-medieval
148 SX 84 SW 16 SX 81004290 MANOR HOUSE Unknown
149 SX 84 SW 17 SX 804439 AXE Neolithic
150 SX 84 SW 18 SX 81144197 CAIRN Prehistoric
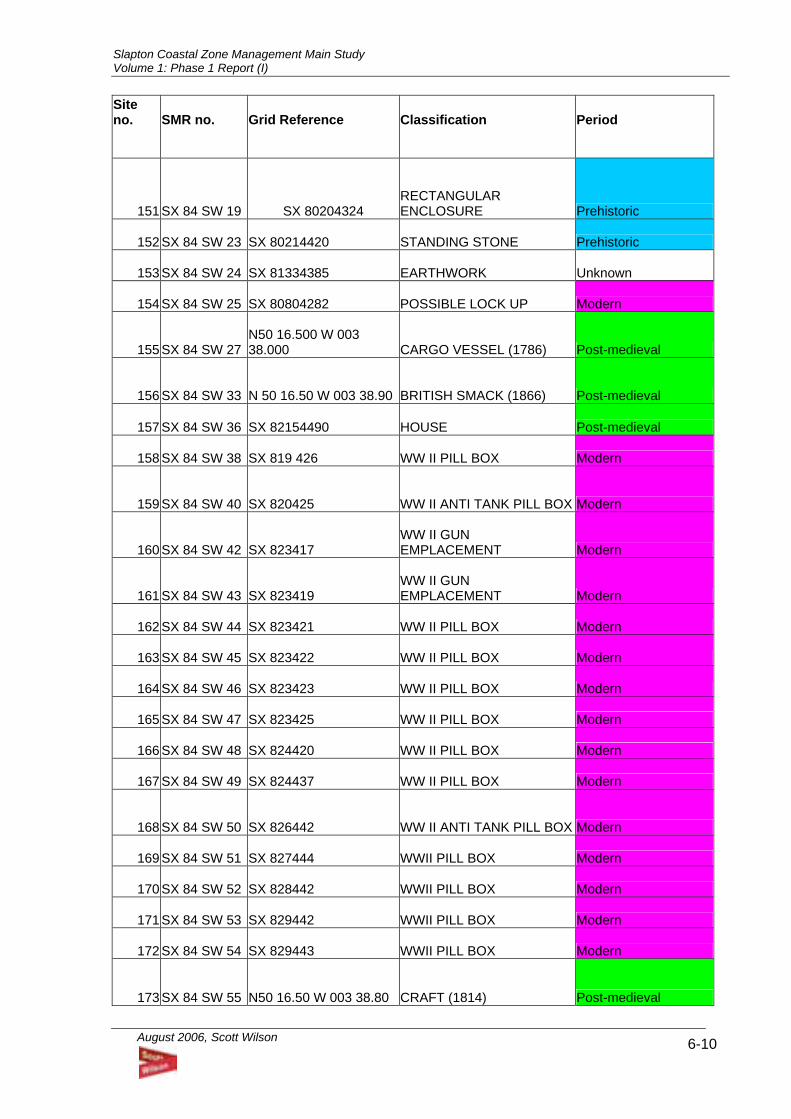
Slapton Coastal Zone Management Main Study Volume 1: Phase 1 Report (I)
August 2006, Scott Wilson 6-10
Site no.
SMR no.
Grid Reference
Classification
Period
151 SX 84 SW 19 SX 80204324 RECTANGULAR ENCLOSURE Prehistoric
152 SX 84 SW 23 SX 80214420 STANDING STONE Prehistoric
153 SX 84 SW 24 SX 81334385 EARTHWORK Unknown
154 SX 84 SW 25 SX 80804282 POSSIBLE LOCK UP Modern
155 SX 84 SW 27N50 16.500 W 003 38.000 CARGO VESSEL (1786) Post-medieval
156 SX 84 SW 33 N 50 16.50 W 003 38.90 BRITISH SMACK (1866) Post-medieval
157 SX 84 SW 36 SX 82154490 HOUSE Post-medieval
158 SX 84 SW 38 SX 819 426 WW II PILL BOX Modern
159 SX 84 SW 40 SX 820425 WW II ANTI TANK PILL BOX Modern
160 SX 84 SW 42 SX 823417 WW II GUN EMPLACEMENT Modern
161 SX 84 SW 43 SX 823419 WW II GUN EMPLACEMENT Modern
162 SX 84 SW 44 SX 823421 WW II PILL BOX Modern
163 SX 84 SW 45 SX 823422 WW II PILL BOX Modern
164 SX 84 SW 46 SX 823423 WW II PILL BOX Modern
165 SX 84 SW 47 SX 823425 WW II PILL BOX Modern
166 SX 84 SW 48 SX 824420 WW II PILL BOX Modern
167 SX 84 SW 49 SX 824437 WW II PILL BOX Modern
168 SX 84 SW 50 SX 826442 WW II ANTI TANK PILL BOX Modern
169 SX 84 SW 51 SX 827444 WWII PILL BOX Modern
170 SX 84 SW 52 SX 828442 WWII PILL BOX Modern
171 SX 84 SW 53 SX 829442 WWII PILL BOX Modern
172 SX 84 SW 54 SX 829443 WWII PILL BOX Modern
173 SX 84 SW 55 N50 16.50 W 003 38.80 CRAFT (1814) Post-medieval
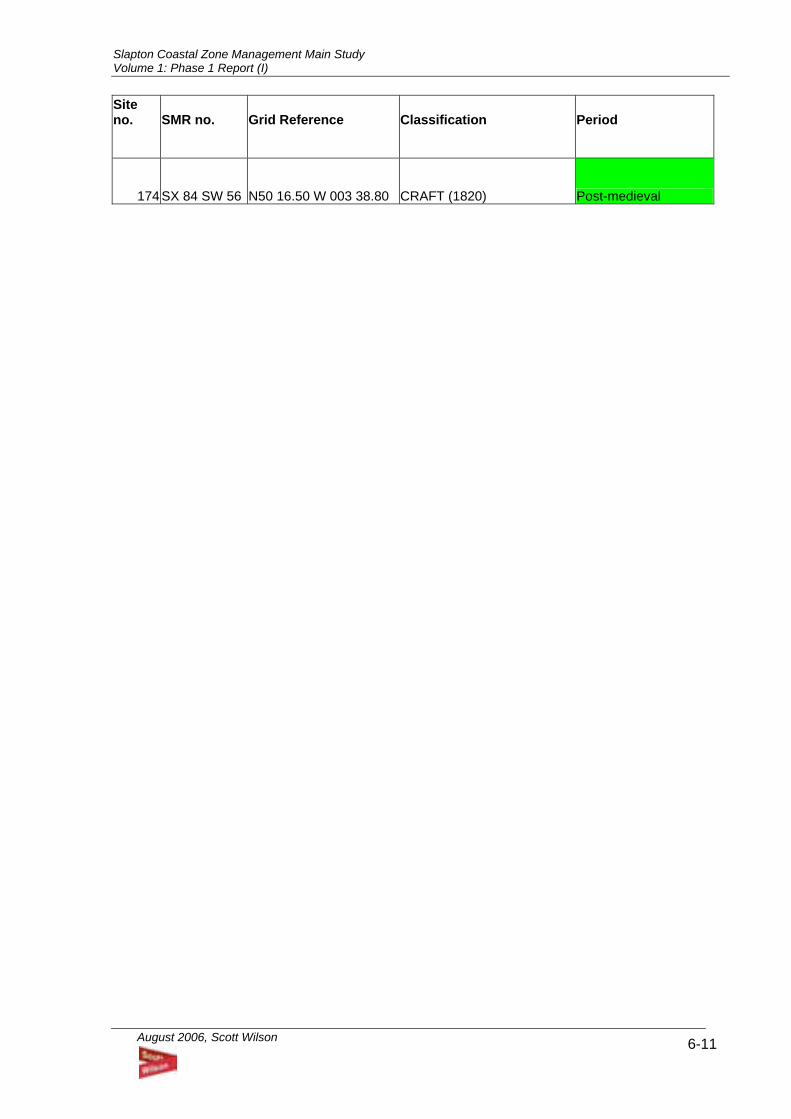
Slapton Coastal Zone Management Main Study Volume 1: Phase 1 Report (I)
August 2006, Scott Wilson 6-11
Site no.
SMR no.
Grid Reference
Classification
Period
174 SX 84 SW 56 N50 16.50 W 003 38.80 CRAFT (1820) Post-medieval
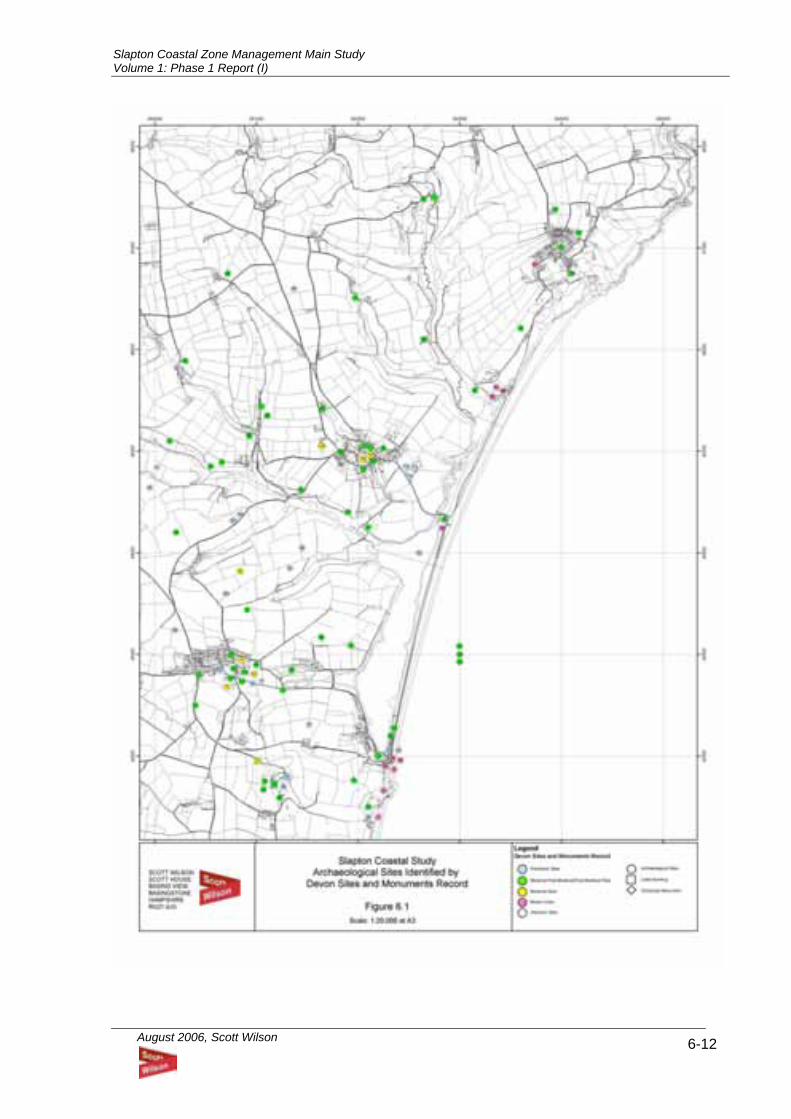
Slapton Coastal Zone Management Main Study Volume 1: Phase 1 Report (I)
August 2006, Scott Wilson 6-12
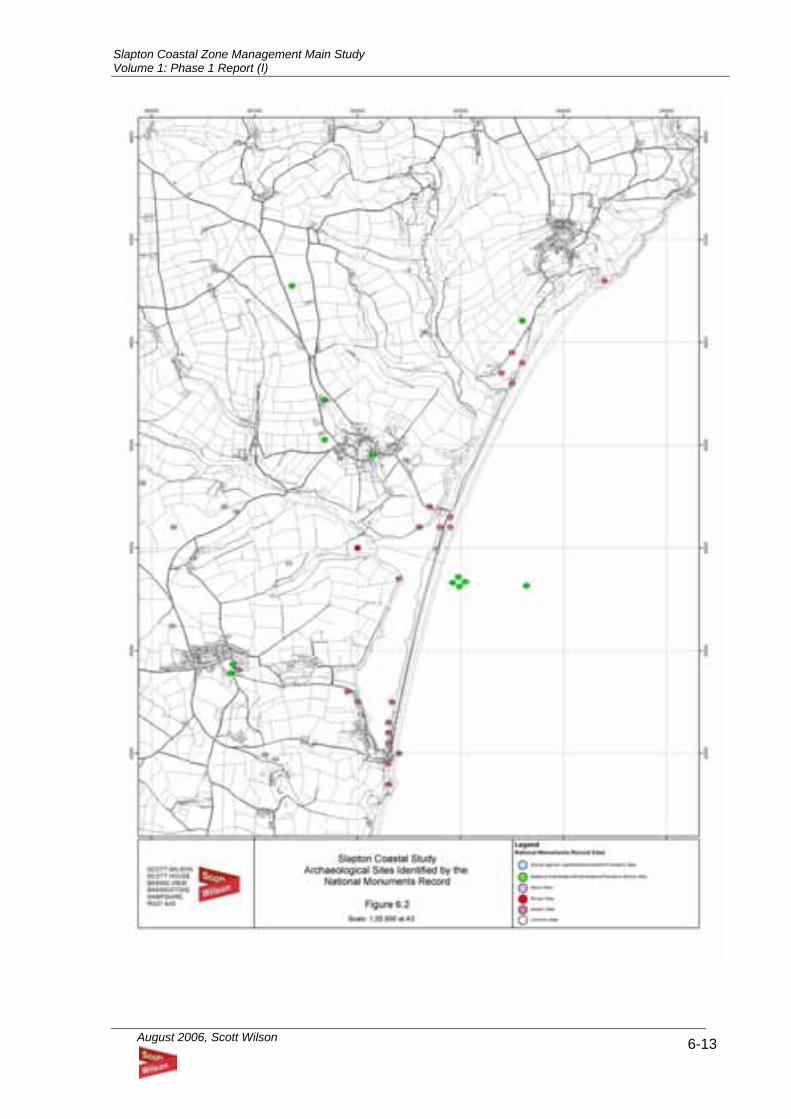
Slapton Coastal Zone Management Main Study Volume 1: Phase 1 Report (I)
August 2006, Scott Wilson 6-13
Slapton Coastal Zone Management Main Study Volume 1: Phase 1 Report (I)
August 2006, Scott Wilson 7-1
7 Landscape Character and Visual Receptor Baseline
Introduction 7.1 This landscape character and visual receptor chapter summarises the studies undertaken to
assess the baseline landscape character of the study area and an assessment of the key visual
receptors and views. It provides the landscape context for the coastal zone management zone
options that may be proposed for the Slapton Line.
Methodology 7.2 The baseline landscape and visual conditions were assessed through desk and site appraisal of
the landscape setting including:
• Landscape context;
• Topography and natural drainage;
• Vegetation cover;
• Settlement and Land Use;
• Recreation;
• Landscape character and views;
• Landscape planning context.
General Approach 7.3 Contemporary environmental assessment equates the value of good landscape and views to
that of say, clean air and water. High quality urban or rural landscapes are, therefore,
considered a valuable environmental resource, which sustainable forms of development should
seek to conserve and enhance.
7.4 Previous landscape studies and assessments that cover the area include: Countryside
Commission/English Nature – “The Character of England”; Devon County Council – “The
Devon Landscape” and South Hams District Council – “Draft Landscape Character
Assessment”.
7.5 The method of landscape and visual assessment adopted for the proposed development has
been devised in order to address the specific issues typically raised by a study of this scale and
nature. Primary guidance in this assessment is based upon the general approach advocated in
‘Landscape and Visual Assessment for Environmental Assessment’ published by the Institute of
Slapton Coastal Zone Management Main Study Volume 1: Phase 1 Report (I)
August 2006, Scott Wilson 7-2
Environmental Assessment and the Landscape Institute (IEA Guidelines, 1994) (edited by Scott
Wilson).
Terminology 7.6 Landscape - comprises those physical components, which together form the appearance of
land, including its shapes, colours and textures. Landscape also reflects the way in which these
various components combine to create distinctive landscape characters, which are particular to
localities.
7.7 Study Area - is the area within which desk and site surveys have been carried when determining
the landscape baseline surveys on the surrounding landscape.
7.8 Landscape Character Areas - The components of the landscape were identified and used to
define discrete Landscape Character Areas (LCAs) of homogenous characteristics.
7.9 Visual Receptors - Within the Zone of Visual Influence (ZVI) key viewpoints from publicly
accessible roads, footpaths and open spaces were identified. The location of potential visual
receptors, including local residents, passing motorists and walkers were also identified.
Landscape Context 7.10 The study area lies within the much dissected plateau landscape of the South Hams within
South Devon. The study area covers a 3km radius zone centred on the memorial car park at
Slapton Sands.
7.11 The shingle bar of Slapton Sands divides the study area from the South Devon coast to the
east. To the west the study zone the shingle bar contains an extensive fresh water lagoon
‘Slapton Ley’. The land quickly rises up behind the lagoon to form the rolling agricultural plateau
landscape of the South Hams. To the north and south, the study site is contained by the
headland cliffs of Torcross and Strete.
7.12 The landscape context of the site and its surrounds are shown in Figure 7.1 overleaf.
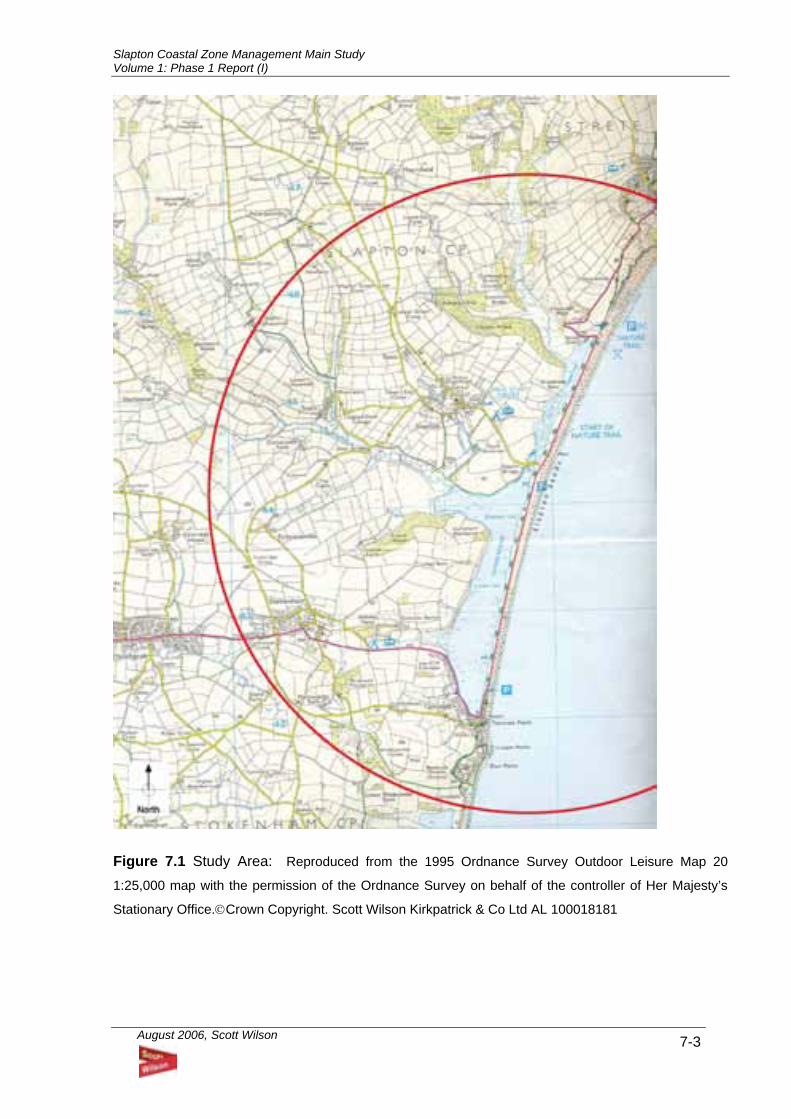
Slapton Coastal Zone Management Main Study Volume 1: Phase 1 Report (I)
August 2006, Scott Wilson 7-3
Figure 7.1 Study Area: Reproduced from the 1995 Ordnance Survey Outdoor Leisure Map 20
1:25,000 map with the permission of the Ordnance Survey on behalf of the controller of Her Majesty’s
Stationary Office.©Crown Copyright. Scott Wilson Kirkpatrick & Co Ltd AL 100018181
Slapton Coastal Zone Management Main Study Volume 1: Phase 1 Report (I)
August 2006, Scott Wilson 7-4
Topography and Natural Drainage 7.13 The study area takes the form of an elevated plateau rising steeply from the coastal zone in the
east, to the higher ground in the west, at approximately 120m above OS datum.
7.14 The plateau topography reads as an elevated gently rolling extensive landscape. Following its
development the plateau has subsequently been dissected by a number of local rivers, forming
steep valleys.
7.15 The rivers have continued to flow along the valley bottoms in an easterly direction although at a
reduced velocity, this has enabled sediments to become deposited and wider flatter valley
bases to develop. In place of a small number of estuaries, the rivers have been prevented from
reaching the sea by the natural formation of the shingle bar at Slapton Sands, which has
resulted in the development of a fresh water Lagoon (Slapton Ley).
7.16 A number of streams and rivers feed the Ley, the largest being the River Gara, which enters the
Ley from the north. The water then moves from the upper Ley above Slapton Bridge into the
Lower Ley in the south.
7.17 The two Leys form the most important drainage feature within the area. The Lagoons receive
water from catchments totalling 4556 hectares within which the entire study area is located.
Water leaves the Lagoons via a combination of infiltration through the shingle bar, which
accounts for 36% of the water loss. The remaining water exits via the weir at Torcross, which
was constructed in 1856 to prevent the Lagoon breaching the shingle bar in times of high water
flow, and enabled the current road to be constructed.
Vegetation Cover, Settlements and Landuse 7.18 The main land cover elements are the direct results of the agricultural development of the area,
these elements consist of:
• Mixed Agriculture
• Small Woodland Blocks
• Hedgerows/Hedge banks
• Reed Bed/Carr Woodland
7.19 The dominant land cover element to the study area is mixed agriculture, containing extensive
areas of arable production on the gently rolling plateau lands. As gradients increase and
agricultural production with machinery becomes more difficult, vegetation changes from arable
production to unimproved pasture.
Slapton Coastal Zone Management Main Study Volume 1: Phase 1 Report (I)
August 2006, Scott Wilson 7-5
7.20 Hedgerows and Hedge banks divide virtually all fields, roads and properties. These range from
species rich hedges upon banks containing the steeper pastoral fields, to more limited diversity
thorn hedges within the arable plateau landscape. Most hedges are intensively managed and
devoid of trees upon the plateaux, however, as the steepness of the fields increase the
management regimes appear to become more relaxed and trees have been allowed to grow
taller, increasing the containment and intimacy of these areas.
7.21 The majority of tree cover is found in small woodlands generally associated with the steepest
valley flanks and areas of ornamental shelterbelts. Within the shelterbelts evergreen species
have been planted such as Monterey Pines and Holm Oaks, often in association with larger
individual residences. These areas are located around Strete Gate to the north and adjacent to
Stokeley Manor in the south.
7.22 The final element of land cover is that of Reed beds, marginal aquaties and wet carr woodland.
These elements are to be found within the shallow margins of the fresh water Lagoon of Slapton
Ley and within the flatter valley bottoms leading to the Lagoons (See Figure 7.2 overleaf).
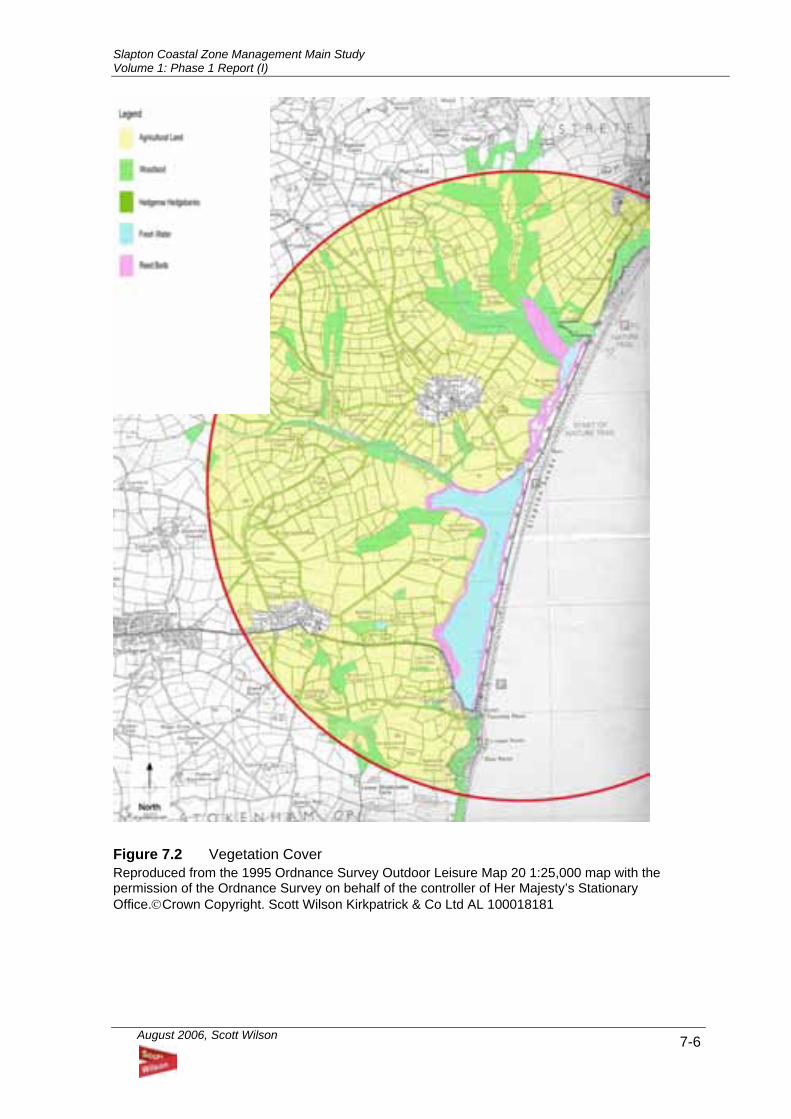
Slapton Coastal Zone Management Main Study Volume 1: Phase 1 Report (I)
August 2006, Scott Wilson 7-6
Figure 7.2 Vegetation Cover Reproduced from the 1995 Ordnance Survey Outdoor Leisure Map 20 1:25,000 map with the permission of the Ordnance Survey on behalf of the controller of Her Majesty’s Stationary Office.©Crown Copyright. Scott Wilson Kirkpatrick & Co Ltd AL 100018181
Slapton Coastal Zone Management Main Study Volume 1: Phase 1 Report (I)
August 2006, Scott Wilson 7-7
7.23 The predominant land use within the site area is agriculture (pasture/arable) with a number of
small farmsteads and individual residential properties scattered throughout.
7.24 The larger settlements of Strete, Slapton and Stokeham are located approximately one
kilometre from the coastline in sheltered locations protected from the prevailing southwesterly
winds. Torcross is the only other settlement of any significant size within the study area; it is
located on the seafront at Slapton Sands at the southern most section of the study area. The
village itself is positioned at the north west base of Dunpoint rocks, which protects it from the
prevailing winds.
7.25 The main transport route is the A379, which traverses the Shingle Bar from Strete Gate to
Torcross and then heads west towards Stokenham and Chillington. A number of minor roads
and single lane roads also cross the study area linking Stokenham to Slapton and Slapton to the
South Hams hinterland.
7.26 To the east of the settlement of Stokenham the agricultural land use is dispersed with medium
scale horticultural activities centred around Stokely Manor. Further to the east the agricultural
land abruptly stops as it reaches the extensive water body of Slapton Ley and the shingle bar of
Slapton Sands, which has created this fresh water Lagoon.
Recreation 7.27 The eastern sector of the study area contains one of the most important recreational resources
in South Hams, Slapton Sands and its immediate environs. With over 64% of the local working
population employed directly or indirectly in the service sector the importance of this area should
not be underestimated. The study area provides both passive and active recreational resources
in the form of nearly 6km of beach line, freshwater Lagoons and stunning scenery.
7.28 The study area contains several national and local landscape designations including an AONB,
South Devon Heritage Coast and the route of the South West Coast Path National Trail. These
make the study area highly popular with visitors to the South Hams. Within the study area
Slapton Sands and its associated fresh water Lagoon, provide a unique passive recreational
resource and are designated as a SSSI, NNR and Geological Conservation review Site.
7.29 The site attracts many recreational naturalists, fishermen, bird watchers, ecologists and
geologists who are all provided for along with the beach goers, walkers, day-trippers and
historians with a range of tourist facilities.
7.30 Facilities are located within the settlements of Slapton, Torcross, Stokenham and Strete, and
include shops restaurants and accommodation.
Slapton Coastal Zone Management Main Study Volume 1: Phase 1 Report (I)
August 2006, Scott Wilson 7-8
Landscape Character and views 7.31 The study area contains the following key characteristic features:
• Sudden landform variations adjacent to river valley’s
• Plateau areas between rivers cut by streams and creeks with steeply undulating farmland
and woodland.
• Historic settlements
• Waterside features and water activities
• Dense network of hedge banks, green lanes, coastal tree groups and orchards
• Freshwater coastal lagoons and associated shingle bars
7.32 The study area is characterised by a number of different landscape character zones the
components of the landscape have been identified and used to define discrete Landscape
Character Areas (LCAs) of homogenous characteristics. Typical landscape components include
landform land cover vegetation, settlement pattern, remoteness and degree of tranquillity. The
survey of baseline conditions was derived from observation on site (January 2004) of the
landscape. (See Figure 7.3)
LCA 1 – Shingle Ridge (Beach) 7.33 Consisting of the area known as Slapton Sands, the beach is characterised by an elevated
shingle bar which extends 5.6km from Limpet Rocks at Torcross at the south of the study area
to Shiphill Rock at Strete to the North. The area of this shingle ridge zone fluctuates in width
from the edge of the Ley to the low tide mark, from approximately 100 – 140m across, with the
average height of the crest being 6.0m above ordnance datum. The ridge itself is characterised
by a mix of aggregates including flint, chert and quartz, which gives the shingle bar a general
buff colour. Perched on top of the ridge is located the A379 which traverses the bar along its
length. The crest of the bar is sparsely vegetated however as the influence of the salt spray is
reduced on the leeward side of the bar, the shingle becomes fully vegetated.
LCA 2 - Fresh Open Water 7.34 Within the Study area Slapton Ley forms the major component of LCA2, and the largest natural
fresh water body in southwest England. The area is characterised by a generally linear water
body running parallel with the shingle bar of Slapton Sands. The Ley is split into two sections
the Lower Ley to the south and the Higher Ley to the north separated by Slapton Bridge.
LCA 3 - Reed Beds/Aquatic Marginals/Carr Woodland 7.35 Surrounding the periphery of the Ley and extending inland to the base of the river valley’s large
areas of Reed Bed and marginal species have colonised the shallow edges of the Ley giving a
distinctive landscape character and feel to these areas. Further along the River Valley’s the reed
Slapton Coastal Zone Management Main Study Volume 1: Phase 1 Report (I)
August 2006, Scott Wilson 7-9
beds are slowly replaced by Willow and Alder Carr woodland. This landscape character area
follows the wetter parts of the valley bottom associated with the stream channels.
LCA 4 – Deciduous Woodlands 7.36 Deciduous woodland valleys rise steeply from the valley floors contrasting strongly with the
reed-fringed freshwater lagoons and wet pasture of the valleys. The woodlands dominate only
the steepest slopes where agricultural practices are impractical, and abruptly stop as soon as
the topography changes to form a less steep profile. Other areas of Exotic woodland planting
are located in the north of the study area adjacent to Strete Gate and in the south of the study
area adjacent to Stokeley Manor. Here groups of Holm Oak, Monterey Pine and other non-
native species have been planted in association with large isolated properties and small
plantations probably to act as shelterbelts.
LCA 5 - Sea Cliffs 7.37 To the North and South of the study area are located two distinct but separate areas with similar
properties that define LCA5. These two areas consist of Limpet Rocks at Torcross and Shiphill
Rock at Strete. The Cliff consists of Lower Devonian Slates and Sandstone and rise
approximately 50m above sea level. Both areas afford extensive views of LCA 1, 2 and 3. The
Cliffs appear to contain and punctuate the shingle bar of Slapton Sands and also frame views of
the sea when viewed from inland.
7.38 The LCA itself not only consists of the rear vertical cliff faces but also includes a narrow zone of
cliff top scrub separating this area from the agricultural use of the plateau.
LCA 6 - Arable Plateau 7.39 The plateau surfaces are located at approximately 100m above sea level. These areas are
characterised by smoothly profiled slopes used predominately for arable production resulting in
large scale fields well clipped hedges with few hedgerow trees and a remote isolated feel.
LCA 7 - Pastoral Plateau 7.40 As the rolling landform of the Plateau gradually steepens, arable land use changes to pastoral
fields of a smaller more intimate nature containing more hedgerow trees and isolated
farmsteads and properties.
LCA 8 - Settlements 7.41 Within the study area are located 4 main settlements Slapton, Torcross, Strete and Stokenham.
All are located in less exposed locations away from the top of the plateaux yet above the wet
valley floors. Many of the traditional buildings remain in these settlements constructed of local
stone cob and thatch, however all settlement have more modern buildings constructed of Brick,
Render and Concrete Tile. All older parts of the settlements have an intimate feel due to
relatively high-density building and narrow contorted street patterns.

Slapton Coastal Zone Management Main Study Volume 1: Phase 1 Report (I)
August 2006, Scott Wilson 7-10
LCA 9 - Market Garden/Orchards 7.42 Within the study area east of Torcross one area of land represents a different LCA to other
forms of agricultural production. The area surrounding Stockley Barton consists of a
commercial market gardens which gives a zone characterised by small-scale fields planted with
high value produce such as vines, fruit canes and orchard trees. These plantings give a unique
and slightly regimented character to this area of study zone.
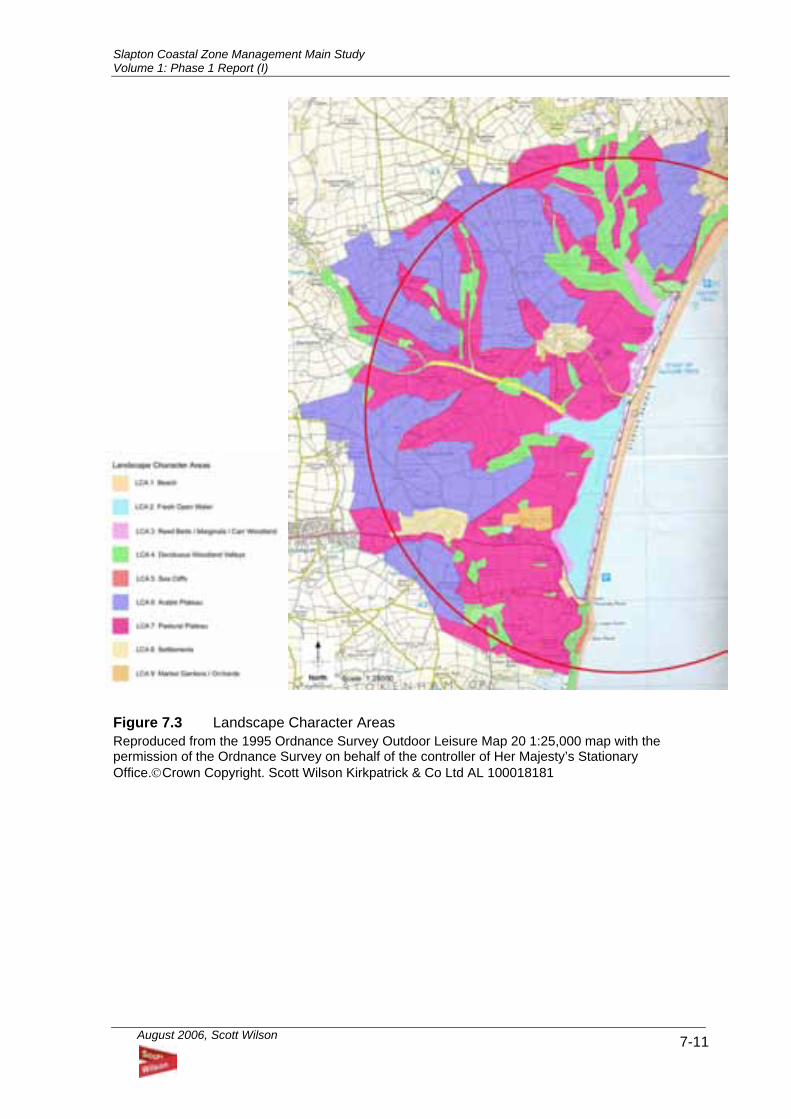
Slapton Coastal Zone Management Main Study Volume 1: Phase 1 Report (I)
August 2006, Scott Wilson 7-11
Figure 7.3 Landscape Character Areas Reproduced from the 1995 Ordnance Survey Outdoor Leisure Map 20 1:25,000 map with the permission of the Ordnance Survey on behalf of the controller of Her Majesty’s Stationary Office.©Crown Copyright. Scott Wilson Kirkpatrick & Co Ltd AL 100018181
Slapton Coastal Zone Management Main Study Volume 1: Phase 1 Report (I)
August 2006, Scott Wilson 7-12
Visual Analysis 7.43 Within the study area key viewpoints and ridge lines were identified, these are shown on Figure
7.4 and with photographs on the following pages.
Key Visual Receptors 7.44 Within the baseline study visual receptors have been grouped based upon their sensitivity to
change, activity within the study area, and length of time spent within the study area.
Highly Sensitive Receptors Local Residents 7.45 Local residents are classed as high sensitivity receptors due to their acute perception of change
to their surroundings, generally passive recreational use of their neighbourhood and high degree
of time spent within the study area. Within the zone of investigation any future change within
the study area is likely to be classed as having a significant negative impact upon this group of
receptors.
7.46 The main groups of local residents have been identified at Strete, Slapton, Torcross and
Stokenham.
7.47 Of these identified receptors, the historic village cores of Slapton and Stokenham have limited
views of the study area due to their generally sheltered locations within the landscape, protected
from exposed coastlines and prevailing winds. Where, however, newer houses have been
constructed such as Towns End Cross on the south western edge of Slapton and on the
western fringe of Stokenham, less protected areas have been built upon thus providing more
extensive views across the study zone.
7.48 The other areas of grouped residential receptors were identified at Torcross and Strete. Due to
their generally elevated and more exposed locations, most residences offered uninterrupted
views across the eastern section of the study area across Slapton Sands, to the north and south
respectively.
7.49 Within Torcross two main clusters of highly sensitive visual receptors with extensive views
across the study area were identified. These included the Lea Cliff Cottages, which run parallel
with the A379 adjacent to the Ley at Torcross. Due to their proximity to the Ley they have
extensive views to the North across the Lower Ley towards the village of Strete. To the south of
Lea Cliff cottages further residences with extensive views across the area were also identified.
These are located along the ridge line which runs from Torcross through Widewell to
Mattiscombe farm. The majority of residences in this location have extensive views to the north
across the Ley and further inland along the A379 Corridor towards Stokenham.
Slapton Coastal Zone Management Main Study Volume 1: Phase 1 Report (I)
August 2006, Scott Wilson 7-13
7.50 A number of other residential visual receptors were identified across the entire study area made
up of a wide range of different building styles and types from historic farmsteads, chapels and
schools to more modern residential properties. Generally the majority of residential dwellings
were located on the valley sides out of the prevailing winds and exposed locations, however,
extensive views were still possible from a large number of these sensitive receptors across the
study area.
South West Coast Path National Trail Users 7.51 Footpath users, of the ‘South West Coast Path National Trail‘ although transient in nature are
classed as highly sensitive receptors. Views of the study area are prevalent along the entire
length of the coastal path as it dissects the study zone. The most extensive views are possible
from the north and south boundaries of the study area on the elevated cliff top locations at
Torcross Point and Strete Gate to the south and north of the zone respectively.
Local Footpath and Road Users 7.52 Due to the tourist utilisation of the study area local footpath and road users are considered to be
sensitive visual receptors. Within the study area, these users have a range of views depending
upon the topography, land use and vegetation cover of the footpath or road. Generally the most
extensive views of the study area are afforded from the open expansive areas to the east of the
study zone adjacent to the Ley, and from the elevated ridgeline to the west of Torcross, and at
Strete Gate. Other routes, which traverse the higher parts of the plateau at locations such as
Coleridge Cross also provide good viewpoints across the study area. In most other inland areas
away from the higher plateau, views are more contained due to the sunken nature of the lanes
and footpaths, with views only generally afforded in breaks in the hedgerows such as gateways
or at the intersection of routes.
Touring Caravan/Campsite Users 7.53 Two sites were located within the study area one at Slapton and a further at Stokenham
adjacent to Stokeley Manor. Of these two sites it appears that the Slapton facility would provide
much more extensive views, of the study area, with the main views towards Strete Gate across
the Higher Ley. The campsite at Stokenham due to its containment within a relatively enclosed
section of the valley is perceived as having limited views of the surrounding study area.
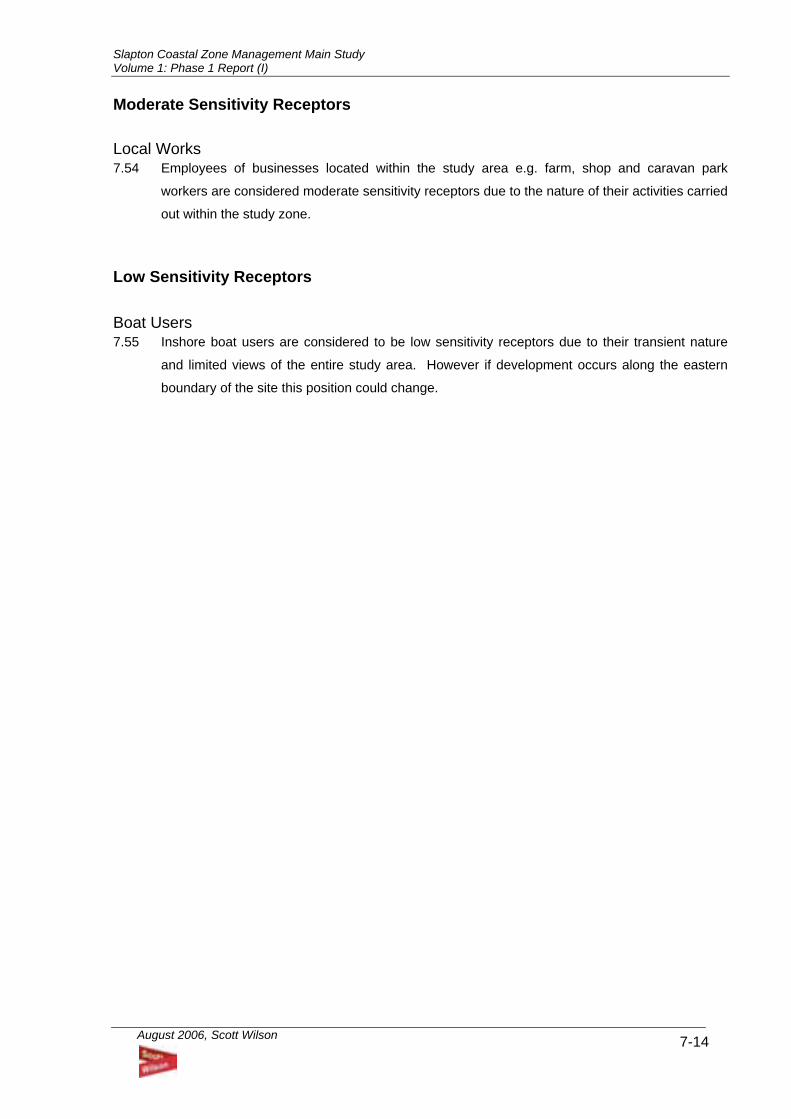
Slapton Coastal Zone Management Main Study Volume 1: Phase 1 Report (I)
August 2006, Scott Wilson 7-14
Moderate Sensitivity Receptors Local Works 7.54 Employees of businesses located within the study area e.g. farm, shop and caravan park
workers are considered moderate sensitivity receptors due to the nature of their activities carried
out within the study zone.
Low Sensitivity Receptors Boat Users 7.55 Inshore boat users are considered to be low sensitivity receptors due to their transient nature
and limited views of the entire study area. However if development occurs along the eastern
boundary of the site this position could change.
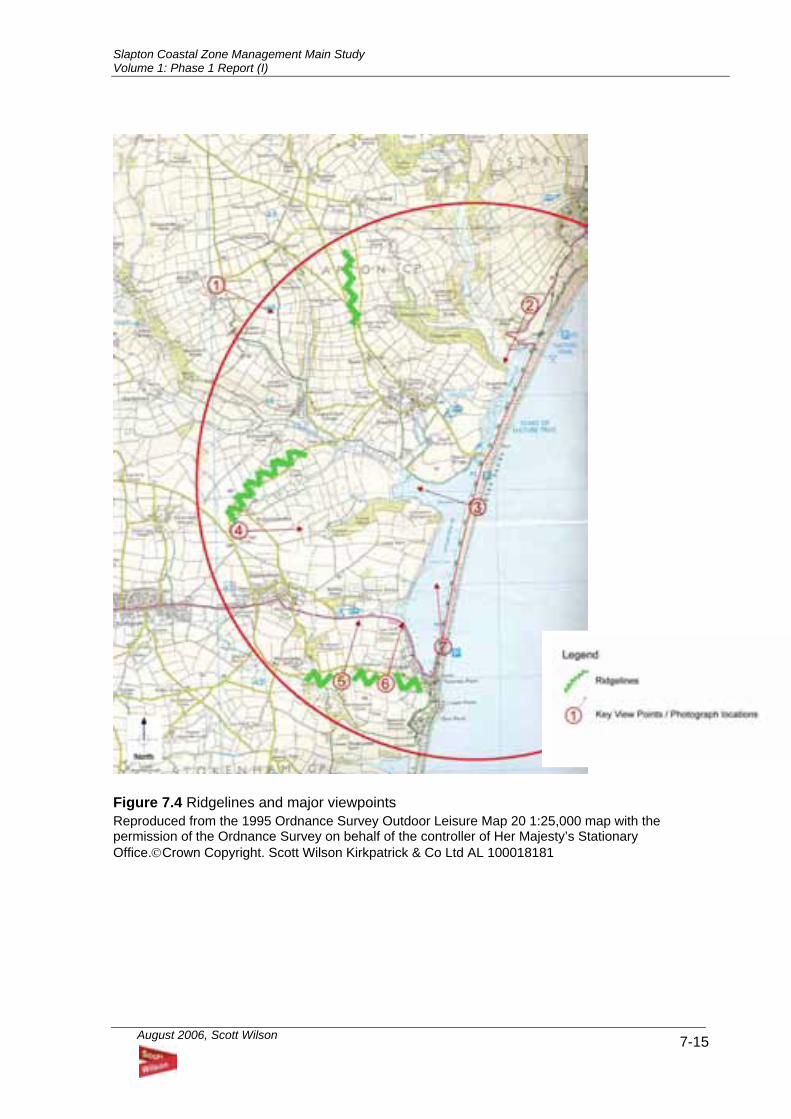
Slapton Coastal Zone Management Main Study Volume 1: Phase 1 Report (I)
August 2006, Scott Wilson 7-15
Figure 7.4 Ridgelines and major viewpoints Reproduced from the 1995 Ordnance Survey Outdoor Leisure Map 20 1:25,000 map with the permission of the Ordnance Survey on behalf of the controller of Her Majesty’s Stationary Office.©Crown Copyright. Scott Wilson Kirkpatrick & Co Ltd AL 100018181
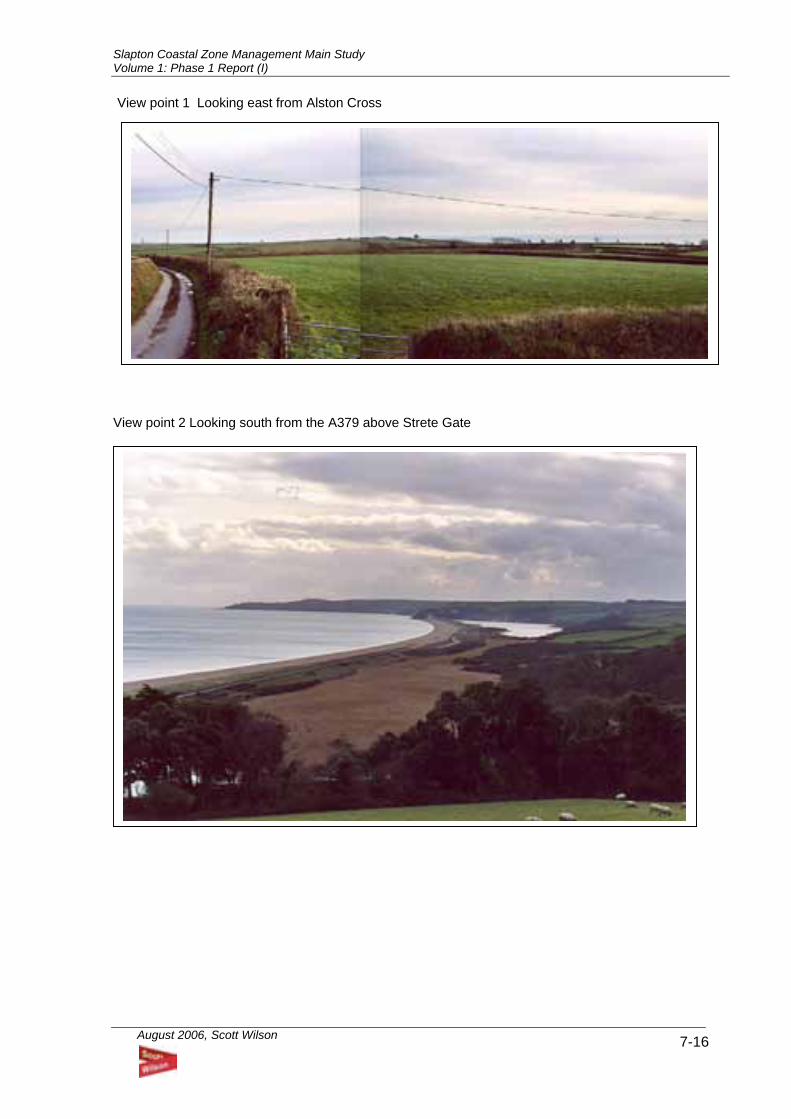
Slapton Coastal Zone Management Main Study Volume 1: Phase 1 Report (I)
August 2006, Scott Wilson 7-16
View point 1 Looking east from Alston Cross
View point 2 Looking south from the A379 above Strete Gate
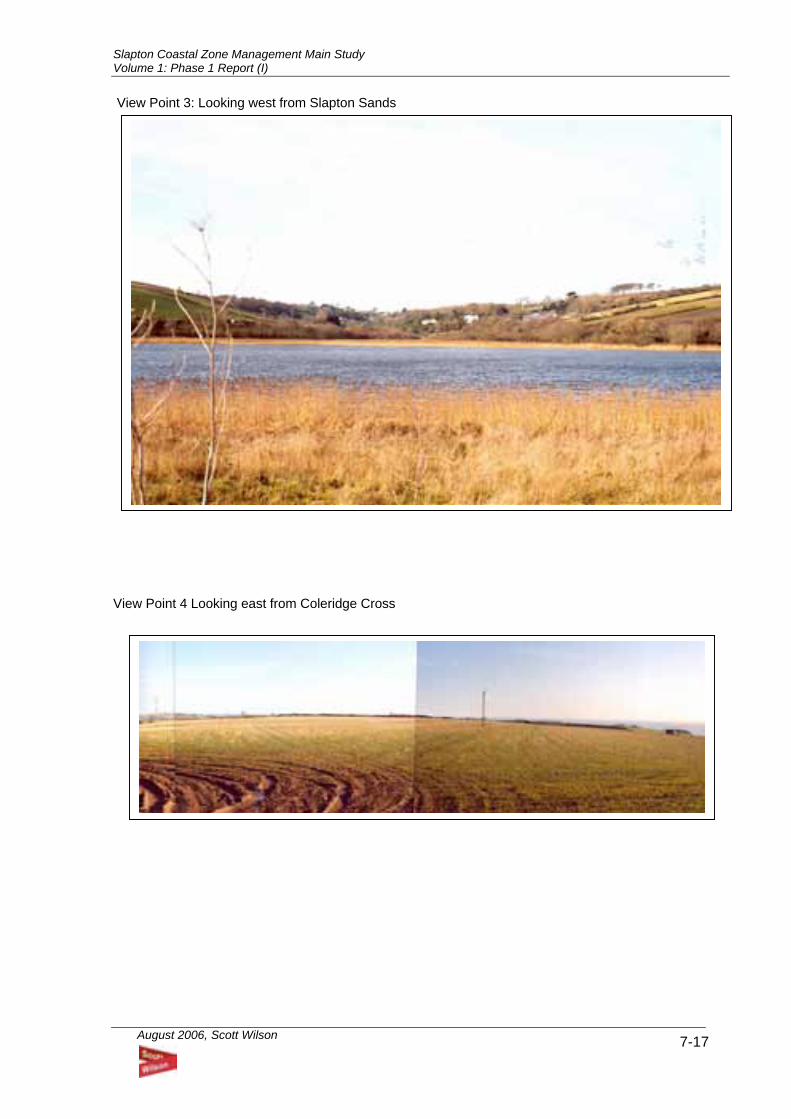
Slapton Coastal Zone Management Main Study Volume 1: Phase 1 Report (I)
August 2006, Scott Wilson 7-17
View Point 3: Looking west from Slapton Sands
View Point 4 Looking east from Coleridge Cross
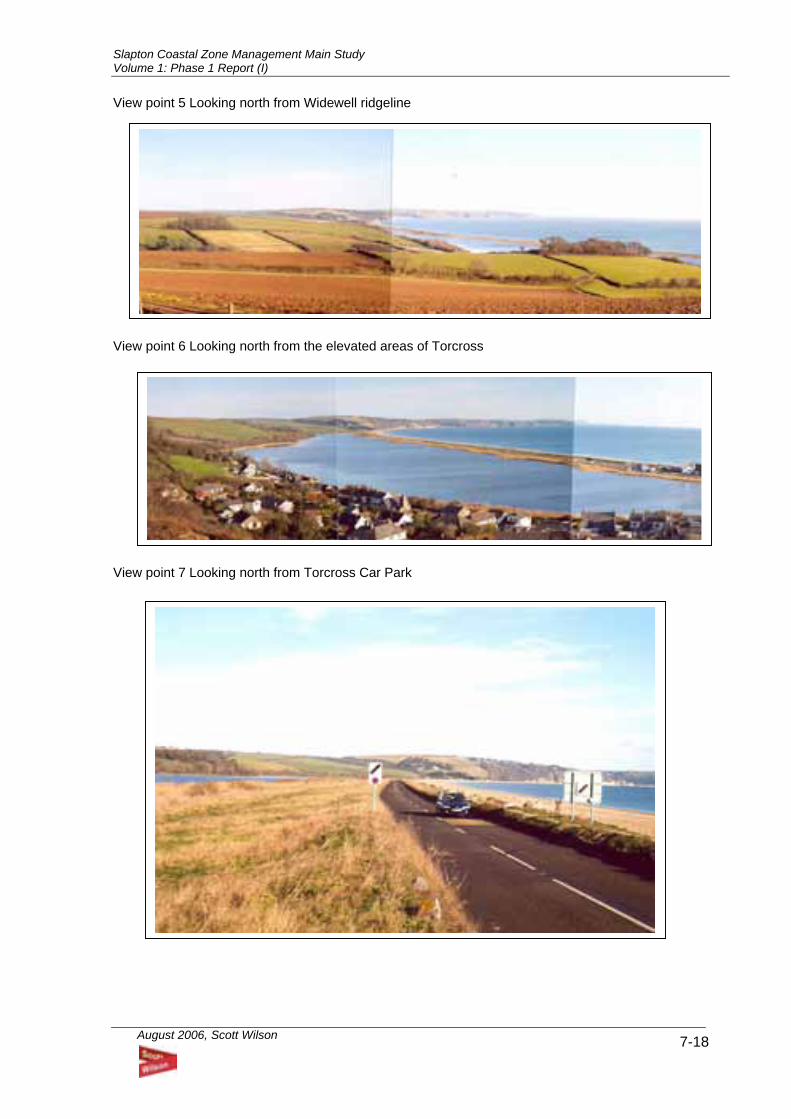
Slapton Coastal Zone Management Main Study Volume 1: Phase 1 Report (I)
August 2006, Scott Wilson 7-18
View point 5 Looking north from Widewell ridgeline
View point 6 Looking north from the elevated areas of Torcross
View point 7 Looking north from Torcross Car Park
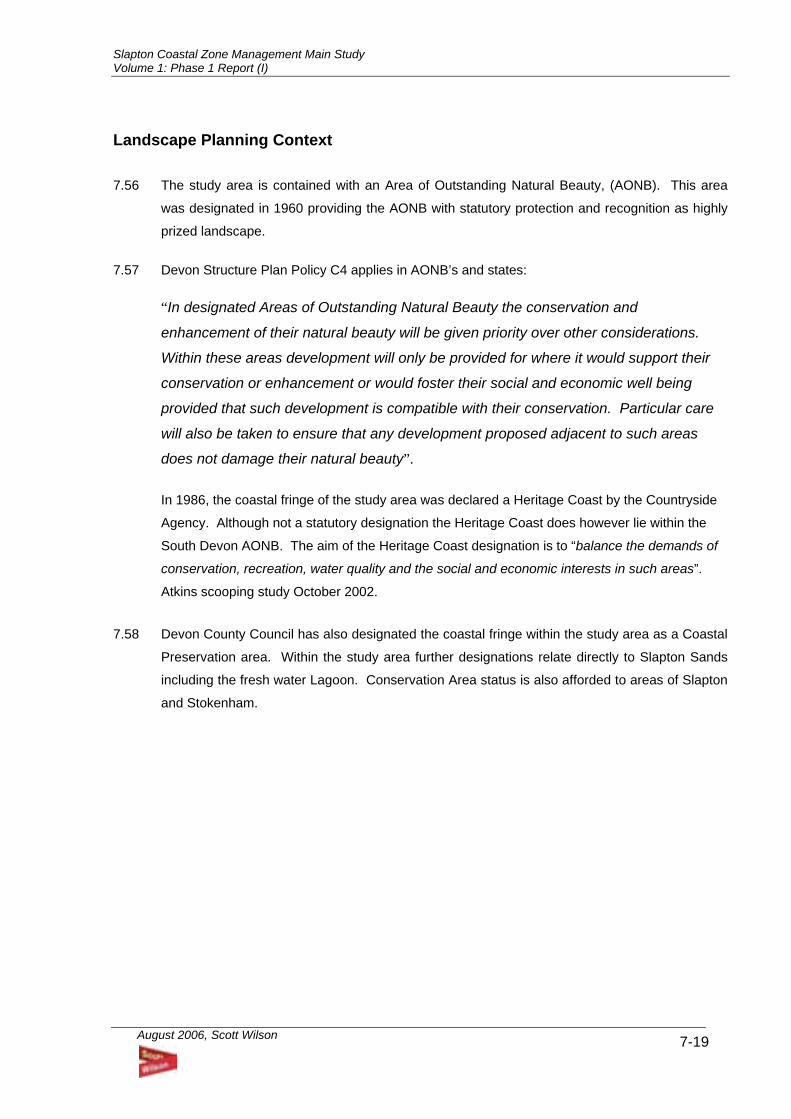
Slapton Coastal Zone Management Main Study Volume 1: Phase 1 Report (I)
August 2006, Scott Wilson 7-19
Landscape Planning Context 7.56 The study area is contained with an Area of Outstanding Natural Beauty, (AONB). This area
was designated in 1960 providing the AONB with statutory protection and recognition as highly
prized landscape.
7.57 Devon Structure Plan Policy C4 applies in AONB’s and states:
“In designated Areas of Outstanding Natural Beauty the conservation and
enhancement of their natural beauty will be given priority over other considerations.
Within these areas development will only be provided for where it would support their
conservation or enhancement or would foster their social and economic well being
provided that such development is compatible with their conservation. Particular care
will also be taken to ensure that any development proposed adjacent to such areas
does not damage their natural beauty”.
In 1986, the coastal fringe of the study area was declared a Heritage Coast by the Countryside
Agency. Although not a statutory designation the Heritage Coast does however lie within the
South Devon AONB. The aim of the Heritage Coast designation is to “balance the demands of
conservation, recreation, water quality and the social and economic interests in such areas”.
Atkins scooping study October 2002.
7.58 Devon County Council has also designated the coastal fringe within the study area as a Coastal
Preservation area. Within the study area further designations relate directly to Slapton Sands
including the fresh water Lagoon. Conservation Area status is also afforded to areas of Slapton
and Stokenham.
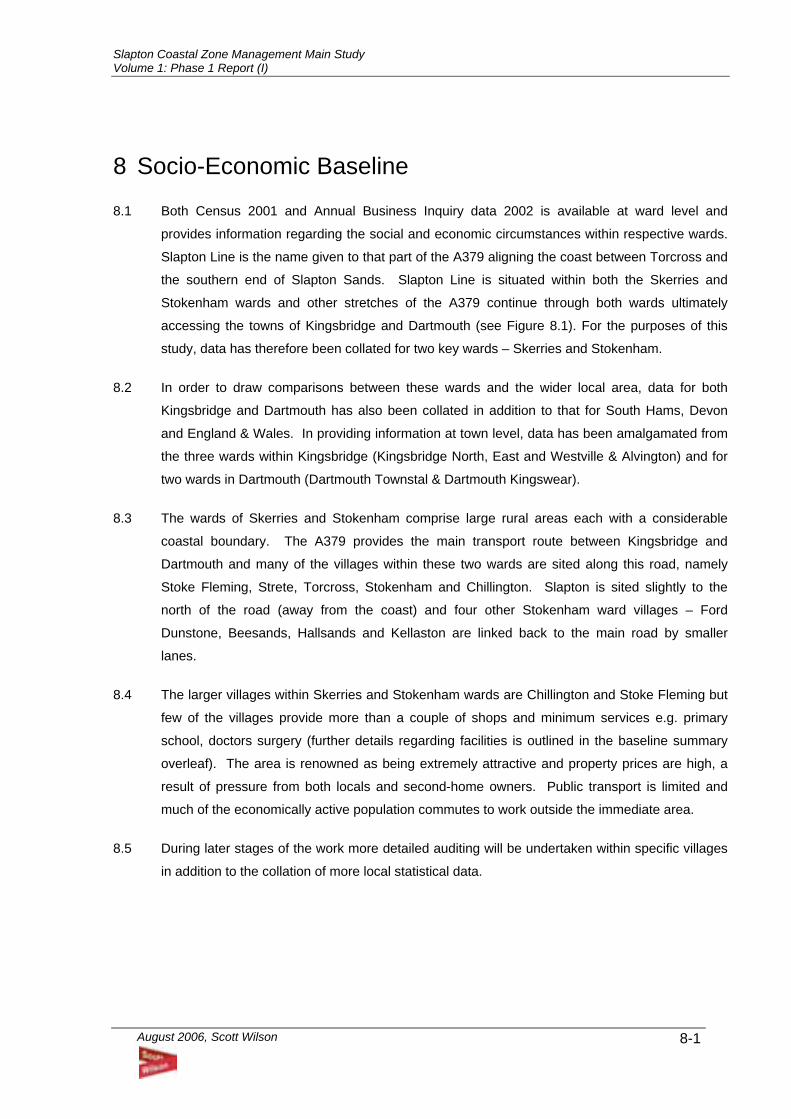
Slapton Coastal Zone Management Main Study Volume 1: Phase 1 Report (I)
August 2006, Scott Wilson
8-1
8 Socio-Economic Baseline
8.1 Both Census 2001 and Annual Business Inquiry data 2002 is available at ward level and
provides information regarding the social and economic circumstances within respective wards.
Slapton Line is the name given to that part of the A379 aligning the coast between Torcross and
the southern end of Slapton Sands. Slapton Line is situated within both the Skerries and
Stokenham wards and other stretches of the A379 continue through both wards ultimately
accessing the towns of Kingsbridge and Dartmouth (see Figure 8.1). For the purposes of this
study, data has therefore been collated for two key wards – Skerries and Stokenham.
8.2 In order to draw comparisons between these wards and the wider local area, data for both
Kingsbridge and Dartmouth has also been collated in addition to that for South Hams, Devon
and England & Wales. In providing information at town level, data has been amalgamated from
the three wards within Kingsbridge (Kingsbridge North, East and Westville & Alvington) and for
two wards in Dartmouth (Dartmouth Townstal & Dartmouth Kingswear).
8.3 The wards of Skerries and Stokenham comprise large rural areas each with a considerable
coastal boundary. The A379 provides the main transport route between Kingsbridge and
Dartmouth and many of the villages within these two wards are sited along this road, namely
Stoke Fleming, Strete, Torcross, Stokenham and Chillington. Slapton is sited slightly to the
north of the road (away from the coast) and four other Stokenham ward villages – Ford
Dunstone, Beesands, Hallsands and Kellaston are linked back to the main road by smaller
lanes.
8.4 The larger villages within Skerries and Stokenham wards are Chillington and Stoke Fleming but
few of the villages provide more than a couple of shops and minimum services e.g. primary
school, doctors surgery (further details regarding facilities is outlined in the baseline summary
overleaf). The area is renowned as being extremely attractive and property prices are high, a
result of pressure from both locals and second-home owners. Public transport is limited and
much of the economically active population commutes to work outside the immediate area.
8.5 During later stages of the work more detailed auditing will be undertaken within specific villages
in addition to the collation of more local statistical data.

Slapton Coastal Zone Management Main Study Volume 1: Phase 1 Report (I)
August 2006, Scott Wilson
8-2
Baseline Summary
• The age structure of both Skerries and Stokenham wards is weighted towards the older
generations. The number of pensioner households is over 10% higher than for Devon.
• The majority of homes within the key wards are owner occupied. Proportions of local
authority and housing association stock are low.
• Second-home ownership is a key issue. Skerries has particularly high rates – almost a third
of properties are second homes, over 2.5 times the rate in South Hams and eight times that
for Devon.
• Neither ward ranks poorly in terms of social exclusion rankings (IMD) however, the relative
inaccessibility of the area combined with limited service provision, a low wage economy and
high house prices create inevitable difficulties for considerable numbers of households
within the area.
• There are high rates of self-employment within the wards possibly attributable to strong
agricultural and tourism sectors as well as the increasing growth of ‘lifestyle businesses’
within the area.
• There are relatively few businesses within the study area – 150 in total and these are
generally small in size (employing between 1 and 4 staff). High levels of businesses are
within the distribution, hotels and catering sector - in Skerries almost a third of businesses
are either hotels or restaurants. Stokenham has an unusually high proportion of
construction businesses.
• There are almost 680 jobs within the two wards (again excluding self employed persons) of
which the distribution, hotels and catering sector and the construction trade account for a
considerable number of positions. The number of jobs within the real estate sector is also
significant.
• Unemployment rates are low though the larger settlements provide some evidence that
there are still seasonal trends in relation to unemployment.
Population 8.6 The population of Skerries is 2005 and Stokenham, 1949. Both Kingsbridge and Dartmouth are
larger settlements with populations in excess of 6,000. The age structure of both Skerries and
Stokenham is weighted towards the older generations; in particular those aged 60-74. As a
consequence the proportions of those aged under 30 is low in comparison to other areas.
Whilst lower than in other areas, the proportion of the population aged 30 to 59 in Skerries and
Stokenham is not as markedly different in other areas as for other age groups. The detailed
profile is presented in Table 8.1 on the next page.
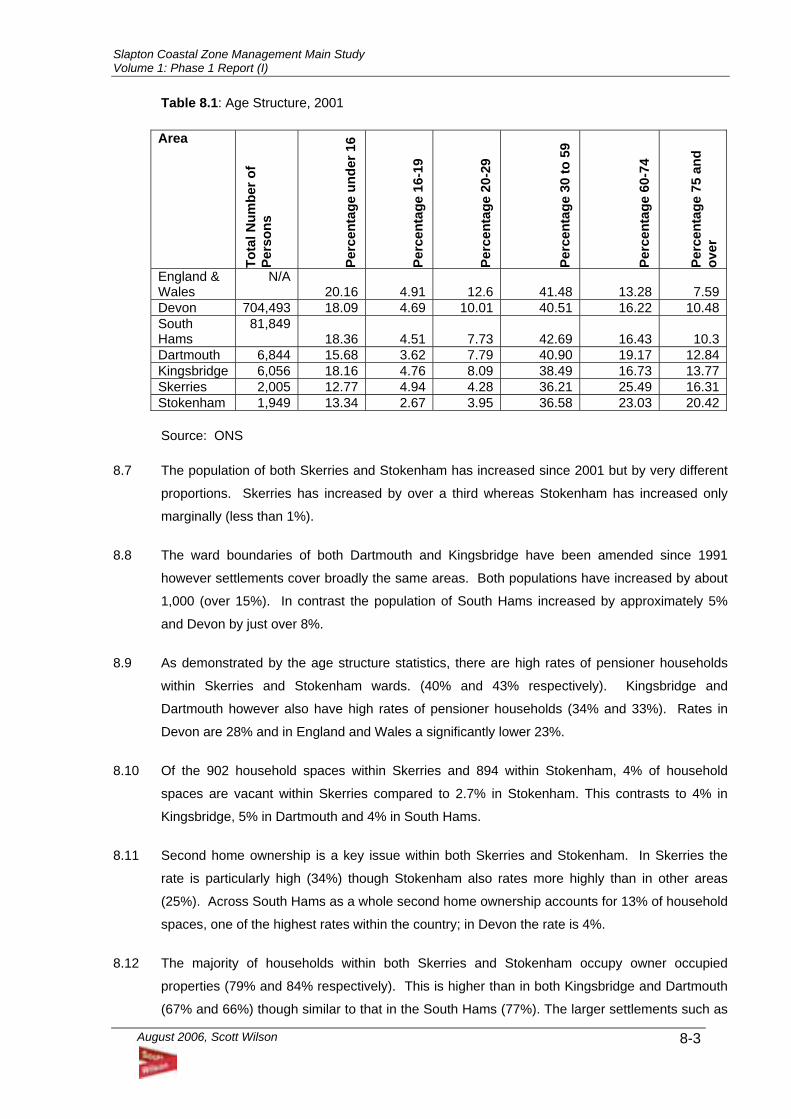
Slapton Coastal Zone Management Main Study Volume 1: Phase 1 Report (I)
August 2006, Scott Wilson
8-3
Table 8.1: Age Structure, 2001
Area To
tal N
umbe
r of
Pers
ons
Perc
enta
ge u
nder
16
Perc
enta
ge 1
6-19
Perc
enta
ge 2
0-29
Perc
enta
ge 3
0 to
59
Perc
enta
ge 6
0-74
Perc
enta
ge 7
5 an
d ov
er
England & Wales
N/A 20.16 4.91 12.6 41.48 13.28 7.59
Devon 704,493 18.09 4.69 10.01 40.51 16.22 10.48South Hams
81,849 18.36 4.51 7.73 42.69 16.43 10.3
Dartmouth 6,844 15.68 3.62 7.79 40.90 19.17 12.84Kingsbridge 6,056 18.16 4.76 8.09 38.49 16.73 13.77Skerries 2,005 12.77 4.94 4.28 36.21 25.49 16.31Stokenham 1,949 13.34 2.67 3.95 36.58 23.03 20.42 Source: ONS
8.7 The population of both Skerries and Stokenham has increased since 2001 but by very different
proportions. Skerries has increased by over a third whereas Stokenham has increased only
marginally (less than 1%).
8.8 The ward boundaries of both Dartmouth and Kingsbridge have been amended since 1991
however settlements cover broadly the same areas. Both populations have increased by about
1,000 (over 15%). In contrast the population of South Hams increased by approximately 5%
and Devon by just over 8%.
8.9 As demonstrated by the age structure statistics, there are high rates of pensioner households
within Skerries and Stokenham wards. (40% and 43% respectively). Kingsbridge and
Dartmouth however also have high rates of pensioner households (34% and 33%). Rates in
Devon are 28% and in England and Wales a significantly lower 23%.
8.10 Of the 902 household spaces within Skerries and 894 within Stokenham, 4% of household
spaces are vacant within Skerries compared to 2.7% in Stokenham. This contrasts to 4% in
Kingsbridge, 5% in Dartmouth and 4% in South Hams.
8.11 Second home ownership is a key issue within both Skerries and Stokenham. In Skerries the
rate is particularly high (34%) though Stokenham also rates more highly than in other areas
(25%). Across South Hams as a whole second home ownership accounts for 13% of household
spaces, one of the highest rates within the country; in Devon the rate is 4%.
8.12 The majority of households within both Skerries and Stokenham occupy owner occupied
properties (79% and 84% respectively). This is higher than in both Kingsbridge and Dartmouth
(67% and 66%) though similar to that in the South Hams (77%). The larger settlements such as
Slapton Coastal Zone Management Main Study Volume 1: Phase 1 Report (I)
August 2006, Scott Wilson
8-4
Kingsbridge and Dartmouth have higher rates of Housing Association/Registered Social
Landlord properties and also Council owner accommodation. The largest proportion of stock
other than owner occupied within Skerries and Stokenham is private rented accommodation
(7.4% in Skerries and 6% in Stokenham).
8.13 The average household size within Skerries is 2.1 and 2.09 in Stokenham. This is similar to that
across South Hams and little different to that in Kingsbridge (2.19) and Dartmouth (2.1). The
average household size in England and Wales is 2.36. Household spaces within Skerries and
Stokenham are on average slightly larger than those in other comparison areas (6.04 and 5.81
rooms per household as compared to 5.29 in Dartmouth, 5.22 in Kingsbridge and 5.74 in South
Hams). This is borne out in terms of the larger proportion of housing stock within Skerries and
Stokenham, which are detached, or semi detached. There are much lower proportions of flats
and terraced properties within these wards as compared with the larger settlements of
Kingsbridge and Dartmouth.
Social Deprivation 8.14 The 2000 Index of Multiple Deprivation (IMD) indicates that Skerries ranks 3612th within
England. This is within the worst 45% of wards nationally however cannot be considered a
particularly poor rating in comparison with other wards within Devon. Stokenham ranks 3452nd
and rankings within Dartmouth and Kingsbridge range from 2770 to 3181, highlighting that on a
national basis none of the wards within the study area ranks particularly poorly.
8.15 The number of people within Skerries and Stokenham wards with long term limiting illness is
higher than in other comparison areas (24.4% and 35.6% as compared to 21.4% in Kingsbridge,
22% in Dartmouth and 18.7% in South Hams). It is probable that this is linked to the high
proportion of elderly people within the area. The lower than average incidence of long term
illness in residents of working age within Skerries and Stokenham adds credence to this
assessment.
8.16 Within Skerries 262 people (13%) provide unpaid care to others; within Stokenham this figure is
266 (14%). These are higher rates than within Kingsbridge, Dartmouth and South Hams (closer
to 10%). This again may be as a direct result of the large proportion of elderly people within the
ward but may also be a consequence of the relatively rural ness of the area and as such the
distance to services.
8.17 There are 25 lone parent households (with dependant children) within Skerries and 24 within
Stokenham (2.7% and 2.6% of total households within the wards). This contrasts to 5.5% in
Kingsbridge, 4.9% in Dartmouth and 5% in South Hams. The majority of these lone parent
households comprise female parents though within Stokenham the rates of lone parent
households in employment (part of full time) are higher than those in Skerries (82% as
compared to 50%).
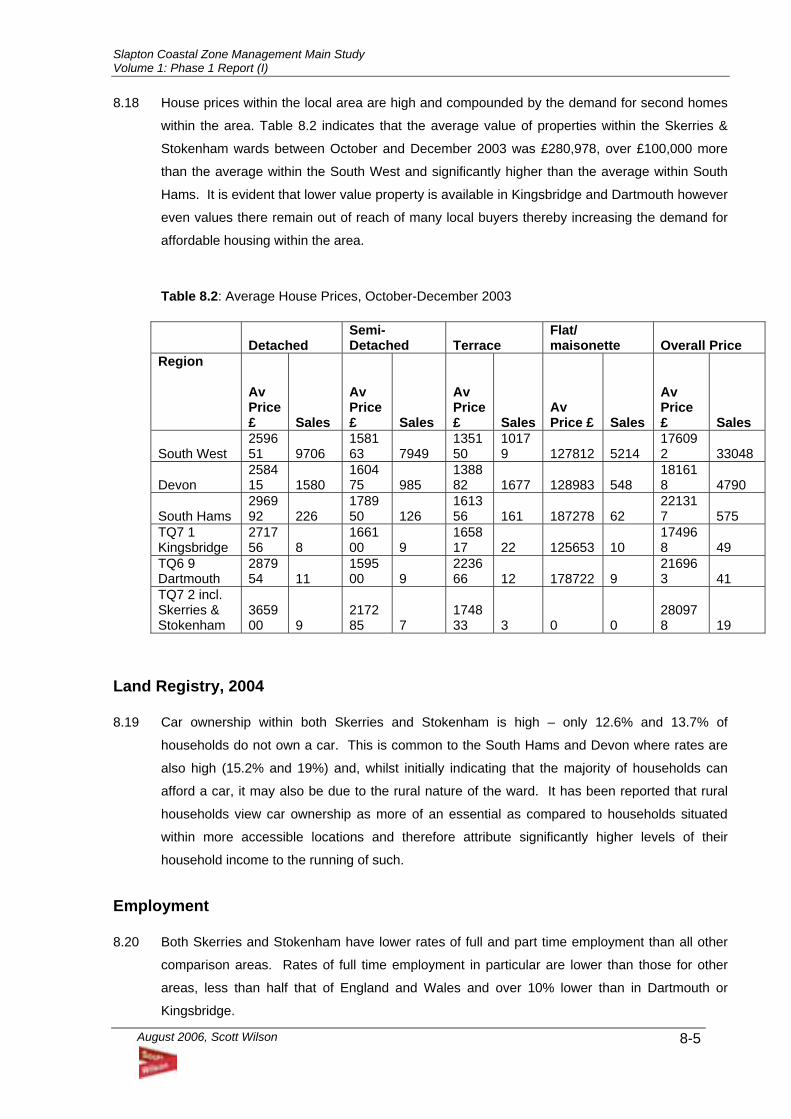
Slapton Coastal Zone Management Main Study Volume 1: Phase 1 Report (I)
August 2006, Scott Wilson
8-5
8.18 House prices within the local area are high and compounded by the demand for second homes
within the area. Table 8.2 indicates that the average value of properties within the Skerries &
Stokenham wards between October and December 2003 was £280,978, over £100,000 more
than the average within the South West and significantly higher than the average within South
Hams. It is evident that lower value property is available in Kingsbridge and Dartmouth however
even values there remain out of reach of many local buyers thereby increasing the demand for
affordable housing within the area.
Table 8.2: Average House Prices, October-December 2003
Detached Semi-Detached Terrace
Flat/ maisonette Overall Price
Region
Av Price £ Sales
Av Price £ Sales
Av Price £ Sales
Av Price £ Sales
Av Price £ Sales
South West 259651 9706
158163 7949
135150
10179 127812 5214
176092 33048
Devon 258415 1580
160475 985
138882 1677 128983 548
181618 4790
South Hams 296992 226
178950 126
161356 161 187278 62
221317 575
TQ7 1 Kingsbridge
271756 8
166100 9
165817 22 125653 10
174968 49
TQ6 9 Dartmouth
287954 11
159500 9
223666 12 178722 9
216963 41
TQ7 2 incl. Skerries & Stokenham
365900 9
217285 7
174833 3 0 0
280978 19
Land Registry, 2004 8.19 Car ownership within both Skerries and Stokenham is high – only 12.6% and 13.7% of
households do not own a car. This is common to the South Hams and Devon where rates are
also high (15.2% and 19%) and, whilst initially indicating that the majority of households can
afford a car, it may also be due to the rural nature of the ward. It has been reported that rural
households view car ownership as more of an essential as compared to households situated
within more accessible locations and therefore attribute significantly higher levels of their
household income to the running of such.
Employment 8.20 Both Skerries and Stokenham have lower rates of full and part time employment than all other
comparison areas. Rates of full time employment in particular are lower than those for other
areas, less than half that of England and Wales and over 10% lower than in Dartmouth or
Kingsbridge.

Slapton Coastal Zone Management Main Study Volume 1: Phase 1 Report (I)
August 2006, Scott Wilson
8-6
8.21 Rates of self-employment are however significantly higher than that for England and Wales and
considerably higher than that for the district, which itself is acknowledged as having high rates of
self employed workers. Several reasons may be attributable to this fact – strong agricultural
and tourism sectors historically have high rates of self-employment and the increasing growth of
‘lifestyle businesses’ within the district may have had some impact of self-employment rates.
Unemployment rates are particularly low in Skerries and in Stokenham are broadly in line with
those of the wider area.
Table 8.3: Economic Activity, 2001 Census
Varia
bles
A
ll pe
ople
age
d 16
-74
Perc
enta
ge o
f peo
ple
aged
16
- 74:
Ec
onom
ical
ly a
ctiv
e:
Empl
oyee
s: P
art-
time*
Perc
enta
ge o
f peo
ple
aged
16
- 74:
Ec
onom
ical
ly a
ctiv
e:
Empl
oyee
s: F
ull-t
ime*
Perc
enta
ge o
f peo
ple
aged
16
- 74:
Ec
onom
ical
ly a
ctiv
e:
Self-
empl
oyed
Perc
enta
ge o
f peo
ple
aged
16
- 74:
Ec
onom
ical
ly a
ctiv
e:
Une
mpl
oyed
England & Wales - 11.78 40.55 8.28 3.35 Devon 503212 13.38 34.36 12.6 2.54 South Hams 58398 13.24 32.93 15.19 2.31 Dartmouth 4892 12.59 30.50 14.43 2.90 Kingsbridge 4122 15.91 29.40 14.26 2.04 Skerries 1422 9.49 19.34 20.75 1.83 Stokenham 1291 11.7 18.98 20.68 2.48
Source: ONS
8.22 The largest proportion of economically inactive residents within Skerries and Stokenham are
retired (28.7% and 30.1%), contrasting to 20.8% in Dartmouth and 19.2% in Kingsbridge. In
England and Wales the rate is 13.6% however Devon has historically high levels of retirees and
South Hams is no exception (18%).
8.23 Of those economically inactive people who are unemployed, the proportions within Skerries and
Stokenham who have never worked is higher than in other areas (11.5% and 9.4%). Similarly,
the proportion of unemployed who are long term unemployed is higher than in other areas
(nearer 30% in Skerries and Stokenham whereas 25% in South Hams). Given that the overall
rates of unemployment are however very low, this is not considered a dominant factor within the
employment structure of the wards.
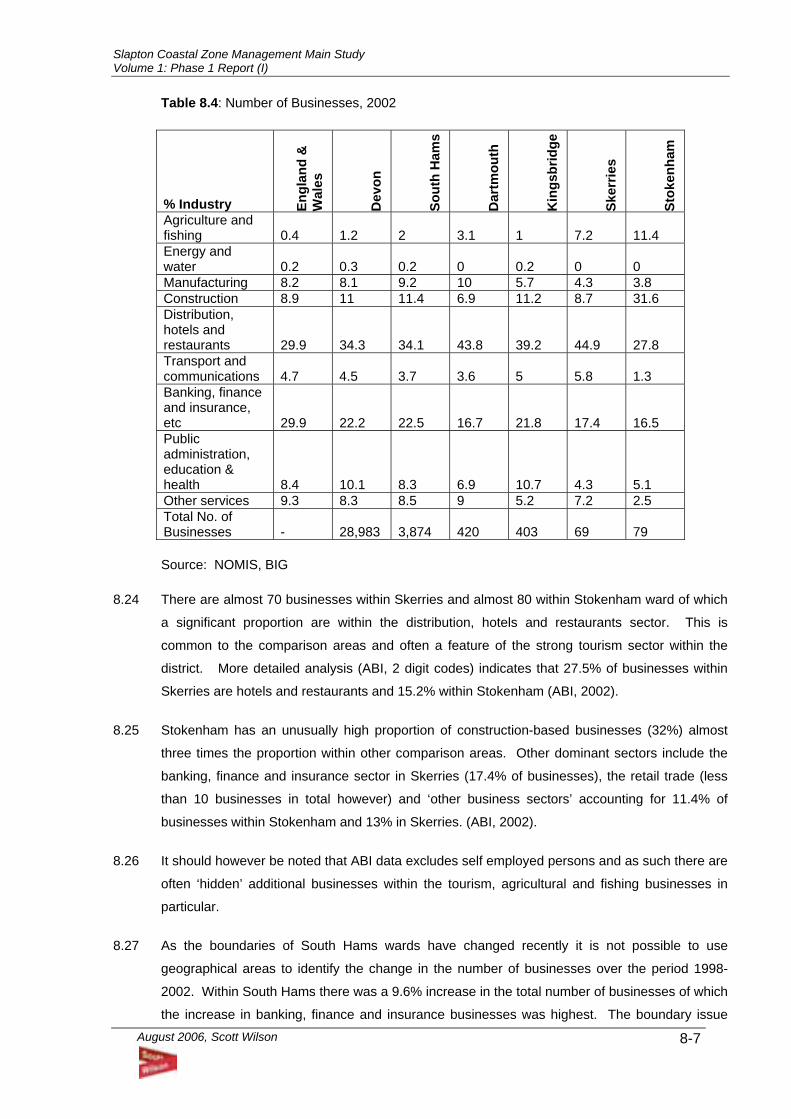
Slapton Coastal Zone Management Main Study Volume 1: Phase 1 Report (I)
August 2006, Scott Wilson
8-7
Table 8.4: Number of Businesses, 2002
% Industry Engl
and
&
Wal
es
Dev
on
Sout
h H
ams
Dar
tmou
th
Kin
gsbr
idge
Sker
ries
Stok
enha
m
Agriculture and fishing 0.4 1.2 2 3.1 1 7.2 11.4 Energy and water 0.2 0.3 0.2 0 0.2 0 0 Manufacturing 8.2 8.1 9.2 10 5.7 4.3 3.8 Construction 8.9 11 11.4 6.9 11.2 8.7 31.6 Distribution, hotels and restaurants 29.9 34.3 34.1 43.8 39.2 44.9 27.8 Transport and communications 4.7 4.5 3.7 3.6 5 5.8 1.3 Banking, finance and insurance, etc 29.9 22.2 22.5 16.7 21.8 17.4 16.5 Public administration, education & health 8.4 10.1 8.3 6.9 10.7 4.3 5.1 Other services 9.3 8.3 8.5 9 5.2 7.2 2.5 Total No. of Businesses - 28,983 3,874 420 403 69 79 Source: NOMIS, BIG
8.24 There are almost 70 businesses within Skerries and almost 80 within Stokenham ward of which
a significant proportion are within the distribution, hotels and restaurants sector. This is
common to the comparison areas and often a feature of the strong tourism sector within the
district. More detailed analysis (ABI, 2 digit codes) indicates that 27.5% of businesses within
Skerries are hotels and restaurants and 15.2% within Stokenham (ABI, 2002).
8.25 Stokenham has an unusually high proportion of construction-based businesses (32%) almost
three times the proportion within other comparison areas. Other dominant sectors include the
banking, finance and insurance sector in Skerries (17.4% of businesses), the retail trade (less
than 10 businesses in total however) and ‘other business sectors’ accounting for 11.4% of
businesses within Stokenham and 13% in Skerries. (ABI, 2002).
8.26 It should however be noted that ABI data excludes self employed persons and as such there are
often ‘hidden’ additional businesses within the tourism, agricultural and fishing businesses in
particular.
8.27 As the boundaries of South Hams wards have changed recently it is not possible to use
geographical areas to identify the change in the number of businesses over the period 1998-
2002. Within South Hams there was a 9.6% increase in the total number of businesses of which
the increase in banking, finance and insurance businesses was highest. The boundary issue

Slapton Coastal Zone Management Main Study Volume 1: Phase 1 Report (I)
August 2006, Scott Wilson
8-8
also affects the ability to determine changes in the number of employees over the same period.
(ABI, 2002).
8.28 There are 302 employees (hence jobs) within Stokenham ward and 370 within Skerries. The
majority of employees work within the distribution, hotels and restaurants sector within both
wards (38% in Skerries and 32% in Stokenham) though the construction industry also accounts
for a significant proportion of employees in Stokenham (29.9%) reflecting the relatively large
proportion of construction businesses based there. Other significant employing sectors are
banking, finance and insurance in Skerries (27.8%) and public administration, education and
health in Stokenham (26.5%). (ABI, 2002).
8.29 More detailed ABI data (2-digit code analysis) indicates that there are greater numbers of
employees working within hotels and restaurants than involved with the retail trade in Skerries
and Stokenham (24.9% and 20.6% respectively. Real estate activities account for 25.4% of
jobs in Skerries (over 90 employees) as compared to 0.8% in Stokenham. Other dominant
employment sectors include health and social work in Stokenham (26.1%). (ABI, 2002).
8.30 The majority of businesses within Skerries and Stokenham employ between 1-4 employees
(75% and 80% of businesses respectively) and can be categorised as small businesses. This is
a feature common to many rural areas; within the South Hams 70% of businesses are small.
(ABI, 2002).
8.31 There are however some larger employers within Skerries and Stokenham. Within Skerries 11
businesses employ between 5 and 10 employees (of which 73% are within the distribution,
hotels and restaurants sector) and a further 4 businesses employ between 11 and 24
employees. Within Stokenham there are a similar number of larger businesses (16 with
between 5 and 49 employees) however the largest proportion of these (31%) are within the
construction sector. (ABI, 2002).
8.32 The ABI data as highlighted above, reflects businesses and employees within a ward but gives
no indication of those sectors within which residents of the wards are employed. This data is
available through the 2001 Census however and indicates that the dominant sectors of
employment for residents of both Skerries and Stokenham are the wholesale and retail trade
and those repairing motor vehicles (17.9% and 16.7% of residents respectively). Significant
proportions of residents of both wards are also employed in hotels and restaurants
(approximately 11.5%). In Stokenham residents are also employed within the construction
industry (11.3%), real estate (12%) and health and social work (11.6%). Real estate activities
also employ significant proportions of Skerries residents.
8.33 As referred to earlier, the unemployment rate within Skerries and Stokenham is low; In February
2004 there were 10 unemployed people within Skerries and 9 within Stokenham. It is evident
that unemployment levels have been low since 2001 but there is some indication of seasonality
Slapton Coastal Zone Management Main Study Volume 1: Phase 1 Report (I)
August 2006, Scott Wilson
8-9
trends within the area, especially in wards in Dartmouth and Kingsbridge where unemployment
figures are higher. (Claimant Count, Nomis, 2004)
8.34 The number of vacancies within local job centres also provides an indication as to those sectors
of industry, which are seeking employees. Kingsbridge is the most local job centre for the Study
Area and in February 2004, the highest numbers of vacancies were within the distribution,
hotels and restaurants sector (42% of vacancies). There were also significant proportions within
the banking, finance and insurance sector (36%).
8.35 Reviewing vacancy data over the last year indicates that whilst the distribution, hotels and
catering sector remained the most significant in terms of notified vacancies in June 2003, the
proportion of positions within this industry did decrease significantly (from 53% to 32% between
February and June 2003). This indicates that there are fewer positions available within the
summer period, possibly indicating that employees within the area choose to work the summer
period only or that there is some influx of workers for the summer period only. The fact that
many tourism positions are filled by students over the summer may account for this feature.
Occupational Structure 8.36 The largest proportions of residents within Skerries are employed as managers and senior
officials (23.3% of those aged between 16 and 74 and in employment). This group also
accounts for significant proportions of residents in Stokenham (19.9%) however the largest
sector within this ward comprises those employed within skilled trade occupations (24%).
8.37 Across the District and County the proportion of residents employed as managers and senior
officials is significantly lower than in Stokenham and Skerries (approximately 15% in the wider
area). Within South Hams there is a more balanced occupational structure though overall
skilled trades and managers & senior officials also account for the large proportion of residents
(15.3% and 16.2%).
Earnings 8.38 Data relating to earnings is limited depending on the size of the sample and as such information
for both Skerries and Stokenham is suppressed given their relative small size. Data for the
Dartmouth and Kingsbridge wards (1991 administrative boundaries) is however available and
indicates that the average gross weekly pay for residents in Dartmouth Clifton is £207.04 per
week as compared to £153.75 in Dartmouth Hardness. Kingsbridge has average earnings of
£283.98 per week.
8.39 It is possible to speculate that given the high proportion of residents within Skerries and
Stokenham who are employed as managers and senior officials (traditional higher paid
positions) the earnings may be higher within these wards. There are however also high rates of
Slapton Coastal Zone Management Main Study Volume 1: Phase 1 Report (I)
August 2006, Scott Wilson
8-10
elderly persons (many of whom have relatively low household incomes) and high rates of self-
employment and employment within the distribution, hotels and catering (an often low paid
sector) therefore overall assumptions regarding earnings within the ward should not be made. It
may therefore be more appropriate to review the South Hams average earnings figure - £334.72
per week which, whilst lower than that for England and Wales (£399.92) is significantly higher
than that for Kingsbridge or Dartmouth wards.
Qualifications 8.40 Within England and Wales 29% of people aged between 16 and 74 have no qualifications. This
decreases to 27% in Devon and 22% in South Hams. Within Stokenham and Skerries wards
this however increases (to 28.4% and 26% respectively) and also in Dartmouth and Kingsbridge
(both 27%). The proportion of those attaining the highest qualification (level 4/5) is fairly high
within both Skerries and Stokenham (20.6% and 19.7%) though still lower than rates within
South Hams (23.4%).
Travel to Work 8.41 The majority of those within Skerries and Stokenham wards travel to work by car (54% and 59%
respectively). Despite the very rural nature of the area (which may lead to assumptions of
higher than average car use) this figure is broadly in line with that for England & Wales (55%)
and South Hams (58%). The proportions of those using public transport to access work are
however very low, though this is not dissimilar to the rates within Dartmouth and Kingsbridge.
8.42 The main difference between Skerries and Stokenham wards and the wider area statistics is the
significantly higher rates of residents who work from home (25.6% and 24% respectively). This
contrasts to 9% in England & Wales, 14.2% in Devon and 15.8% in South Hams. Whilst rates in
Dartmouth and Kingsbridge are relatively high (15.6% and 13.2%) they are much lower than for
the main Study Area wards. The relative inaccessibility of Skerries and Stokenham combined
with the high rates of self-employment are likely to contribute to the high rates of home working.
Facilities overview Overview by Ward 8.43 As outlined previously, Skerries ward contains the villages of Stoke Fleming, Bowden, Strete
and Slapton. The main concentrations of households within the Stokenham ward reside within
the villages of Chillington, Stokenham, Torcross, Beesands, Hallstands, Kellaton and Ford
Dunstone.
8.44 Statistical data is not available at village level and has already been outlined at ward level. It is
therefore also useful to review the facilities available to residents on a ward basis i.e. within
Skerries and Stokenham wards. More detailed audit work within the next stage of the socio-
Slapton Coastal Zone Management Main Study Volume 1: Phase 1 Report (I)
August 2006, Scott Wilson
8-11
economic reporting will provide additional business information whereupon it will be possible to
identify some specific facilities at village level.
Wider Area 8.45 As noted previously, primary schools are relatively accessible to the majority of Skerries and
Stokenham residents. Stoke Fleming and Stokenham villages both offer primary schools and
both schools also offer a range of childcare and pre school facilities. Secondary school and
adult education provision is available at either Kingsbridge or Dartmouth Community Colleges.
8.46 The nearest hospitals are located at Kingsbridge and Dartmouth with Kingsbridge offering a 24-
hour minor accident and emergency department. Fire stations are also located in Dartmouth
and Kingsbridge though both are manned on a volunteer basis. The number of incidents dealt
with by each is fairly similar – in 1999/00, 154 by Dartmouth and 172 by Kingsbridge.
8.47 The Study area falls within two sectors of coastguard cover. South West Devon sector provides
support for the coastline between the East bank of the River Tamar and Torcross and the South
East Devon sector runs from Torcross to Topsham. Each of these sectors supports a number of
teams – Dartmouth, Hope cove and Prawle Point all provide cover to the Study area though all
cover is provided on a volunteer basis.
8.48 A number of the villages within Skerries and Stokenham support village stores e.g. Stoke
Fleming, Slapton and Torcross. These generally stock a limited range of groceries and often
also cater for the tourist offering a range of postcards, local books etc.
8.49 A wider range of shops is available at both Dartmouth and Kingsbridge including speciality
stores in addition to larger supermarkets and banks etc. Both towns also meet demand from
tourism offering a range of niche stores including galleries, food stores, restaurants etc.
8.50 The main leisure centre for the area is located in Kingsbridge and offers a range of facilities
including a pool and gym.
8.51 The Countryside Agency undertakes annual assessments of rural services at ward level. This
aggregates information to present a picture of the relative accessibility of services to households
within wards. Most recent rural survey data is available for 2001 however it should be noted
that household figures do not tally with those indicated in the previous section given the late
release of 2001 Census data.
8.52 The results of the survey do not present any great surprises. In summary the accessibility of
services including supermarkets, doctor’s surgeries, schools, libraries and job centres is
significantly lower in Skerries and Stokenham than in Dartmouth and Kingsbridge wards. The
following table indicates the distance that relative proportions of households must travel to
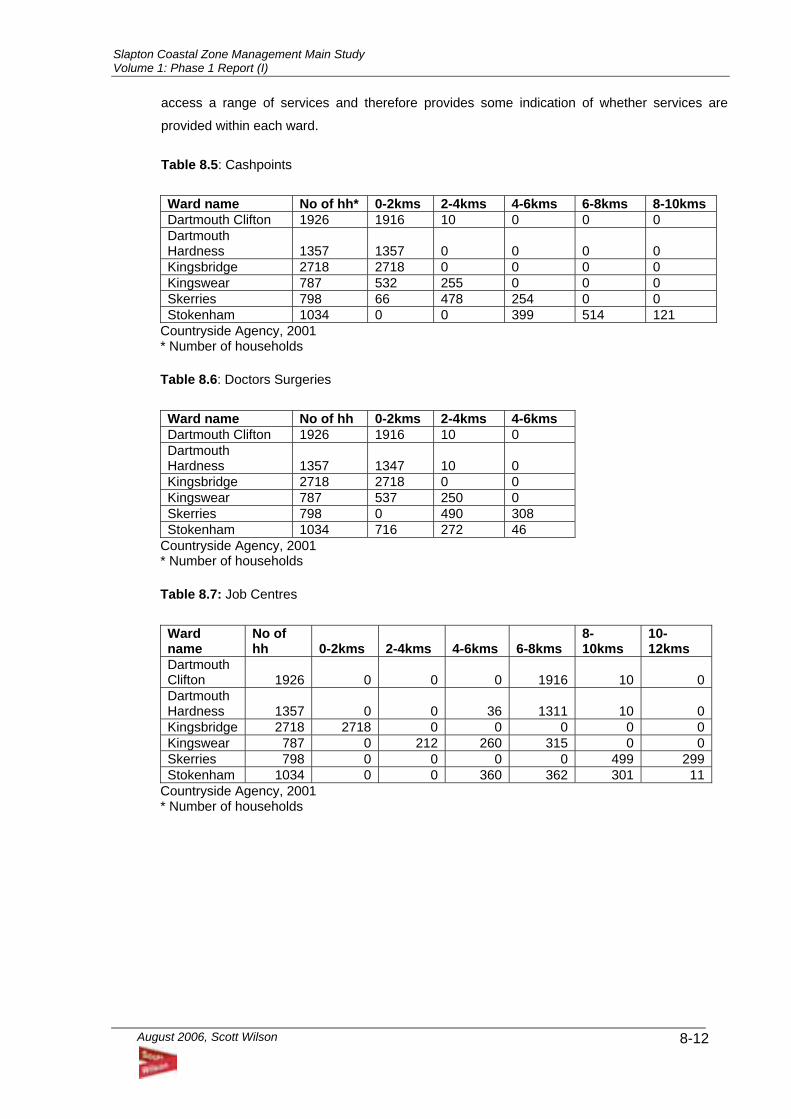
Slapton Coastal Zone Management Main Study Volume 1: Phase 1 Report (I)
August 2006, Scott Wilson
8-12
access a range of services and therefore provides some indication of whether services are
provided within each ward.
Table 8.5: Cashpoints Ward name No of hh* 0-2kms 2-4kms 4-6kms 6-8kms 8-10kms Dartmouth Clifton 1926 1916 10 0 0 0 Dartmouth Hardness 1357 1357 0 0 0 0 Kingsbridge 2718 2718 0 0 0 0 Kingswear 787 532 255 0 0 0 Skerries 798 66 478 254 0 0 Stokenham 1034 0 0 399 514 121
Countryside Agency, 2001 * Number of households Table 8.6: Doctors Surgeries Ward name No of hh 0-2kms 2-4kms 4-6kms Dartmouth Clifton 1926 1916 10 0 Dartmouth Hardness 1357 1347 10 0 Kingsbridge 2718 2718 0 0 Kingswear 787 537 250 0 Skerries 798 0 490 308 Stokenham 1034 716 272 46
Countryside Agency, 2001 * Number of households
Table 8.7: Job Centres Ward name
No of hh 0-2kms 2-4kms 4-6kms 6-8kms
8-10kms
10-12kms
Dartmouth Clifton 1926 0 0 0 1916 10 0Dartmouth Hardness 1357 0 0 36 1311 10 0Kingsbridge 2718 2718 0 0 0 0 0Kingswear 787 0 212 260 315 0 0Skerries 798 0 0 0 0 499 299Stokenham 1034 0 0 360 362 301 11
Countryside Agency, 2001 * Number of households

Slapton Coastal Zone Management Main Study Volume 1: Phase 1 Report (I)
August 2006, Scott Wilson
8-13
Table 8.8: Petrol Stations Ward name
No of hh 0-2kms 2-4kms 4-6kms 6-8kms
Dartmouth Clifton 1926 1900 26 0 0 Dartmouth Hardness 1357 1356 1 0 0 Kingsbridge 2718 2718 0 0 0 Kingswear 787 462 320 5 0 Skerries 798 5 518 261 14 Stokenham 1034 6 542 378 108
Countryside Agency, 2001 * Number of households Table 8.9: Primary Schools Ward name
No of hh 0-2kms 2-4kms 4-6kms
Dartmouth Clifton 1926 1926 0 0Dartmouth Hardness 1357 1356 1 0Kingsbridge 2718 2718 0 0Kingswear 787 774 13 0Skerries 798 509 289 0Stokenham 1034 769 219 46
Countryside Agency, 2001 * Number of households
Table 8.10: Secondary Schools Ward name
No of hh 0-2kms 2-4kms 4-6kms 6-8kms
8-10kms
10-12kms
Dartmouth Clifton 1926 1900 26 0 0 0 0Dartmouth Hardness 1357 1356 1 0 0 0 0Kingsbridge 2718 2713 5 0 0 0 0Kingswear 787 217 558 12 0 0 0Skerries 798 163 375 260 0 0 0Stokenham 1034 0 0 161 542 320 11
Countryside Agency, 2001 *Number of households
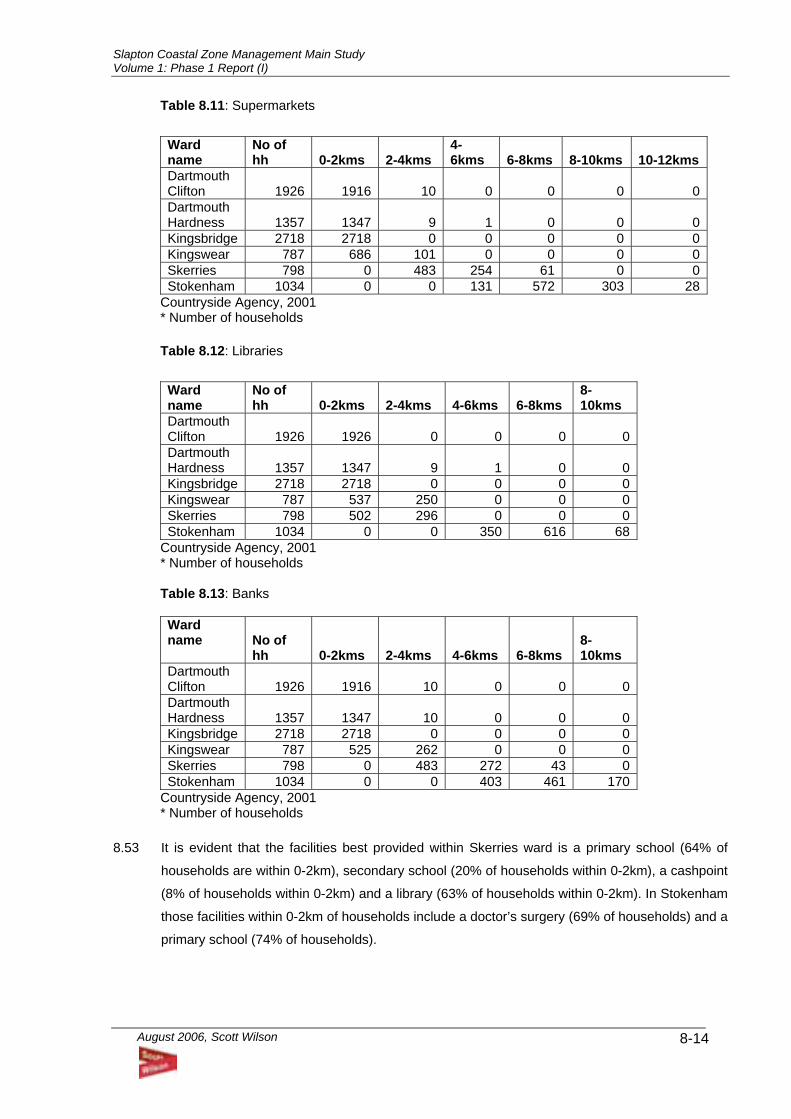
Slapton Coastal Zone Management Main Study Volume 1: Phase 1 Report (I)
August 2006, Scott Wilson
8-14
Table 8.11: Supermarkets Ward name
No of hh 0-2kms 2-4kms
4-6kms 6-8kms 8-10kms 10-12kms
Dartmouth Clifton 1926 1916 10 0 0 0 0Dartmouth Hardness 1357 1347 9 1 0 0 0Kingsbridge 2718 2718 0 0 0 0 0Kingswear 787 686 101 0 0 0 0Skerries 798 0 483 254 61 0 0Stokenham 1034 0 0 131 572 303 28
Countryside Agency, 2001 * Number of households
Table 8.12: Libraries Ward name
No of hh 0-2kms 2-4kms 4-6kms 6-8kms
8-10kms
Dartmouth Clifton 1926 1926 0 0 0 0 Dartmouth Hardness 1357 1347 9 1 0 0 Kingsbridge 2718 2718 0 0 0 0 Kingswear 787 537 250 0 0 0 Skerries 798 502 296 0 0 0 Stokenham 1034 0 0 350 616 68
Countryside Agency, 2001 * Number of households
Table 8.13: Banks Ward name
No of hh 0-2kms 2-4kms 4-6kms 6-8kms
8-10kms
Dartmouth Clifton 1926 1916 10 0 0 0 Dartmouth Hardness 1357 1347 10 0 0 0 Kingsbridge 2718 2718 0 0 0 0 Kingswear 787 525 262 0 0 0 Skerries 798 0 483 272 43 0 Stokenham 1034 0 0 403 461 170
Countryside Agency, 2001 * Number of households
8.53 It is evident that the facilities best provided within Skerries ward is a primary school (64% of
households are within 0-2km), secondary school (20% of households within 0-2km), a cashpoint
(8% of households within 0-2km) and a library (63% of households within 0-2km). In Stokenham
those facilities within 0-2km of households include a doctor’s surgery (69% of households) and a
primary school (74% of households).
Slapton Coastal Zone Management Main Study Volume 1: Phase 1 Report (I)
August 2006, Scott Wilson
8-15
8.54 Facilities that are relatively inaccessible for the majority of Skerries households include the job
centre, secondary schools, supermarkets and banks. Stokenham ward suffers similar problems
of inaccessibility though to a slightly higher degree.
Visitor Market Tourism & the Local Economy 8.55 The overall economic structure of the Skerries and Stokenham wards has been outlined in the
socio-economic profile. This has identified two key aspects of the local economy:
• The relatively low number of jobs within the area – highlighting the rural nature of the wards
with considerable numbers of residents commuting out from the wards and a high proportion
of retired residents.
• The importance of tourism within the local economy.
8.56 The ABI data outlined previously indicates that over a third of jobs within Skerries and
Stokenham ward are within the distribution, hotels and restaurants sector and within Skerries,
almost a third of businesses are hotel or restaurants. It is also likely that the high rates of self-
employment include residents involved in providing services for the tourism trade.
8.57 Jobs within the tourism sector are generated directly by a number of sources including
accommodation providers, local shops, restaurants, cafes and pubs. In addition indirect
employment will be provided as the tourism businesses and their employees themselves
support local suppliers of goods and services.
Volume and Value of Tourism 8.58 The South Hams and in particular the coastal areas around Slapton and Skerries and
Stokenham wards attract a large number of tourists each year. Whilst there is no data available
as to the number of visitors at the very local (ie parish) level it is important to view visitor activity
in the context of the wider area including the South Hams and Torbay and it is possible to make
some estimates based on accommodation providers and car parking usage within the area
8.59 There are just over 5,000 bed spaces within South Hams (hotels, guesthouses, inns, B&B’s and
farms), 3,048 units (self catering and second homes), 5,050 pitches (touring & static caravans
and tent pitches) and 2,445 berths within marinas. (Economic Impact of Tourism, 2003, SWT).
Analysis of tourism and visitor guides and information suggests that there are approximately 50
businesses and individuals offering accommodation in the Slapton area, which supports an
estimate of around 300 - 400 bedspaces in total.
8.60 In 2001 there were 768,000 trips (staying visitors) to the South Hams of which overseas visitors
comprised 4% of the market. These trips equated to 3,493,000 visitor nights within the district.

Slapton Coastal Zone Management Main Study Volume 1: Phase 1 Report (I)
August 2006, Scott Wilson
8-16
Serviced accommodation accommodated 21% of these visitors and 17% of the total visitor
night. (Economic Impact of Tourism, 2003, SWT).
8.61 In the wider area, Torbay attracts 1.7m visitors per year - making it the single largest visitor
destination district in Devon, with a total of over 7m visitor nights and a total visitor spend of over
£420m per year. Some visitors staying in Torbay will make day trips to Slapton and other parts
of the South Hams, often as round trips including Dartmouth, etc., and this will be important
particularly to businesses such as pubs, cafes and shops. Unfortunately, there is no published
data which provides a robust estimate of these numbers, and it is not possible to estimate the
importance of these day visitors compared to that of visitors staying in the parts of the South
Hams closest to Slapton whose impact on the local economy includes spending in
accommodation as well as other businesses throughout there stay, in pubs, etc..
8.62 Total visitor spend in the South Hams in 2001 was estimated at £136,343,000 of which
overseas visitors provided 9.5% of the spend. Holidays accounted for 79% of the total spend,
business trip 9%, study 2% and visits to friends and relatives a further 9%. (Economic Impact of
Tourism, 2003, SWT)
8.63 In addition there were a total of 4,982,000 day visits to the South Hams of which spend is
estimated at £114,205,000. The share of visits to urban, countryside and coastal visits was split
53%, 24% and 23% respectively. Tourism trips, defined as those leisure trips from home, which
have a duration of 3 hours of more and are taken on an irregular basis. (Economic Impact of
Tourism, 2003, SWT)
8.64 There are a number of sectors of businesses in receipt of visitor spend during trips to the
district. Of the total direct visitor spend (staying and day visitors) to businesses, accommodation
businesses received 20% of spend, retail businesses 22%, catering 30% and
attractions/entertainment 11%. (Economic Impact of Tourism, 2003, SWT)
8.65 As noted within the socio-economic profile, employment supported by tourism within the study
area is high. Within South Hams there are an estimated 7,537 actual jobs within tourism
equating to 5,164 full time jobs directly supported by tourism expenditure. Of the FTE jobs,
accommodation is estimated to account for 25% of jobs, retailing 14%, catering 39% and
attractions/entertainment 13%. In addition there are a further 707 FTE indirect jobs in supply
businesses and 197 FTE jobs in income induced jobs. (Economic Impact of Tourism, 2003,
SWT)
8.66 Total employment related to tourism spending is therefore 6,068 FTE jobs. (Economic Impact of
Tourism, 2003, SWT) Relating job creation to tourism spend enables assumptions regarding the
level of spend required in order to support a single job. 2001 spend within South Hams
indicates that £41,290 of visitor spend is required per FTE position.
Slapton Coastal Zone Management Main Study Volume 1: Phase 1 Report (I)
August 2006, Scott Wilson
8-17
8.67 Review of trends data identifies that there has been a 10.2% increase in the number of annual
visitor nights spent within South Hams between 1993 and 2002 though the district has only
increased its’ share of the Devon tourism market by 0.1%. There has also been an 8.1%
increase in average monthly hotel occupancy levels (0.5% in 2000) and total annual spend per
month has increased by 34%. (Tourism Trends in Devon, 2002, Devon County Council).
Visitor Motivation 8.68 South Hams is a long-standing successful holiday destination with a high rate of return visitors.
The district appeals mainly to couples and families with an average stay of 7 nights. The
majority of visitor travel by car (91%) and the main competing destination is considered to be
Cornwall. (Visitor Survey, South Hams, 1998).
8.69 The main activities which visitors to the area are involved in include those activities available
within the Study Area. Walking along the coast and countryside (83%), eating out locally (75%),
sightseeing by car (69%) and going to the beach (64%) are all popular with South Hams visitors.
(Visitor Survey, South Hams, 1998)
8.70 Unsurprisingly the product strengths of the South Hams are closely related to those activities,
which are most popular with visitors to the area. The following are identified product strengths of
the South Hams which are relevant to this study:
• A quality coast and country environment with managed landscaped estuary and nature reserves
• Award winning clean, safe beaches and good quality bathing waters
• Strong ‘get away from it all’ feel – peace and quiet
• Maritime and agricultural heritage
8.71 South Hams Tourism & Marketing Strategy objectives 2000-5 include increasing the number of
tourism nights by 10%, increasing total visitor spend by 5% and increasing the tourism market
share within Devon. In relation to businesses within the district these targets are an increased
in the average out of season occupancy rate (up 17%), an increase in the number of tourism
businesses having an accredited environmental policy, increasing the proportion of rated
accommodation by 50% and increasing the number of attractions within the SWT scheme
(quality assurance scheme) from 3 to 10.
Attractions 8.72 Those attractions listed within the TRIPS database (SWT) exclude those factors which have
been previously highlighted as key to the visitor motivations in visiting South Hams e.g.
beaches, countryside and attractive market towns such as Dartmouth & Kingsbridge etc. The
list does however provide an important context for other key reasons for visiting the local area.
Slapton Coastal Zone Management Main Study Volume 1: Phase 1 Report (I)
August 2006, Scott Wilson
8-18
Attractions within the wider area include Woodlands Leisure Park (leisure/theme park) at
Blackawton, which attracted 374,165 visitors in 2001, a 13% increase since 2000 and one of the
largest attractions within the South West.
8.73 Both Buckfast Butterfly Farm & Dartmoor Otter Sanctuary and the River Dart Country Park are
also within the local area and received 50,000 and 32,800 visitors last year respectively. Sited a
little closer to the Study Area Dartmouth Castle and Sorley Tunnel Adventure Farm and
Kingsbridge also attract considerable numbers of visitors (33,245 and 25,000). In addition the
Dartmouth Museum and Berry Pomeroy Castle received in excess of 7,000 visitors last year. In
the wider area, there are range of attractions, particularly in Torbay where Living Coasts,
Paignton Zoo and other attractions and facilities serve the "English Riviera" (there are no recent
official data for visitor numbers to these attractions in Torbay except Greenway which attracted
25,000 visitors in 2003).
8.74 Within the immediate area there are several important environmental and historical attractions.
Slapton Ley National Nature Reserve (NNR) is an unusual environmental feature – its main
feature the Lower Ley forms the largest natural lake in southwest England. It is entirely
freshwater, separated only from the sea by the narrow shingle bar. Much of the reserve is
accessible by footpath and is a major attraction with birdwatcher and naturalists. Limited
angling is also permitted. Additional detail on the nature conservation interest of the NNR is
presented in Chapter 1.
8.75 The Slapton nature reserve is managed as an outdoor laboratory by the Slapton Ley Field
Centre, an important local facility based near Slapton village, it offers education residential
courses and day courses. The centre offers 85 bed spaces, 6 workrooms, ICT facilities and a
library. It is used commonly by schools and collages from across the country.
8.76 The effects of World War II on the Study Area are also acknowledged. The evacuation of
Slapton and seven other villages in 1943 was undertaken in order that American Forces could
use the area as a training ground for Normandy landings, the focus of these activities being
Slapton Sands and inland across the Ley. The effects of this training upon the landscape were
significant and rehabilitation of the land was slow, though has clearly recovered to date.
Recognition of these historic events is still visible within the area; a monument within the middle
Slapton Line car park commemorates the evacuation of Slapton Sands and its hinterland and a
tank, used in rehearsals was recovered from the sea in the early 1980’s and positioned in
Torcross car park to commemorate the soldiers lost in an enemy attack during the rehearsals.
Seasonality 8.77 Data to reflect the seasonality of visits is available for Devon (United Kingdom Tourism Survey
1990 – 1998). The August peak continues to dominate visits by UK residents to the region, and
Slapton Coastal Zone Management Main Study Volume 1: Phase 1 Report (I)
August 2006, Scott Wilson
8-19
although seasonality is reducing over time, this is through a growth in off-peak visits as well as a
slight fall in August.
8.78 It would however appear that a reduction in seasonality is happening a little faster in the West
Country (and Cornwall) than for the UK as a whole (Seasonality in Cornish Tourism, Tourism
Associates 2000).
8.79 Tourism within the South Hams therefore remains fairly seasonal and whilst the shoulder
seasons are lengthening, July and August is still the main peak. Many tourist accommodation
providers and visitor based shops within the area open from Easter until the end of September
further indicating the continual dominance of seasonal trends. This seasonality has obvious links
to the nature of employment within South Hams, much of which is part time and potentially on a
seasonal basis (see unemployment rates).
8.80 The impact of second and third holidays is however beginning to have some effect on the
number of visitors outside the peak months and is considered a key market opportunity within
the South Hams Tourism Strategy. The good range of walking and sports activities within the
area are also considered to be important ‘shoulder season attractions’. These are likely to add
significantly to increasing the offer of the area outside the summer months.
Tourism Trends 8.81 The pattern of tourism across Devon has been one of general recovery since the early 1990’s
when visitor numbers dipped. Forecasts indicate that the main changes in tourism across The
West Country will be a growth in short breaks, greater demand for quality accommodation and
facilities and an increase in second and third holidays. ‘Themed’ and special interest breaks are
also becoming more popular. The Study Area is therefore considered well placed to take
advantage of these market opportunities given its coastal location and special interest merits
(environmental and leisure).
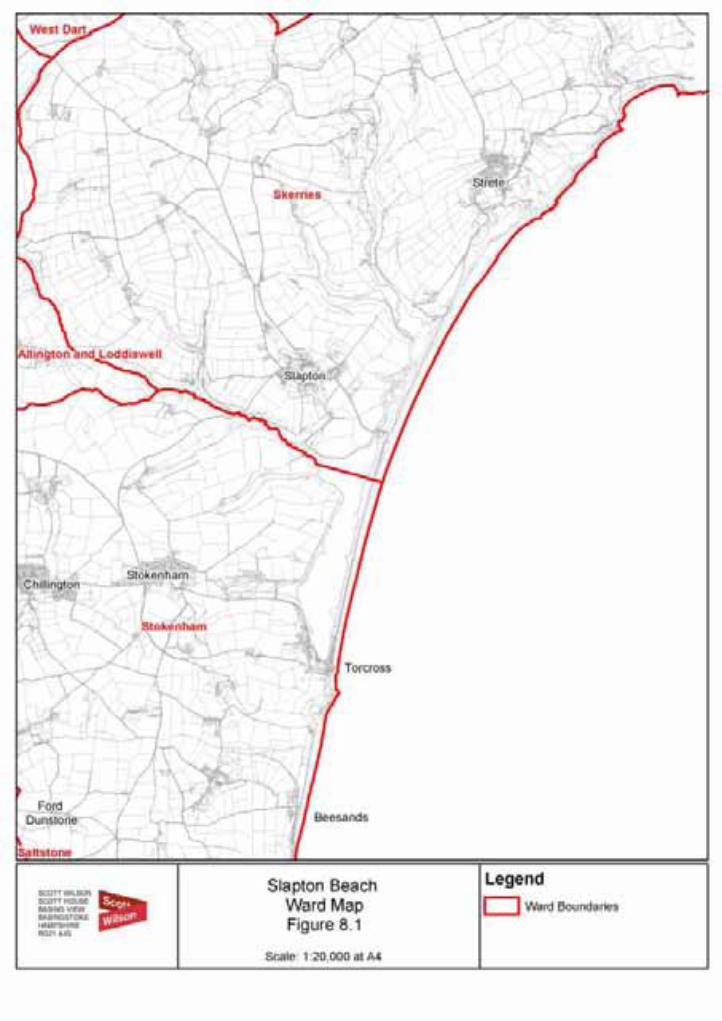
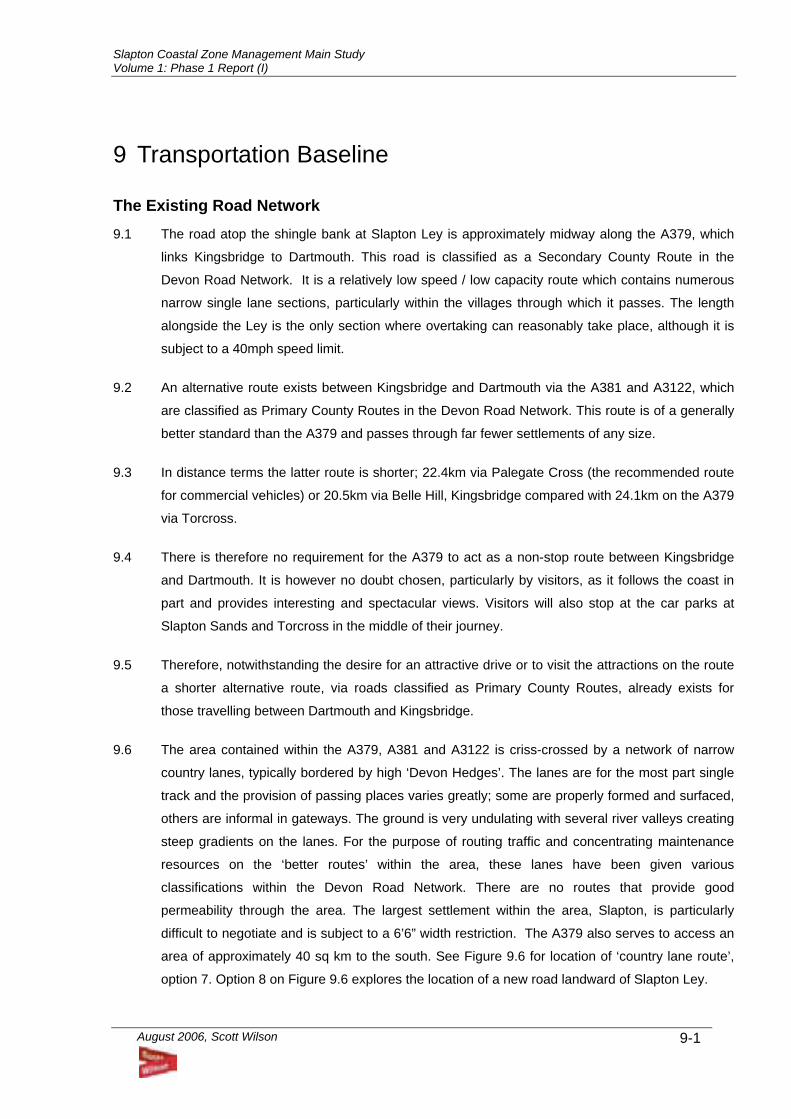
Slapton Coastal Zone Management Main Study Volume 1: Phase 1 Report (I)
August 2006, Scott Wilson
9-1
9 Transportation Baseline
The Existing Road Network 9.1 The road atop the shingle bank at Slapton Ley is approximately midway along the A379, which
links Kingsbridge to Dartmouth. This road is classified as a Secondary County Route in the
Devon Road Network. It is a relatively low speed / low capacity route which contains numerous
narrow single lane sections, particularly within the villages through which it passes. The length
alongside the Ley is the only section where overtaking can reasonably take place, although it is
subject to a 40mph speed limit.
9.2 An alternative route exists between Kingsbridge and Dartmouth via the A381 and A3122, which
are classified as Primary County Routes in the Devon Road Network. This route is of a generally
better standard than the A379 and passes through far fewer settlements of any size.
9.3 In distance terms the latter route is shorter; 22.4km via Palegate Cross (the recommended route
for commercial vehicles) or 20.5km via Belle Hill, Kingsbridge compared with 24.1km on the A379
via Torcross.
9.4 There is therefore no requirement for the A379 to act as a non-stop route between Kingsbridge
and Dartmouth. It is however no doubt chosen, particularly by visitors, as it follows the coast in
part and provides interesting and spectacular views. Visitors will also stop at the car parks at
Slapton Sands and Torcross in the middle of their journey.
9.5 Therefore, notwithstanding the desire for an attractive drive or to visit the attractions on the route
a shorter alternative route, via roads classified as Primary County Routes, already exists for
those travelling between Dartmouth and Kingsbridge.
9.6 The area contained within the A379, A381 and A3122 is criss-crossed by a network of narrow
country lanes, typically bordered by high ‘Devon Hedges’. The lanes are for the most part single
track and the provision of passing places varies greatly; some are properly formed and surfaced,
others are informal in gateways. The ground is very undulating with several river valleys creating
steep gradients on the lanes. For the purpose of routing traffic and concentrating maintenance
resources on the ‘better routes’ within the area, these lanes have been given various
classifications within the Devon Road Network. There are no routes that provide good
permeability through the area. The largest settlement within the area, Slapton, is particularly
difficult to negotiate and is subject to a 6’6” width restriction. The A379 also serves to access an
area of approximately 40 sq km to the south. See Figure 9.6 for location of ‘country lane route’,
option 7. Option 8 on Figure 9.6 explores the location of a new road landward of Slapton Ley.
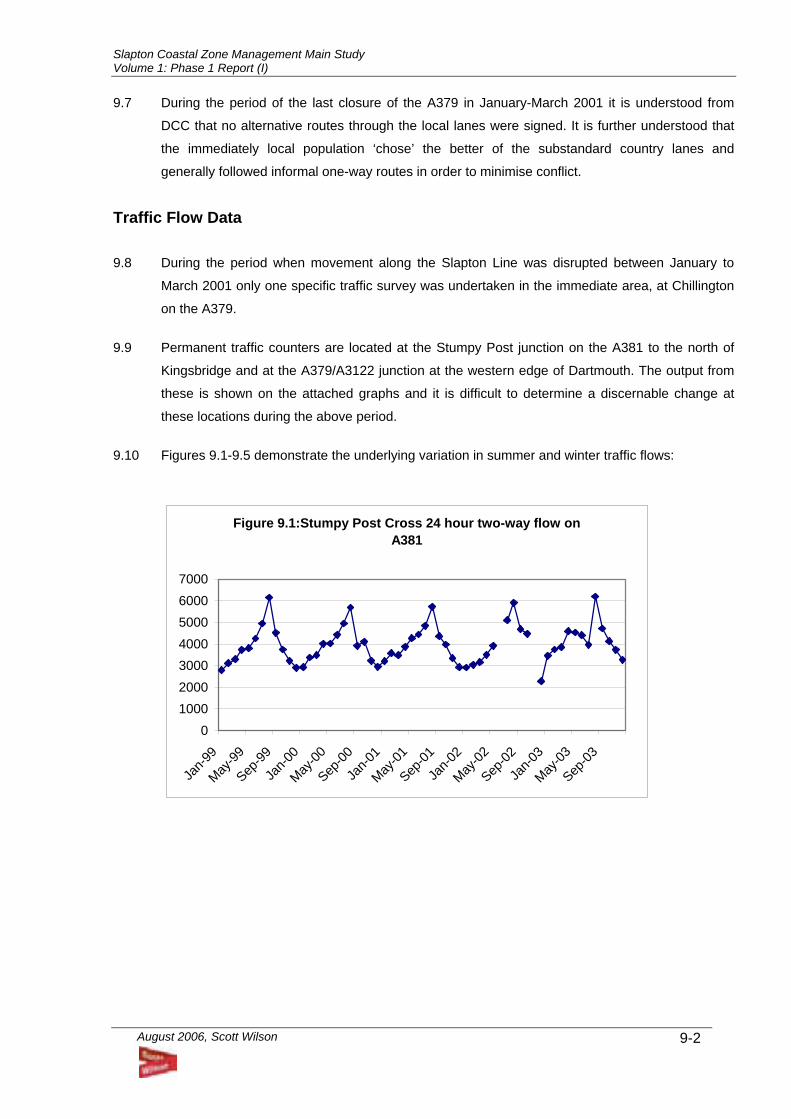
Slapton Coastal Zone Management Main Study Volume 1: Phase 1 Report (I)
August 2006, Scott Wilson
9-2
9.7 During the period of the last closure of the A379 in January-March 2001 it is understood from
DCC that no alternative routes through the local lanes were signed. It is further understood that
the immediately local population ‘chose’ the better of the substandard country lanes and
generally followed informal one-way routes in order to minimise conflict.
Traffic Flow Data 9.8 During the period when movement along the Slapton Line was disrupted between January to
March 2001 only one specific traffic survey was undertaken in the immediate area, at Chillington
on the A379.
9.9 Permanent traffic counters are located at the Stumpy Post junction on the A381 to the north of
Kingsbridge and at the A379/A3122 junction at the western edge of Dartmouth. The output from
these is shown on the attached graphs and it is difficult to determine a discernable change at
these locations during the above period.
9.10 Figures 9.1-9.5 demonstrate the underlying variation in summer and winter traffic flows:
Figure 9.1:Stumpy Post Cross 24 hour two-way flow on A381
01000200030004000500060007000
Jan-9
9
May-99
Sep-99
Jan-0
0
May-00
Sep-00
Jan-0
1
May-01
Sep-01
Jan-0
2
May-02
Sep-02
Jan-0
3
May-03
Sep-03
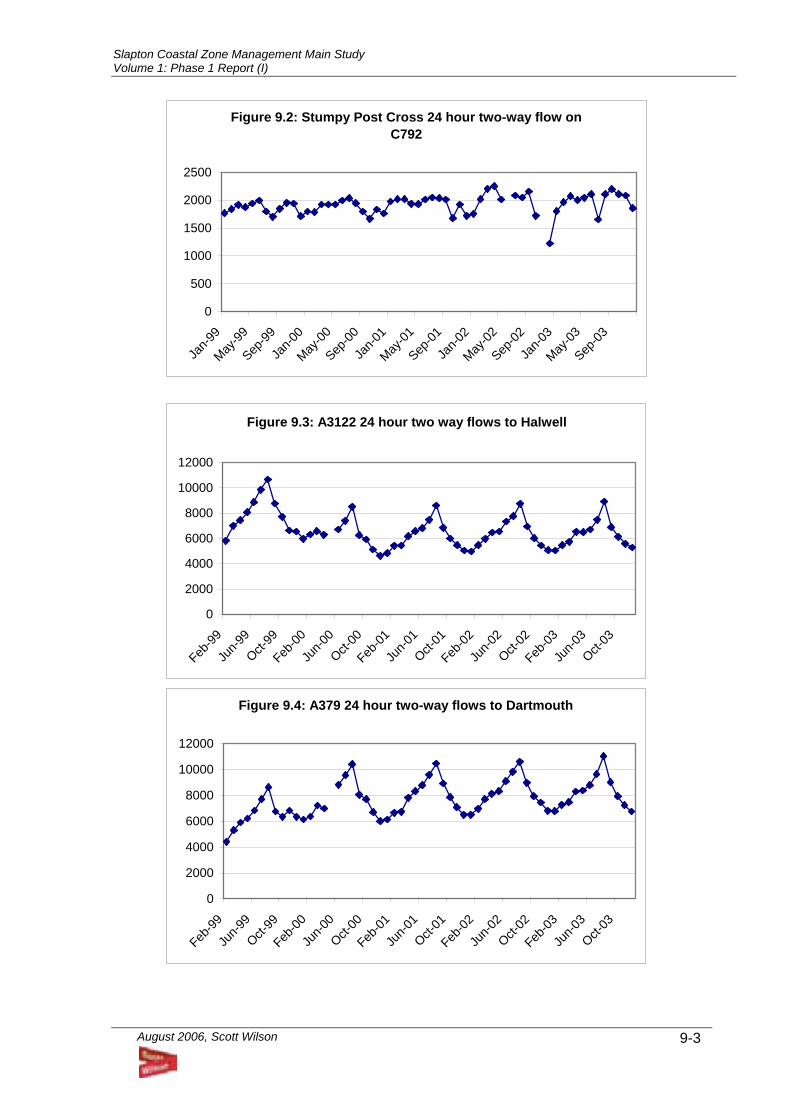
Slapton Coastal Zone Management Main Study Volume 1: Phase 1 Report (I)
August 2006, Scott Wilson
9-3
Figure 9.2: Stumpy Post Cross 24 hour two-way flow on C792
0
500
1000
1500
2000
2500
Jan-9
9
May-99
Sep-99
Jan-0
0
May-00
Sep-00
Jan-0
1
May-01
Sep-01
Jan-0
2
May-02
Sep-02
Jan-0
3
May-03
Sep-03
Figure 9.3: A3122 24 hour two way flows to Halwell
0
2000
4000
6000
8000
10000
12000
Feb-99
Jun-9
9
Oct-99
Feb-00
Jun-0
0
Oct-00
Feb-01
Jun-0
1
Oct-01
Feb-02
Jun-0
2
Oct-02
Feb-03
Jun-0
3
Oct-03
Figure 9.4: A379 24 hour two-way flows to Dartmouth
0
2000
4000
6000
8000
10000
12000
Feb-99
Jun-9
9
Oct-99
Feb-00
Jun-0
0
Oct-00
Feb-01
Jun-0
1
Oct-01
Feb-02
Jun-0
2
Oct-02
Feb-03
Jun-0
3
Oct-03
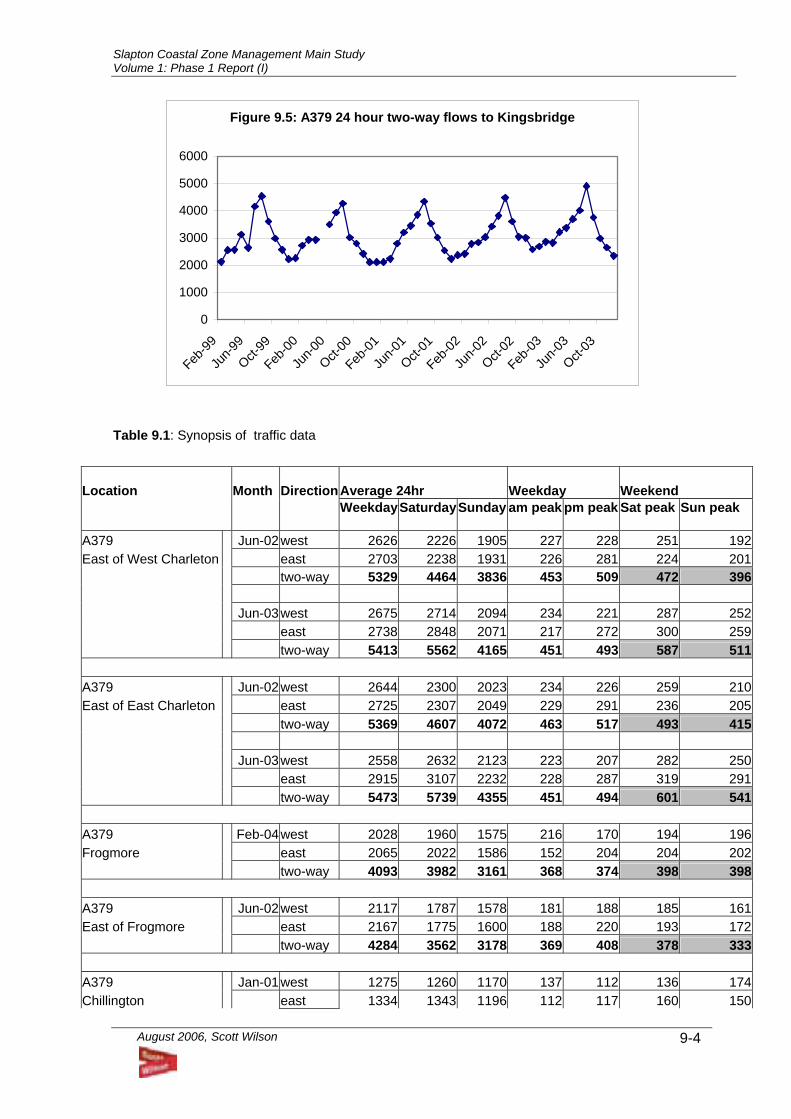
Slapton Coastal Zone Management Main Study Volume 1: Phase 1 Report (I)
August 2006, Scott Wilson
9-4
Figure 9.5: A379 24 hour two-way flows to Kingsbridge
0
1000
2000
3000
4000
5000
6000
Feb-99
Jun-9
9
Oct-99
Feb-00
Jun-0
0
Oct-00
Feb-01
Jun-0
1
Oct-01
Feb-02
Jun-0
2
Oct-02
Feb-03
Jun-0
3
Oct-03
Table 9.1: Synopsis of traffic data
Location Month DirectionAverage 24hr Weekday Weekend
Weekday
Saturday
Sunday
am peak
pm peak
Sat peak
Sun peak
A379 Jun-02 west 2626 2226 1905 227 228 251 192East of West Charleton east 2703 2238 1931 226 281 224 201 two-way 5329 4464 3836 453 509 472 396 Jun-03 west 2675 2714 2094 234 221 287 252 east 2738 2848 2071 217 272 300 259 two-way 5413 5562 4165 451 493 587 511 A379 Jun-02 west 2644 2300 2023 234 226 259 210East of East Charleton east 2725 2307 2049 229 291 236 205 two-way 5369 4607 4072 463 517 493 415 Jun-03 west 2558 2632 2123 223 207 282 250 east 2915 3107 2232 228 287 319 291 two-way 5473 5739 4355 451 494 601 541 A379 Feb-04 west 2028 1960 1575 216 170 194 196Frogmore east 2065 2022 1586 152 204 204 202 two-way 4093 3982 3161 368 374 398 398 A379 Jun-02 west 2117 1787 1578 181 188 185 161East of Frogmore east 2167 1775 1600 188 220 193 172 two-way 4284 3562 3178 369 408 378 333 A379 Jan-01 west 1275 1260 1170 137 112 136 174Chillington east 1334 1343 1196 112 117 160 150
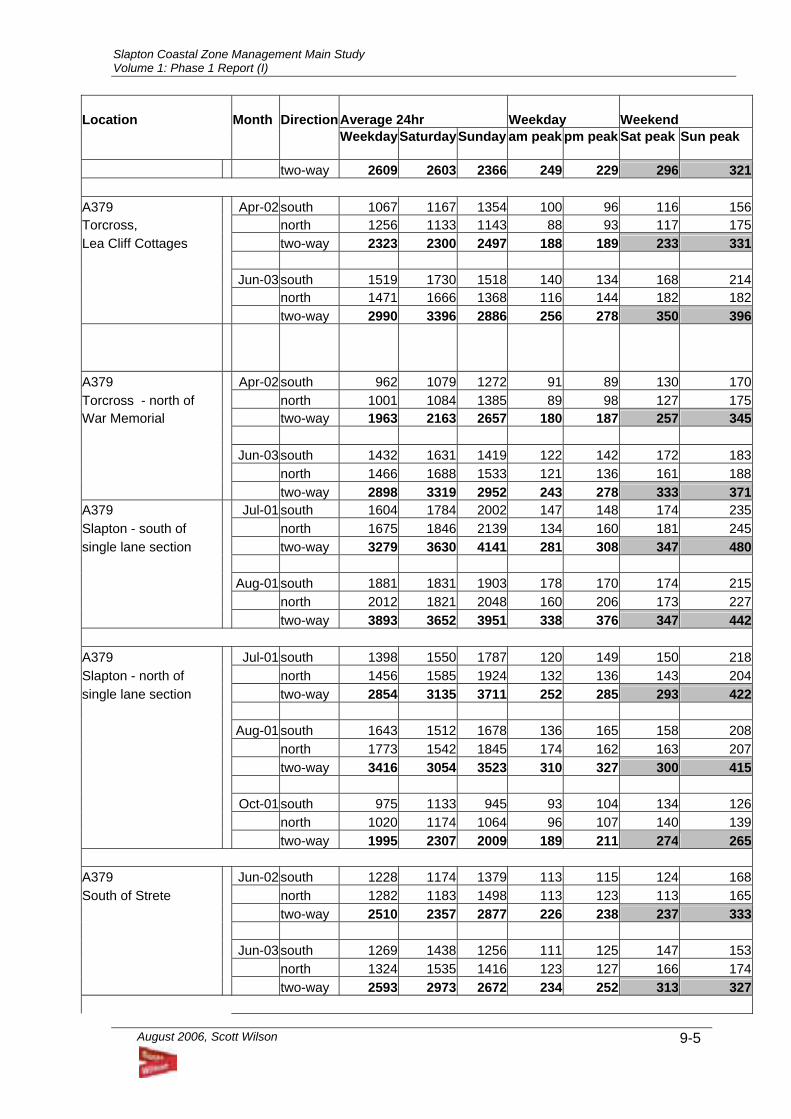
Slapton Coastal Zone Management Main Study Volume 1: Phase 1 Report (I)
August 2006, Scott Wilson
9-5
Location Month DirectionAverage 24hr Weekday Weekend
Weekday
Saturday
Sunday
am peak
pm peak
Sat peak
Sun peak
two-way 2609 2603 2366 249 229 296 321 A379 Apr-02 south 1067 1167 1354 100 96 116 156Torcross, north 1256 1133 1143 88 93 117 175Lea Cliff Cottages two-way 2323 2300 2497 188 189 233 331 Jun-03 south 1519 1730 1518 140 134 168 214 north 1471 1666 1368 116 144 182 182 two-way 2990 3396 2886 256 278 350 396 A379 Apr-02 south 962 1079 1272 91 89 130 170Torcross - north of north 1001 1084 1385 89 98 127 175War Memorial two-way 1963 2163 2657 180 187 257 345 Jun-03 south 1432 1631 1419 122 142 172 183 north 1466 1688 1533 121 136 161 188 two-way 2898 3319 2952 243 278 333 371A379 Jul-01 south 1604 1784 2002 147 148 174 235Slapton - south of north 1675 1846 2139 134 160 181 245single lane section two-way 3279 3630 4141 281 308 347 480 Aug-01 south 1881 1831 1903 178 170 174 215 north 2012 1821 2048 160 206 173 227 two-way 3893 3652 3951 338 376 347 442 A379 Jul-01 south 1398 1550 1787 120 149 150 218Slapton - north of north 1456 1585 1924 132 136 143 204single lane section two-way 2854 3135 3711 252 285 293 422 Aug-01 south 1643 1512 1678 136 165 158 208 north 1773 1542 1845 174 162 163 207 two-way 3416 3054 3523 310 327 300 415 Oct-01 south 975 1133 945 93 104 134 126 north 1020 1174 1064 96 107 140 139 two-way 1995 2307 2009 189 211 274 265 A379 Jun-02 south 1228 1174 1379 113 115 124 168South of Strete north 1282 1183 1498 113 123 113 165 two-way 2510 2357 2877 226 238 237 333 Jun-03 south 1269 1438 1256 111 125 147 153 north 1324 1535 1416 123 127 166 174 two-way 2593 2973 2672 234 252 313 327
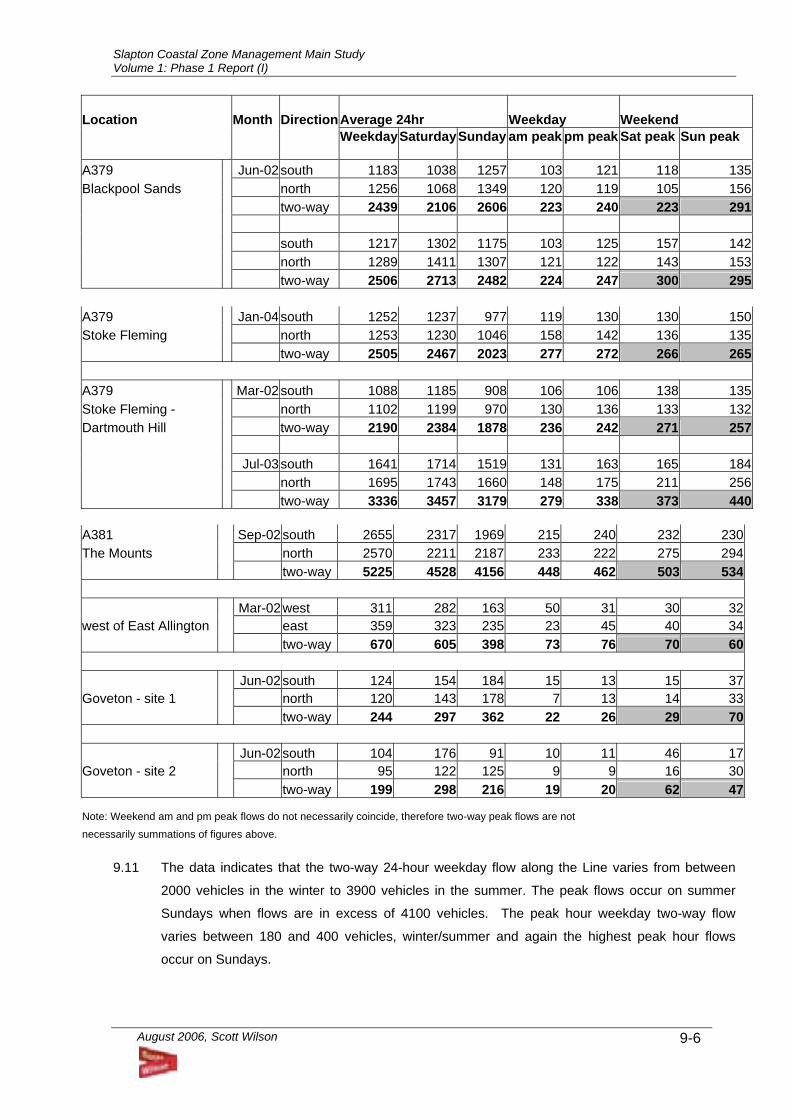
Slapton Coastal Zone Management Main Study Volume 1: Phase 1 Report (I)
August 2006, Scott Wilson
9-6
Location Month DirectionAverage 24hr Weekday Weekend
Weekday
Saturday
Sunday
am peak
pm peak
Sat peak
Sun peak
A379 Jun-02 south 1183 1038 1257 103 121 118 135Blackpool Sands north 1256 1068 1349 120 119 105 156 two-way 2439 2106 2606 223 240 223 291 south 1217 1302 1175 103 125 157 142 north 1289 1411 1307 121 122 143 153 two-way 2506 2713 2482 224 247 300 295 A379 Jan-04 south 1252 1237 977 119 130 130 150Stoke Fleming north 1253 1230 1046 158 142 136 135 two-way 2505 2467 2023 277 272 266 265 A379 Mar-02 south 1088 1185 908 106 106 138 135Stoke Fleming - north 1102 1199 970 130 136 133 132Dartmouth Hill two-way 2190 2384 1878 236 242 271 257 Jul-03 south 1641 1714 1519 131 163 165 184 north 1695 1743 1660 148 175 211 256 two-way 3336 3457 3179 279 338 373 440
A381 Sep-02 south 2655 2317 1969 215 240 232 230The Mounts north 2570 2211 2187 233 222 275 294 two-way 5225 4528 4156 448 462 503 534 Mar-02 west 311 282 163 50 31 30 32west of East Allington east 359 323 235 23 45 40 34 two-way 670 605 398 73 76 70 60 Jun-02 south 124 154 184 15 13 15 37Goveton - site 1 north 120 143 178 7 13 14 33 two-way 244 297 362 22 26 29 70 Jun-02 south 104 176 91 10 11 46 17Goveton - site 2 north 95 122 125 9 9 16 30 two-way 199 298 216 19 20 62 47 Note: Weekend am and pm peak flows do not necessarily coincide, therefore two-way peak flows are not
necessarily summations of figures above. 9.11 The data indicates that the two-way 24-hour weekday flow along the Line varies from between
2000 vehicles in the winter to 3900 vehicles in the summer. The peak flows occur on summer
Sundays when flows are in excess of 4100 vehicles. The peak hour weekday two-way flow
varies between 180 and 400 vehicles, winter/summer and again the highest peak hour flows
occur on Sundays.
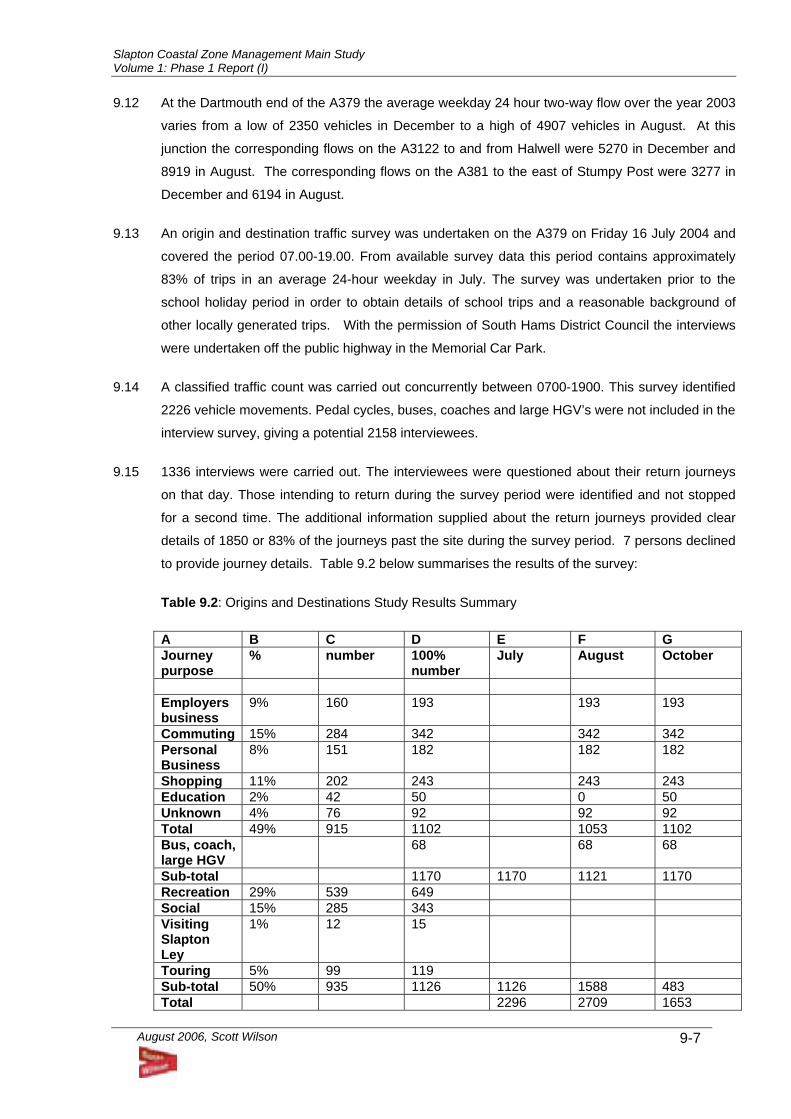
Slapton Coastal Zone Management Main Study Volume 1: Phase 1 Report (I)
August 2006, Scott Wilson
9-7
9.12 At the Dartmouth end of the A379 the average weekday 24 hour two-way flow over the year 2003
varies from a low of 2350 vehicles in December to a high of 4907 vehicles in August. At this
junction the corresponding flows on the A3122 to and from Halwell were 5270 in December and
8919 in August. The corresponding flows on the A381 to the east of Stumpy Post were 3277 in
December and 6194 in August.
9.13 An origin and destination traffic survey was undertaken on the A379 on Friday 16 July 2004 and
covered the period 07.00-19.00. From available survey data this period contains approximately
83% of trips in an average 24-hour weekday in July. The survey was undertaken prior to the
school holiday period in order to obtain details of school trips and a reasonable background of
other locally generated trips. With the permission of South Hams District Council the interviews
were undertaken off the public highway in the Memorial Car Park.
9.14 A classified traffic count was carried out concurrently between 0700-1900. This survey identified
2226 vehicle movements. Pedal cycles, buses, coaches and large HGV’s were not included in the
interview survey, giving a potential 2158 interviewees.
9.15 1336 interviews were carried out. The interviewees were questioned about their return journeys
on that day. Those intending to return during the survey period were identified and not stopped
for a second time. The additional information supplied about the return journeys provided clear
details of 1850 or 83% of the journeys past the site during the survey period. 7 persons declined
to provide journey details. Table 9.2 below summarises the results of the survey:
Table 9.2: Origins and Destinations Study Results Summary
A B C D E F G Journey purpose
% number 100% number
July August October
Employers business
9% 160 193 193 193
Commuting 15% 284 342 342 342 Personal Business
8% 151 182 182 182
Shopping 11% 202 243 243 243 Education 2% 42 50 0 50 Unknown 4% 76 92 92 92 Total 49% 915 1102 1053 1102 Bus, coach, large HGV
68 68 68
Sub-total 1170 1170 1121 1170 Recreation 29% 539 649 Social 15% 285 343 Visiting Slapton Ley
1% 12 15
Touring 5% 99 119 Sub-total 50% 935 1126 1126 1588 483 Total 2296 2709 1653
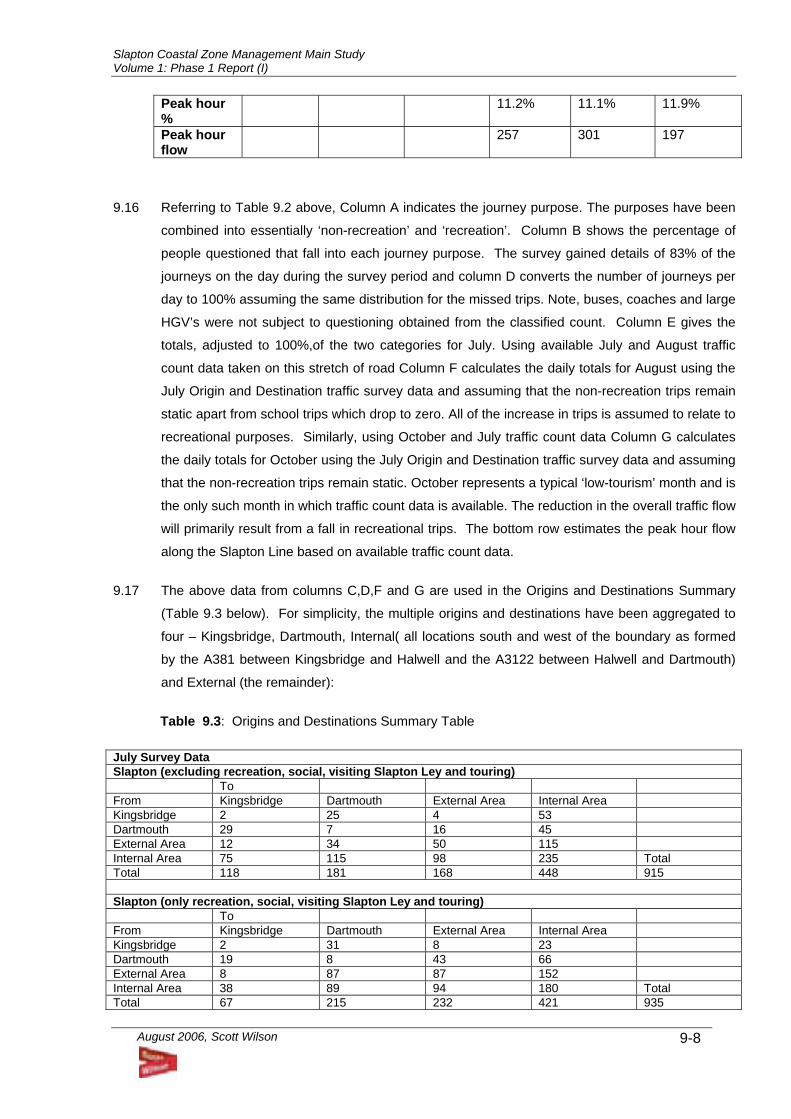
Slapton Coastal Zone Management Main Study Volume 1: Phase 1 Report (I)
August 2006, Scott Wilson
9-8
Peak hour %
11.2% 11.1% 11.9%
Peak hour flow
257 301 197
9.16 Referring to Table 9.2 above, Column A indicates the journey purpose. The purposes have been
combined into essentially ‘non-recreation’ and ‘recreation’. Column B shows the percentage of
people questioned that fall into each journey purpose. The survey gained details of 83% of the
journeys on the day during the survey period and column D converts the number of journeys per
day to 100% assuming the same distribution for the missed trips. Note, buses, coaches and large
HGV’s were not subject to questioning obtained from the classified count. Column E gives the
totals, adjusted to 100%,of the two categories for July. Using available July and August traffic
count data taken on this stretch of road Column F calculates the daily totals for August using the
July Origin and Destination traffic survey data and assuming that the non-recreation trips remain
static apart from school trips which drop to zero. All of the increase in trips is assumed to relate to
recreational purposes. Similarly, using October and July traffic count data Column G calculates
the daily totals for October using the July Origin and Destination traffic survey data and assuming
that the non-recreation trips remain static. October represents a typical ‘low-tourism’ month and is
the only such month in which traffic count data is available. The reduction in the overall traffic flow
will primarily result from a fall in recreational trips. The bottom row estimates the peak hour flow
along the Slapton Line based on available traffic count data.
9.17 The above data from columns C,D,F and G are used in the Origins and Destinations Summary
(Table 9.3 below). For simplicity, the multiple origins and destinations have been aggregated to
four – Kingsbridge, Dartmouth, Internal( all locations south and west of the boundary as formed
by the A381 between Kingsbridge and Halwell and the A3122 between Halwell and Dartmouth)
and External (the remainder):
Table 9.3: Origins and Destinations Summary Table
July Survey Data Slapton (excluding recreation, social, visiting Slapton Ley and touring)
To From Kingsbridge Dartmouth External Area Internal Area Kingsbridge 2 25 4 53 Dartmouth 29 7 16 45 External Area 12 34 50 115 Internal Area 75 115 98 235 Total Total 118 181 168 448 915 Slapton (only recreation, social, visiting Slapton Ley and touring) To From Kingsbridge Dartmouth External Area Internal Area Kingsbridge 2 31 8 23 Dartmouth 19 8 43 66 External Area 8 87 87 152 Internal Area 38 89 94 180 Total Total 67 215 232 421 935
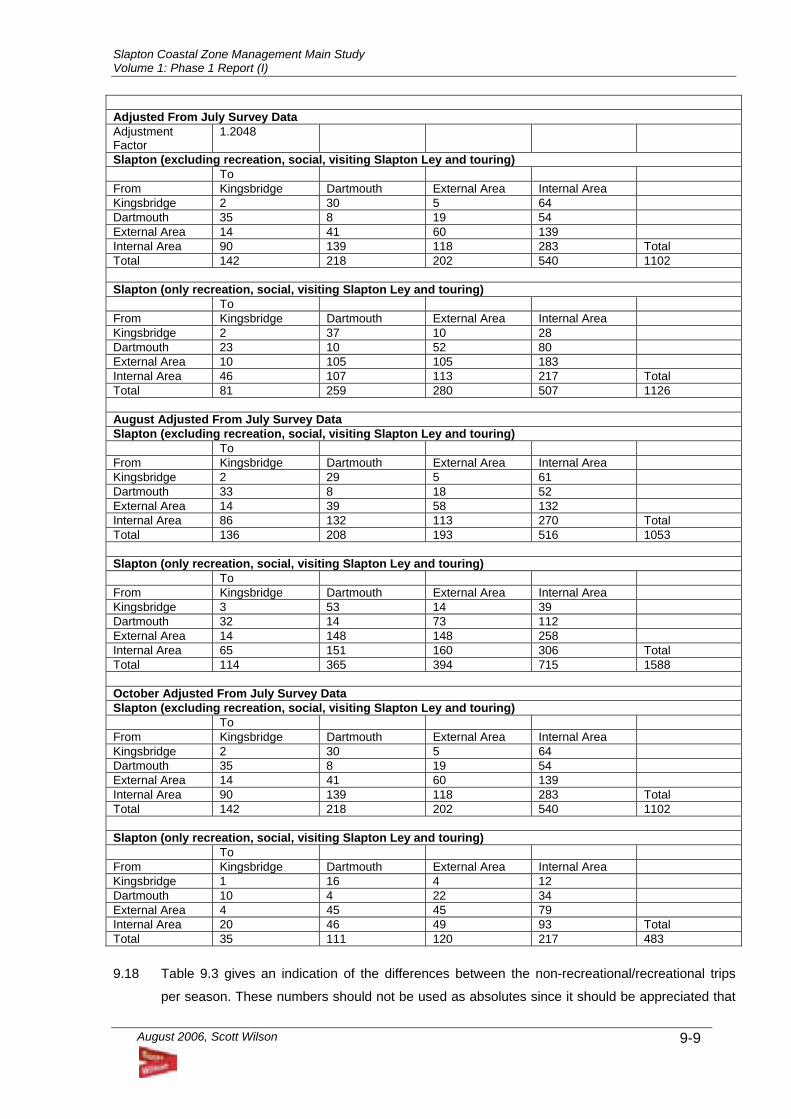
Slapton Coastal Zone Management Main Study Volume 1: Phase 1 Report (I)
August 2006, Scott Wilson
9-9
Adjusted From July Survey Data Adjustment Factor
1.2048
Slapton (excluding recreation, social, visiting Slapton Ley and touring) To From Kingsbridge Dartmouth External Area Internal Area Kingsbridge 2 30 5 64 Dartmouth 35 8 19 54 External Area 14 41 60 139 Internal Area 90 139 118 283 Total Total 142 218 202 540 1102 Slapton (only recreation, social, visiting Slapton Ley and touring) To From Kingsbridge Dartmouth External Area Internal Area Kingsbridge 2 37 10 28 Dartmouth 23 10 52 80 External Area 10 105 105 183 Internal Area 46 107 113 217 Total Total 81 259 280 507 1126 August Adjusted From July Survey Data Slapton (excluding recreation, social, visiting Slapton Ley and touring) To From Kingsbridge Dartmouth External Area Internal Area Kingsbridge 2 29 5 61 Dartmouth 33 8 18 52 External Area 14 39 58 132 Internal Area 86 132 113 270 Total Total 136 208 193 516 1053 Slapton (only recreation, social, visiting Slapton Ley and touring) To From Kingsbridge Dartmouth External Area Internal Area Kingsbridge 3 53 14 39 Dartmouth 32 14 73 112 External Area 14 148 148 258 Internal Area 65 151 160 306 Total Total 114 365 394 715 1588 October Adjusted From July Survey Data Slapton (excluding recreation, social, visiting Slapton Ley and touring) To From Kingsbridge Dartmouth External Area Internal Area Kingsbridge 2 30 5 64 Dartmouth 35 8 19 54 External Area 14 41 60 139 Internal Area 90 139 118 283 Total Total 142 218 202 540 1102 Slapton (only recreation, social, visiting Slapton Ley and touring) To From Kingsbridge Dartmouth External Area Internal Area Kingsbridge 1 16 4 12 Dartmouth 10 4 22 34 External Area 4 45 45 79 Internal Area 20 46 49 93 Total Total 35 111 120 217 483 9.18 Table 9.3 gives an indication of the differences between the non-recreational/recreational trips
per season. These numbers should not be used as absolutes since it should be appreciated that
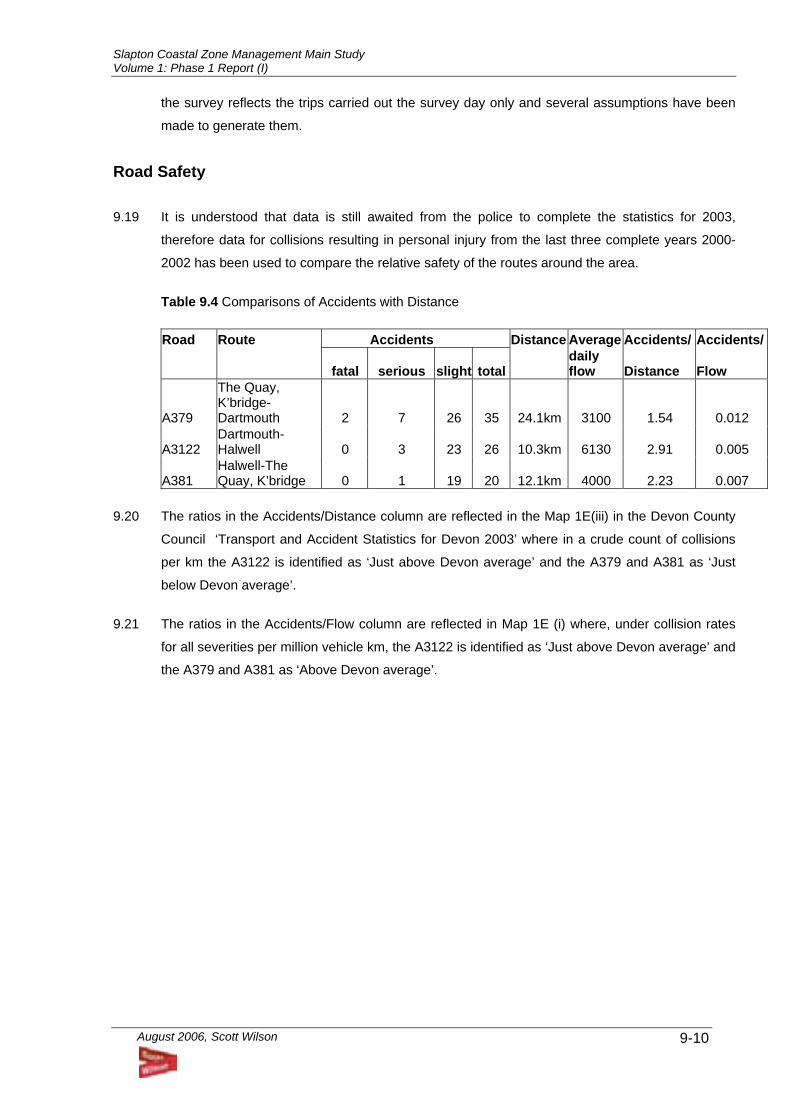
Slapton Coastal Zone Management Main Study Volume 1: Phase 1 Report (I)
August 2006, Scott Wilson
9-10
the survey reflects the trips carried out the survey day only and several assumptions have been
made to generate them.
Road Safety 9.19 It is understood that data is still awaited from the police to complete the statistics for 2003,
therefore data for collisions resulting in personal injury from the last three complete years 2000-
2002 has been used to compare the relative safety of the routes around the area.
Table 9.4 Comparisons of Accidents with Distance
Road Route Accidents Distance Average Accidents/ Accidents/
fatal serious slight total daily flow Distance Flow
A379
The Quay, K’bridge-Dartmouth 2 7 26 35 24.1km 3100 1.54 0.012
A3122 Dartmouth-Halwell 0 3 23 26 10.3km 6130 2.91 0.005
A381 Halwell-The Quay, K’bridge 0 1 19 20 12.1km 4000 2.23 0.007
9.20 The ratios in the Accidents/Distance column are reflected in the Map 1E(iii) in the Devon County
Council ‘Transport and Accident Statistics for Devon 2003’ where in a crude count of collisions
per km the A3122 is identified as ‘Just above Devon average’ and the A379 and A381 as ‘Just
below Devon average’.
9.21 The ratios in the Accidents/Flow column are reflected in Map 1E (i) where, under collision rates
for all severities per million vehicle km, the A3122 is identified as ‘Just above Devon average’ and
the A379 and A381 as ‘Above Devon average’.
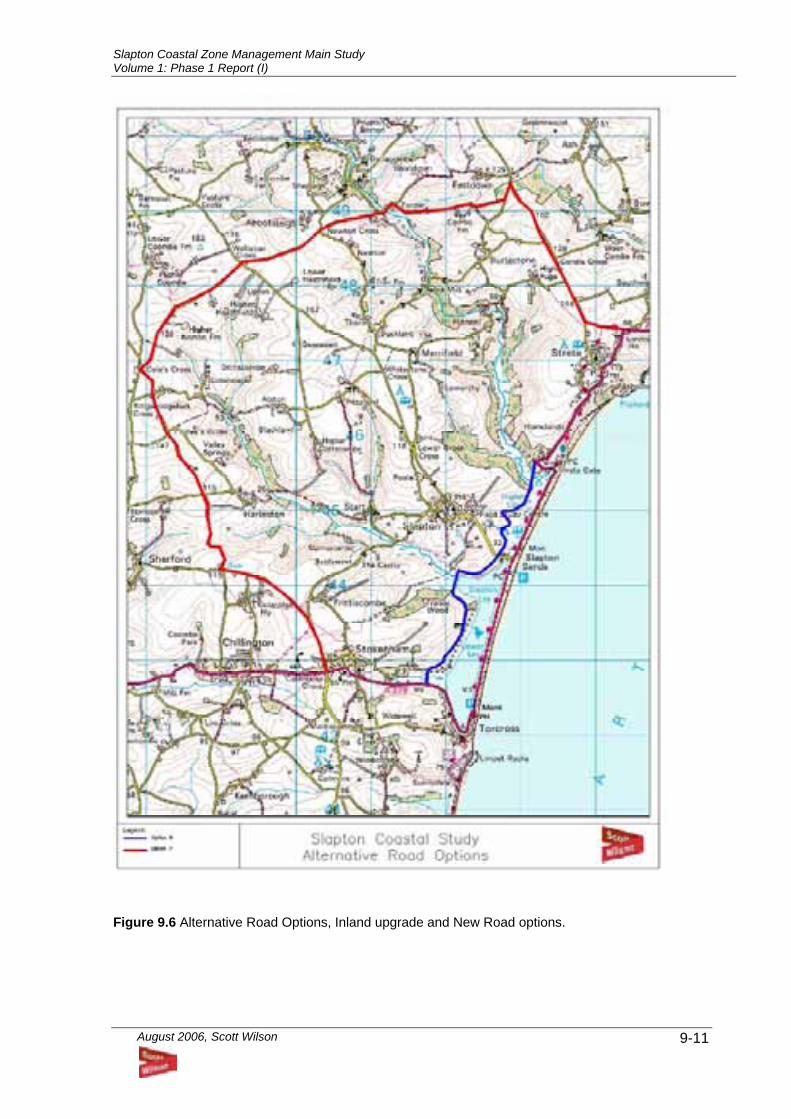
Slapton Coastal Zone Management Main Study Volume 1: Phase 1 Report (I)
August 2006, Scott Wilson
9-11
Figure 9.6 Alternative Road Options, Inland upgrade and New Road options.
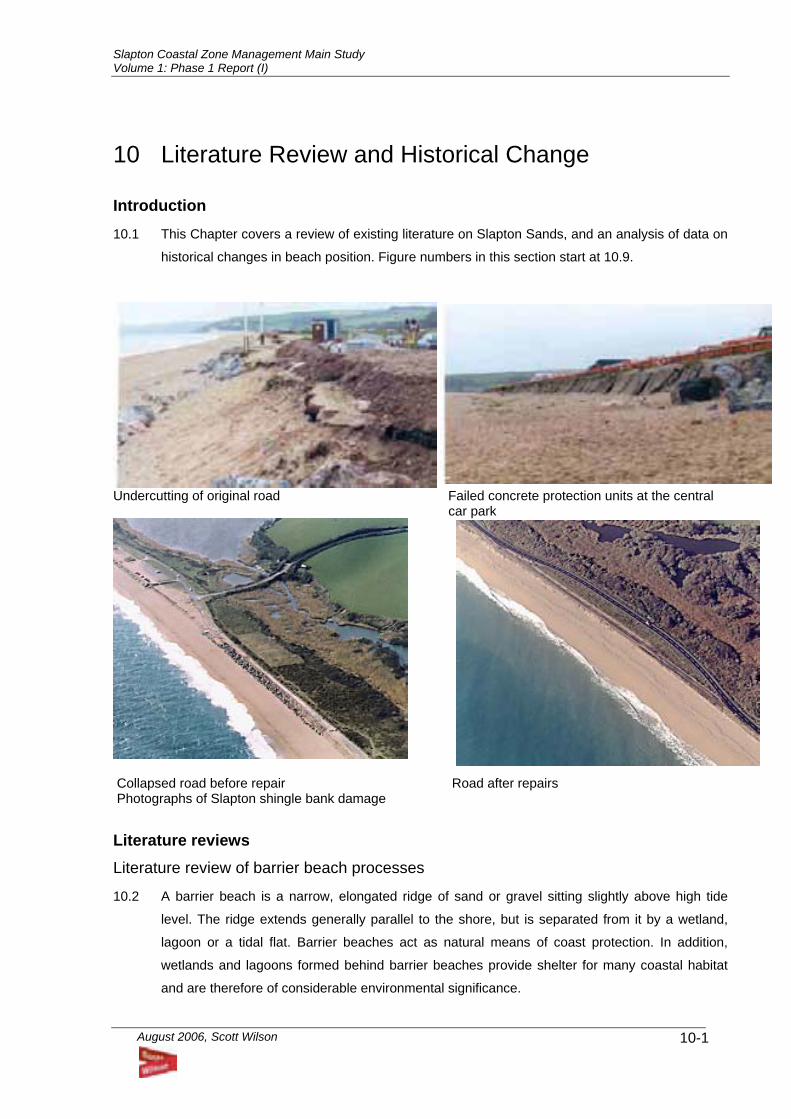
Slapton Coastal Zone Management Main Study Volume 1: Phase 1 Report (I)
August 2006, Scott Wilson
10-1
10 Literature Review and Historical Change
Introduction 10.1 This Chapter covers a review of existing literature on Slapton Sands, and an analysis of data on
historical changes in beach position. Figure numbers in this section start at 10.9.
Undercutting of original road Failed concrete protection units at the central
car park
Collapsed road before repair Road after repairs Photographs of Slapton shingle bank damage
Literature reviews Literature review of barrier beach processes
10.2 A barrier beach is a narrow, elongated ridge of sand or gravel sitting slightly above high tide
level. The ridge extends generally parallel to the shore, but is separated from it by a wetland,
lagoon or a tidal flat. Barrier beaches act as natural means of coast protection. In addition,
wetlands and lagoons formed behind barrier beaches provide shelter for many coastal habitat
and are therefore of considerable environmental significance.
Slapton Coastal Zone Management Main Study Volume 1: Phase 1 Report (I)
August 2006, Scott Wilson
10-2
10.3 Barrier beaches are constantly changed and modified by coastal processes in short and longer
terms. Short term changes in barrier beaches are related to local wave and current climate, tidal
variations, frequency and magnitude of storm events, barrier geometry including foreshore
slope, pre-storm crest height and alignment, type of beach sediment and permeability. Over
longer terms, sea level rise, longshore sediment transport and sediment sources and/or sinks
are the primary factors for change and modification of barrier beaches (Orford et al., 1995).
10.4 A barrier beach can respond to these factors by landward or seaward migration, reshaping and
re-alignment, crest breakdown or build-up and no change subject to certain critical but as yet ill
defined thresholds (Carter et al, 2003). Over-washing and associated breaching and over-
topping are the primary phenomena behind long term and short term barrier evolution.
10.5 Long term barrier evolution associated with coastal processes such as sea level rise is well
documented, mainly based on field investigations. It has been found that the landward migration
of the seaward shoreline of a barrier beach is linearly proportional to annual sea level change
whereas the rate of back barrier migration is not related significantly to the rate of change in sea
level (Orford et al., 1991). The difference between front and back barrier migration response to
sea level rise is found to reflect the role of short-term processes such as storm events
(frequency and magnitude), waves and currents. It has also been found that short-term sea level
rise (<10 years) may be influential in the rate of barrier break down, (Orford et al., 1996).
Reshaping of barrier beaches due to sediment sources/sinks and sand bypassing associated
with longshore sediment transport are discussed in Duncan et al. (2003).
10.6 Previous studies, of any nature, aiming at short term barrier evolutionary processes associated
with storm events, local wave climate and tidal variations are extremely scarce. Bradbury (2000)
carried out a series of 3-D mobile bed laboratory tests on barrier crest response to
hydrodynamic conditions and initial barrier geometry. Based on the model investigations,
several categories of barrier response to hydrodynamic conditions were identified and
underlying characteristics were qualitatively defined; crest raised by overtopping, crest lowered
due to undermining of crest but with no overtopping, crest raised by over-washing with roll-back,
crest lowered by over-washing with roll-back and finally, no change to the crest elevation with
profile contained to seaward of the barrier crest. An expression for an over-washing threshold of
barrier crests was also proposed based on regression analysis, which is a function of wave
steepness, barrier free board and cross-sectional area. The expression was validated against
field data gathered at Hurst Spit, UK and found to be consistent with the field data. In addition, a
conceptual model for barrier over-washing was formulated. According to his model, the beach
will initially attempt to reach a dynamic equilibrium; if the critical barrier inertia is exceeded then
over-washing will lower the crest. It was also found that hydraulic conditions such as wave
climate and storm intensity are more significant to barrier beach evolution than barrier
geography.
Slapton Coastal Zone Management Main Study Volume 1: Phase 1 Report (I)
August 2006, Scott Wilson
10-3
10.7 The balance between building-up or breaking-down of a barrier beach, which controls barrier
migration and reshaping/ realignment depends on both short term and long term barrier
response to coastal processes. However, it has been identified that barrier beaches recover
after storms to positions consistent with their long term trends given that the frequency of
occurrence of storms permit beach rebuilding in-between them. They will not experience long
term beach erosion in response to storm impact if sea level rise is not significant and sediment
supply does not change (Zhang et al., 2002).
10.8 Coarse grained barrier beaches with steep seaward slopes possess distinct morphodynamic
and hydrodynamic characteristics which differ from those on sandy barrier beaches. The
reflective nature of the seaward barrier favours development of low-frequency waves that
dominate the local on-off shore and longshore sediment transport and barrier over-washing.
Also, high seepage potential in coarse grained barrier beaches and lack of distinct tidal passes
associated with that generates very little offshore sediment transport, thus creating barrier
migration only in the onshore direction (Carter and Orford, 1984).
10.9 However, barrier beaches with a steep seaward slope are found to be relatively stable under
wave attack. Sediment particles in a coarse grained barrier are entrained only under high-
energy wave attack and produce hydrodynamically rough surfaces capable of affecting inshore
wave spectra. They have low landward migration compared to sandy counterparts unless they
have a low or breach in the fore dune, which speeds up the migration process.
Some conclusions of the review 10.10 Other than the model based on regression analysis (Bradbury, 2000), no process-based models
or probabilistic models are available to predict over-washing/overtopping thresholds.
10.11 The steepness of the seaward slope of the barrier beach is a significant parameter for
overtopping.
10.12 Over-washing and the breaching threshold of coarse grained barriers depend on
• low-frequency waves generated by swell, which extend swash run-up up to, over and
beyond the barrier crest.
• Morpho-sedimentary structure which leads to form seepage hollows to maintain seaward
discharge in the absence of tidal inlets; gradual excavation of seepage hollows acts to
undermine the barrier crest and create incipient breach points (Carter and Orford, 1984).
Review of existing literature on Slapton barrier beach
Slapton Coastal Zone Management Main Study Volume 1: Phase 1 Report (I)
August 2006, Scott Wilson
10-4
10.13 The coastline of Start Bay includes a series of minor headlands separating Hallsands,
Beesands, Slapton Sands and Blackpool Sands. Both Beesands and Slapton Sands are barrier
beaches, between 100m and 140m wide at high tide. The shingle barrier beach impounds the
lagoons of Slapton Ley and Higher Ley. The crest of the barrier at Slapton Sands falls within
6.0m O.D. ±0.5m. The tidal range in Start Bay is of the order of 2m at neap tides and 5m at
spring tides.
10.14 Skerries Bank, which lies on the southern end of Start Bay, extends from Start Point and runs
6.4km in the northeast direction. The bank consists of coarse sand and shell. Maximum height
of the bank is -4.8m while the height over most of its length is -7.5m to -9.0m.
10.15 The orientation of Start Bay makes it subject to rapid changes in wave regime. Skerries bank
adds further contributions to the changes in wave regime, especially at low water. Previous
wave refraction analysis undertaken at Start Bay has clearly shown the significance of Skerries
Bank on the wave climate where north-easterly waves with periods between 7 and 14 seconds
entering the bay are refracted by Skerries bank directly on to the south of Slapton Sands,
Beesands and Hallsands (Hails, 1974 and Holmes, 1975).
10.16 Tidal current data collected at five stations within Start Bay suggest that the submarine
topography of the bay is formed by tidal streams and that waves are less effective than currents
in transporting bottom sediment. It is also suggested that little sediment from offshore reaches
the beaches of Start Bay (Hails, 1974).
10.17 Gleason et al. (1975) collected sediment samples at Start Bay around high water and low water
marks during a series of spring tides over a period of six months. They also conducted monthly
measurements of bottom profiles at 300m intervals along Start Bay. In addition, some tracer
experiments were carried out to relate longshore sediment movement to incident wave energy.
Analysis of the sediment samples has shown that the beach material at Slapton Sands is
predominantly granules (-1 to -2Ф) and small pebbles (-2 to -4Ф). Gleason et al found from their
analysis that Slapton Sands has a pronounced longshore grading of sediment and that there is
a considerable variation in mean sediment diameter at different times of the year. They also
noticed frequent short term and short distance reversal of longshore sediment grading due to
rapid variation in incident wave direction.
10.18 According to the field investigations of Gleason et al., there is a tendency for Slapton beach to
be narrower and beach material to become coarser towards the south. It was also noted that
greatest accretion and depletion of sediment occurred at Torcross Point and Strete Head where
coarse materials accumulated against the headlands. Materials pass these headlands only at
severe weather conditions. Slapton beach was found to be the most stable beach segment
within the Start Bay.
Slapton Coastal Zone Management Main Study Volume 1: Phase 1 Report (I)
August 2006, Scott Wilson
10-5
10.19 Analysis of 50 vibro-core and 200 bottom sediment samples all over Start Bay showed that
three discrete sediment units could be identified within the Bay (Hails, 1975). These have been
described as bay, bank and barrier deposits. The bay deposits were composed of medium to
fine grained sand with varying concentration of silt and whole and broken shell. The bank
deposits were mainly coarse, shelly sand and approximately occupy the area of Skerries Bank.
The barrier deposits consisted of shingle or beach gravel and occupy a relatively narrow zone
extending from the backshore of the beach to about 200m beyond low water mark.
10.20 Field measurements have been undertaken at Slapton Sands to measure bed load sediment
transport, surface profiles and currents. During these measurements, the incident wave periods
were around 5-6 seconds; wave approach was oblique, breakers forming an angle of about 15º
to the shoreline. Breaking wave heights were 0.5-0.6m and the breakers were of surging type. It
was found from these measurements that there was a long period wave component at about
twice the incident wave period in the surface profile and flow spectra. The bed load transport
appeared to be dominated by this long period wave energy.
10.21 Robinson (1961) found that Skerries Bank has been relatively stable for over a century and
there has been a very little change in plan form of the bank from 1825 to 1951. He also found
that apart from the shingle found on the barrier and the immediate foreshore very little shingle
was found elsewhere. The materials on Skerries Bank mobilised by moderate to high seas is
redistributed by tidal currents running parallel to the coast rather than being carried shoreward.
10.22 Carr, Blackley and King (1982) carried out site investigations and field surveys to determine
spatial and seasonal aspects of beach stability at Slapton beach over a period of one year from
September 1971 to September 1972. Site investigations included collection of original wave
data from wave-rider buoys and frequency-modulated pressure recorders. Based on these
measurements they concluded that a direct relationship could not be found between incident
wave energy and change in beach height. This was due to several reasons; oblique wave
incidence from two widely different directions (NE and SE), rock headlands intervening between
various bays and the influence of offshore bathymetry on wave energy arriving at the shoreline.
Also, it was noted that the beach alignment at Slapton does not indicate any relationship with
the wave approach angle.
10.23 The investigations of Carr et al. (1982) identified that even though Start Bay appears to have
significant on-offshore sediment interchange from time to time, it does not extend beyond the
near-shore zone. Therefore, sediment is not irrevocably lost to the system. The mobility of
sediment in the longshore direction is relatively high due to oblique wave incidence and the
steep beach gradient. Brief tracer experiments carried out on the beach showed that sediment
can be transported in both northerly and southerly directions, depending on the direction of
wave approach. The headlands appeared to act as groins, causing piling up of sediment against
them. It was also identified that the seasonal change in beach volume is very complicated and
Slapton Coastal Zone Management Main Study Volume 1: Phase 1 Report (I)
August 2006, Scott Wilson
10-6
there was actually a net increase in beach volume during the winter months of that particular
year.
10.24 The Shoreline Management Plan (SMP) for Lyme Bay and South Devon (Posford Duvivier,
1998) identified Start Bay as a closed sediment cell and Skerries Bank as a wave and sediment
barrier. Skerries Bank focuses wave energy onto the southern sector of Start Bay, modifying
wave approach direction by diffraction and refraction. A limited net northward drift was identified
within the bay. According to their calculations, the net northward alongshore transport in the
southern part of Start Bay (Hallsands and Beesands) was 10,000m3/yr - 14,000m3/yr and that of
the northern part (Slapton Sands) was 60,000m3/yr - 75,000m3/yr. The report states that Slapton
Sands is likely to benefit from this northward drift. They also found that Slapton Sands has
suffered very little erosion in recent years except the rapid erosion recorded in the winter 1995.
It should be noted that the sediment transport calculations for Start Bay in the SMP for Lyme
Bay and South Devon (1998) were based on a theoretical wave analysis and were not validated
against reliable estimates of beach volume changes.
10.25 The SCOPAC sediment transport study (2002) on the littoral system of Start Bay suggests that
the net northward alongshore drift may not be typical in the long term and switches between
decadal intervals of weak northward and southward net drift might be anticipated in future. This
is based on the fact that if a unidirectional drift system is to be maintained, shoreline erosion
should be observed in the southern part of Start Bay, which is opposed to its current stable
condition.
10.26 Two studies have been undertaken, subsequent to the road collapse in January 2001. In his
report to English Nature, Pethick (2001) states that:
• Slapton barrier has been rolling landward over the past 5000 years to keep pace with sea
level rise.
• The rolling over process is effected by wash-over, transferring sediment from shore face to
back barrier
• The beach face has retreated by an average of 0.8m/yr between 1972 and 1995
• The wash-over process is unsustainable since sediment must be transferred from width to
height. Thus, the barrier is decreasing in width by 15m per century. Since there is no
sediment source to maintain barrier width, it must eventually become so narrow as to allow
breaching.
• The generally agreed hypothesis for Slapton Sands is that it is a closed sediment system.
• The Slapton system is entering the breakdown stage of the Carter-Orford barrier model
(Orford, 1995).
Slapton Coastal Zone Management Main Study Volume 1: Phase 1 Report (I)
August 2006, Scott Wilson
10-7
10.27 Orford (2001) in his report to English Nature states that the landward retreat of the barrier is a
function of:
• Rising sea levels. Barrier retreat elsewhere suggests 0.9m/yr for a sea level rise of 1mm/yr.
• Variation in on-shore wave climate associated with east and southeast storm waves. Such a
wave climate shows variation in storminess over a decadal scale.
• Variation in relative overtopping to over-washing as a function of variation in breaking wave
height. Relative balance of these two processes governs the average barrier retreat.
• Variation in long-shore spatial position of over-washing as a function of near-shore wave
focusing.
10.28 Orford (2001) suggested that the 2001 beach stabilisation by rock armouring would reduce the
local rollover rate of the barrier at the potential breach point, but will not inhibit rollover rate at
the terminal points. It will also alter the anticipated geomorphological change of the barrier in
response to sea level rise and storminess in the longer term.
10.29 FUTURECOAST (2002) was commissioned by DEFRA and carried out over a period of
approximately 21 months. The study provides predictions of coastal evolutionary tendencies
over the next century, which are to be considered in the updating of SMPs and other Strategic
Plans targeted at determining broad scale future coastal defence policy throughout the open
coast shorelines of England and Wales. The analysis of future shoreline evolution potential for
each section of coast, which is the main component of the study, provides an improved
understanding of the coastal systems and their behavioural characteristics. A framework to
enable consistent reporting, assimilation and presentation of the study results was developed.
A detailed analysis of the coastal processes and characteristics of the Slapton Line as set out in
FUTURECOAST are outlined in Appendix A.
FUTURECOAST identifies Slapton Sands as a self-contained beach, which does not have
significant sediment sources or sinks. The river Dart is not recognised as a major influence on
coastal evolution as it is separated from the rest of Start bay by hard rock headlands. Sediment
exchange between Slapton beach and Skerries bank is not observed. Although beach materials
move alongshore in both NE and SE directions depending on the incident wave direction,
widening of the beach to the north implies a net northward drift. It also identified that frequent
storms from the East and Southeast can have a significant impact on longshore transport.
10.30 According to the shoreline behaviour statement in FUTURECOAST, the recent storm damage to
the central part of Slapton barrier appears inconsistent with the general long-term behaviour of
the barrier. Evidence from historic mapping suggests that the general alignment and integrity of
the barrier has changed very little until recently. It is found that a part of the barrier beach does
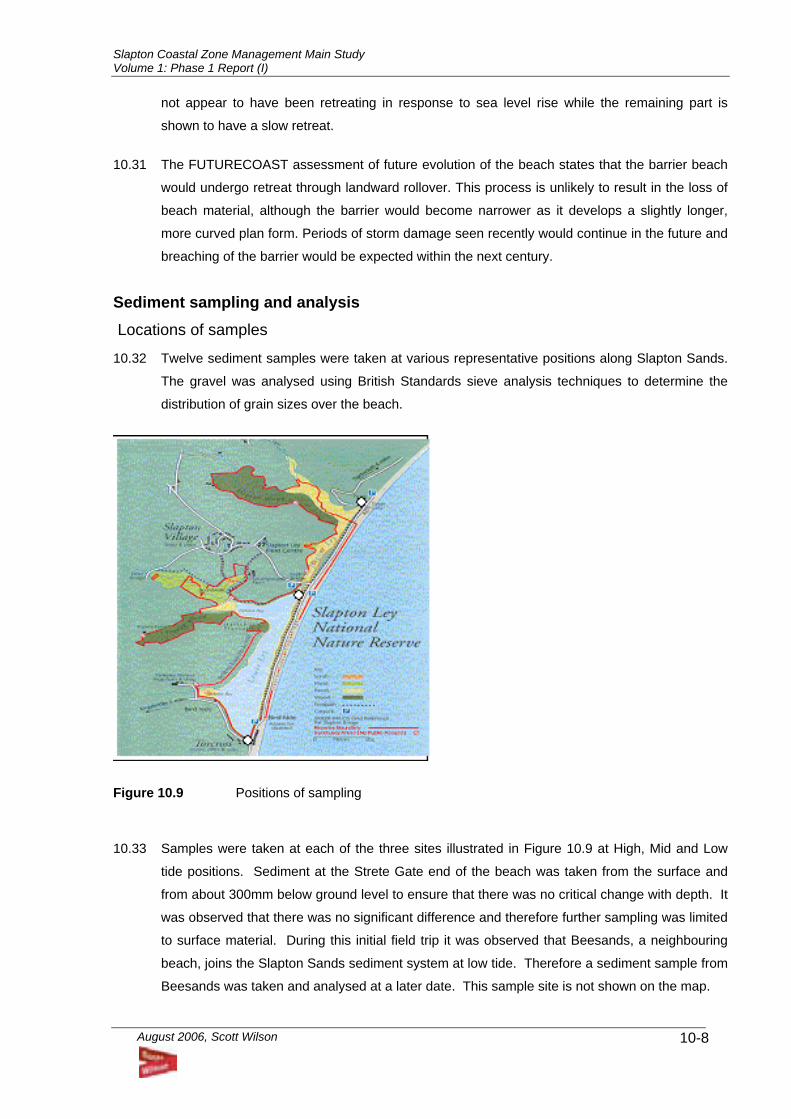
Slapton Coastal Zone Management Main Study Volume 1: Phase 1 Report (I)
August 2006, Scott Wilson
10-8
not appear to have been retreating in response to sea level rise while the remaining part is
shown to have a slow retreat.
10.31 The FUTURECOAST assessment of future evolution of the beach states that the barrier beach
would undergo retreat through landward rollover. This process is unlikely to result in the loss of
beach material, although the barrier would become narrower as it develops a slightly longer,
more curved plan form. Periods of storm damage seen recently would continue in the future and
breaching of the barrier would be expected within the next century.
Sediment sampling and analysis Locations of samples
10.32 Twelve sediment samples were taken at various representative positions along Slapton Sands.
The gravel was analysed using British Standards sieve analysis techniques to determine the
distribution of grain sizes over the beach.
Figure 10.9 Positions of sampling
10.33 Samples were taken at each of the three sites illustrated in Figure 10.9 at High, Mid and Low
tide positions. Sediment at the Strete Gate end of the beach was taken from the surface and
from about 300mm below ground level to ensure that there was no critical change with depth. It
was observed that there was no significant difference and therefore further sampling was limited
to surface material. During this initial field trip it was observed that Beesands, a neighbouring
beach, joins the Slapton Sands sediment system at low tide. Therefore a sediment sample from
Beesands was taken and analysed at a later date. This sample site is not shown on the map.
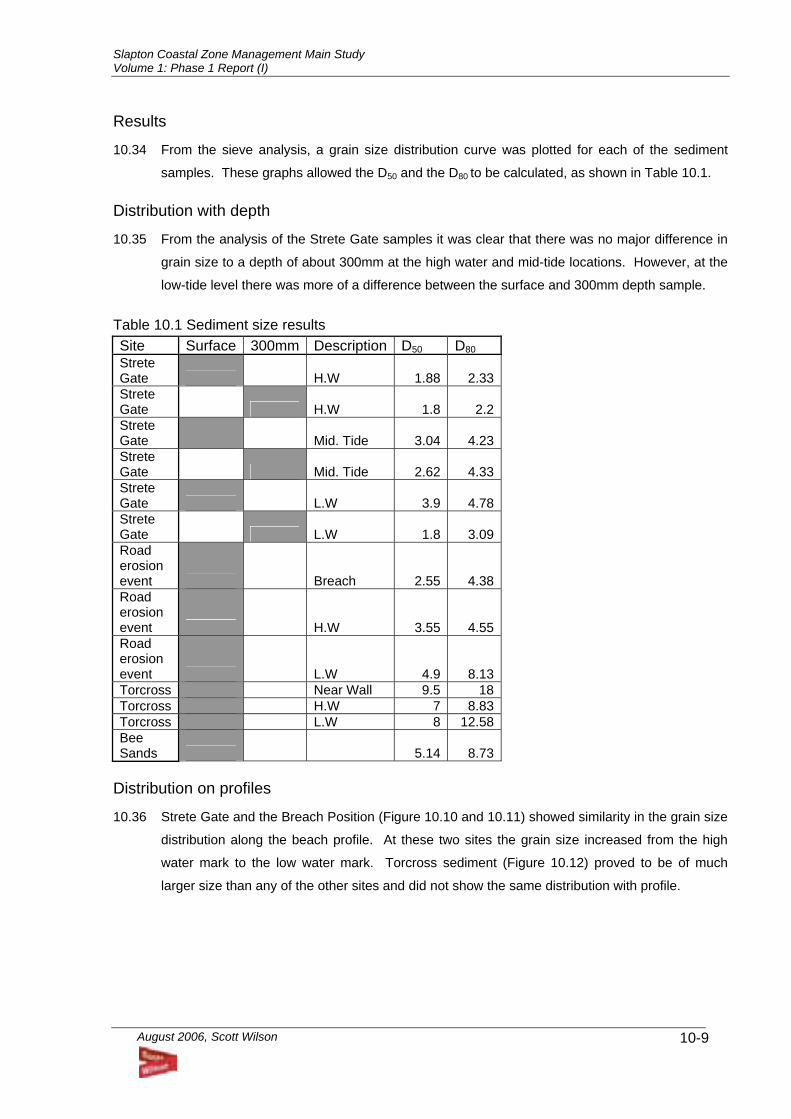
Slapton Coastal Zone Management Main Study Volume 1: Phase 1 Report (I)
August 2006, Scott Wilson
10-9
Results
10.34 From the sieve analysis, a grain size distribution curve was plotted for each of the sediment
samples. These graphs allowed the D50 and the D80 to be calculated, as shown in Table 10.1.
Distribution with depth
10.35 From the analysis of the Strete Gate samples it was clear that there was no major difference in
grain size to a depth of about 300mm at the high water and mid-tide locations. However, at the
low-tide level there was more of a difference between the surface and 300mm depth sample.
Table 10.1 Sediment size results Site Surface 300mm Description D50 D80 Strete Gate H.W 1.88 2.33Strete Gate H.W 1.8 2.2Strete Gate Mid. Tide 3.04 4.23Strete Gate Mid. Tide 2.62 4.33Strete Gate L.W 3.9 4.78Strete Gate L.W 1.8 3.09Road erosion event Breach 2.55 4.38Road erosion event H.W 3.55 4.55Road erosion event L.W 4.9 8.13Torcross Near Wall 9.5 18Torcross H.W 7 8.83Torcross L.W 8 12.58Bee Sands 5.14 8.73
Distribution on profiles
10.36 Strete Gate and the Breach Position (Figure 10.10 and 10.11) showed similarity in the grain size
distribution along the beach profile. At these two sites the grain size increased from the high
water mark to the low water mark. Torcross sediment (Figure 10.12) proved to be of much
larger size than any of the other sites and did not show the same distribution with profile.
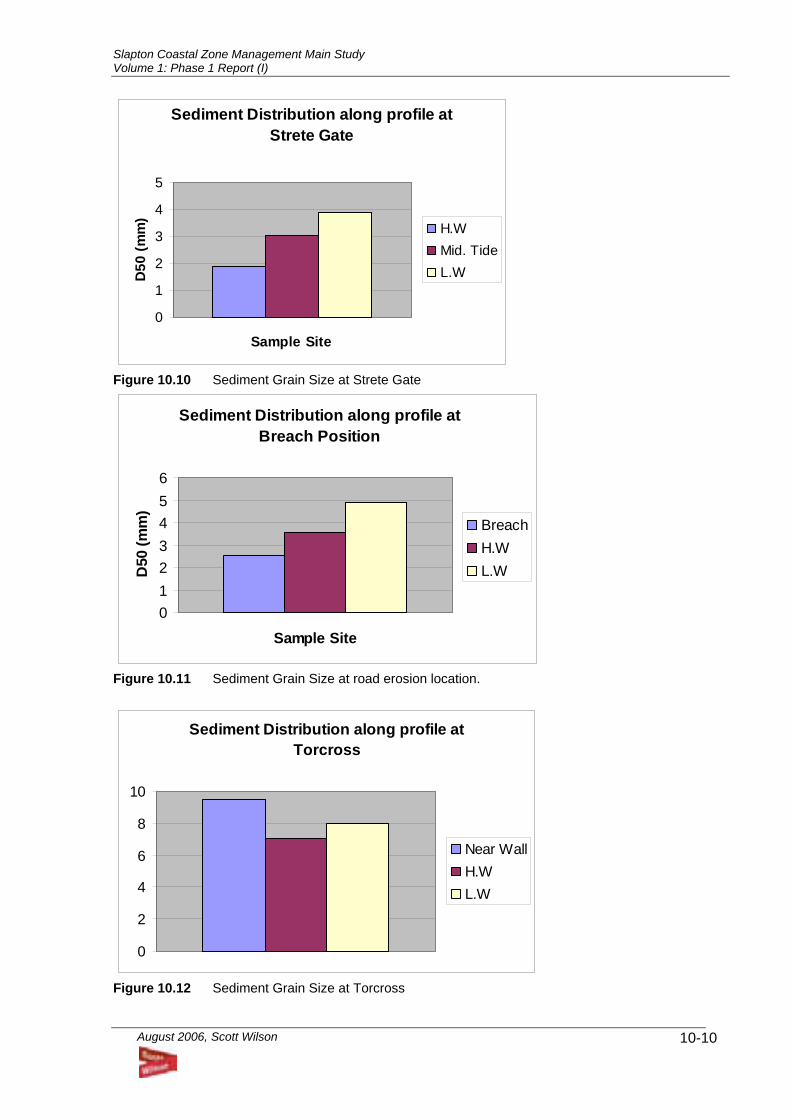
Slapton Coastal Zone Management Main Study Volume 1: Phase 1 Report (I)
August 2006, Scott Wilson
10-10
Sediment Distribution along profile at Strete Gate
0
1
2
3
4
5
Sample Site
D50
(mm
)
H.WMid. TideL.W
Figure 10.10 Sediment Grain Size at Strete Gate
Sediment Distribution along profile at Breach Position
0123456
Sample Site
D50
(mm
)
BreachH.WL.W
Figure 10.11 Sediment Grain Size at road erosion location.
Sediment Distribution along profile at Torcross
0
2
4
6
8
10
Near WallH.WL.W
Figure 10.12 Sediment Grain Size at Torcross
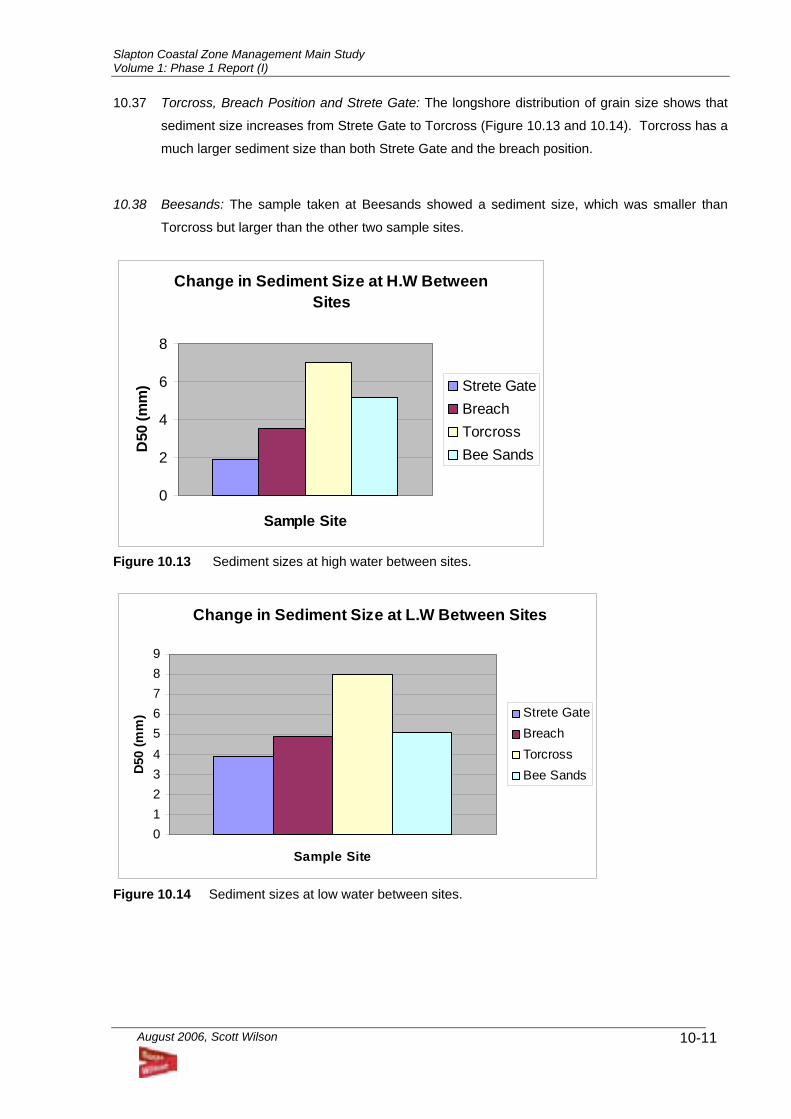
Slapton Coastal Zone Management Main Study Volume 1: Phase 1 Report (I)
August 2006, Scott Wilson
10-11
10.37 Torcross, Breach Position and Strete Gate: The longshore distribution of grain size shows that
sediment size increases from Strete Gate to Torcross (Figure 10.13 and 10.14). Torcross has a
much larger sediment size than both Strete Gate and the breach position.
10.38 Beesands: The sample taken at Beesands showed a sediment size, which was smaller than
Torcross but larger than the other two sample sites.
Change in Sediment Size at H.W Between Sites
0
2
4
6
8
Sample Site
D50
(mm
) Strete GateBreachTorcrossBee Sands
Figure 10.13 Sediment sizes at high water between sites.
Change in Sediment Size at L.W Between Sites
0123456789
Sample Site
D50
(mm
) Strete GateBreachTorcrossBee Sands
Figure 10.14 Sediment sizes at low water between sites.
Slapton Coastal Zone Management Main Study Volume 1: Phase 1 Report (I)
August 2006, Scott Wilson
10-12
Other Coastline Areas within Start Bay Hallsands
10.39 In 1896, Sir John Jackson was awarded a contract to extend the Keyham dock, Devonport. A
license was awarded by the government of the time for Sir John Jackson to start dredging
between Hallsands and Beesands. Dredging commenced in April 1897.
10.40 The majority of the shingle was taken from between the low and high water mark. In 1900 the
villages began to notice the problems caused by the dredging. The road and the sea wall were
beginning to become dangerous.
10.41 On September 11th 1901, Captain G C Frederick visited the bay to measure how much the
beach level had decreased. He found that the level had decreased along the whole coast but
had fallen by up to 12 feet in places where the dredgers had operated. He found that continued
dredging should be stopped because if allowed to continue, the road and the houses would be
at risk during a storm.
10.42 On the 26th of February 1903 at high tide, a storm started to bring water over the walls, which
led to houses closest to the beach being undermined. Two nights later, the quay at the southern
end of the village collapsed, as did the road and more houses.
10.43 The villages were awarded compensation by Sir John Jackson and the Board of Trade. The
money was given on the condition that the villages accepted it on the condition that it was the
final settlement and that they could not claim for any damage that may occur in the future. The
villages were able to repair the defences and provide new homes to the people who were worst
affected.
10.44 On The 26th January 1917, there was a south westerly storm that breached the walls and
destroyed many homes. 24 families were homeless however no one was killed. Only homes that
were on the top of the cliff survived.
Blackpool Sands 10.45 The SMP identifies that the coast is eroding, and hence that to do nothing along this stretch of
coastline would eventually lead to undermining of the current coastal defences, which would
result in loss of recreational land and eventually the A379. An area of Car Parking and property
would become susceptible to flooding.
10.46 The SMP identifies that the embankment and wave return wall are currently not performing
satisfactorily. Additional defences are required. Future works should incorporate beach
recharge.
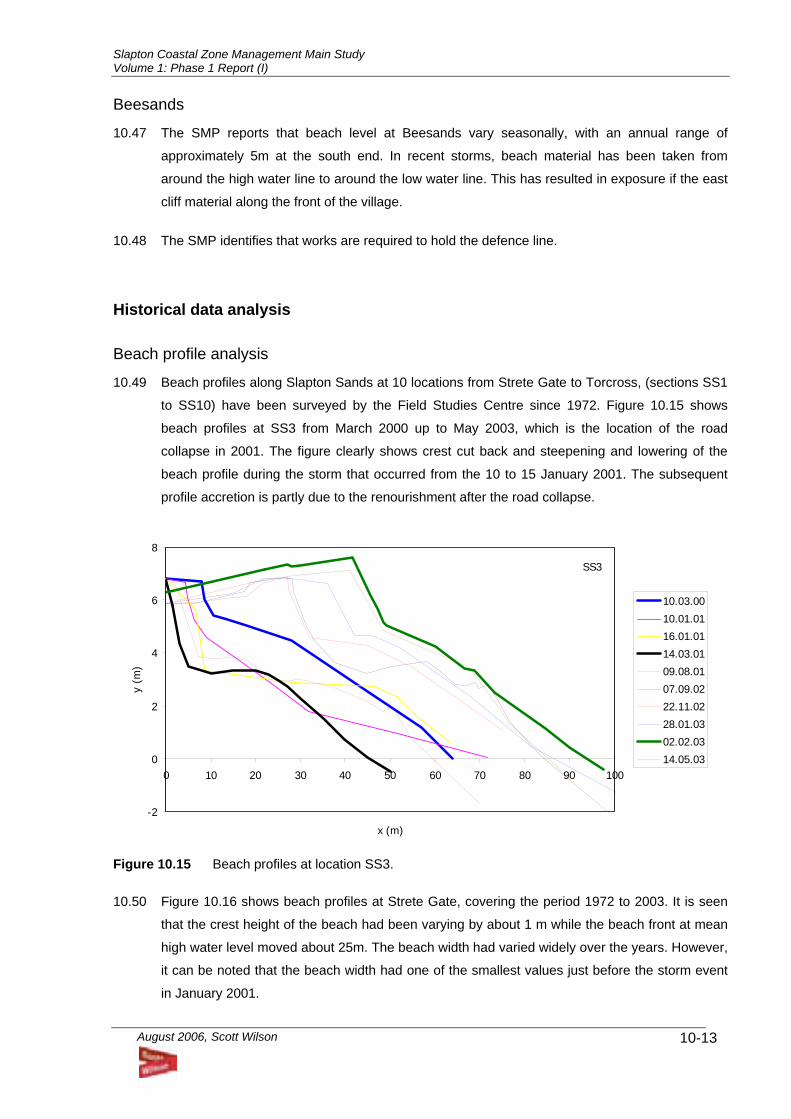
Slapton Coastal Zone Management Main Study Volume 1: Phase 1 Report (I)
August 2006, Scott Wilson
10-13
Beesands
10.47 The SMP reports that beach level at Beesands vary seasonally, with an annual range of
approximately 5m at the south end. In recent storms, beach material has been taken from
around the high water line to around the low water line. This has resulted in exposure if the east
cliff material along the front of the village.
10.48 The SMP identifies that works are required to hold the defence line.
Historical data analysis Beach profile analysis
10.49 Beach profiles along Slapton Sands at 10 locations from Strete Gate to Torcross, (sections SS1
to SS10) have been surveyed by the Field Studies Centre since 1972. Figure 10.15 shows
beach profiles at SS3 from March 2000 up to May 2003, which is the location of the road
collapse in 2001. The figure clearly shows crest cut back and steepening and lowering of the
beach profile during the storm that occurred from the 10 to 15 January 2001. The subsequent
profile accretion is partly due to the renourishment after the road collapse.
-2
0
2
4
6
8
0 10 20 30 40 50 60 70 80 90 100
x (m)
y (m
)
10.03.00
10.01.01
16.01.01
14.03.01
09.08.01
07.09.02
22.11.02
28.01.03
02.02.03
14.05.03
SS3
Figure 10.15 Beach profiles at location SS3. 10.50 Figure 10.16 shows beach profiles at Strete Gate, covering the period 1972 to 2003. It is seen
that the crest height of the beach had been varying by about 1 m while the beach front at mean
high water level moved about 25m. The beach width had varied widely over the years. However,
it can be noted that the beach width had one of the smallest values just before the storm event
in January 2001.
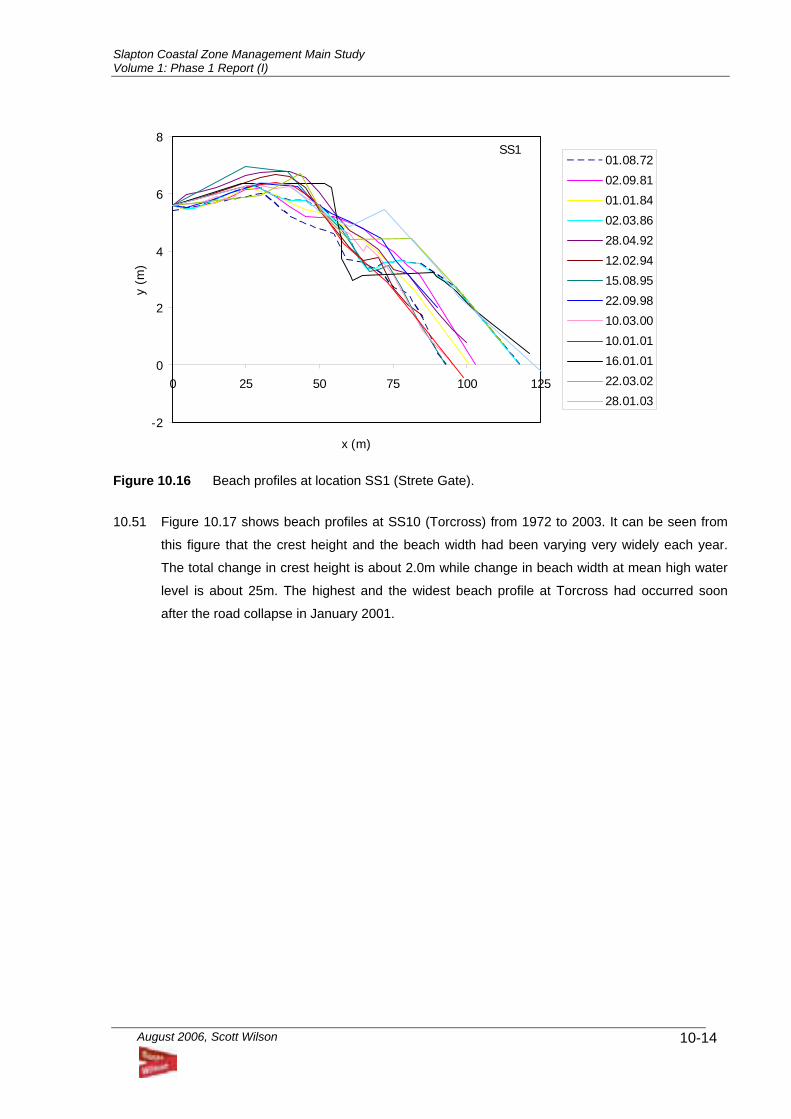
Slapton Coastal Zone Management Main Study Volume 1: Phase 1 Report (I)
August 2006, Scott Wilson
10-14
-2
0
2
4
6
8
0 25 50 75 100 125
x (m)
y (m
)
01.08.72
02.09.81
01.01.84
02.03.86
28.04.92
12.02.94
15.08.95
22.09.98
10.03.00
10.01.01
16.01.01
22.03.02
28.01.03
SS1
Figure 10.16 Beach profiles at location SS1 (Strete Gate). 10.51 Figure 10.17 shows beach profiles at SS10 (Torcross) from 1972 to 2003. It can be seen from
this figure that the crest height and the beach width had been varying very widely each year.
The total change in crest height is about 2.0m while change in beach width at mean high water
level is about 25m. The highest and the widest beach profile at Torcross had occurred soon
after the road collapse in January 2001.
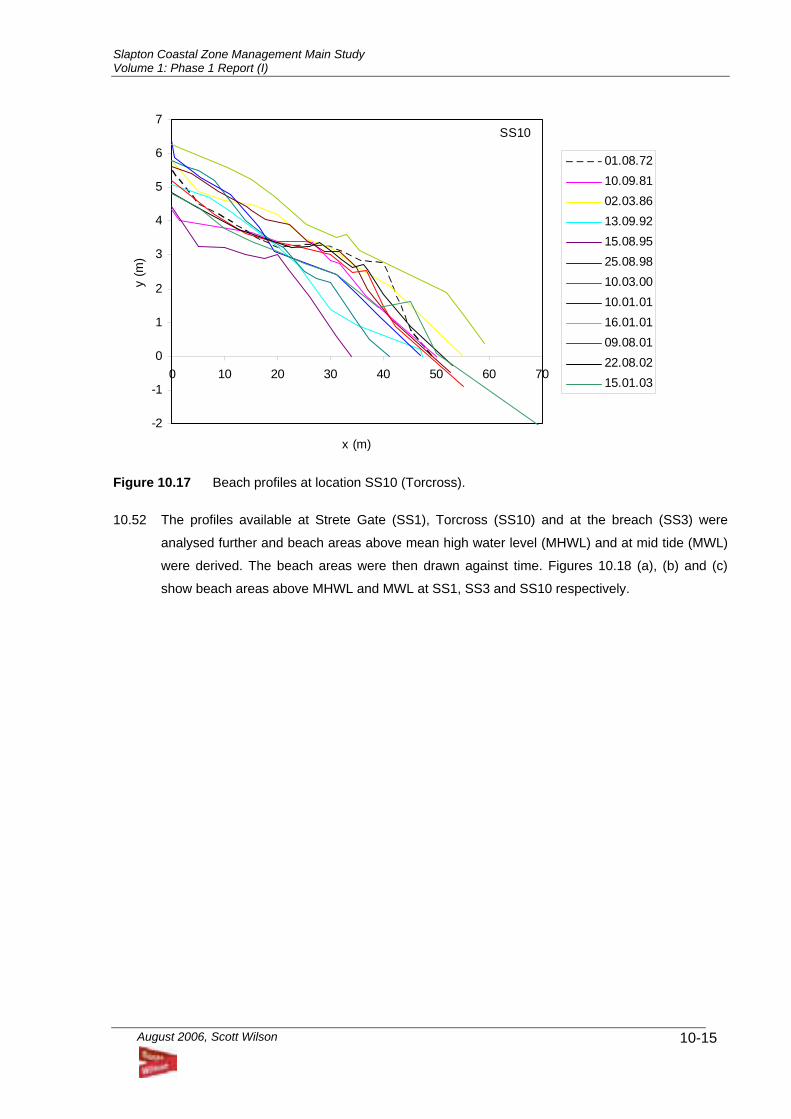
Slapton Coastal Zone Management Main Study Volume 1: Phase 1 Report (I)
August 2006, Scott Wilson
10-15
-2
-1
0
1
2
3
4
5
6
7
0 10 20 30 40 50 60 70
x (m)
y (m
)
01.08.7210.09.8102.03.8613.09.9215.08.9525.08.9810.03.0010.01.0116.01.0109.08.0122.08.0215.01.03
SS10
Figure 10.17 Beach profiles at location SS10 (Torcross). 10.52 The profiles available at Strete Gate (SS1), Torcross (SS10) and at the breach (SS3) were
analysed further and beach areas above mean high water level (MHWL) and at mid tide (MWL)
were derived. The beach areas were then drawn against time. Figures 10.18 (a), (b) and (c)
show beach areas above MHWL and MWL at SS1, SS3 and SS10 respectively.
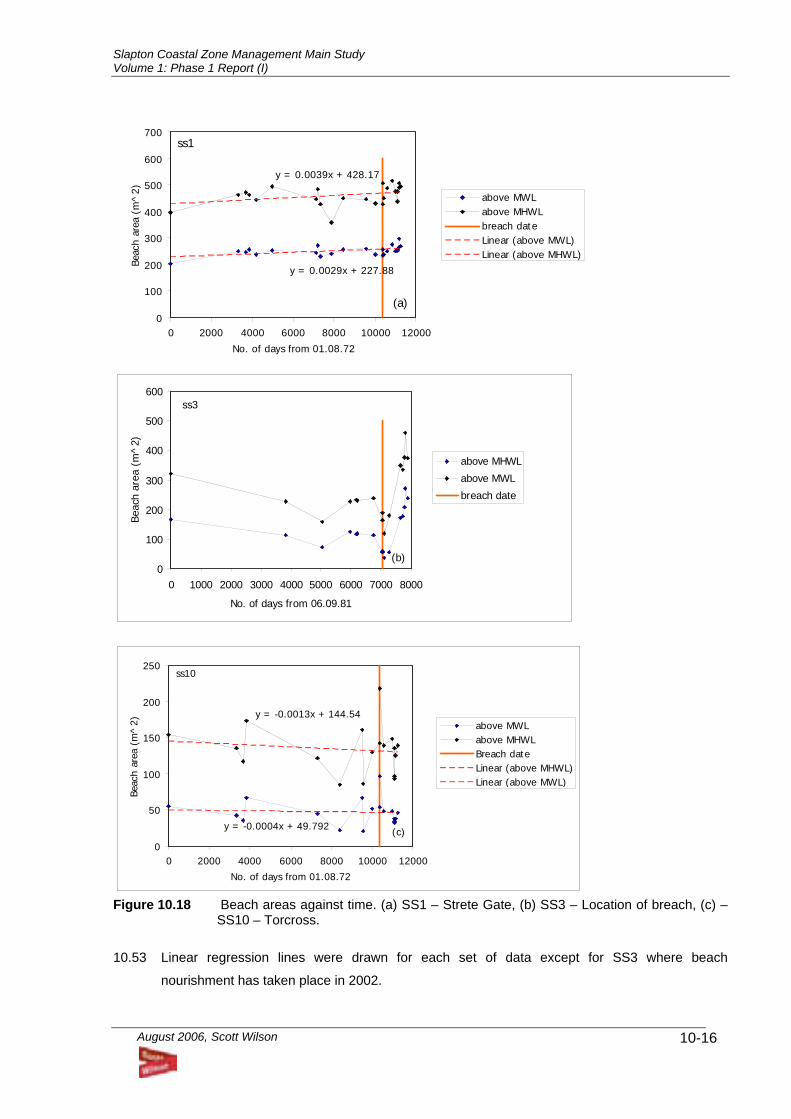
Slapton Coastal Zone Management Main Study Volume 1: Phase 1 Report (I)
August 2006, Scott Wilson
10-16
y = 0.0029x + 227.88
y = 0.0039x + 428.17
0
100
200
300
400
500
600
700
0 2000 4000 6000 8000 10000 12000
No. of days from 01.08.72
Beac
h ar
ea (
m^
2)
above MWLabove MHWLbreach dateLinear (above MWL)Linear (above MHWL)
ss1
(a)
0
100
200
300
400
500
600
0 1000 2000 3000 4000 5000 6000 7000 8000
No. of days from 06.09.81
Beac
h ar
ea (
m^
2)
above MHWL
above MWL
breach date
ss3
(b)
y = -0.0013x + 144.54
y = -0.0004x + 49.792
0
50
100
150
200
250
0 2000 4000 6000 8000 10000 12000
No. of days from 01.08.72
Beac
h ar
ea (
m^
2) above MWLabove MHWLBreach dateLinear (above MHWL)Linear (above MWL)
ss10
(c)
Figure 10.18 Beach areas against time. (a) SS1 – Strete Gate, (b) SS3 – Location of breach, (c) –
SS10 – Torcross. 10.53 Linear regression lines were drawn for each set of data except for SS3 where beach
nourishment has taken place in 2002.
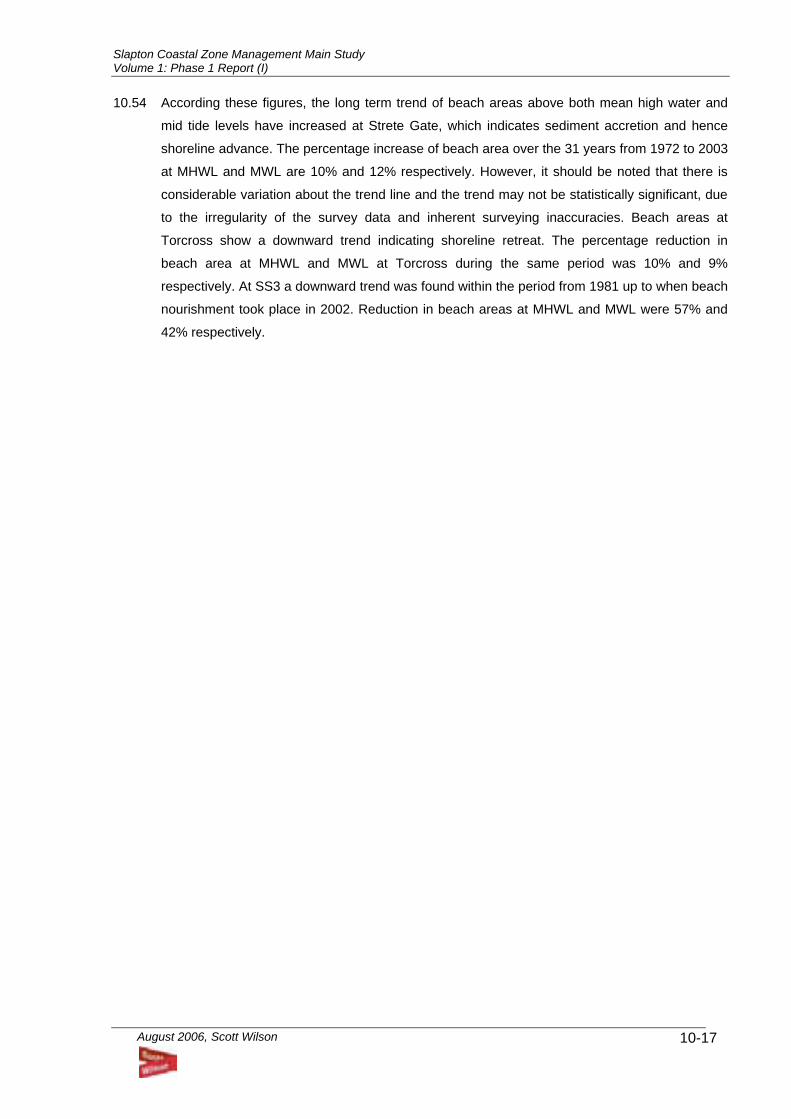
Slapton Coastal Zone Management Main Study Volume 1: Phase 1 Report (I)
August 2006, Scott Wilson
10-17
10.54 According these figures, the long term trend of beach areas above both mean high water and
mid tide levels have increased at Strete Gate, which indicates sediment accretion and hence
shoreline advance. The percentage increase of beach area over the 31 years from 1972 to 2003
at MHWL and MWL are 10% and 12% respectively. However, it should be noted that there is
considerable variation about the trend line and the trend may not be statistically significant, due
to the irregularity of the survey data and inherent surveying inaccuracies. Beach areas at
Torcross show a downward trend indicating shoreline retreat. The percentage reduction in
beach area at MHWL and MWL at Torcross during the same period was 10% and 9%
respectively. At SS3 a downward trend was found within the period from 1981 up to when beach
nourishment took place in 2002. Reduction in beach areas at MHWL and MWL were 57% and
42% respectively.
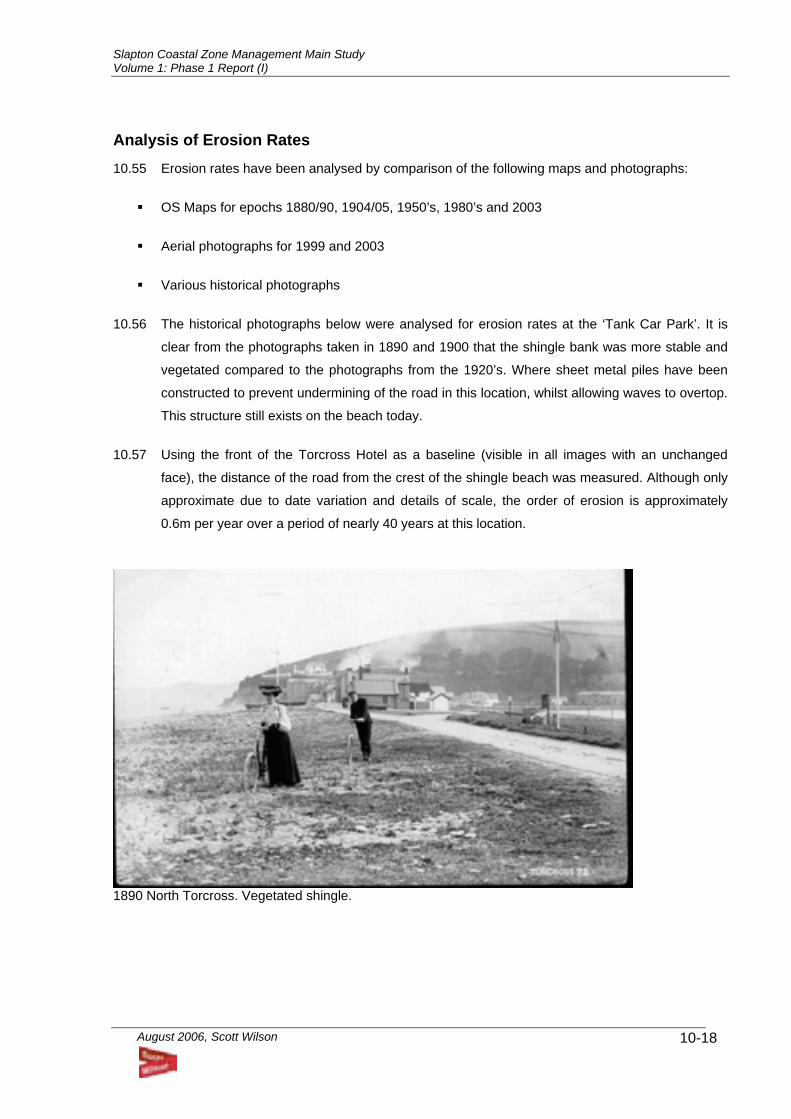
Slapton Coastal Zone Management Main Study Volume 1: Phase 1 Report (I)
August 2006, Scott Wilson
10-18
Analysis of Erosion Rates 10.55 Erosion rates have been analysed by comparison of the following maps and photographs:
OS Maps for epochs 1880/90, 1904/05, 1950’s, 1980’s and 2003
Aerial photographs for 1999 and 2003
Various historical photographs
10.56 The historical photographs below were analysed for erosion rates at the ‘Tank Car Park’. It is
clear from the photographs taken in 1890 and 1900 that the shingle bank was more stable and
vegetated compared to the photographs from the 1920’s. Where sheet metal piles have been
constructed to prevent undermining of the road in this location, whilst allowing waves to overtop.
This structure still exists on the beach today.
10.57 Using the front of the Torcross Hotel as a baseline (visible in all images with an unchanged
face), the distance of the road from the crest of the shingle beach was measured. Although only
approximate due to date variation and details of scale, the order of erosion is approximately
0.6m per year over a period of nearly 40 years at this location.
1890 North Torcross. Vegetated shingle.
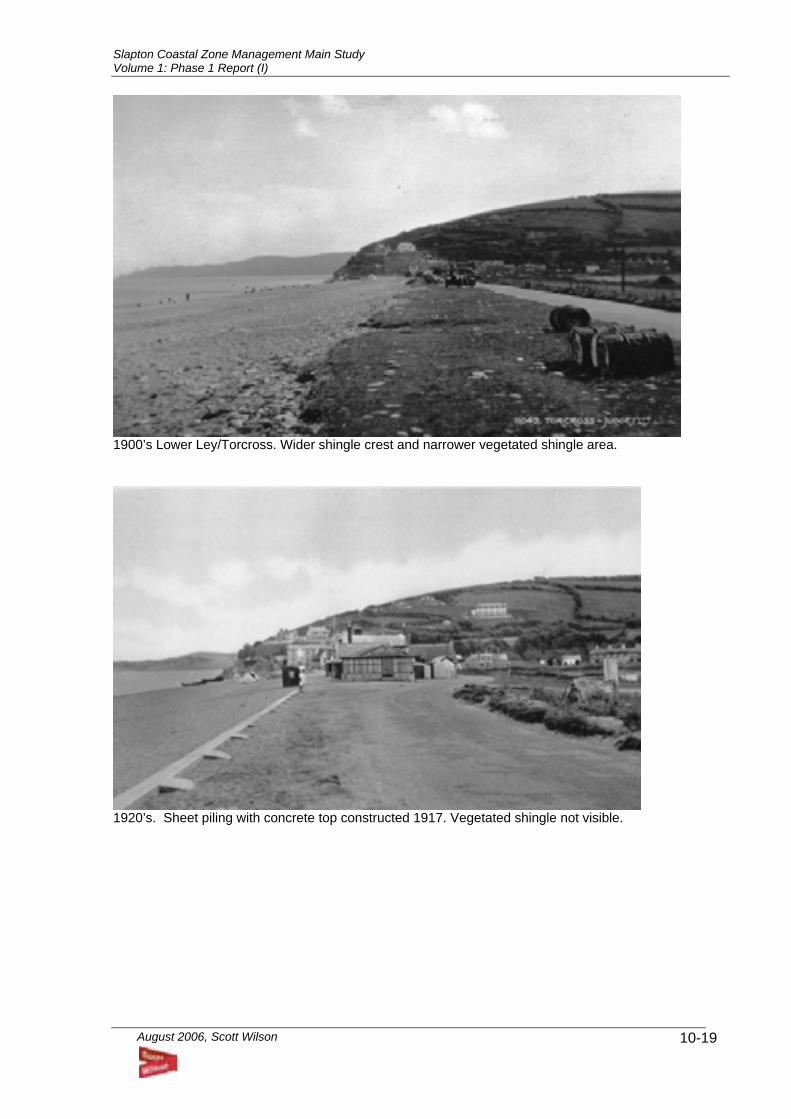
Slapton Coastal Zone Management Main Study Volume 1: Phase 1 Report (I)
August 2006, Scott Wilson
10-19
1900’s Lower Ley/Torcross. Wider shingle crest and narrower vegetated shingle area.
1920’s. Sheet piling with concrete top constructed 1917. Vegetated shingle not visible.
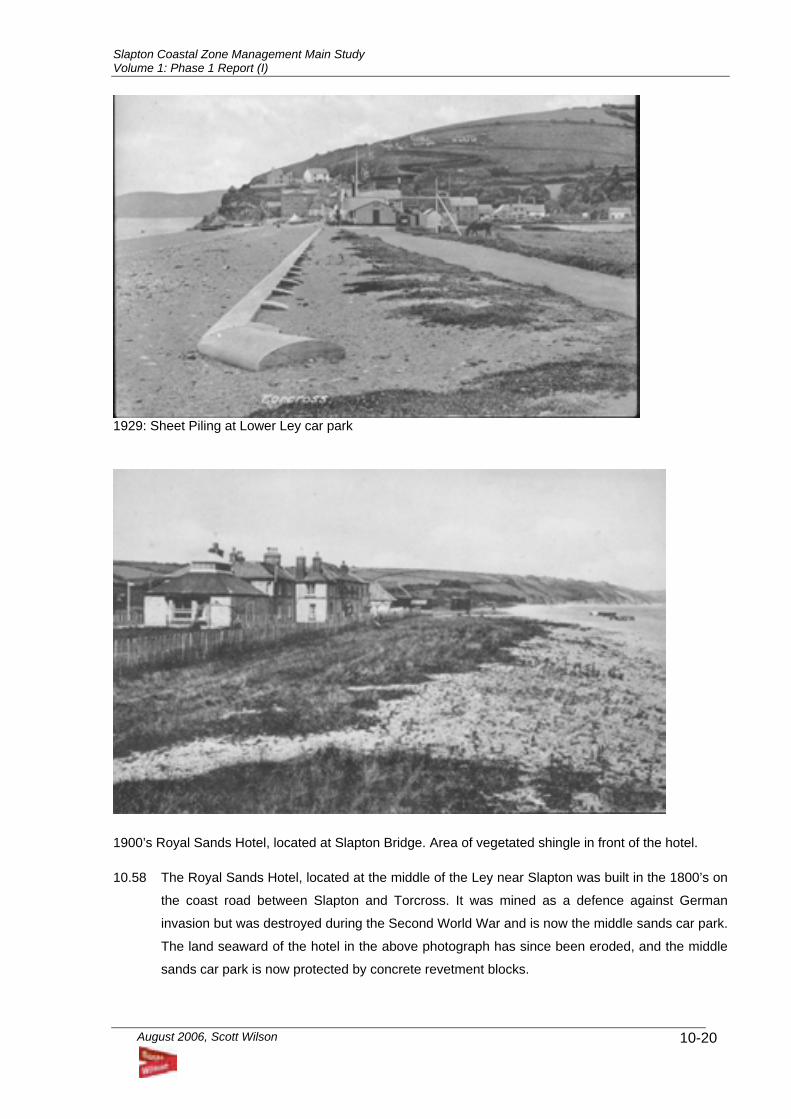
Slapton Coastal Zone Management Main Study Volume 1: Phase 1 Report (I)
August 2006, Scott Wilson
10-20
1929: Sheet Piling at Lower Ley car park
1900’s Royal Sands Hotel, located at Slapton Bridge. Area of vegetated shingle in front of the hotel. 10.58 The Royal Sands Hotel, located at the middle of the Ley near Slapton was built in the 1800’s on
the coast road between Slapton and Torcross. It was mined as a defence against German
invasion but was destroyed during the Second World War and is now the middle sands car park.
The land seaward of the hotel in the above photograph has since been eroded, and the middle
sands car park is now protected by concrete revetment blocks.
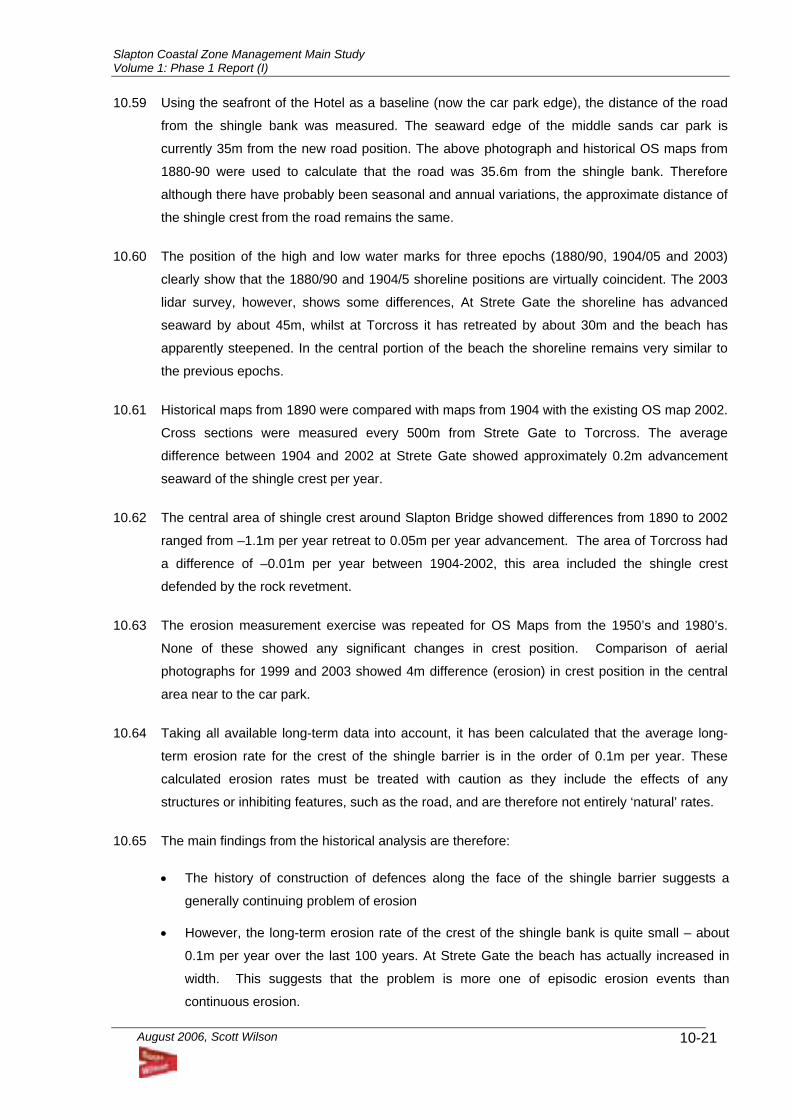
Slapton Coastal Zone Management Main Study Volume 1: Phase 1 Report (I)
August 2006, Scott Wilson
10-21
10.59 Using the seafront of the Hotel as a baseline (now the car park edge), the distance of the road
from the shingle bank was measured. The seaward edge of the middle sands car park is
currently 35m from the new road position. The above photograph and historical OS maps from
1880-90 were used to calculate that the road was 35.6m from the shingle bank. Therefore
although there have probably been seasonal and annual variations, the approximate distance of
the shingle crest from the road remains the same.
10.60 The position of the high and low water marks for three epochs (1880/90, 1904/05 and 2003)
clearly show that the 1880/90 and 1904/5 shoreline positions are virtually coincident. The 2003
lidar survey, however, shows some differences, At Strete Gate the shoreline has advanced
seaward by about 45m, whilst at Torcross it has retreated by about 30m and the beach has
apparently steepened. In the central portion of the beach the shoreline remains very similar to
the previous epochs.
10.61 Historical maps from 1890 were compared with maps from 1904 with the existing OS map 2002.
Cross sections were measured every 500m from Strete Gate to Torcross. The average
difference between 1904 and 2002 at Strete Gate showed approximately 0.2m advancement
seaward of the shingle crest per year.
10.62 The central area of shingle crest around Slapton Bridge showed differences from 1890 to 2002
ranged from –1.1m per year retreat to 0.05m per year advancement. The area of Torcross had
a difference of –0.01m per year between 1904-2002, this area included the shingle crest
defended by the rock revetment.
10.63 The erosion measurement exercise was repeated for OS Maps from the 1950’s and 1980’s.
None of these showed any significant changes in crest position. Comparison of aerial
photographs for 1999 and 2003 showed 4m difference (erosion) in crest position in the central
area near to the car park.
10.64 Taking all available long-term data into account, it has been calculated that the average long-
term erosion rate for the crest of the shingle barrier is in the order of 0.1m per year. These
calculated erosion rates must be treated with caution as they include the effects of any
structures or inhibiting features, such as the road, and are therefore not entirely ‘natural’ rates.
10.65 The main findings from the historical analysis are therefore:
• The history of construction of defences along the face of the shingle barrier suggests a
generally continuing problem of erosion
• However, the long-term erosion rate of the crest of the shingle bank is quite small – about
0.1m per year over the last 100 years. At Strete Gate the beach has actually increased in
width. This suggests that the problem is more one of episodic erosion events than
continuous erosion.
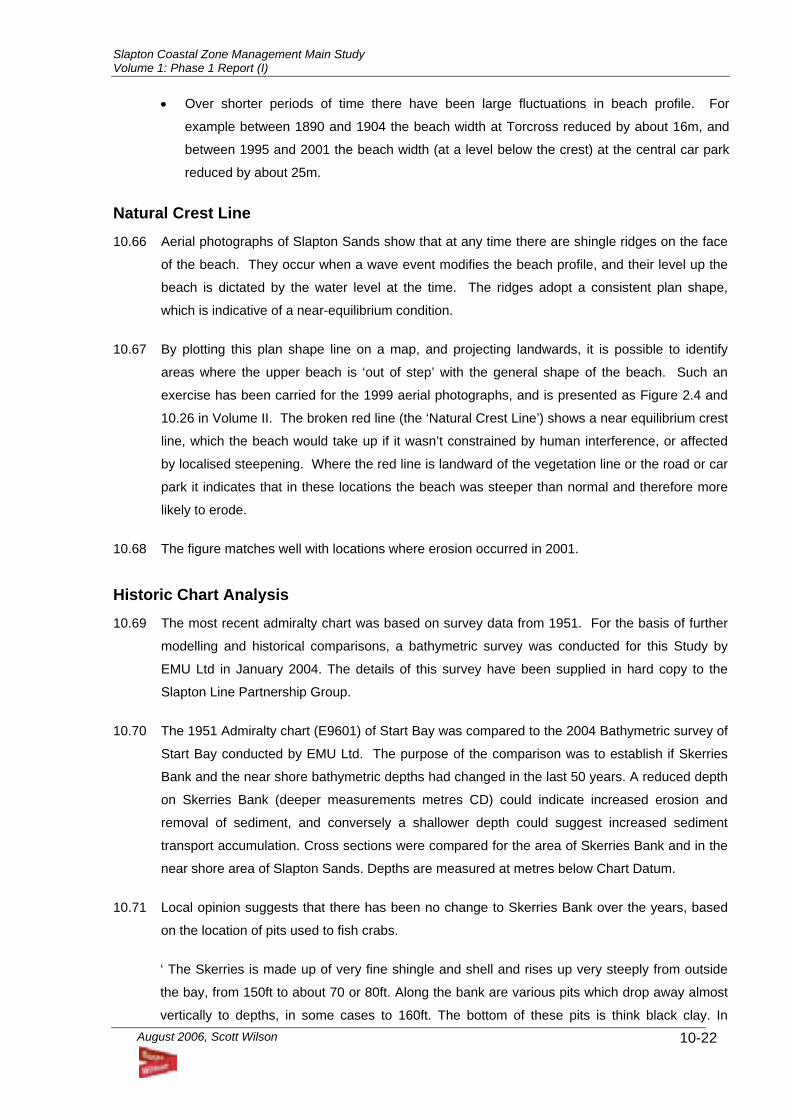
Slapton Coastal Zone Management Main Study Volume 1: Phase 1 Report (I)
August 2006, Scott Wilson
10-22
• Over shorter periods of time there have been large fluctuations in beach profile. For
example between 1890 and 1904 the beach width at Torcross reduced by about 16m, and
between 1995 and 2001 the beach width (at a level below the crest) at the central car park
reduced by about 25m.
Natural Crest Line 10.66 Aerial photographs of Slapton Sands show that at any time there are shingle ridges on the face
of the beach. They occur when a wave event modifies the beach profile, and their level up the
beach is dictated by the water level at the time. The ridges adopt a consistent plan shape,
which is indicative of a near-equilibrium condition.
10.67 By plotting this plan shape line on a map, and projecting landwards, it is possible to identify
areas where the upper beach is ‘out of step’ with the general shape of the beach. Such an
exercise has been carried for the 1999 aerial photographs, and is presented as Figure 2.4 and
10.26 in Volume II. The broken red line (the ‘Natural Crest Line’) shows a near equilibrium crest
line, which the beach would take up if it wasn’t constrained by human interference, or affected
by localised steepening. Where the red line is landward of the vegetation line or the road or car
park it indicates that in these locations the beach was steeper than normal and therefore more
likely to erode.
10.68 The figure matches well with locations where erosion occurred in 2001.
Historic Chart Analysis 10.69 The most recent admiralty chart was based on survey data from 1951. For the basis of further
modelling and historical comparisons, a bathymetric survey was conducted for this Study by
EMU Ltd in January 2004. The details of this survey have been supplied in hard copy to the
Slapton Line Partnership Group.
10.70 The 1951 Admiralty chart (E9601) of Start Bay was compared to the 2004 Bathymetric survey of
Start Bay conducted by EMU Ltd. The purpose of the comparison was to establish if Skerries
Bank and the near shore bathymetric depths had changed in the last 50 years. A reduced depth
on Skerries Bank (deeper measurements metres CD) could indicate increased erosion and
removal of sediment, and conversely a shallower depth could suggest increased sediment
transport accumulation. Cross sections were compared for the area of Skerries Bank and in the
near shore area of Slapton Sands. Depths are measured at metres below Chart Datum.
10.71 Local opinion suggests that there has been no change to Skerries Bank over the years, based
on the location of pits used to fish crabs.
‘ The Skerries is made up of very fine shingle and shell and rises up very steeply from outside
the bay, from 150ft to about 70 or 80ft. Along the bank are various pits which drop away almost
vertically to depths, in some cases to 160ft. The bottom of these pits is think black clay. In
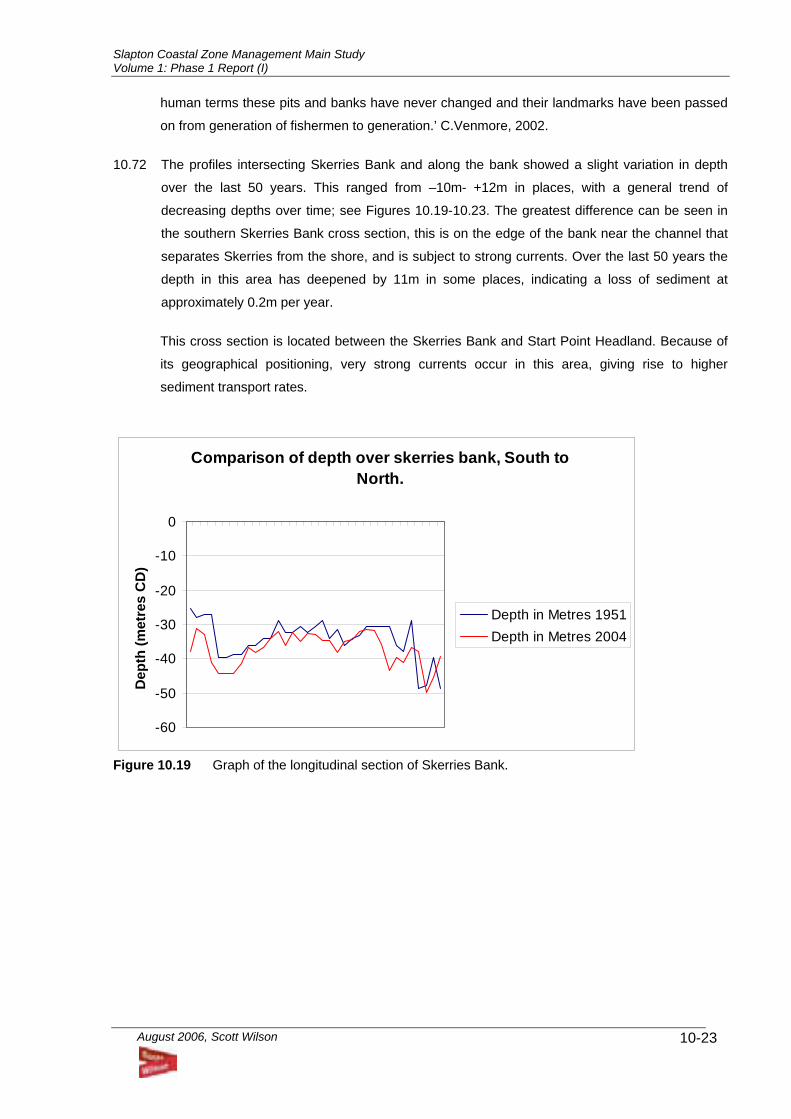
Slapton Coastal Zone Management Main Study Volume 1: Phase 1 Report (I)
August 2006, Scott Wilson
10-23
human terms these pits and banks have never changed and their landmarks have been passed
on from generation of fishermen to generation.’ C.Venmore, 2002.
10.72 The profiles intersecting Skerries Bank and along the bank showed a slight variation in depth
over the last 50 years. This ranged from –10m- +12m in places, with a general trend of
decreasing depths over time; see Figures 10.19-10.23. The greatest difference can be seen in
the southern Skerries Bank cross section, this is on the edge of the bank near the channel that
separates Skerries from the shore, and is subject to strong currents. Over the last 50 years the
depth in this area has deepened by 11m in some places, indicating a loss of sediment at
approximately 0.2m per year.
This cross section is located between the Skerries Bank and Start Point Headland. Because of
its geographical positioning, very strong currents occur in this area, giving rise to higher
sediment transport rates.
Comparison of depth over skerries bank, South to North.
-60
-50
-40
-30
-20
-10
0
Dep
th (m
etre
s C
D)
Depth in Metres 1951Depth in Metres 2004
Figure 10.19 Graph of the longitudinal section of Skerries Bank.
Slapton Coastal Zone Management Main Study Volume 1: Phase 1 Report (I)
August 2006, Scott Wilson
10-24
Comparison of a cross section of south Skerries Bank
-40
-35
-30
-25
-20
-15
-10
-5
0D
epth
(met
res
CD
)
Depth 1951Depth 2004
Figure 10.20 Graph of Southern cross section of Skerries Bank.
Cross Section, middle of Skerries Bank
-40
-35
-30
-25
-20
-15
-10
-5
0
Dep
th (m
etre
s C
D)
Depth 1951Depth 2004
Figure 10.21 Graph of cross section middle Skerries Bank. 10.73 The profiles from the nearshore area (see Figure 10.22) show little variation over the last 50
years. The average depth increase is between 0.03-0.02m per year. The depth gradient
increases from 12m-15m according to the 2004 survey, whilst the 1951 survey showed a slope
of 12-14m. Indicating that sediment paths in this area remain relatively unchanged after
50years.
10.74 The comparison of profiles parallel to the shingle beach shows a slight variation in depth at the
southern end of the cross section. This area runs parallel to Hallsands and Beesands where
erosion and sea defences could have impacted on the existing sediment transport paths (see
Figure 10.23).
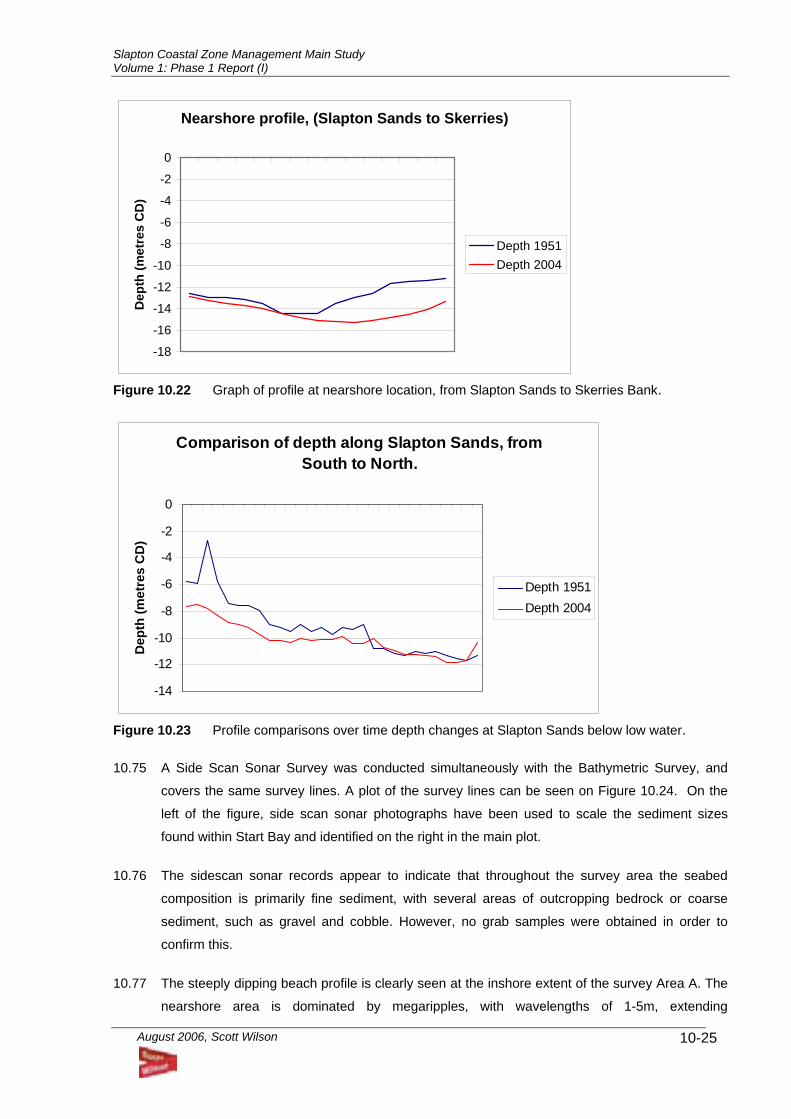
Slapton Coastal Zone Management Main Study Volume 1: Phase 1 Report (I)
August 2006, Scott Wilson
10-25
Nearshore profile, (Slapton Sands to Skerries)
-18
-16
-14
-12
-10
-8
-6
-4
-2
0D
epth
(met
res
CD
)
Depth 1951Depth 2004
Figure 10.22 Graph of profile at nearshore location, from Slapton Sands to Skerries Bank.
Comparison of depth along Slapton Sands, from South to North.
-14
-12
-10
-8
-6
-4
-2
0
Dep
th (m
etre
s C
D)
Depth 1951Depth 2004
Figure 10.23 Profile comparisons over time depth changes at Slapton Sands below low water. 10.75 A Side Scan Sonar Survey was conducted simultaneously with the Bathymetric Survey, and
covers the same survey lines. A plot of the survey lines can be seen on Figure 10.24. On the
left of the figure, side scan sonar photographs have been used to scale the sediment sizes
found within Start Bay and identified on the right in the main plot.
10.76 The sidescan sonar records appear to indicate that throughout the survey area the seabed
composition is primarily fine sediment, with several areas of outcropping bedrock or coarse
sediment, such as gravel and cobble. However, no grab samples were obtained in order to
confirm this.
10.77 The steeply dipping beach profile is clearly seen at the inshore extent of the survey Area A. The
nearshore area is dominated by megaripples, with wavelengths of 1-5m, extending
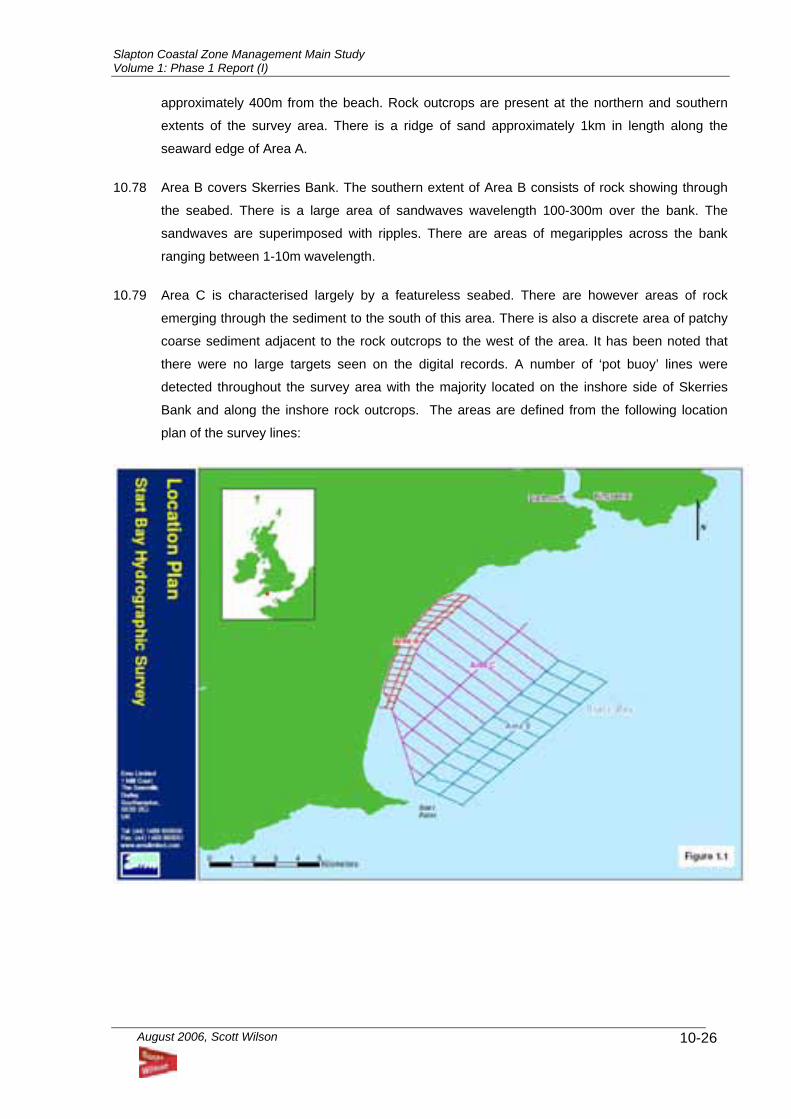
Slapton Coastal Zone Management Main Study Volume 1: Phase 1 Report (I)
August 2006, Scott Wilson
10-26
approximately 400m from the beach. Rock outcrops are present at the northern and southern
extents of the survey area. There is a ridge of sand approximately 1km in length along the
seaward edge of Area A.
10.78 Area B covers Skerries Bank. The southern extent of Area B consists of rock showing through
the seabed. There is a large area of sandwaves wavelength 100-300m over the bank. The
sandwaves are superimposed with ripples. There are areas of megaripples across the bank
ranging between 1-10m wavelength.
10.79 Area C is characterised largely by a featureless seabed. There are however areas of rock
emerging through the sediment to the south of this area. There is also a discrete area of patchy
coarse sediment adjacent to the rock outcrops to the west of the area. It has been noted that
there were no large targets seen on the digital records. A number of ‘pot buoy’ lines were
detected throughout the survey area with the majority located on the inshore side of Skerries
Bank and along the inshore rock outcrops. The areas are defined from the following location
plan of the survey lines:
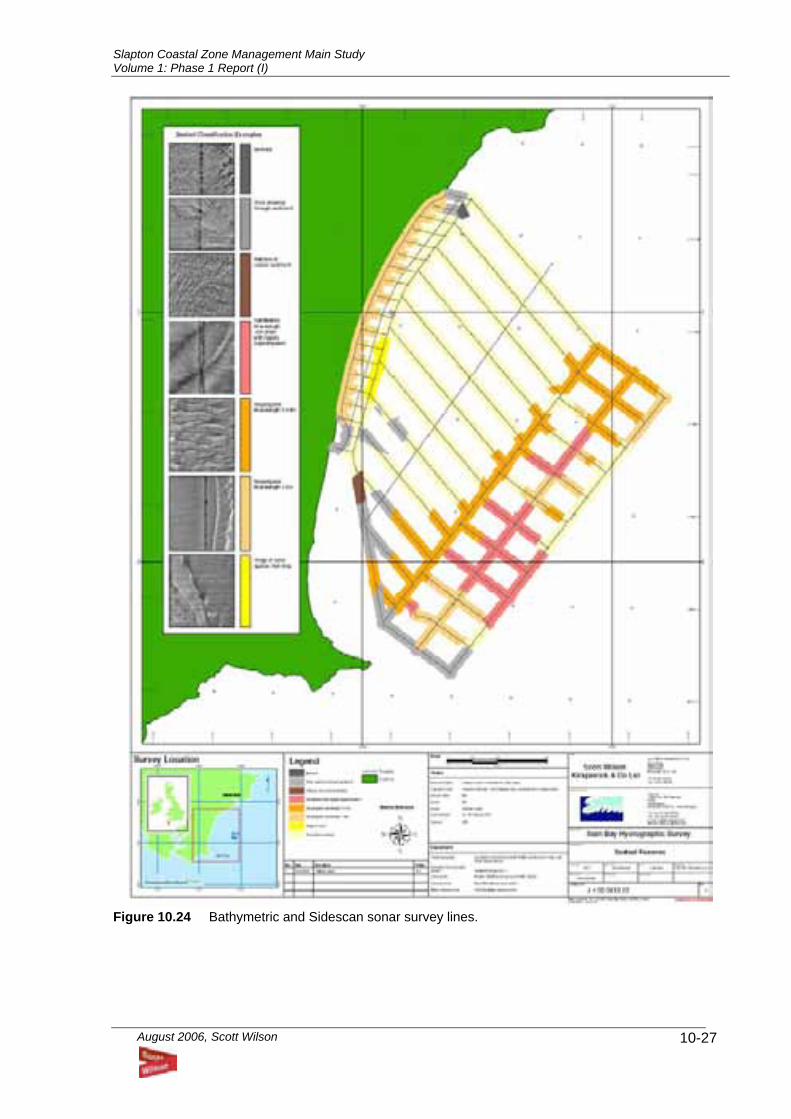
Slapton Coastal Zone Management Main Study Volume 1: Phase 1 Report (I)
August 2006, Scott Wilson
10-27
Figure 10.24 Bathymetric and Sidescan sonar survey lines.
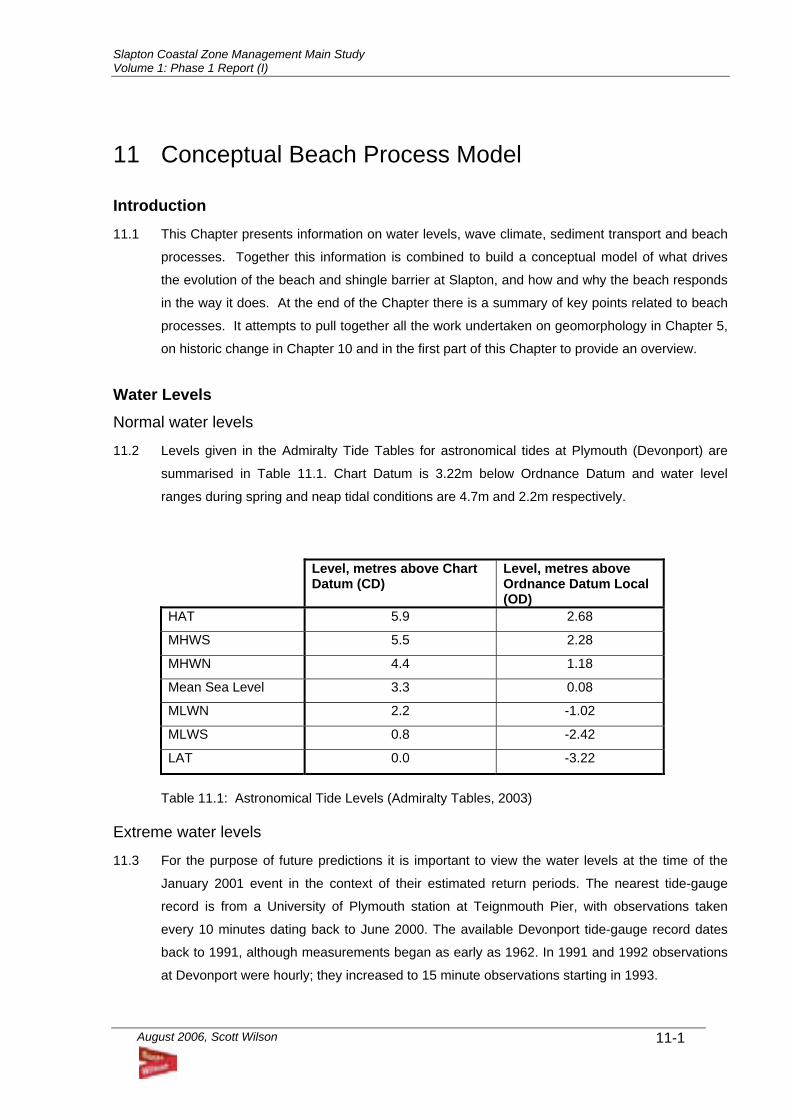
Slapton Coastal Zone Management Main Study Volume 1: Phase 1 Report (I)
August 2006, Scott Wilson
11-1
11 Conceptual Beach Process Model
Introduction 11.1 This Chapter presents information on water levels, wave climate, sediment transport and beach
processes. Together this information is combined to build a conceptual model of what drives
the evolution of the beach and shingle barrier at Slapton, and how and why the beach responds
in the way it does. At the end of the Chapter there is a summary of key points related to beach
processes. It attempts to pull together all the work undertaken on geomorphology in Chapter 5,
on historic change in Chapter 10 and in the first part of this Chapter to provide an overview.
Water Levels Normal water levels
11.2 Levels given in the Admiralty Tide Tables for astronomical tides at Plymouth (Devonport) are
summarised in Table 11.1. Chart Datum is 3.22m below Ordnance Datum and water level
ranges during spring and neap tidal conditions are 4.7m and 2.2m respectively.
Level, metres above Chart Datum (CD)
Level, metres above Ordnance Datum Local (OD)
HAT 5.9 2.68
MHWS 5.5 2.28
MHWN 4.4 1.18
Mean Sea Level 3.3 0.08
MLWN 2.2 -1.02
MLWS 0.8 -2.42
LAT 0.0 -3.22
Table 11.1: Astronomical Tide Levels (Admiralty Tables, 2003)
Extreme water levels
11.3 For the purpose of future predictions it is important to view the water levels at the time of the
January 2001 event in the context of their estimated return periods. The nearest tide-gauge
record is from a University of Plymouth station at Teignmouth Pier, with observations taken
every 10 minutes dating back to June 2000. The available Devonport tide-gauge record dates
back to 1991, although measurements began as early as 1962. In 1991 and 1992 observations
at Devonport were hourly; they increased to 15 minute observations starting in 1993.
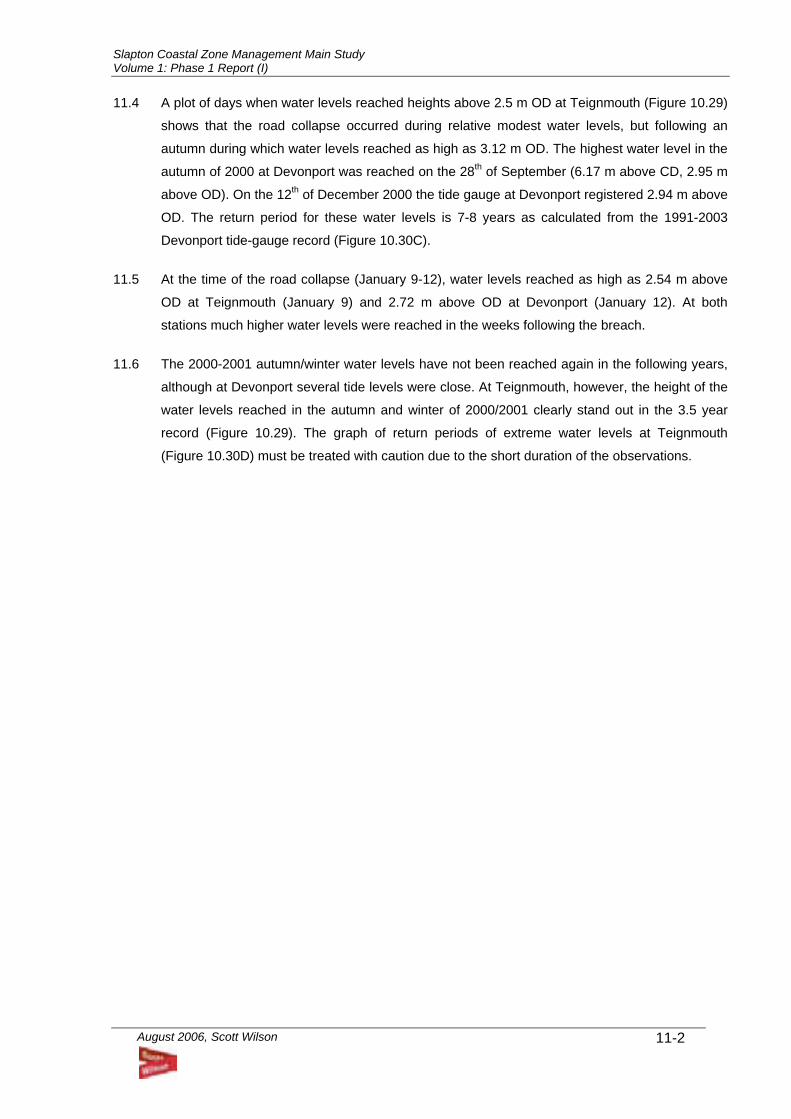
Slapton Coastal Zone Management Main Study Volume 1: Phase 1 Report (I)
August 2006, Scott Wilson
11-2
11.4 A plot of days when water levels reached heights above 2.5 m OD at Teignmouth (Figure 10.29)
shows that the road collapse occurred during relative modest water levels, but following an
autumn during which water levels reached as high as 3.12 m OD. The highest water level in the
autumn of 2000 at Devonport was reached on the 28th of September (6.17 m above CD, 2.95 m
above OD). On the 12th of December 2000 the tide gauge at Devonport registered 2.94 m above
OD. The return period for these water levels is 7-8 years as calculated from the 1991-2003
Devonport tide-gauge record (Figure 10.30C).
11.5 At the time of the road collapse (January 9-12), water levels reached as high as 2.54 m above
OD at Teignmouth (January 9) and 2.72 m above OD at Devonport (January 12). At both
stations much higher water levels were reached in the weeks following the breach.
11.6 The 2000-2001 autumn/winter water levels have not been reached again in the following years,
although at Devonport several tide levels were close. At Teignmouth, however, the height of the
water levels reached in the autumn and winter of 2000/2001 clearly stand out in the 3.5 year
record (Figure 10.29). The graph of return periods of extreme water levels at Teignmouth
(Figure 10.30D) must be treated with caution due to the short duration of the observations.
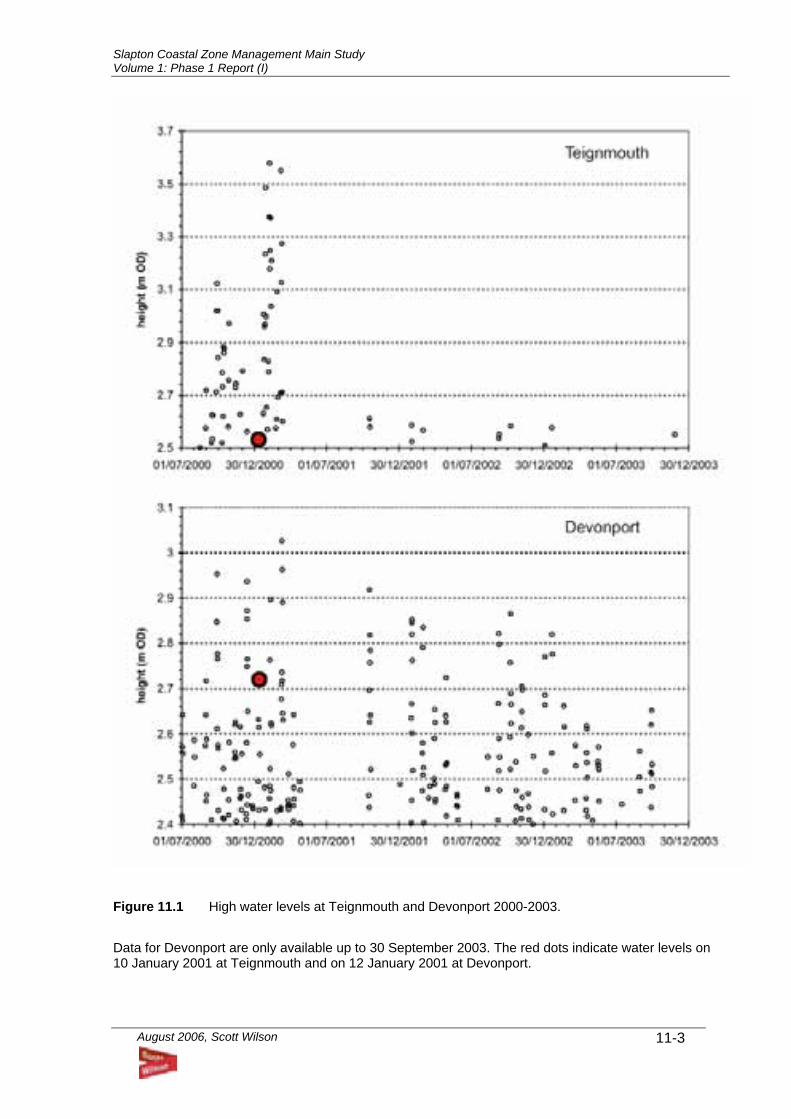
Slapton Coastal Zone Management Main Study Volume 1: Phase 1 Report (I)
August 2006, Scott Wilson
11-3
Figure 11.1 High water levels at Teignmouth and Devonport 2000-2003. Data for Devonport are only available up to 30 September 2003. The red dots indicate water levels on 10 January 2001 at Teignmouth and on 12 January 2001 at Devonport.
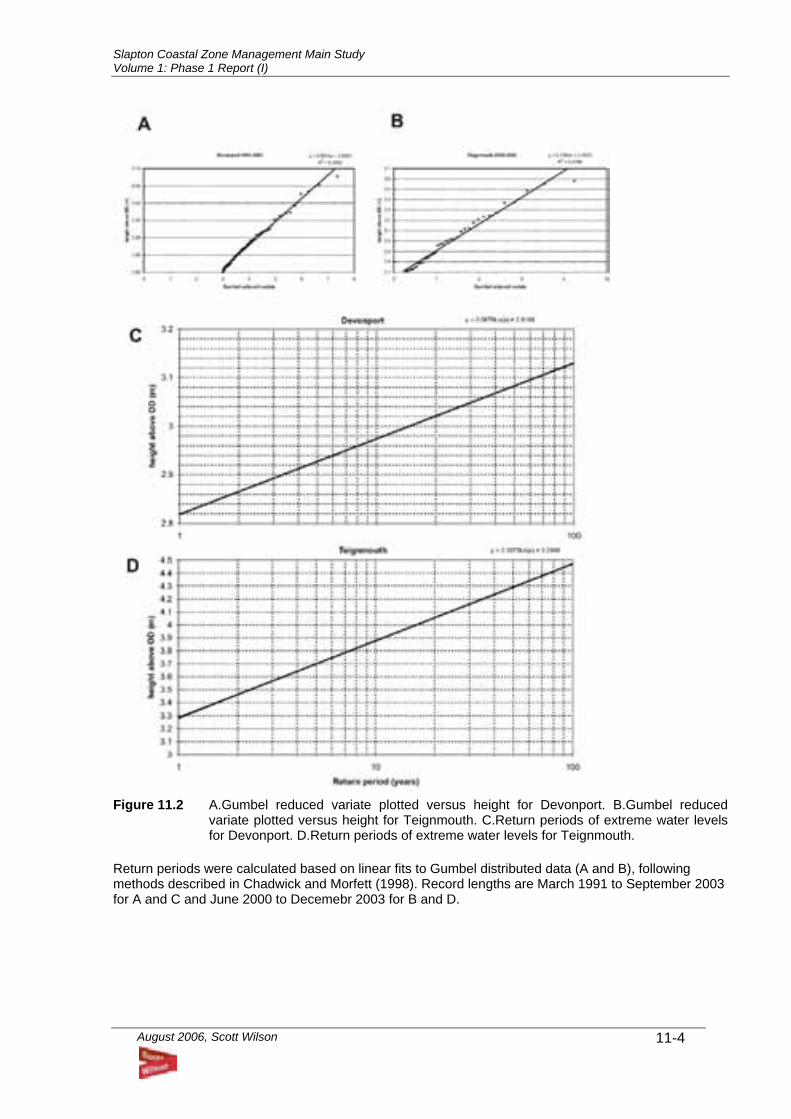
Slapton Coastal Zone Management Main Study Volume 1: Phase 1 Report (I)
August 2006, Scott Wilson
11-4
Figure 11.2 A.Gumbel reduced variate plotted versus height for Devonport. B.Gumbel reduced
variate plotted versus height for Teignmouth. C.Return periods of extreme water levels for Devonport. D.Return periods of extreme water levels for Teignmouth.
Return periods were calculated based on linear fits to Gumbel distributed data (A and B), following methods described in Chadwick and Morfett (1998). Record lengths are March 1991 to September 2003 for A and C and June 2000 to Decemebr 2003 for B and D.
Slapton Coastal Zone Management Main Study Volume 1: Phase 1 Report (I)
August 2006, Scott Wilson
11-5
Flood risk area and water levels
11.7 Water is discharged into the Ley from 3 rivers, the Gara River, Start River and Stokeley River.
The weir at the south of the Ley keeps the water height constant at 3.1mOD, this can become
blocked with overwashed shingle and during high flows in winter the level of the Ley can rise by
up to 1m. Therefore for the purpose of this calculation it is assumed that the level of the Ley at
its highest is 4m when the breach occurs.
11.8 The 200year water level used for a breach calculation is 3.2m OD (taken from the Shoreline
Management Plan). The extents of the flood risk area into which this water flowed, would
therefore be dependent on the level of the Ley at the time. If at its lower level of 3.1m the
maximum height the water in the Ley could rise to, would therefore be 3.2m OD, to equal the
level of the sea. However if the Ley was at its higher level of 4mOD, the water in the Ley would
be higher than the sea level and flow out over the breached bank. Therefore in a breach
situation the outline of the associated flood risk envelope would be no higher than the winter
limit of the Ley at 4mOD.
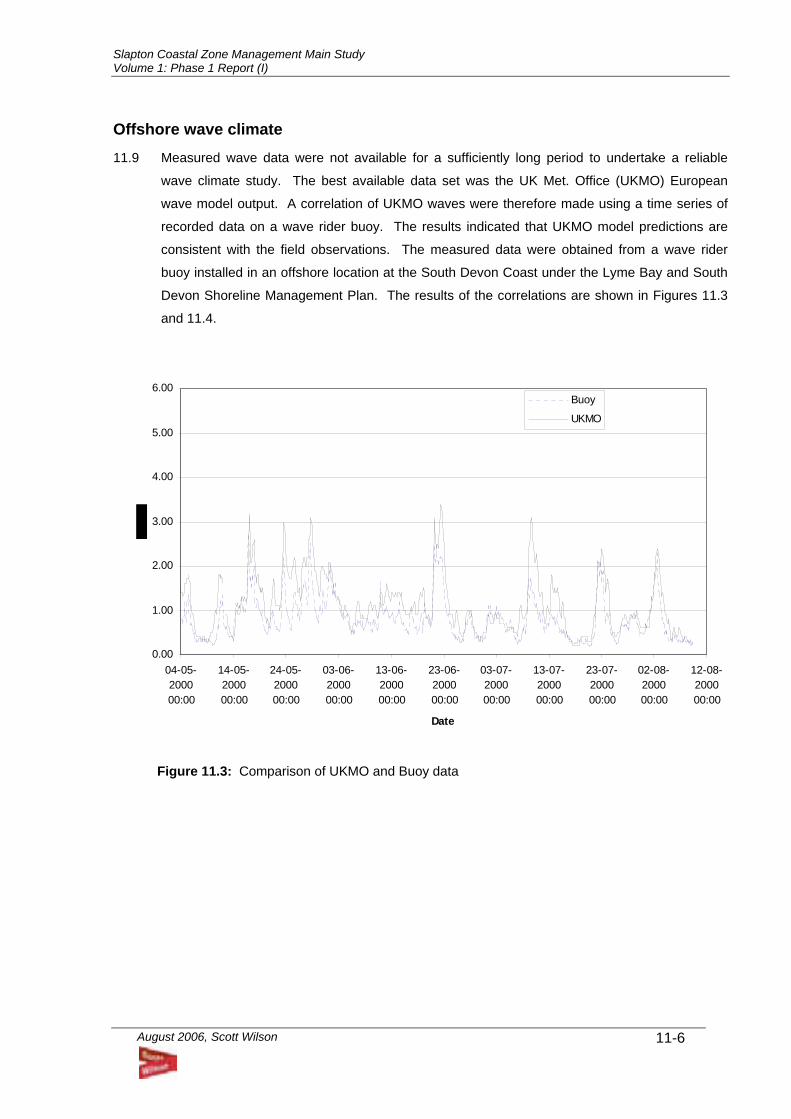
Slapton Coastal Zone Management Main Study Volume 1: Phase 1 Report (I)
August 2006, Scott Wilson
11-6
Offshore wave climate 11.9 Measured wave data were not available for a sufficiently long period to undertake a reliable
wave climate study. The best available data set was the UK Met. Office (UKMO) European
wave model output. A correlation of UKMO waves were therefore made using a time series of
recorded data on a wave rider buoy. The results indicated that UKMO model predictions are
consistent with the field observations. The measured data were obtained from a wave rider
buoy installed in an offshore location at the South Devon Coast under the Lyme Bay and South
Devon Shoreline Management Plan. The results of the correlations are shown in Figures 11.3
and 11.4.
0.00
1.00
2.00
3.00
4.00
5.00
6.00
04-05-200000:00
14-05-200000:00
24-05-200000:00
03-06-200000:00
13-06-200000:00
23-06-200000:00
03-07-200000:00
13-07-200000:00
23-07-200000:00
02-08-200000:00
12-08-200000:00
Date
Buoy
UKMO
Figure 11.3: Comparison of UKMO and Buoy data
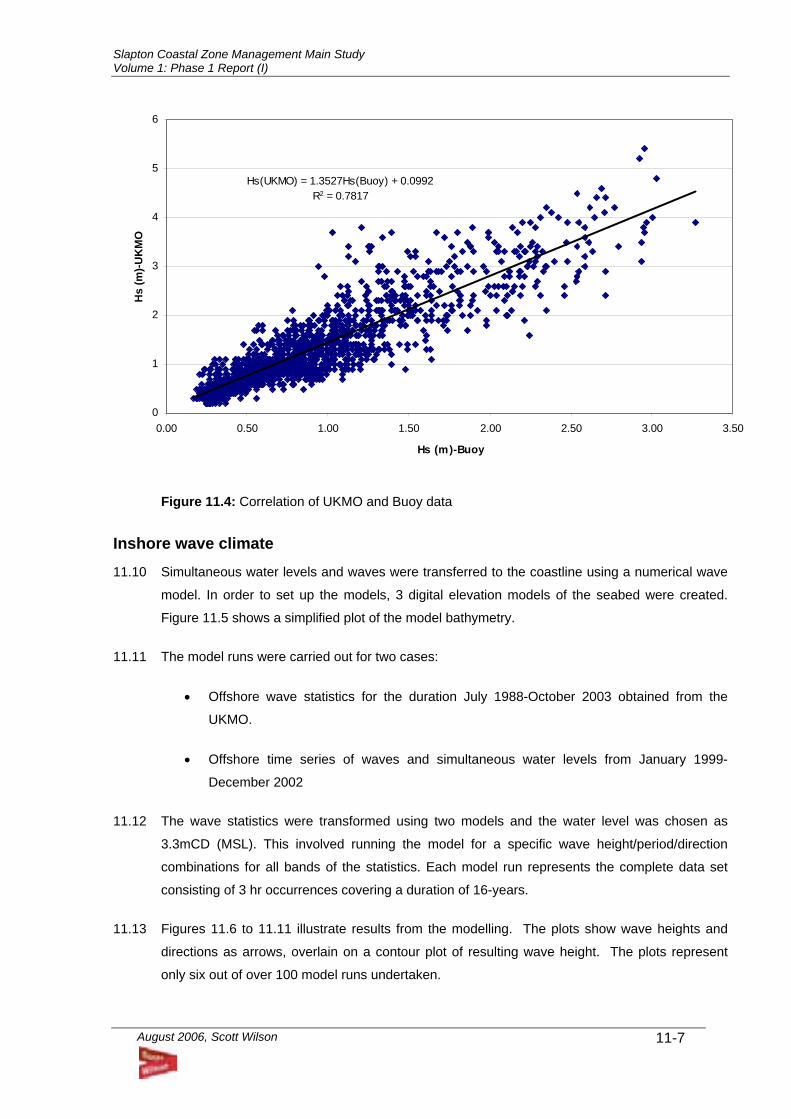
Slapton Coastal Zone Management Main Study Volume 1: Phase 1 Report (I)
August 2006, Scott Wilson
11-7
Hs(UKMO) = 1.3527Hs(Buoy) + 0.0992R2 = 0.7817
0
1
2
3
4
5
6
0.00 0.50 1.00 1.50 2.00 2.50 3.00 3.50
Hs (m)-Buoy
Hs
(m)-U
KM
O
Figure 11.4: Correlation of UKMO and Buoy data
Inshore wave climate 11.10 Simultaneous water levels and waves were transferred to the coastline using a numerical wave
model. In order to set up the models, 3 digital elevation models of the seabed were created.
Figure 11.5 shows a simplified plot of the model bathymetry.
11.11 The model runs were carried out for two cases:
• Offshore wave statistics for the duration July 1988-October 2003 obtained from the
UKMO.
• Offshore time series of waves and simultaneous water levels from January 1999-
December 2002
11.12 The wave statistics were transformed using two models and the water level was chosen as
3.3mCD (MSL). This involved running the model for a specific wave height/period/direction
combinations for all bands of the statistics. Each model run represents the complete data set
consisting of 3 hr occurrences covering a duration of 16-years.
11.13 Figures 11.6 to 11.11 illustrate results from the modelling. The plots show wave heights and
directions as arrows, overlain on a contour plot of resulting wave height. The plots represent
only six out of over 100 model runs undertaken.
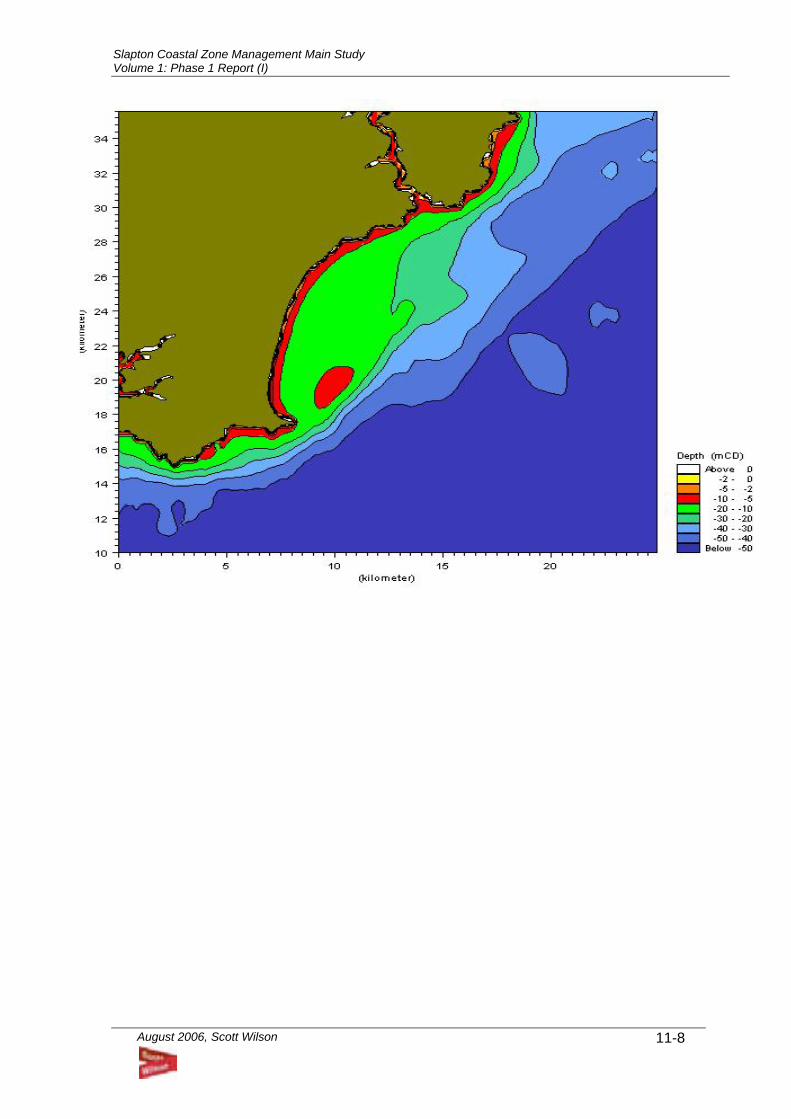
Slapton Coastal Zone Management Main Study Volume 1: Phase 1 Report (I)
August 2006, Scott Wilson
11-8
Figure 4.1 : Model bathymetry Figure 11.5: Wave model bathymetry
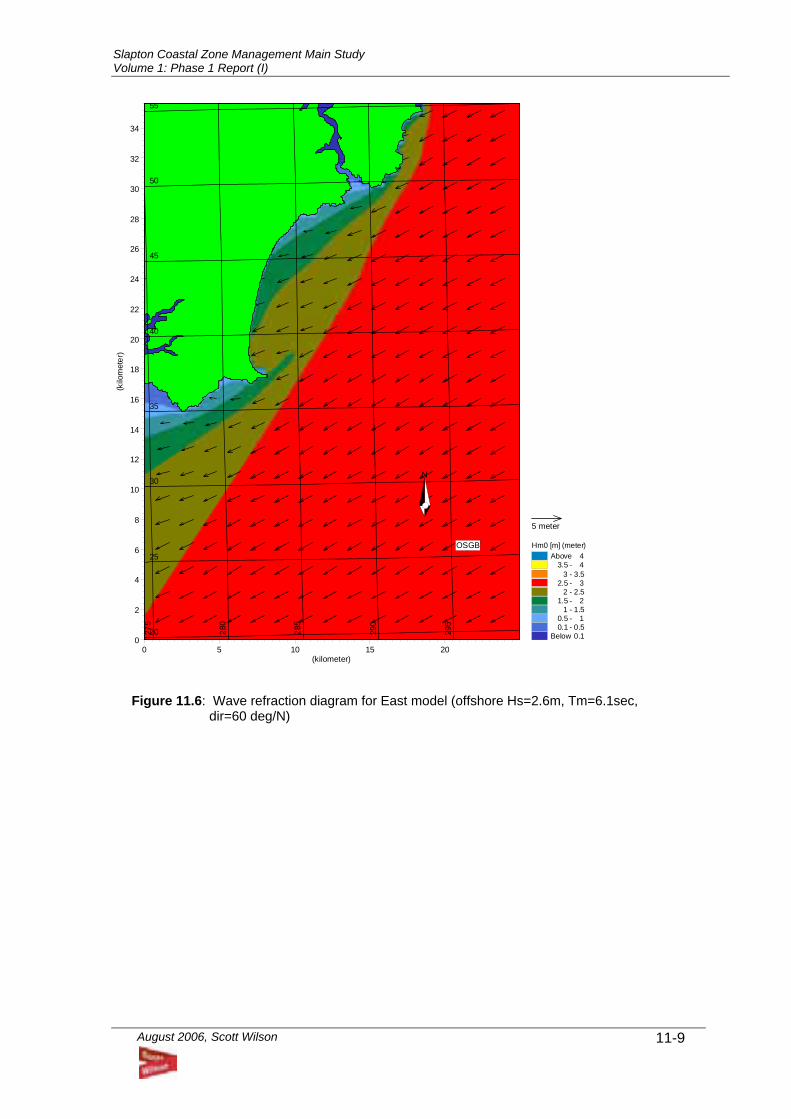
Slapton Coastal Zone Management Main Study Volume 1: Phase 1 Report (I)
August 2006, Scott Wilson
11-9
5 meter
Hm0 [m] (meter)Above 4
3.5 - 43 - 3.5
2.5 - 32 - 2.5
1.5 - 21 - 1.5
0.5 - 10.1 - 0.5
Below 0.1 275
280
285
290
295 20
25
30
35
40
45
50
55
OSGB
N
0 5 10 15 20(kilometer)
0
2
4
6
8
10
12
14
16
18
20
22
24
26
28
30
32
34(k
ilom
eter
)
Figure 11.6: Wave refraction diagram for East model (offshore Hs=2.6m, Tm=6.1sec, dir=60 deg/N)
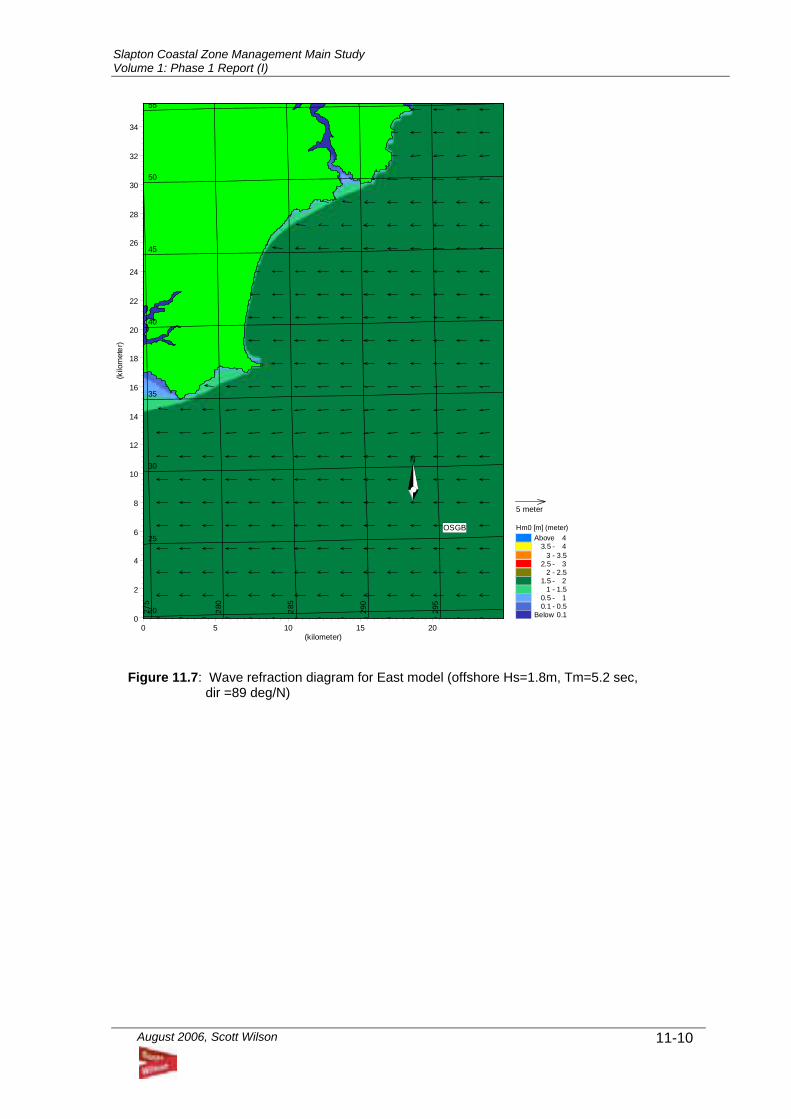
Slapton Coastal Zone Management Main Study Volume 1: Phase 1 Report (I)
August 2006, Scott Wilson
11-10
5 meter
Hm0 [m] (meter)Above 4
3.5 - 43 - 3.5
2.5 - 32 - 2.5
1.5 - 21 - 1.5
0.5 - 10.1 - 0.5
Below 0.1 275
280
285
290
295 20
25
30
35
40
45
50
55
OSGB
N
0 5 10 15 20(kilometer)
0
2
4
6
8
10
12
14
16
18
20
22
24
26
28
30
32
34(k
ilom
eter
)
Figure 11.7: Wave refraction diagram for East model (offshore Hs=1.8m, Tm=5.2 sec, dir =89 deg/N)
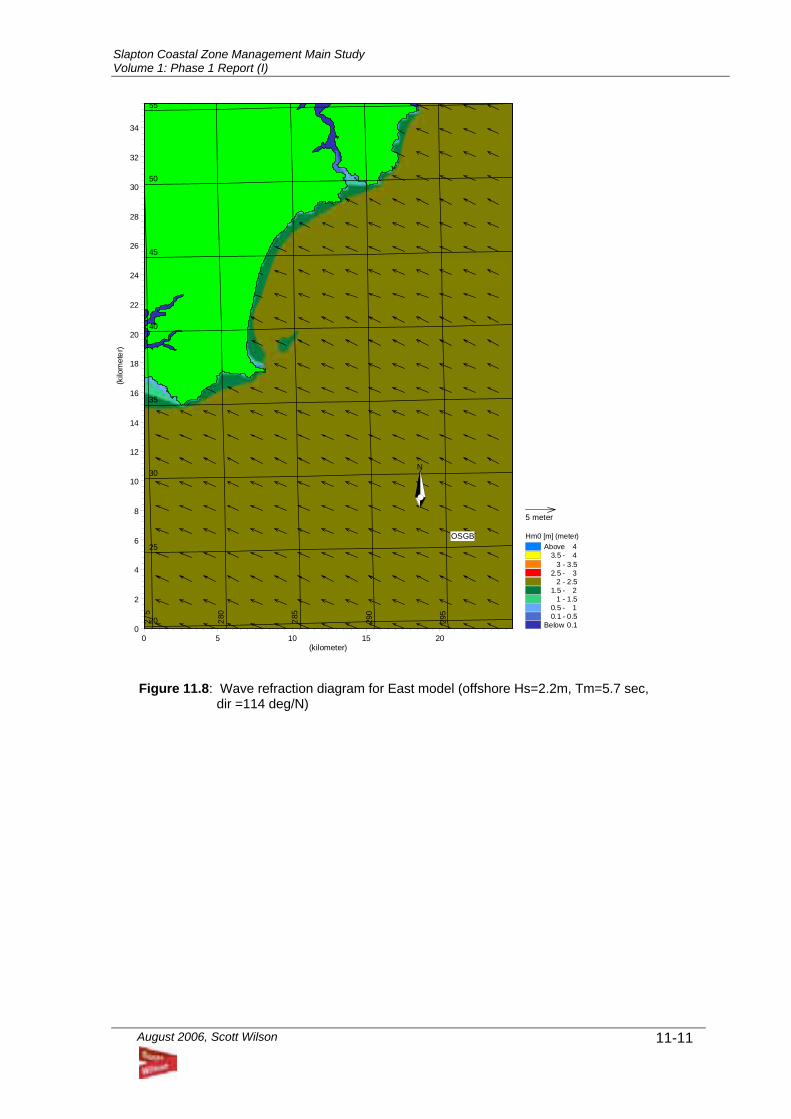
Slapton Coastal Zone Management Main Study Volume 1: Phase 1 Report (I)
August 2006, Scott Wilson
11-11
5 meter
Hm0 [m] (meter)Above 4
3.5 - 43 - 3.5
2.5 - 32 - 2.5
1.5 - 21 - 1.5
0.5 - 10.1 - 0.5
Below 0.1 275
280
285
290
295 20
25
30
35
40
45
50
55
OSGB
N
0 5 10 15 20(kilometer)
0
2
4
6
8
10
12
14
16
18
20
22
24
26
28
30
32
34(k
ilom
eter
)
Figure 11.8: Wave refraction diagram for East model (offshore Hs=2.2m, Tm=5.7 sec, dir =114 deg/N)
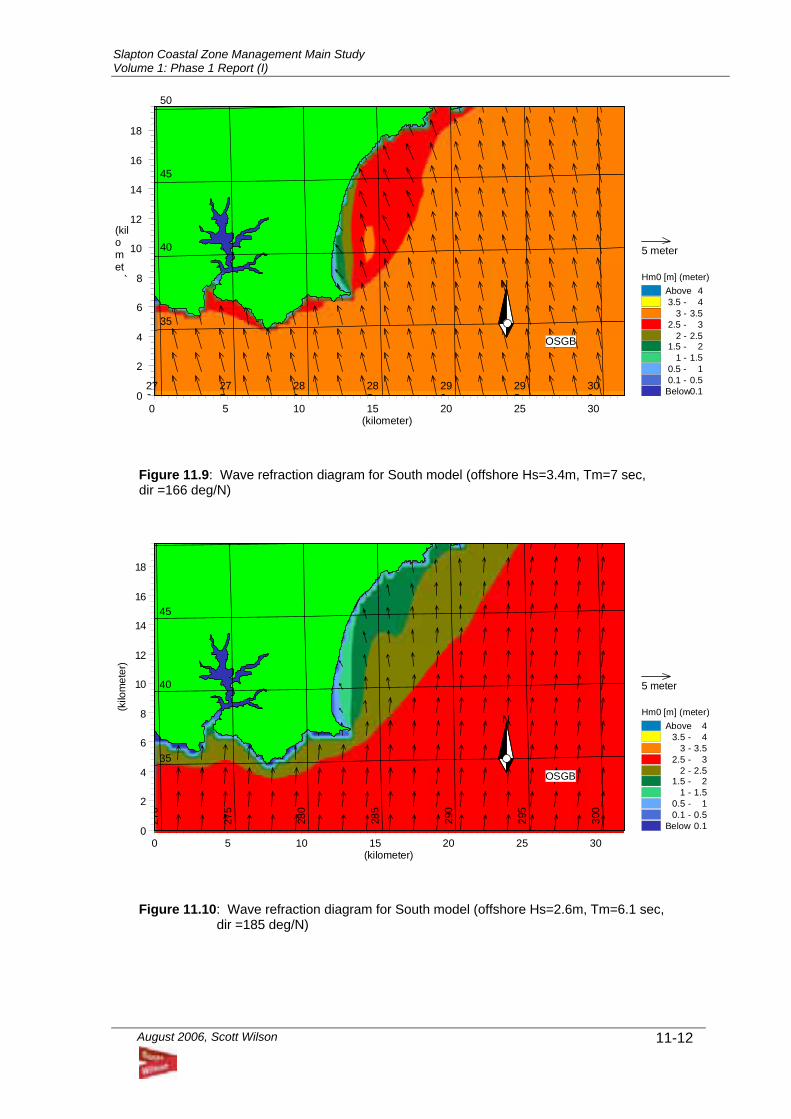
Slapton Coastal Zone Management Main Study Volume 1: Phase 1 Report (I)
August 2006, Scott Wilson
11-12
5 meter
Hm0 [m] (meter)Above 43.5 - 4
3 - 3.52.5 - 3
2 - 2.51.5 - 2
1 - 1.50.5 - 10.1 - 0.5Below 0.1
270
275
280
285
290
295
300
35
40
45
50
OSGB
N
0 5 10 15 20 25 30 (kilometer)
0
2
4
6
8
10
12
14
16
18
(kilometer)
Figure 11.9: Wave refraction diagram for South model (offshore Hs=3.4m, Tm=7 sec, dir =166 deg/N)
5 meter
Hm0 [m] (meter)Above 4
3.5 - 43 - 3.5
2.5 - 32 - 2.5
1.5 - 21 - 1.5
0.5 - 10.1 - 0.5
Below 0.1 270
275
280
285
290
295
300
35
40
45
OSGB
N
0 5 10 15 20 25 30(kilometer)
0
2
4
6
8
10
12
14
16
18
(kilo
met
er)
Figure 11.10: Wave refraction diagram for South model (offshore Hs=2.6m, Tm=6.1 sec, dir =185 deg/N)
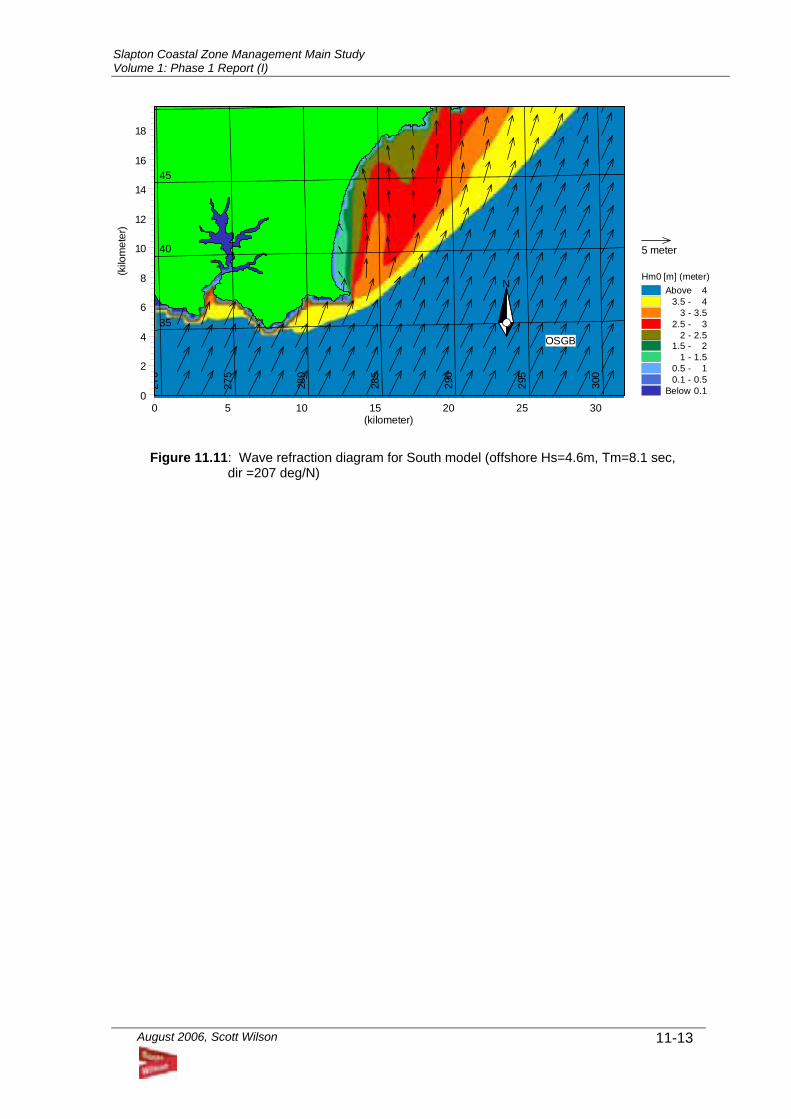
Slapton Coastal Zone Management Main Study Volume 1: Phase 1 Report (I)
August 2006, Scott Wilson
11-13
5 meter
Hm0 [m] (meter)Above 4
3.5 - 43 - 3.5
2.5 - 32 - 2.5
1.5 - 21 - 1.5
0.5 - 10.1 - 0.5
Below 0.1 270
275
280
285
290
295
300
35
40
45
OSGB
N
0 5 10 15 20 25 30(kilometer)
0
2
4
6
8
10
12
14
16
18(k
ilom
eter
)
Figure 11.11: Wave refraction diagram for South model (offshore Hs=4.6m, Tm=8.1 sec, dir =207 deg/N)
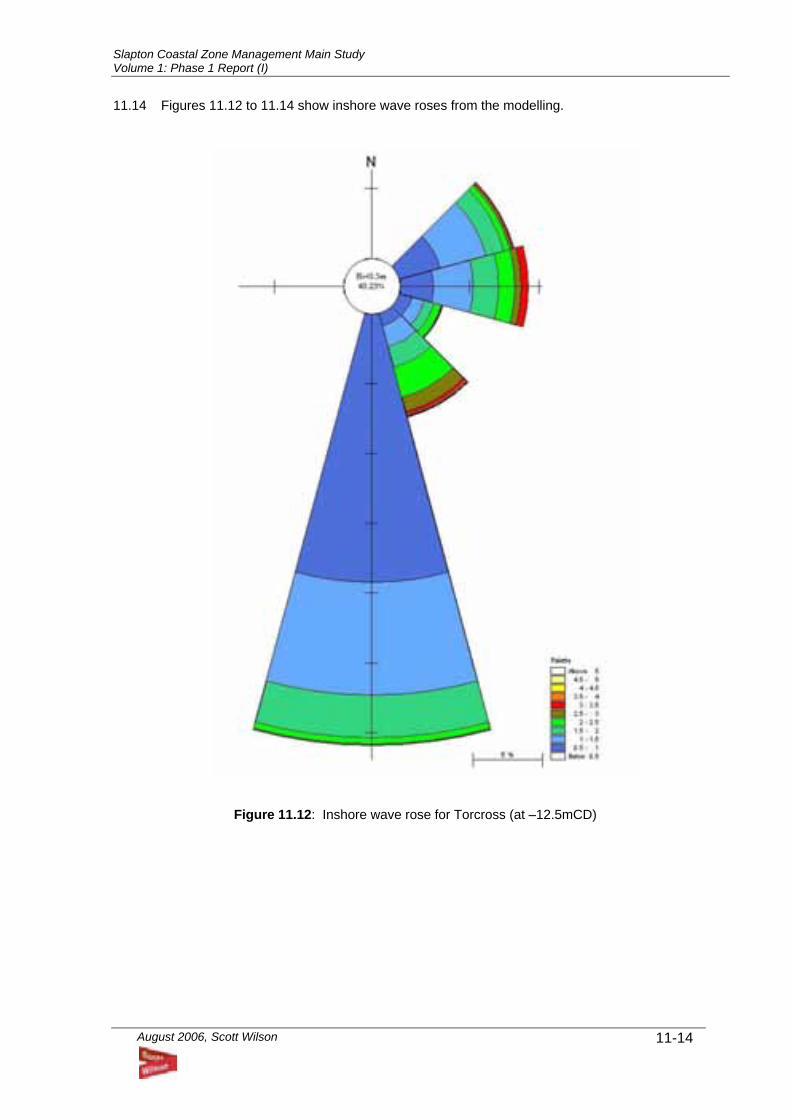
Slapton Coastal Zone Management Main Study Volume 1: Phase 1 Report (I)
August 2006, Scott Wilson
11-14
11.14 Figures 11.12 to 11.14 show inshore wave roses from the modelling.
Figure 11.12: Inshore wave rose for Torcross (at –12.5mCD)
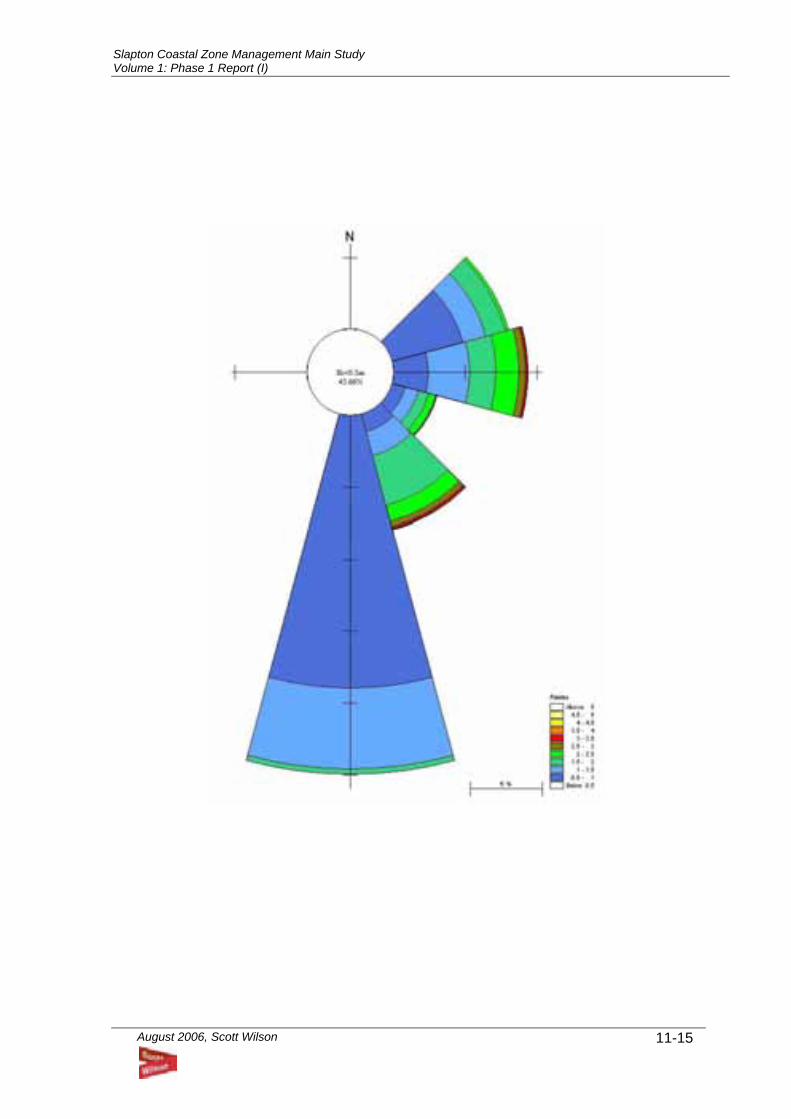
Slapton Coastal Zone Management Main Study Volume 1: Phase 1 Report (I)
August 2006, Scott Wilson
11-15
Figure 11.13. : Inshore wave rose for Slapton Ley (at -14.3mCD)
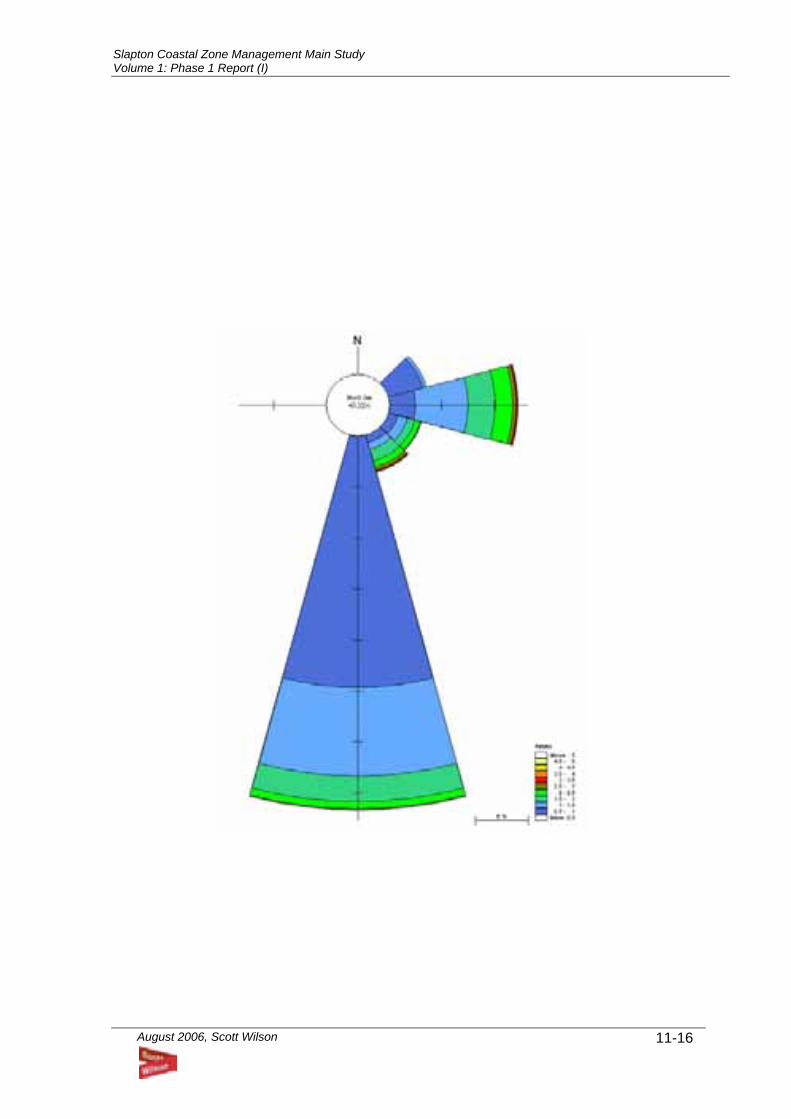
Slapton Coastal Zone Management Main Study Volume 1: Phase 1 Report (I)
August 2006, Scott Wilson
11-16
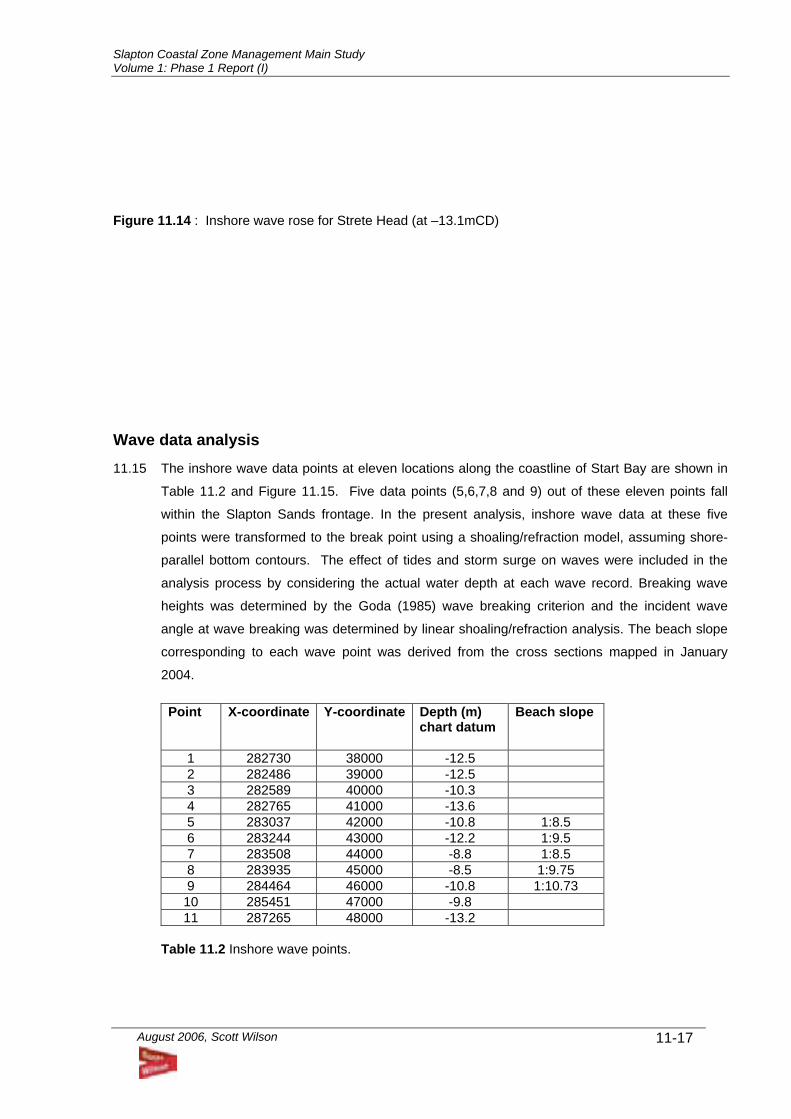
Slapton Coastal Zone Management Main Study Volume 1: Phase 1 Report (I)
August 2006, Scott Wilson
11-17
Figure 11.14 : Inshore wave rose for Strete Head (at –13.1mCD)
Wave data analysis 11.15 The inshore wave data points at eleven locations along the coastline of Start Bay are shown in
Table 11.2 and Figure 11.15. Five data points (5,6,7,8 and 9) out of these eleven points fall
within the Slapton Sands frontage. In the present analysis, inshore wave data at these five
points were transformed to the break point using a shoaling/refraction model, assuming shore-
parallel bottom contours. The effect of tides and storm surge on waves were included in the
analysis process by considering the actual water depth at each wave record. Breaking wave
heights was determined by the Goda (1985) wave breaking criterion and the incident wave
angle at wave breaking was determined by linear shoaling/refraction analysis. The beach slope
corresponding to each wave point was derived from the cross sections mapped in January
2004.
Point X-coordinate Y-coordinate Depth (m) chart datum
Beach slope
1 282730 38000 -12.5 2 282486 39000 -12.5 3 282589 40000 -10.3 4 282765 41000 -13.6 5 283037 42000 -10.8 1:8.5 6 283244 43000 -12.2 1:9.5 7 283508 44000 -8.8 1:8.5 8 283935 45000 -8.5 1:9.75 9 284464 46000 -10.8 1:10.73 10 285451 47000 -9.8 11 287265 48000 -13.2
Table 11.2 Inshore wave points.
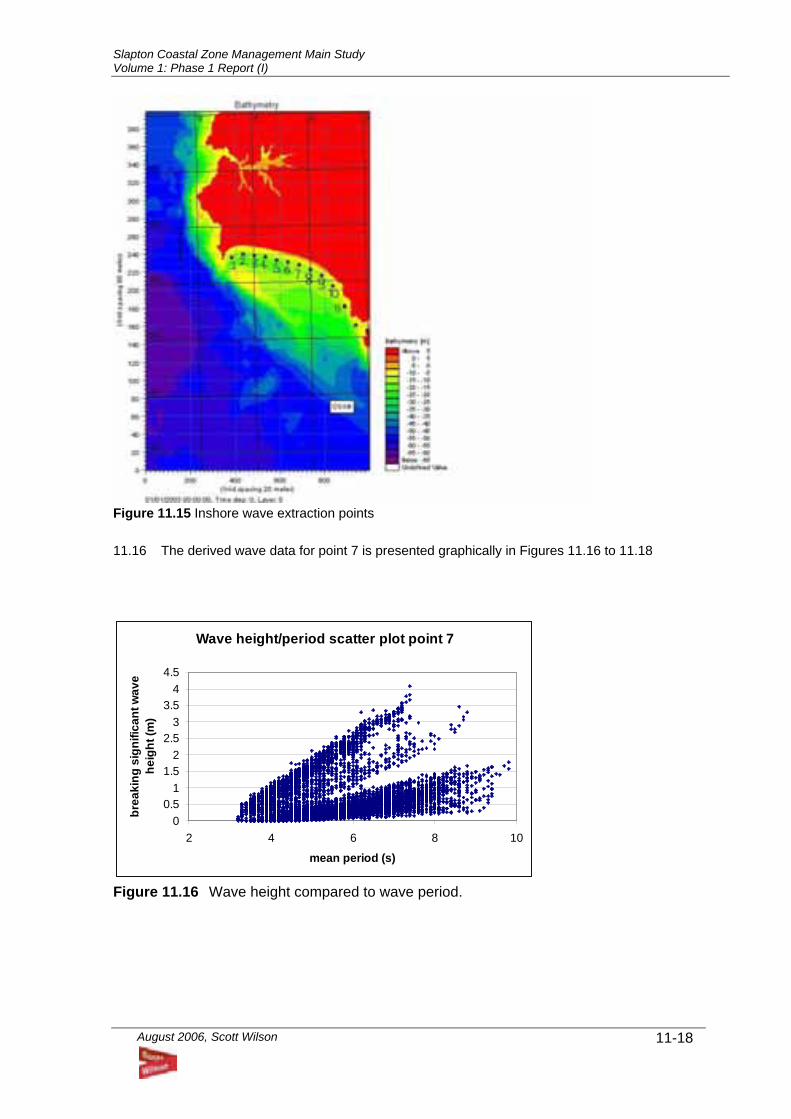
Slapton Coastal Zone Management Main Study Volume 1: Phase 1 Report (I)
August 2006, Scott Wilson
11-18
Figure 11.15 Inshore wave extraction points 11.16 The derived wave data for point 7 is presented graphically in Figures 11.16 to 11.18
Wave height/period scatter plot point 7
00.5
11.5
22.5
33.5
44.5
2 4 6 8 10
mean period (s)
brea
king
sig
nific
ant w
ave
heig
ht (m
)
Figure 11.16 Wave height compared to wave period.
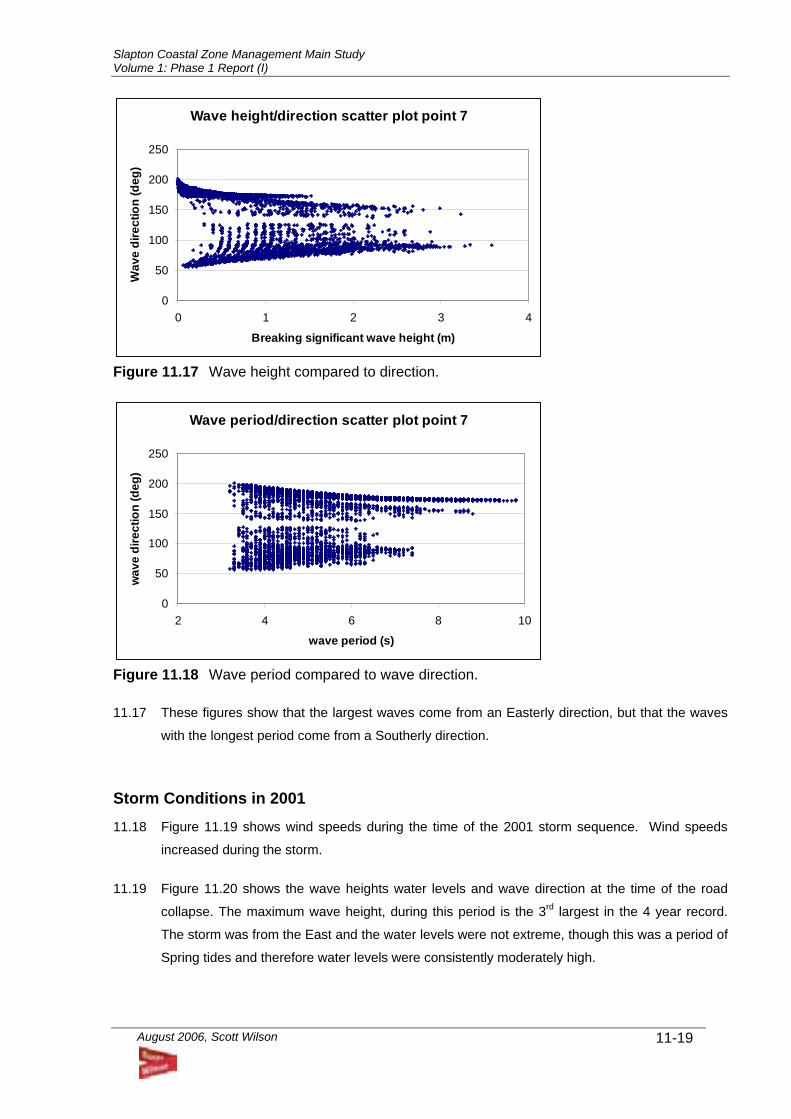
Slapton Coastal Zone Management Main Study Volume 1: Phase 1 Report (I)
August 2006, Scott Wilson
11-19
Wave height/direction scatter plot point 7
0
50
100
150
200
250
0 1 2 3 4
Breaking significant wave height (m)
Wav
e di
rect
ion
(deg
)
Figure 11.17 Wave height compared to direction.
Wave period/direction scatter plot point 7
0
50
100
150
200
250
2 4 6 8 10
wave period (s)
wav
e di
rect
ion
(deg
)
Figure 11.18 Wave period compared to wave direction. 11.17 These figures show that the largest waves come from an Easterly direction, but that the waves
with the longest period come from a Southerly direction.
Storm Conditions in 2001 11.18 Figure 11.19 shows wind speeds during the time of the 2001 storm sequence. Wind speeds
increased during the storm.
11.19 Figure 11.20 shows the wave heights water levels and wave direction at the time of the road
collapse. The maximum wave height, during this period is the 3rd largest in the 4 year record.
The storm was from the East and the water levels were not extreme, though this was a period of
Spring tides and therefore water levels were consistently moderately high.
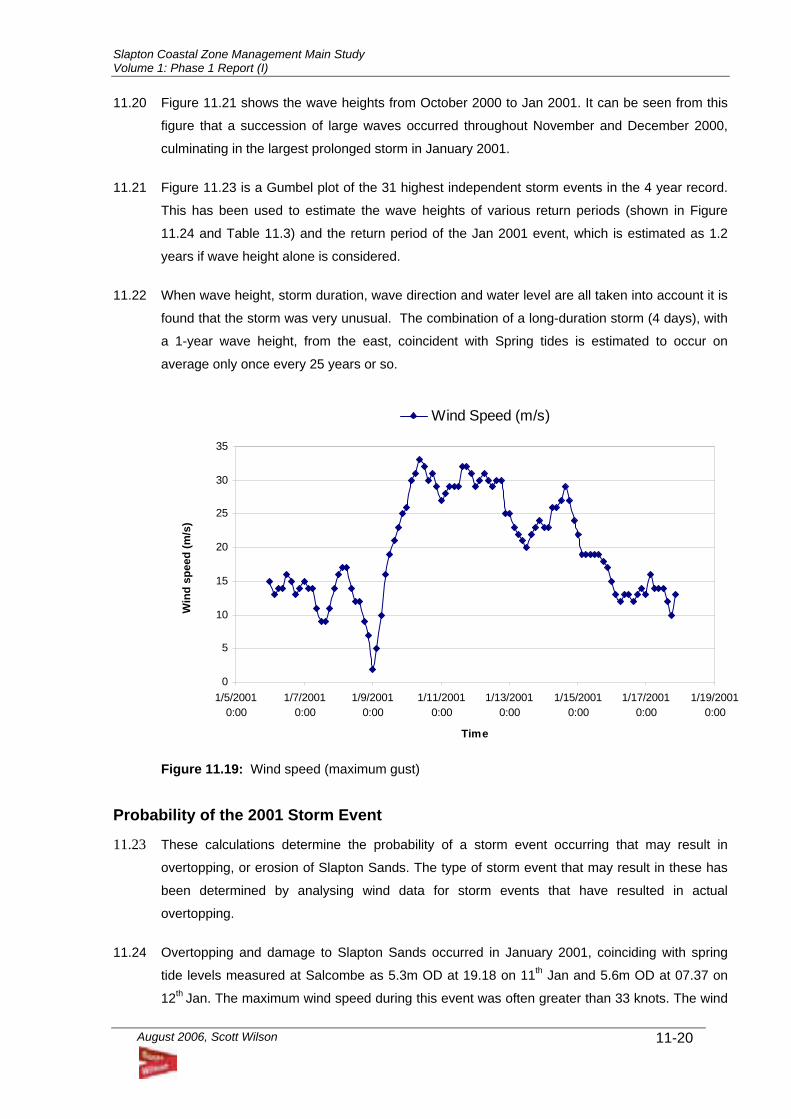
Slapton Coastal Zone Management Main Study Volume 1: Phase 1 Report (I)
August 2006, Scott Wilson
11-20
11.20 Figure 11.21 shows the wave heights from October 2000 to Jan 2001. It can be seen from this
figure that a succession of large waves occurred throughout November and December 2000,
culminating in the largest prolonged storm in January 2001.
11.21 Figure 11.23 is a Gumbel plot of the 31 highest independent storm events in the 4 year record.
This has been used to estimate the wave heights of various return periods (shown in Figure
11.24 and Table 11.3) and the return period of the Jan 2001 event, which is estimated as 1.2
years if wave height alone is considered.
11.22 When wave height, storm duration, wave direction and water level are all taken into account it is
found that the storm was very unusual. The combination of a long-duration storm (4 days), with
a 1-year wave height, from the east, coincident with Spring tides is estimated to occur on
average only once every 25 years or so.
0
5
10
15
20
25
30
35
1/5/20010:00
1/7/20010:00
1/9/20010:00
1/11/20010:00
1/13/20010:00
1/15/20010:00
1/17/20010:00
1/19/20010:00
Time
Win
d sp
eed
(m/s
)
Wind Speed (m/s)
Figure 11.19: Wind speed (maximum gust)
Probability of the 2001 Storm Event
11.23 These calculations determine the probability of a storm event occurring that may result in
overtopping, or erosion of Slapton Sands. The type of storm event that may result in these has
been determined by analysing wind data for storm events that have resulted in actual
overtopping.
11.24 Overtopping and damage to Slapton Sands occurred in January 2001, coinciding with spring
tide levels measured at Salcombe as 5.3m OD at 19.18 on 11th Jan and 5.6m OD at 07.37 on
12th Jan. The maximum wind speed during this event was often greater than 33 knots. The wind
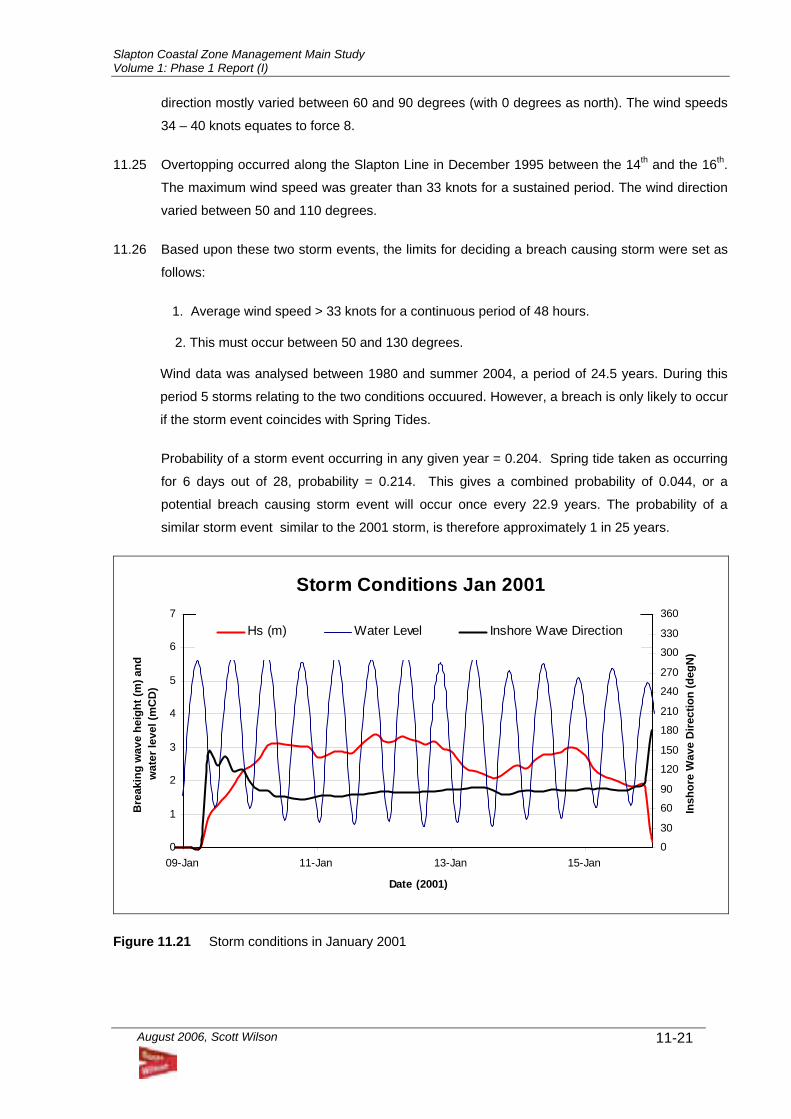
Slapton Coastal Zone Management Main Study Volume 1: Phase 1 Report (I)
August 2006, Scott Wilson
11-21
direction mostly varied between 60 and 90 degrees (with 0 degrees as north). The wind speeds
34 – 40 knots equates to force 8.
11.25 Overtopping occurred along the Slapton Line in December 1995 between the 14th and the 16th.
The maximum wind speed was greater than 33 knots for a sustained period. The wind direction
varied between 50 and 110 degrees.
11.26 Based upon these two storm events, the limits for deciding a breach causing storm were set as
follows:
1. Average wind speed > 33 knots for a continuous period of 48 hours.
2. This must occur between 50 and 130 degrees.
Wind data was analysed between 1980 and summer 2004, a period of 24.5 years. During this
period 5 storms relating to the two conditions occuured. However, a breach is only likely to occur
if the storm event coincides with Spring Tides.
Probability of a storm event occurring in any given year = 0.204. Spring tide taken as occurring
for 6 days out of 28, probability = 0.214. This gives a combined probability of 0.044, or a
potential breach causing storm event will occur once every 22.9 years. The probability of a
similar storm event similar to the 2001 storm, is therefore approximately 1 in 25 years.
Storm Conditions Jan 2001
0
1
2
3
4
5
6
7
09-Jan 11-Jan 13-Jan 15-Jan
Date (2001)
Bre
akin
g w
ave
heig
ht (m
) and
w
ater
leve
l (m
CD
)
0
30
60
90
120
150
180
210
240
270
300
330
360
Insh
ore
Wav
e D
irect
ion
(deg
N)
Hs (m) Water Level Inshore Wave Direction
Figure 11.21 Storm conditions in January 2001
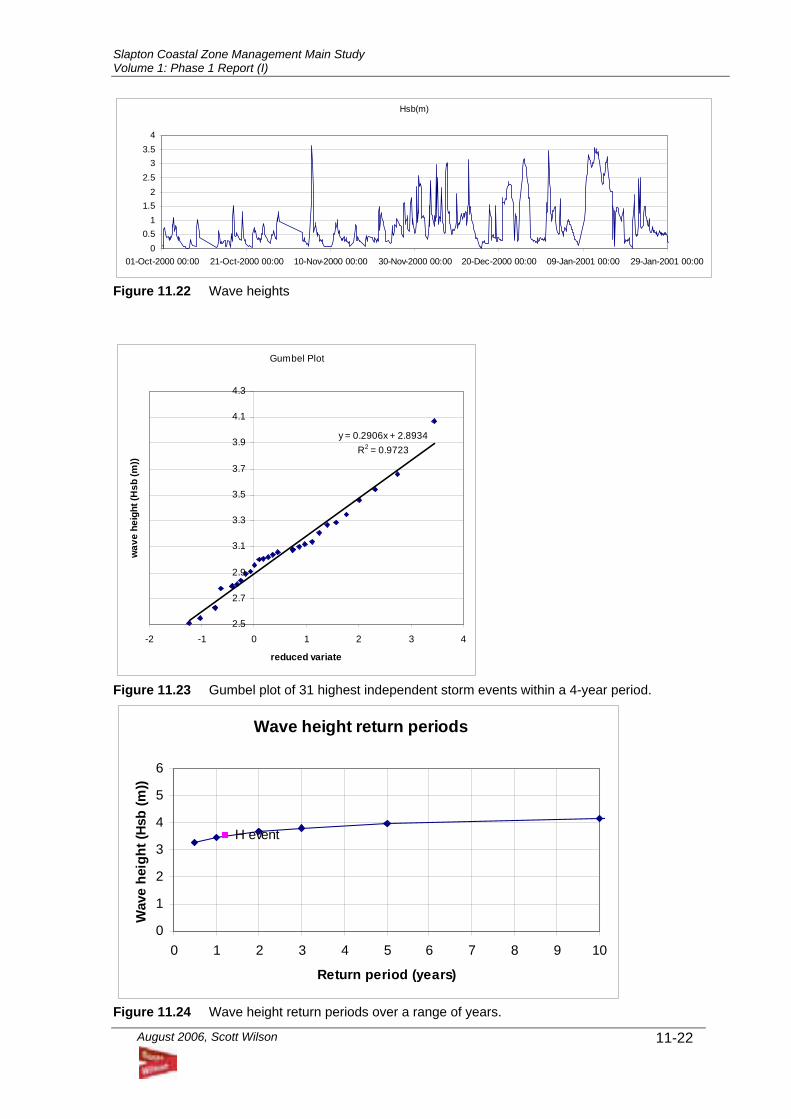
Slapton Coastal Zone Management Main Study Volume 1: Phase 1 Report (I)
August 2006, Scott Wilson
11-22
Hsb(m)
00.5
11.5
22.5
33.5
4
01-Oct-2000 00:00 21-Oct-2000 00:00 10-Nov-2000 00:00 30-Nov-2000 00:00 20-Dec-2000 00:00 09-Jan-2001 00:00 29-Jan-2001 00:00
Figure 11.22 Wave heights
Gumbel Plot
y = 0.2906x + 2.8934R2 = 0.9723
2.5
2.7
2.9
3.1
3.3
3.5
3.7
3.9
4.1
4.3
-2 -1 0 1 2 3 4
reduced variate
wav
e he
ight
(Hsb
(m))
Figure 11.23 Gumbel plot of 31 highest independent storm events within a 4-year period.
Wave height return periods
H event
0
1
2
3
4
5
6
0 1 2 3 4 5 6 7 8 9 10
Return period (years)
Wav
e he
ight
(Hsb
(m))
Figure 11.24 Wave height return periods over a range of years.
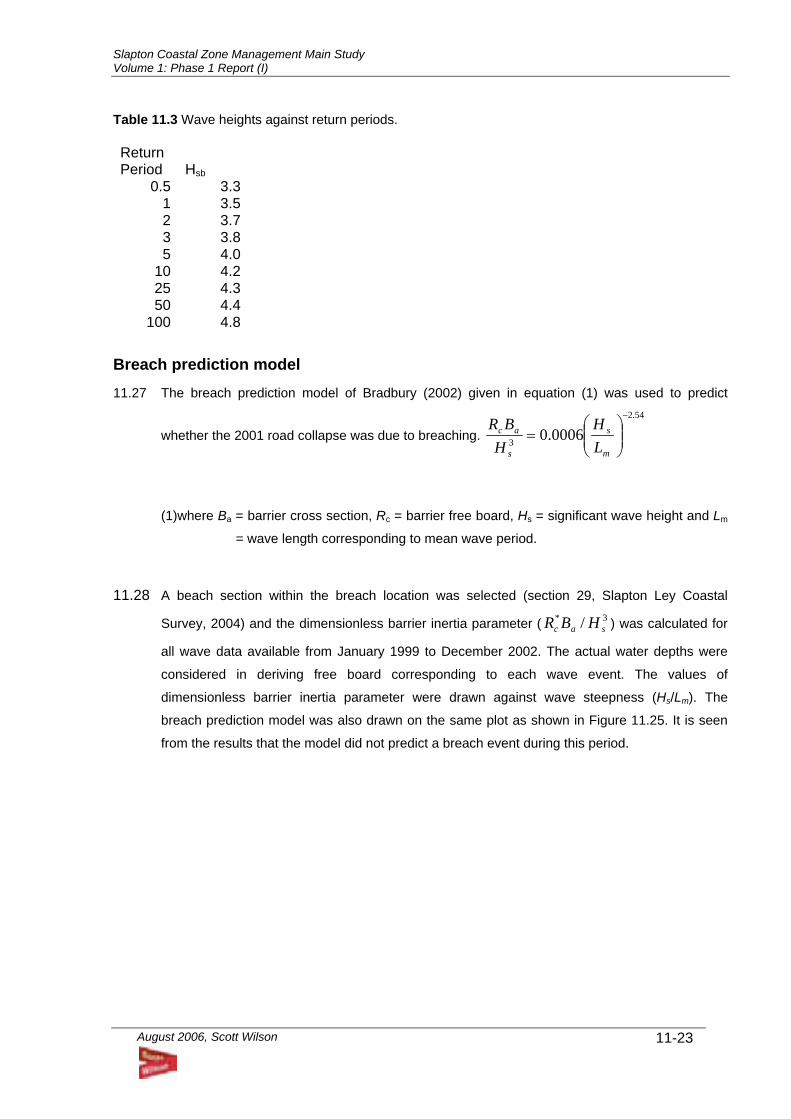
Slapton Coastal Zone Management Main Study Volume 1: Phase 1 Report (I)
August 2006, Scott Wilson
11-23
Table 11.3 Wave heights against return periods. Return Period Hsb
0.5 3.31 3.52 3.73 3.85 4.0
10 4.225 4.350 4.4
100 4.8
Breach prediction model 11.27 The breach prediction model of Bradbury (2002) given in equation (1) was used to predict
whether the 2001 road collapse was due to breaching. 54.2
3 0006.0−
⎟⎟⎠
⎞⎜⎜⎝
⎛=
m
s
s
ac
LH
HBR
(1)where Ba = barrier cross section, Rc = barrier free board, Hs = significant wave height and Lm
= wave length corresponding to mean wave period.
11.28 A beach section within the breach location was selected (section 29, Slapton Ley Coastal
Survey, 2004) and the dimensionless barrier inertia parameter ( 3* / sac HBR ) was calculated for
all wave data available from January 1999 to December 2002. The actual water depths were
considered in deriving free board corresponding to each wave event. The values of
dimensionless barrier inertia parameter were drawn against wave steepness (Hs/Lm). The
breach prediction model was also drawn on the same plot as shown in Figure 11.25. It is seen
from the results that the model did not predict a breach event during this period.
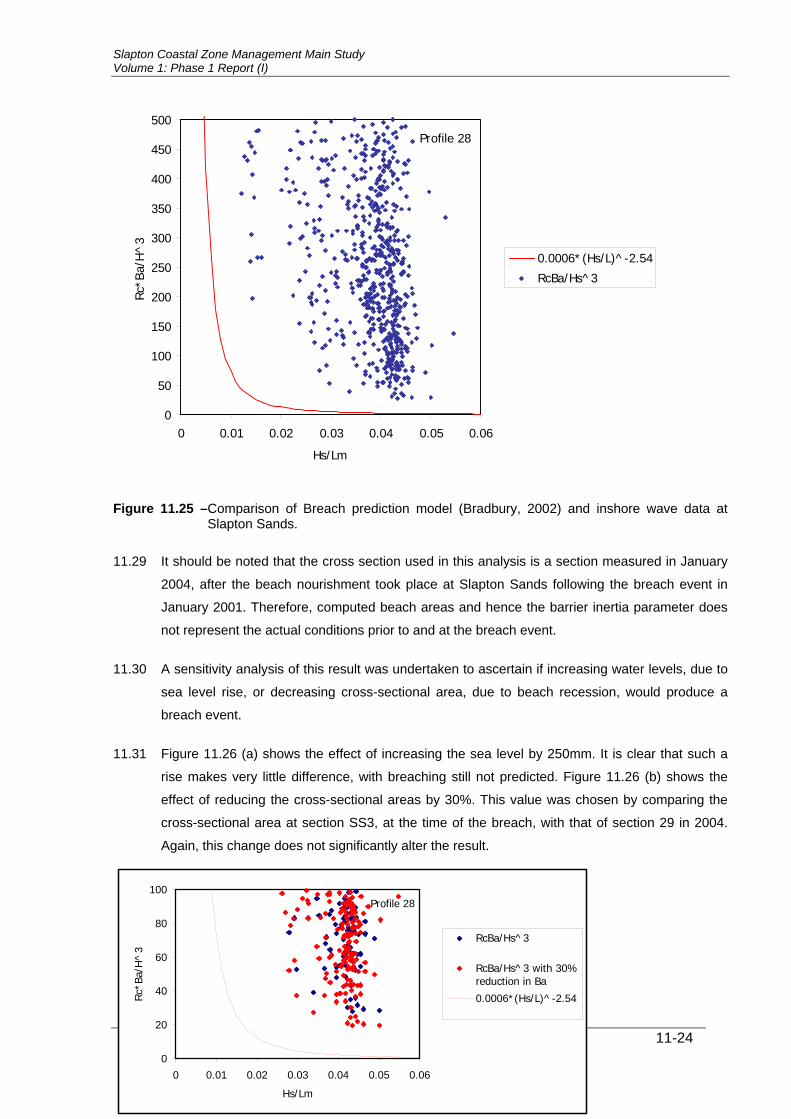
Slapton Coastal Zone Management Main Study Volume 1: Phase 1 Report (I)
August 2006, Scott Wilson
11-240
20
40
60
80
100
0 0.01 0.02 0.03 0.04 0.05 0.06
Hs/Lm
Rc*
Ba/H
^3
RcBa/Hs^3
RcBa/Hs^3 with 30%reduction in Ba
0.0006*(Hs/L)^-2.54
Profile 28
0
50
100
150
200
250
300
350
400
450
500
0 0.01 0.02 0.03 0.04 0.05 0.06
Hs/Lm
Rc*B
a/H
^3
0.0006*(Hs/L)^-2.54
RcBa/Hs^3
Profile 28
Figure 11.25 –Comparison of Breach prediction model (Bradbury, 2002) and inshore wave data at Slapton Sands.
11.29 It should be noted that the cross section used in this analysis is a section measured in January
2004, after the beach nourishment took place at Slapton Sands following the breach event in
January 2001. Therefore, computed beach areas and hence the barrier inertia parameter does
not represent the actual conditions prior to and at the breach event.
11.30 A sensitivity analysis of this result was undertaken to ascertain if increasing water levels, due to
sea level rise, or decreasing cross-sectional area, due to beach recession, would produce a
breach event.
11.31 Figure 11.26 (a) shows the effect of increasing the sea level by 250mm. It is clear that such a
rise makes very little difference, with breaching still not predicted. Figure 11.26 (b) shows the
effect of reducing the cross-sectional areas by 30%. This value was chosen by comparing the
cross-sectional area at section SS3, at the time of the breach, with that of section 29 in 2004.
Again, this change does not significantly alter the result.
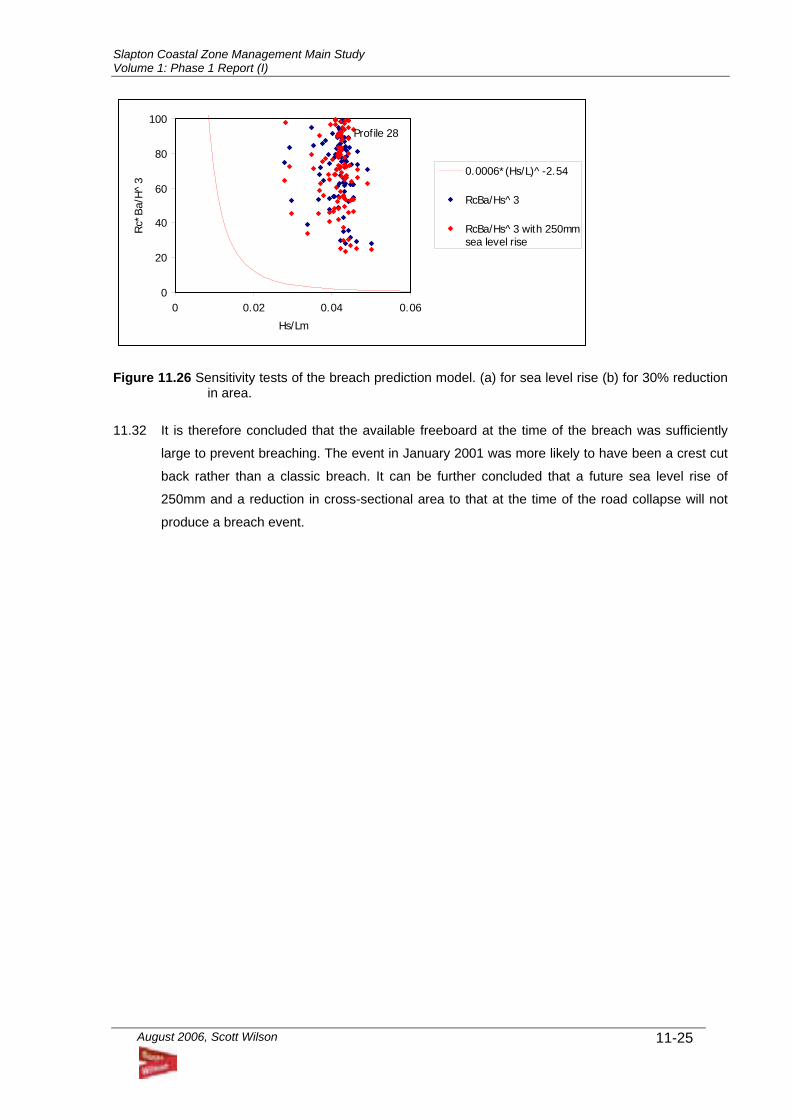
Slapton Coastal Zone Management Main Study Volume 1: Phase 1 Report (I)
August 2006, Scott Wilson
11-25
0
20
40
60
80
100
0 0.02 0.04 0.06
Hs/Lm
Rc*
Ba/
H^
3
0.0006*(Hs/L)^-2.54
RcBa/Hs^3
RcBa/Hs^3 with 250mmsea level rise
Profile 28
Figure 11.26 Sensitivity tests of the breach prediction model. (a) for sea level rise (b) for 30% reduction
in area. 11.32 It is therefore concluded that the available freeboard at the time of the breach was sufficiently
large to prevent breaching. The event in January 2001 was more likely to have been a crest cut
back rather than a classic breach. It can be further concluded that a future sea level rise of
250mm and a reduction in cross-sectional area to that at the time of the road collapse will not
produce a breach event.
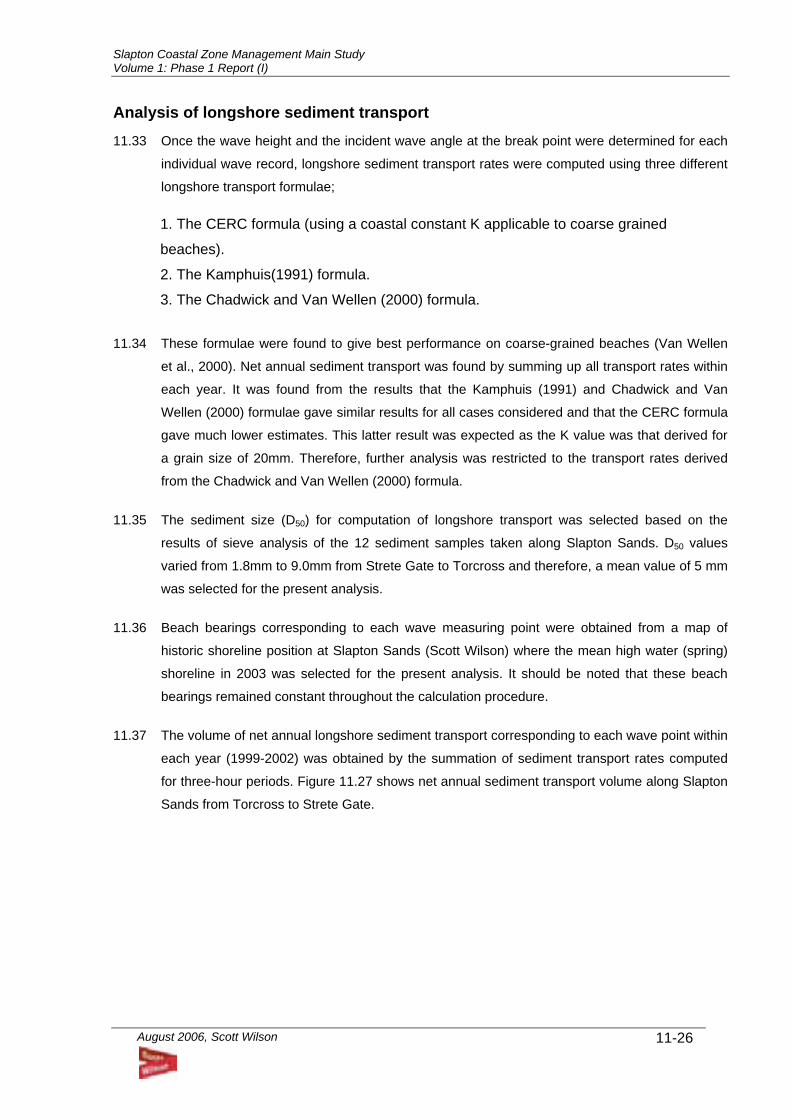
Slapton Coastal Zone Management Main Study Volume 1: Phase 1 Report (I)
August 2006, Scott Wilson
11-26
Analysis of longshore sediment transport 11.33 Once the wave height and the incident wave angle at the break point were determined for each
individual wave record, longshore sediment transport rates were computed using three different
longshore transport formulae;
1. The CERC formula (using a coastal constant K applicable to coarse grained
beaches).
2. The Kamphuis(1991) formula.
3. The Chadwick and Van Wellen (2000) formula.
11.34 These formulae were found to give best performance on coarse-grained beaches (Van Wellen
et al., 2000). Net annual sediment transport was found by summing up all transport rates within
each year. It was found from the results that the Kamphuis (1991) and Chadwick and Van
Wellen (2000) formulae gave similar results for all cases considered and that the CERC formula
gave much lower estimates. This latter result was expected as the K value was that derived for
a grain size of 20mm. Therefore, further analysis was restricted to the transport rates derived
from the Chadwick and Van Wellen (2000) formula.
11.35 The sediment size (D50) for computation of longshore transport was selected based on the
results of sieve analysis of the 12 sediment samples taken along Slapton Sands. D50 values
varied from 1.8mm to 9.0mm from Strete Gate to Torcross and therefore, a mean value of 5 mm
was selected for the present analysis.
11.36 Beach bearings corresponding to each wave measuring point were obtained from a map of
historic shoreline position at Slapton Sands (Scott Wilson) where the mean high water (spring)
shoreline in 2003 was selected for the present analysis. It should be noted that these beach
bearings remained constant throughout the calculation procedure.
11.37 The volume of net annual longshore sediment transport corresponding to each wave point within
each year (1999-2002) was obtained by the summation of sediment transport rates computed
for three-hour periods. Figure 11.27 shows net annual sediment transport volume along Slapton
Sands from Torcross to Strete Gate.
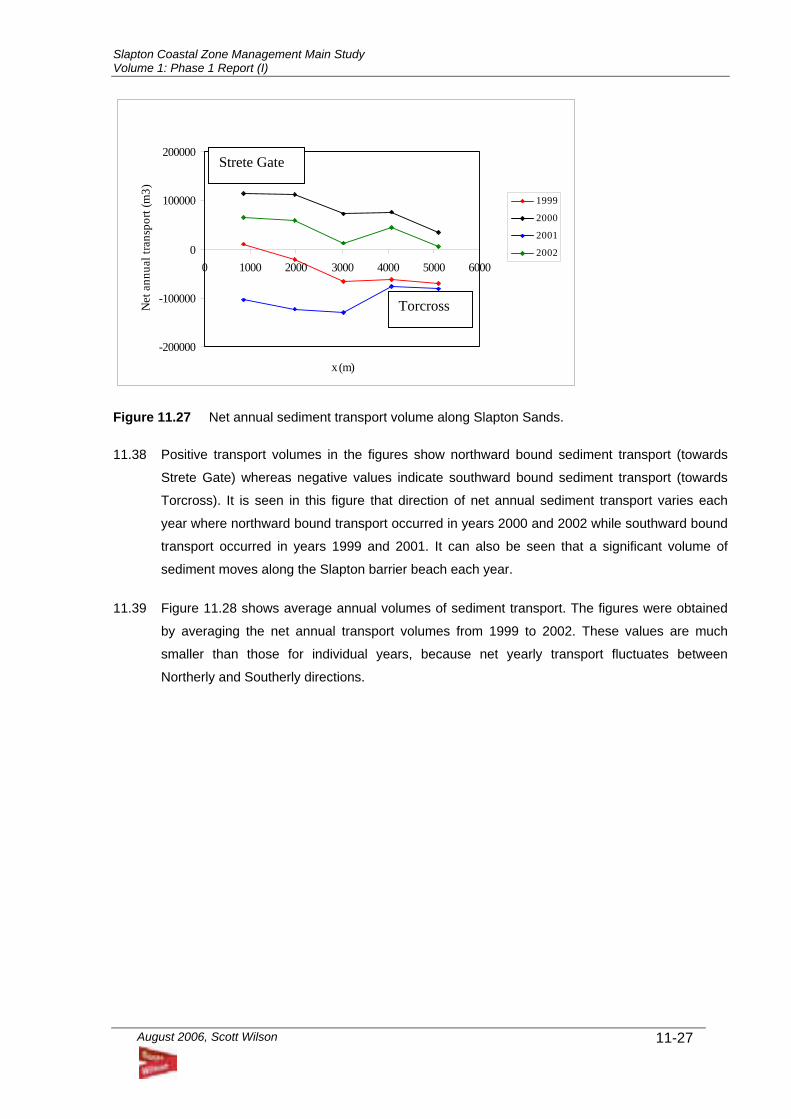
Slapton Coastal Zone Management Main Study Volume 1: Phase 1 Report (I)
August 2006, Scott Wilson
11-27
-200000
-100000
0
100000
200000
0 1000 2000 3000 4000 5000 6000
x (m)
Net
ann
ual t
rans
port
(m3)
1999
2000
2001
2002
Figure 11.27 Net annual sediment transport volume along Slapton Sands. 11.38 Positive transport volumes in the figures show northward bound sediment transport (towards
Strete Gate) whereas negative values indicate southward bound sediment transport (towards
Torcross). It is seen in this figure that direction of net annual sediment transport varies each
year where northward bound transport occurred in years 2000 and 2002 while southward bound
transport occurred in years 1999 and 2001. It can also be seen that a significant volume of
sediment moves along the Slapton barrier beach each year.
11.39 Figure 11.28 shows average annual volumes of sediment transport. The figures were obtained
by averaging the net annual transport volumes from 1999 to 2002. These values are much
smaller than those for individual years, because net yearly transport fluctuates between
Northerly and Southerly directions.
Torcross
Strete Gate
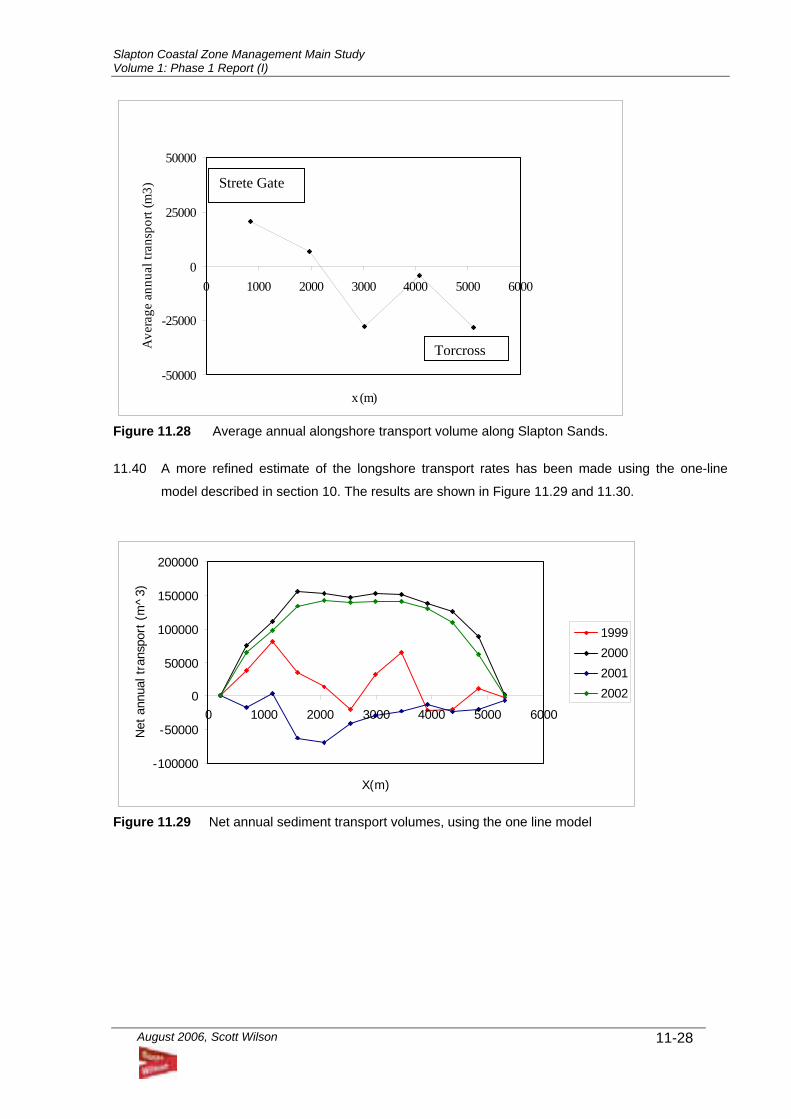
Slapton Coastal Zone Management Main Study Volume 1: Phase 1 Report (I)
August 2006, Scott Wilson
11-28
-50000
-25000
0
25000
50000
0 1000 2000 3000 4000 5000 6000
x (m)
Ave
rage
ann
ual t
rans
port
(m3)
Figure 11.28 Average annual alongshore transport volume along Slapton Sands. 11.40 A more refined estimate of the longshore transport rates has been made using the one-line
model described in section 10. The results are shown in Figure 11.29 and 11.30.
-100000
-50000
0
50000
100000
150000
200000
0 1000 2000 3000 4000 5000 6000
X(m)
Net
ann
ual t
rans
port
(m
^3)
1999
2000
2001
2002
Figure 11.29 Net annual sediment transport volumes, using the one line model
Torcross
Strete Gate
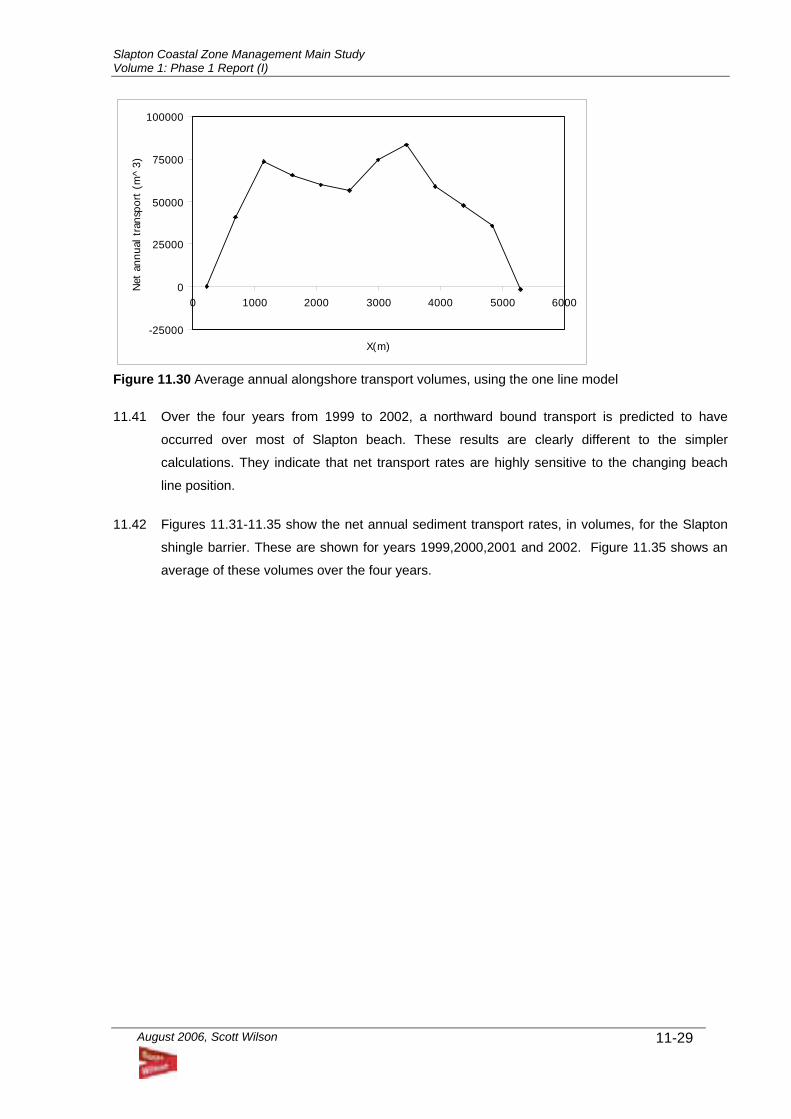
Slapton Coastal Zone Management Main Study Volume 1: Phase 1 Report (I)
August 2006, Scott Wilson
11-29
-25000
0
25000
50000
75000
100000
0 1000 2000 3000 4000 5000 6000
X(m)
Net
ann
ual t
rans
port
(m
^3)
Figure 11.30 Average annual alongshore transport volumes, using the one line model 11.41 Over the four years from 1999 to 2002, a northward bound transport is predicted to have
occurred over most of Slapton beach. These results are clearly different to the simpler
calculations. They indicate that net transport rates are highly sensitive to the changing beach
line position.
11.42 Figures 11.31-11.35 show the net annual sediment transport rates, in volumes, for the Slapton
shingle barrier. These are shown for years 1999,2000,2001 and 2002. Figure 11.35 shows an
average of these volumes over the four years.
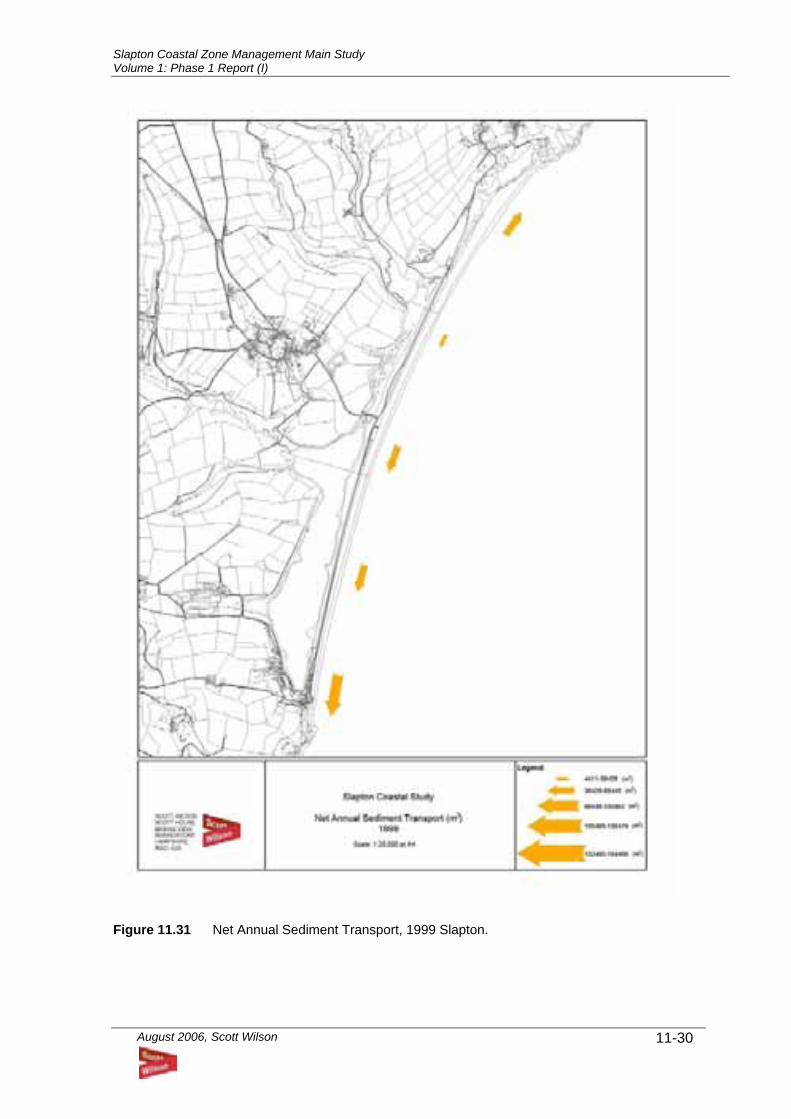
Slapton Coastal Zone Management Main Study Volume 1: Phase 1 Report (I)
August 2006, Scott Wilson
11-30
Figure 11.31 Net Annual Sediment Transport, 1999 Slapton.
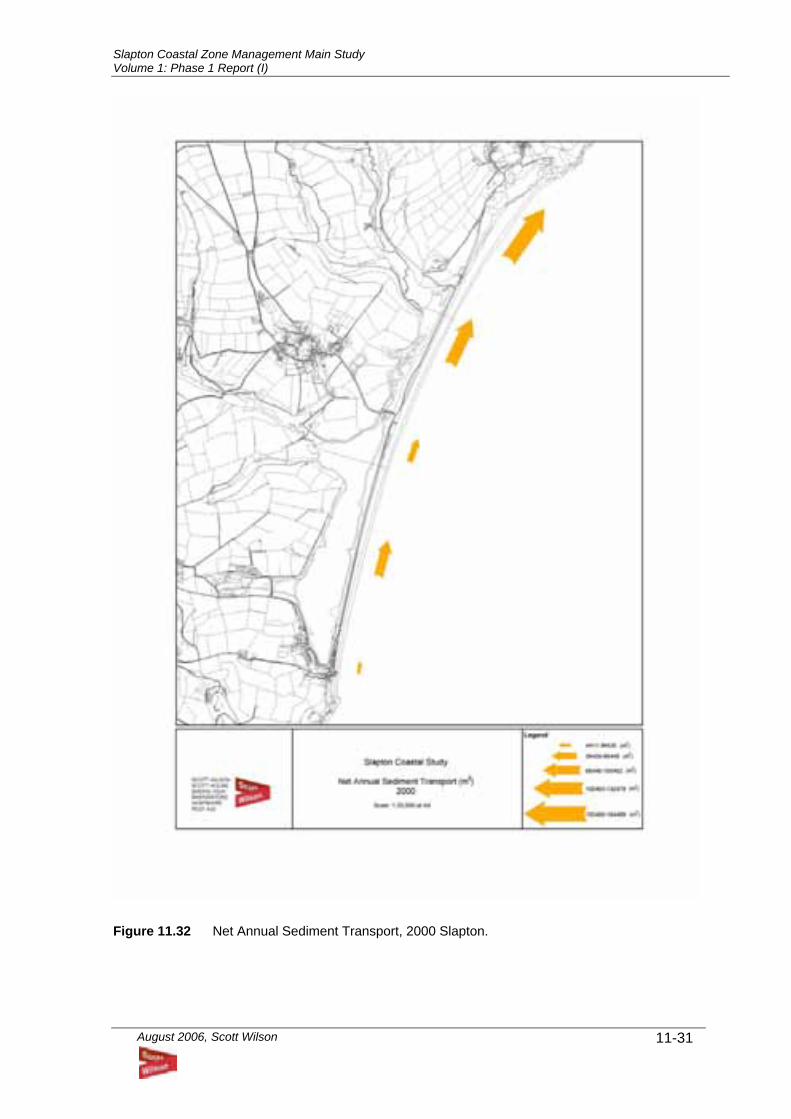
Slapton Coastal Zone Management Main Study Volume 1: Phase 1 Report (I)
August 2006, Scott Wilson
11-31
Figure 11.32 Net Annual Sediment Transport, 2000 Slapton.
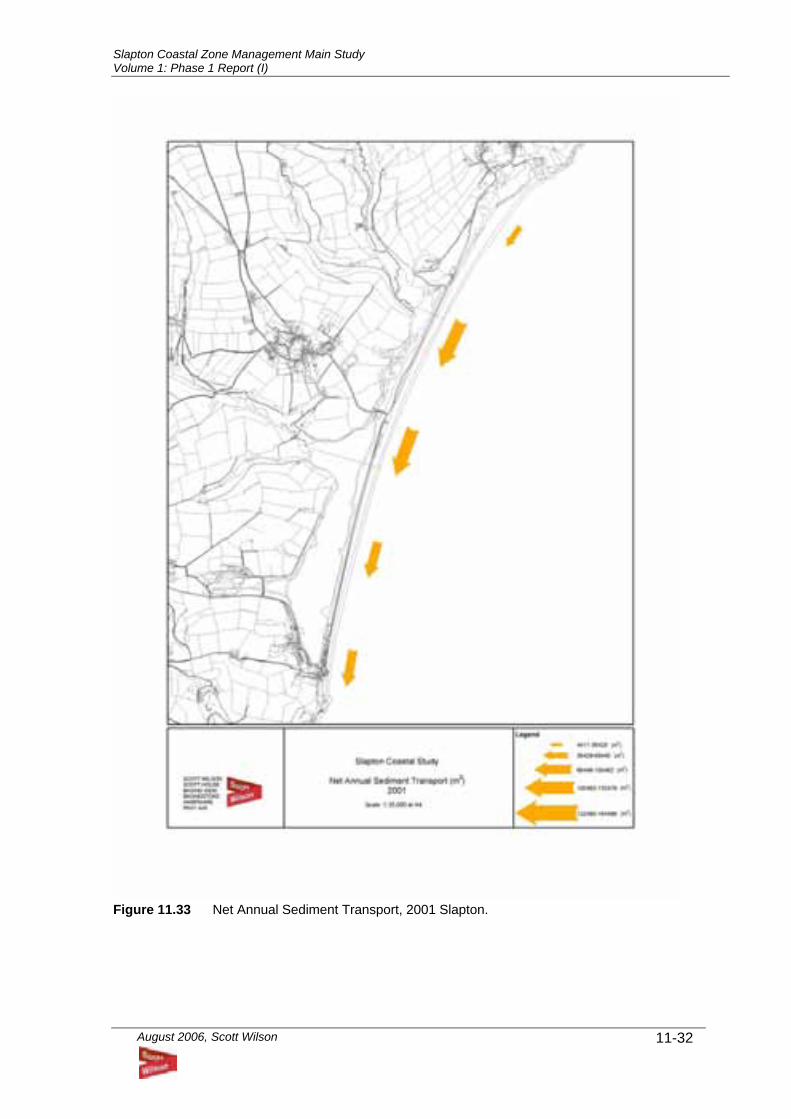
Slapton Coastal Zone Management Main Study Volume 1: Phase 1 Report (I)
August 2006, Scott Wilson
11-32
Figure 11.33 Net Annual Sediment Transport, 2001 Slapton.
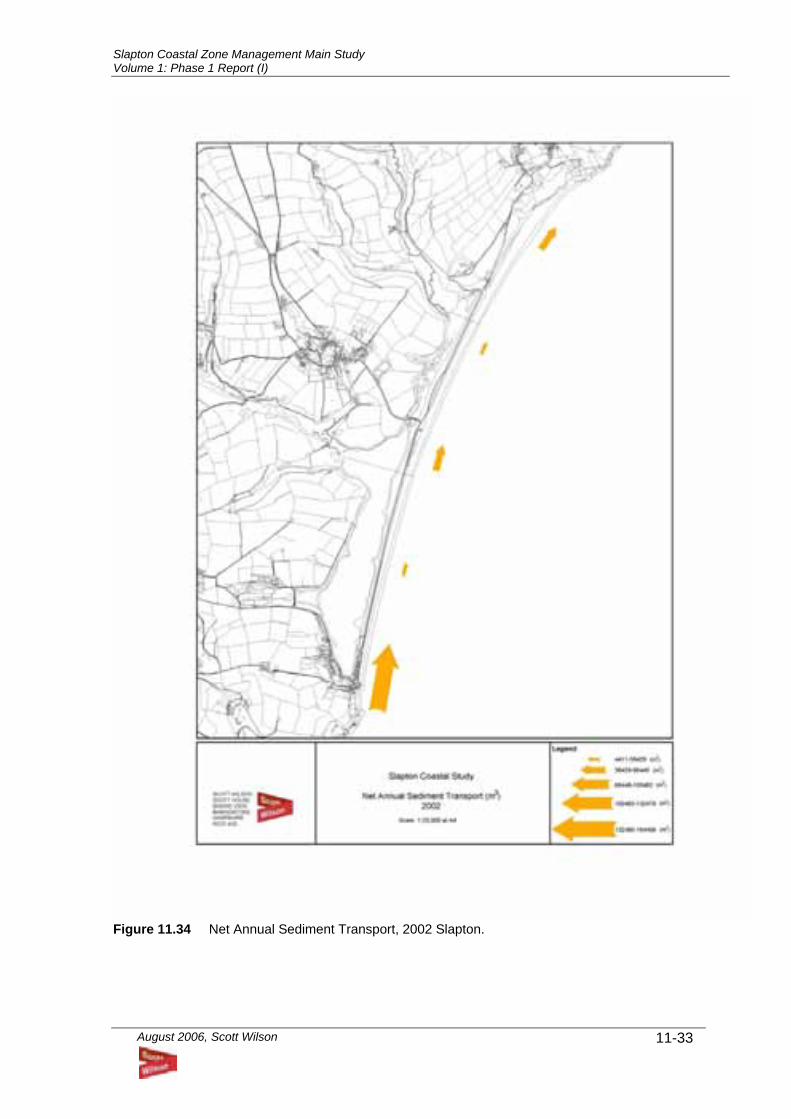
Slapton Coastal Zone Management Main Study Volume 1: Phase 1 Report (I)
August 2006, Scott Wilson
11-33
Figure 11.34 Net Annual Sediment Transport, 2002 Slapton.
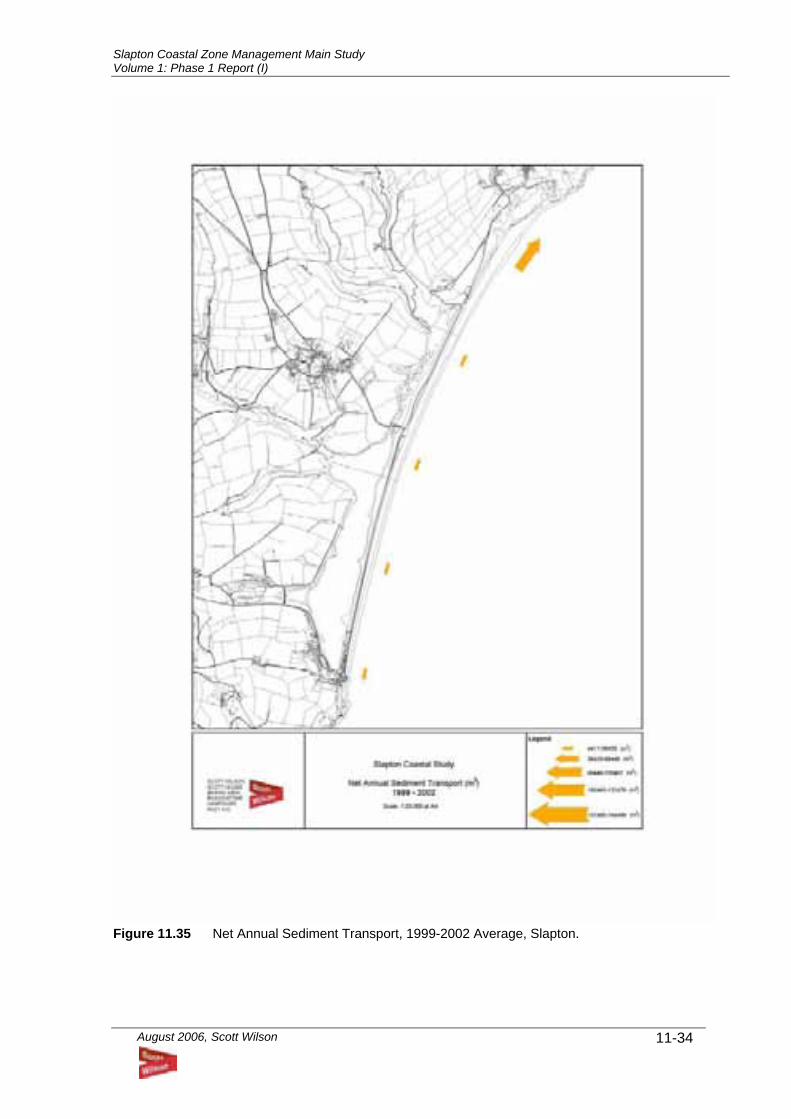
Slapton Coastal Zone Management Main Study Volume 1: Phase 1 Report (I)
August 2006, Scott Wilson
11-34
Figure 11.35 Net Annual Sediment Transport, 1999-2002 Average, Slapton.
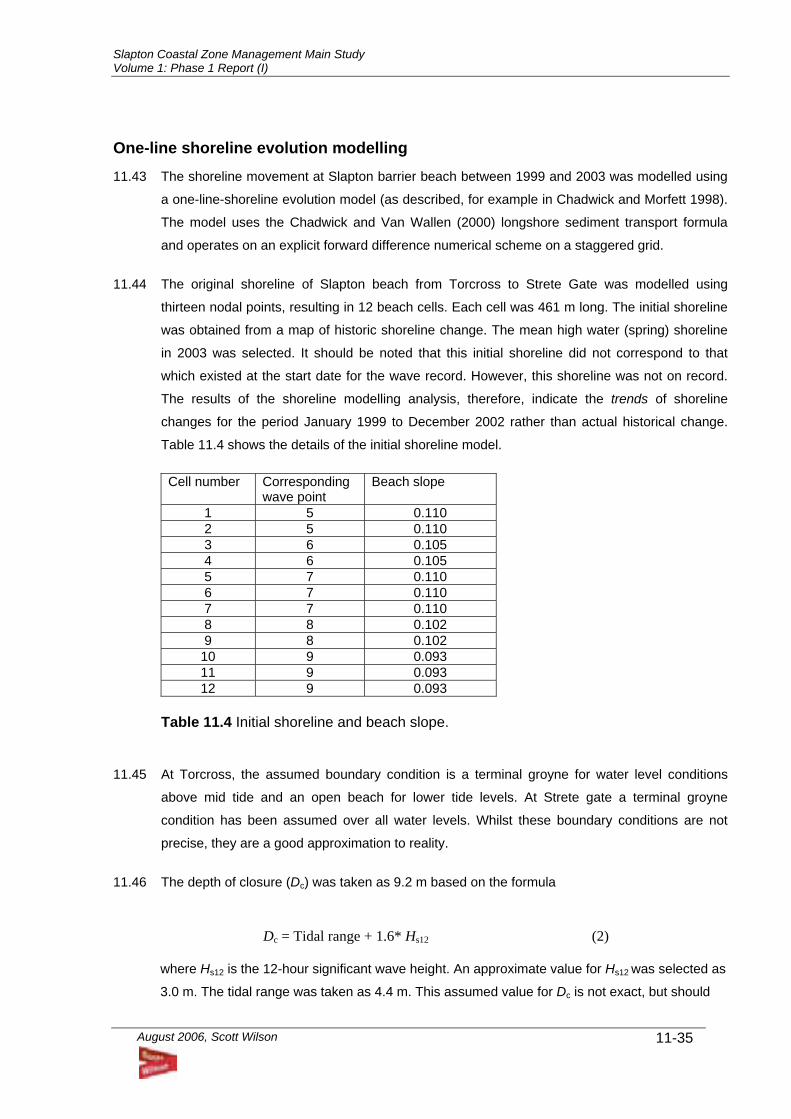
Slapton Coastal Zone Management Main Study Volume 1: Phase 1 Report (I)
August 2006, Scott Wilson
11-35
One-line shoreline evolution modelling 11.43 The shoreline movement at Slapton barrier beach between 1999 and 2003 was modelled using
a one-line-shoreline evolution model (as described, for example in Chadwick and Morfett 1998).
The model uses the Chadwick and Van Wallen (2000) longshore sediment transport formula
and operates on an explicit forward difference numerical scheme on a staggered grid.
11.44 The original shoreline of Slapton beach from Torcross to Strete Gate was modelled using
thirteen nodal points, resulting in 12 beach cells. Each cell was 461 m long. The initial shoreline
was obtained from a map of historic shoreline change. The mean high water (spring) shoreline
in 2003 was selected. It should be noted that this initial shoreline did not correspond to that
which existed at the start date for the wave record. However, this shoreline was not on record.
The results of the shoreline modelling analysis, therefore, indicate the trends of shoreline
changes for the period January 1999 to December 2002 rather than actual historical change.
Table 11.4 shows the details of the initial shoreline model.
Cell number Corresponding wave point
Beach slope
1 5 0.110 2 5 0.110 3 6 0.105 4 6 0.105 5 7 0.110 6 7 0.110 7 7 0.110 8 8 0.102 9 8 0.102
10 9 0.093 11 9 0.093 12 9 0.093
Table 11.4 Initial shoreline and beach slope.
11.45 At Torcross, the assumed boundary condition is a terminal groyne for water level conditions
above mid tide and an open beach for lower tide levels. At Strete gate a terminal groyne
condition has been assumed over all water levels. Whilst these boundary conditions are not
precise, they are a good approximation to reality.
11.46 The depth of closure (Dc) was taken as 9.2 m based on the formula
Dc = Tidal range + 1.6* Hs12 (2)
where Hs12 is the 12-hour significant wave height. An approximate value for Hs12 was selected as
3.0 m. The tidal range was taken as 4.4 m. This assumed value for Dc is not exact, but should
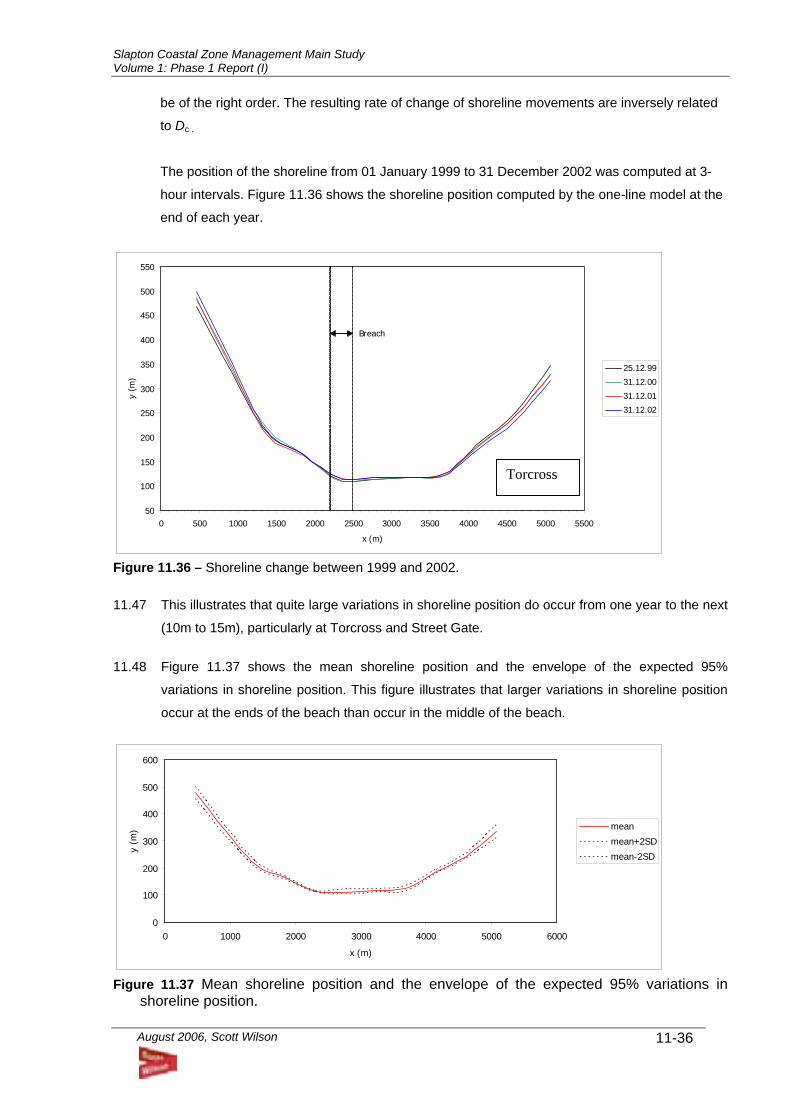
Slapton Coastal Zone Management Main Study Volume 1: Phase 1 Report (I)
August 2006, Scott Wilson
11-36
be of the right order. The resulting rate of change of shoreline movements are inversely related
to Dc .
The position of the shoreline from 01 January 1999 to 31 December 2002 was computed at 3-
hour intervals. Figure 11.36 shows the shoreline position computed by the one-line model at the
end of each year.
50
100
150
200
250
300
350
400
450
500
550
0 500 1000 1500 2000 2500 3000 3500 4000 4500 5000 5500
x (m)
y (m
)
25.12.99
31.12.00
31.12.01
31.12.02
Breach
Figure 11.36 – Shoreline change between 1999 and 2002. 11.47 This illustrates that quite large variations in shoreline position do occur from one year to the next
(10m to 15m), particularly at Torcross and Street Gate.
11.48 Figure 11.37 shows the mean shoreline position and the envelope of the expected 95%
variations in shoreline position. This figure illustrates that larger variations in shoreline position
occur at the ends of the beach than occur in the middle of the beach.
0
100
200
300
400
500
600
0 1000 2000 3000 4000 5000 6000
x (m)
y (m
) mean
mean+2SD
mean-2SD
Figure 11.37 Mean shoreline position and the envelope of the expected 95% variations in
shoreline position.
Torcross
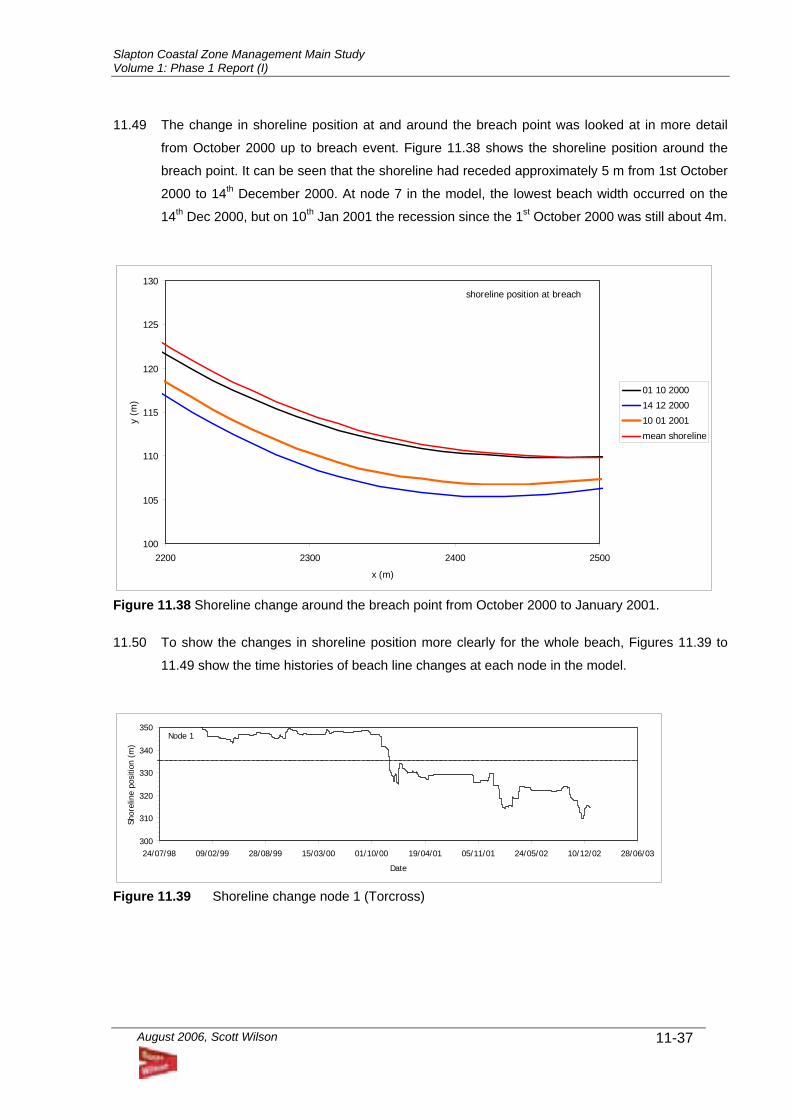
Slapton Coastal Zone Management Main Study Volume 1: Phase 1 Report (I)
August 2006, Scott Wilson
11-37
11.49 The change in shoreline position at and around the breach point was looked at in more detail
from October 2000 up to breach event. Figure 11.38 shows the shoreline position around the
breach point. It can be seen that the shoreline had receded approximately 5 m from 1st October
2000 to 14th December 2000. At node 7 in the model, the lowest beach width occurred on the
14th Dec 2000, but on 10th Jan 2001 the recession since the 1st October 2000 was still about 4m.
100
105
110
115
120
125
130
2200 2300 2400 2500
x (m)
y (m
)
01 10 2000
14 12 2000
10 01 2001
mean shoreline
shoreline position at breach
Figure 11.38 Shoreline change around the breach point from October 2000 to January 2001. 11.50 To show the changes in shoreline position more clearly for the whole beach, Figures 11.39 to
11.49 show the time histories of beach line changes at each node in the model.
300
310
320
330
340
350
24/07/98 09/02/99 28/08/99 15/03/00 01/10/00 19/04/01 05/11/01 24/05/02 10/12/02 28/06/03
Date
Shor
elin
e po
sitio
n (m
)
Node 1
Figure 11.39 Shoreline change node 1 (Torcross)
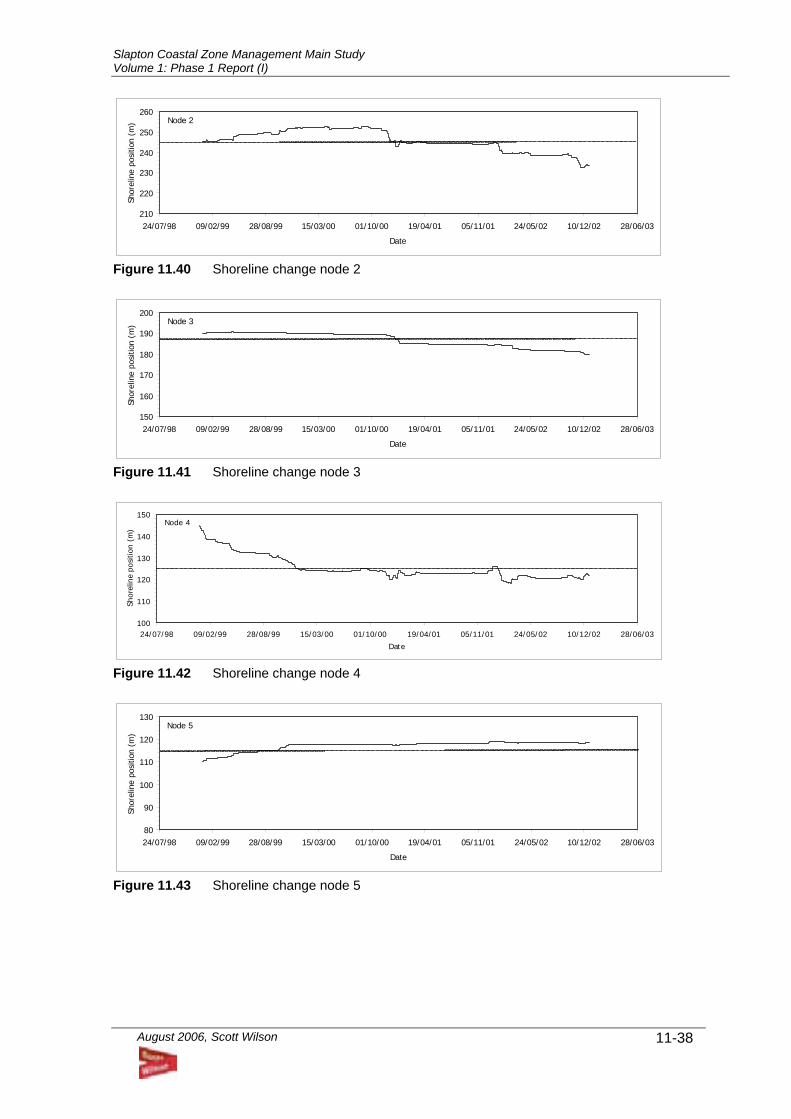
Slapton Coastal Zone Management Main Study Volume 1: Phase 1 Report (I)
August 2006, Scott Wilson
11-38
210
220
230
240
250
260
24/07/98 09/02/99 28/08/99 15/03/00 01/10/00 19/04/01 05/11/01 24/05/02 10/12/02 28/06/03
Date
Shor
elin
e po
sitio
n (m
) Node 2
Figure 11.40 Shoreline change node 2
150
160
170
180
190
200
24/07/98 09/02/99 28/08/99 15/03/00 01/10/00 19/04/01 05/11/01 24/05/02 10/12/02 28/06/03
Date
Shor
elin
e po
sitio
n (m
) Node 3
Figure 11.41 Shoreline change node 3
100
110
120
130
140
150
24/07/98 09/02/99 28/08/99 15/03/00 01/10/00 19/04/01 05/11/01 24/05/02 10/12/02 28/06/03
Date
Shor
elin
e po
sitio
n (m
)
Node 4
Figure 11.42 Shoreline change node 4
80
90
100
110
120
130
24/07/98 09/02/99 28/08/99 15/03/00 01/10/00 19/04/01 05/11/01 24/05/02 10/12/02 28/06/03
Date
Shor
elin
e po
sitio
n (m
)
Node 5
Figure 11.43 Shoreline change node 5
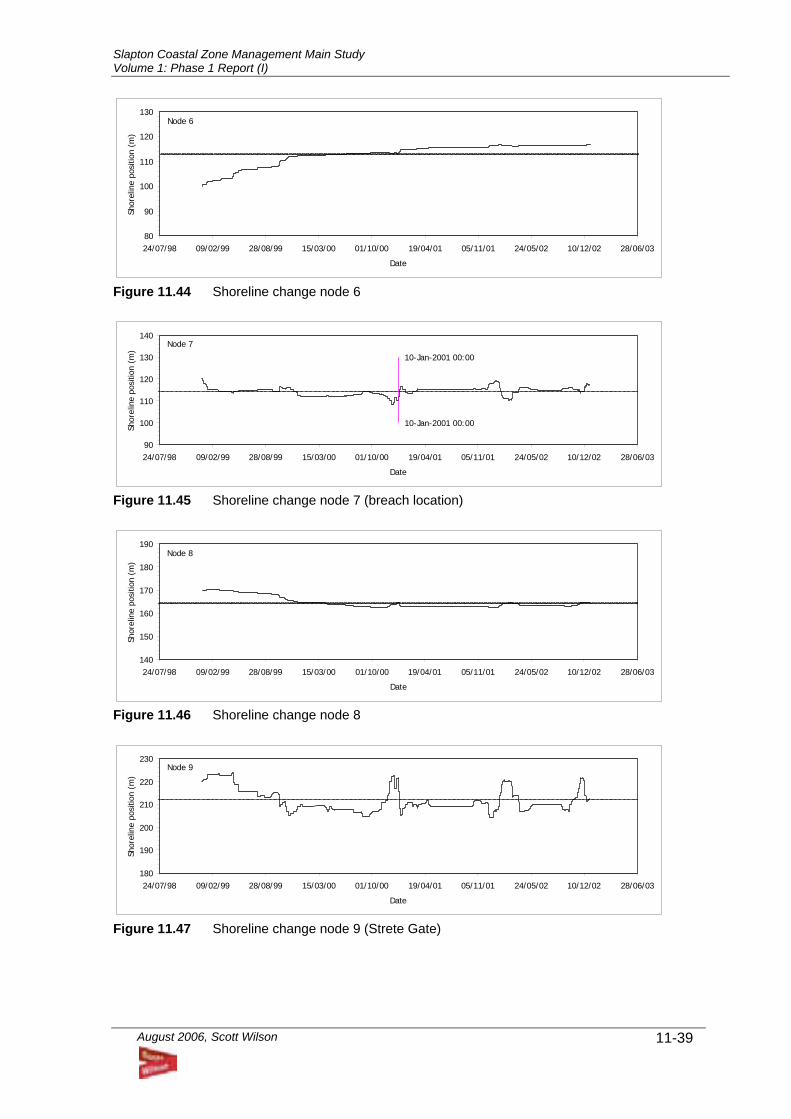
Slapton Coastal Zone Management Main Study Volume 1: Phase 1 Report (I)
August 2006, Scott Wilson
11-39
80
90
100
110
120
130
24/07/98 09/02/99 28/08/99 15/03/00 01/10/00 19/04/01 05/11/01 24/05/02 10/12/02 28/06/03
Date
Shor
elin
e po
sitio
n (m
)Node 6
Figure 11.44 Shoreline change node 6
10-Jan-2001 00:00
10-Jan-2001 00:00
90
100
110
120
130
140
24/07/98 09/02/99 28/08/99 15/03/00 01/10/00 19/04/01 05/11/01 24/05/02 10/12/02 28/06/03
Date
Shor
elin
e po
sitio
n (m
)
Node 7
Figure 11.45 Shoreline change node 7 (breach location)
140
150
160
170
180
190
24/07/98 09/02/99 28/08/99 15/03/00 01/10/00 19/04/01 05/11/01 24/05/02 10/12/02 28/06/03
Date
Shor
elin
e po
sitio
n (m
)
Node 8
Figure 11.46 Shoreline change node 8
180
190
200
210
220
230
24/07/98 09/02/99 28/08/99 15/03/00 01/10/00 19/04/01 05/11/01 24/05/02 10/12/02 28/06/03
Date
Shor
elin
e po
sitio
n (m
)
Node 9
Figure 11.47 Shoreline change node 9 (Strete Gate)
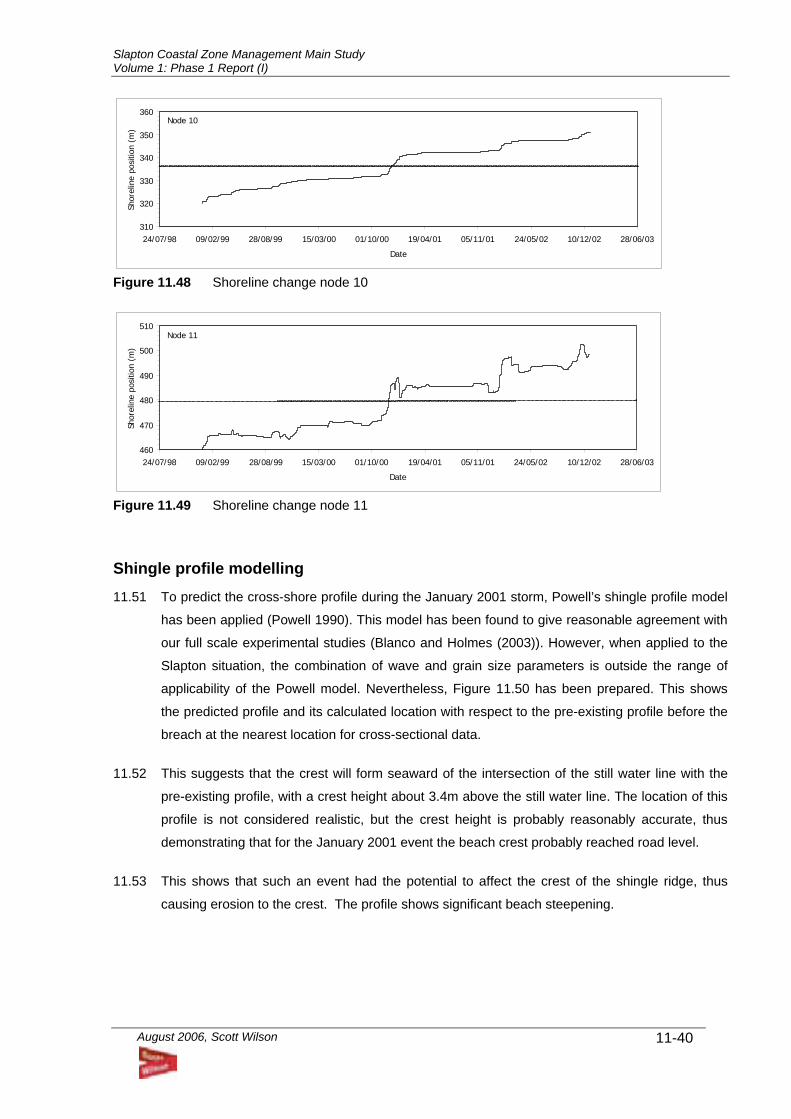
Slapton Coastal Zone Management Main Study Volume 1: Phase 1 Report (I)
August 2006, Scott Wilson
11-40
310
320
330
340
350
360
24/07/98 09/02/99 28/08/99 15/03/00 01/10/00 19/04/01 05/11/01 24/05/02 10/12/02 28/06/03
Date
Shor
elin
e po
sitio
n (m
)Node 10
Figure 11.48 Shoreline change node 10
460
470
480
490
500
510
24/07/98 09/02/99 28/08/99 15/03/00 01/10/00 19/04/01 05/11/01 24/05/02 10/12/02 28/06/03
Date
Shor
elin
e po
sitio
n (m
)
Node 11
Figure 11.49 Shoreline change node 11
Shingle profile modelling 11.51 To predict the cross-shore profile during the January 2001 storm, Powell’s shingle profile model
has been applied (Powell 1990). This model has been found to give reasonable agreement with
our full scale experimental studies (Blanco and Holmes (2003)). However, when applied to the
Slapton situation, the combination of wave and grain size parameters is outside the range of
applicability of the Powell model. Nevertheless, Figure 11.50 has been prepared. This shows
the predicted profile and its calculated location with respect to the pre-existing profile before the
breach at the nearest location for cross-sectional data.
11.52 This suggests that the crest will form seaward of the intersection of the still water line with the
pre-existing profile, with a crest height about 3.4m above the still water line. The location of this
profile is not considered realistic, but the crest height is probably reasonably accurate, thus
demonstrating that for the January 2001 event the beach crest probably reached road level.
11.53 This shows that such an event had the potential to affect the crest of the shingle ridge, thus
causing erosion to the crest. The profile shows significant beach steepening.
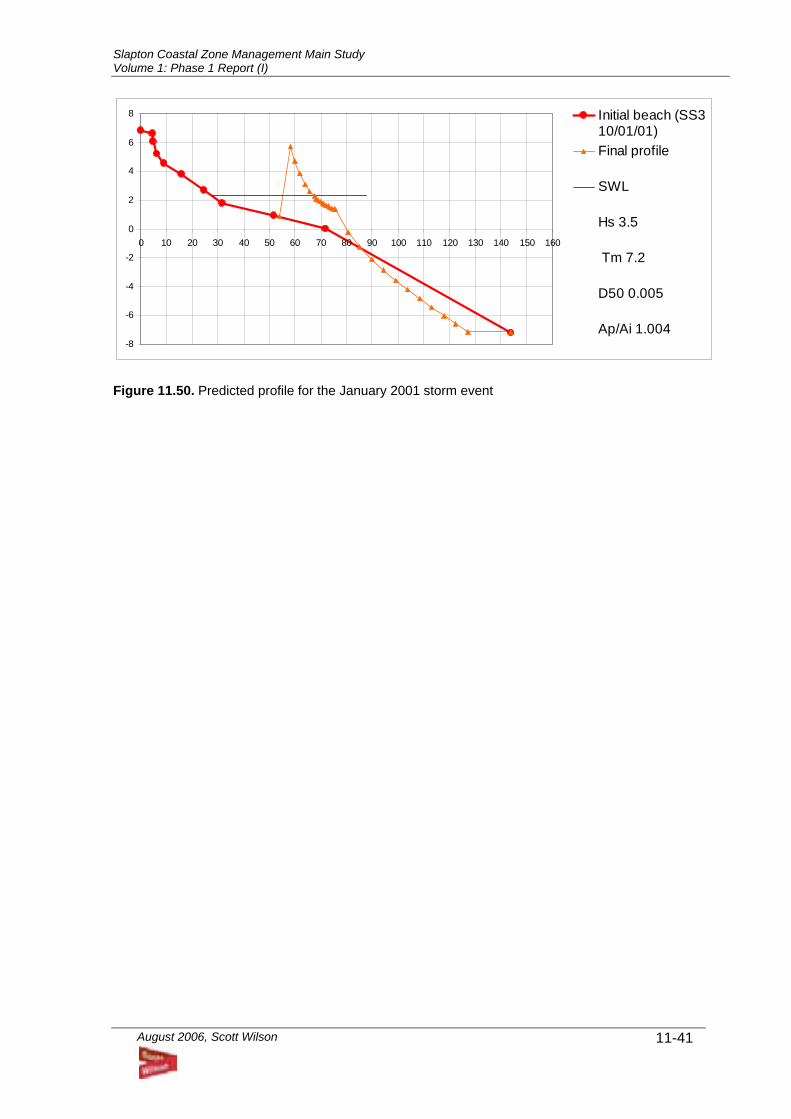
Slapton Coastal Zone Management Main Study Volume 1: Phase 1 Report (I)
August 2006, Scott Wilson
11-41
-8
-6
-4
-2
0
2
4
6
8
0 10 20 30 40 50 60 70 80 90 100 110 120 130 140 150 160
Initial beach (SS310/01/01)Final profile
SWL
Hs 3.5
Tm 7.2
D50 0.005
Ap/Ai 1.004
Figure 11.50. Predicted profile for the January 2001 storm event
Slapton Coastal Zone Management Main Study Volume 1: Phase 1 Report (I)
August 2006, Scott Wilson
11-42
Summary and Conclusions 11.54 Sea level at Slapton has risen by 18 metres during the past 9000 years. In the recent century
the rate of relative sea-level rise has been 1.7 mm/year.
11.55 The rate of long-term land subsidence at Slapton is 1.1 m per 1000 years (equivalent to 1.1
mm/yr). The subsidence rate is faster than the value used by UKCIP02 (0.6 mm/yr).
11.56 Sea level is predicted to be at least 20 cm higher by 2080 (low emission scenario) and may be
as high as 80 cm above present level (high emission scenario). The most conservative estimate
indicates that water levels that today occur once every 7-8 years are expected to occur, by
2080, about 3 times per year.
11.57 Slapton Ley has been non-tidal for 3000 years. Prior to 3000 years ago, the barrier at Slapton
was interrupted by one or more tidal inlets and a tidal lagoon existed landward of the barrier.
11.58 The key beach processes affecting Slapton Sands are:
Short-term storm impacts
Medium term longshore transport gradients
Long-term sea level rise and trend of the ridge to rollback.
11.59 Each of these processes has been studied. Short- and medium-term impacts are coastal
process issues, whereas long-term changes are best considered within a geomorphological
framework.
11.60 The cross-shore profile predicted by Powell’s model, for the time and location of the road
collapse in January 2001, shows that the storm event was of a sufficient severity (wave height)
and occurred in conjunction with a sufficiently high still water level, to impact on the crest of the
shingle ridge.
11.61 The breach prediction model of Bradbury suggests that at the time of the road collapse in
January 2001, the loss of road was due to beach cut back not due to the mechanism of over
washing and roll back. The sensitivity tests showed that neither a sea level rise of 250mm, nor a
reduction in cross-sectional area of 30% would significantly increase the chances of the
overwashing mechanism becoming dominant.
11.62 The erosion event can therefore clearly be categorised as one of cut-back of the edge of the
shingle barrier as indicated on Figure 10.25 in Volume 2, and not as a breach of the barrier.
11.63 Examination of aerial photographs from 1999 shows that, compared to adjacent areas, the face
of the shingle ridge was further seawards at the central car park and at the location where the
Slapton Coastal Zone Management Main Study Volume 1: Phase 1 Report (I)
August 2006, Scott Wilson
11-43
road was undermined. Therefore these areas had steeper beaches and were therefore at
higher risk of greater erosion than other areas.
11.64 It is possible that other factors such as differential permeability (for example due to presence of
made ground), presence of buried channels or rock outcrops also contributed to the differential
rates of erosion observed, but there is insufficient information on these aspects on which to
base a hypothesis.
11.65 The overall assessment of the contemporary coastal morphology is that Start Bay comprises a
closed coastal sediment cell. There is some exchange of sediment between locations within
Start Bay, but changes to beach volume at Slapton are dominated by sediment movements
within the area of Slapton Sands itself.
11.66 Large changes in beach areas and shoreline position occur over medium term time scales
(weeks, months). The trends in the amount of beach volume above the mid and high water lines
have been increasing gradually to the north of Strete Gate, decreasing more rapidly at the road
collapse location and decreasing gradually at Torcross. However, these trends are based on a
data set which is probably statistically unreliable.
11.67 Longshore transport rates have been calculated based on a new and comprehensive analysis of
4 year’s data, which includes the effect of varying water levels and thus the influence of the
Skerries Bank on the waves and sediment movements. The results show that high rates of net
annual sediment transport do occur (of the order of 150,000 m3 per annum), but that the rate
and direction varies from year to year and with location along the frontage. Averaged over the 4-
year period, the net transport rates are lower (about 75,000 m3), indicating landward retreat at
Torcross and accretion at Strete Gate over this period. Given that a 4-year record is short
compared to the expected natural variability of climate over decadal time scales, these results
should not be extrapolated to decadal time scales.
11.68 Results from a numerical model demonstrate that quite large changes in the shoreline position
(of the order of 5 to 10m) can occur in medium term periods (weeks, months). Model results
show that at the time of the road collapse in January 2001, the shoreline position around the
location of the collapsed road had receded by about 4m from 1st October 2000 to 10th January
2001.
11.69 At the time of the road collapse event in January 2001, the beach volumes above mid and high
water levels at the breach location were at the historically lowest recorded value in the 31-year
record.
11.70 The storm was an unusual combination of moderately high water levels at Spring tide and a
sustained period of high waves from the east. Based on analysis of wind speeds, wind direction,
Slapton Coastal Zone Management Main Study Volume 1: Phase 1 Report (I)
August 2006, Scott Wilson
11-44
and storm duration from a data set from 1980 to 2004, it is estimated that the storm had a return
period of 25 years.
11.71 The storm of 1995, which was notable but did not cause such extensive damage, was identified
by the same analysis of wind data as being less severe, but also a severe, infrequent event
(return period about 10 years).
11.72 The overall assessment of the January 2001 event is that it was caused by a combination of
beach line recession due to differential longshore transport rates in the preceding autumn and
the occurrence of a severe storm, which further cut back the profile, with the beach crest
reaching road level.
11.73 Because the storm coincided with a period when the beach was at a historically narrow state, its
observed effect on infrastructure (road, car park) was greater than it would have otherwise have
been.
11.74 Figure 11.51 (Volume II) shows areas at risk at any time from a single storm event. Using the
2001 storm event, when 5m of shingle ridge was eroded, it is assumed that a similar event of 1
in 25 year probability would have a similar erosion impact. Therefore a 5m setback from the
vegetated crest line has generally been drawn. However, the extent of erosion expected to
occur at a point along the beach is a function of two other main variables: beach steepness (the
steeper the beach, the more likely is erosion of the crest); and presence of defences (these
inhibit erosion of the crest). The steepest beaches occur in the central area near the car park
and previous road realignment.
11.75 The figure shows that the main areas at risk are (south to north):
The length of road immediately north of the rock revetment, including the length where the
rock revetment is badly degraded
The central car park
The two road sections north of the car park where the new road alignment joins the original
road alignment
11.76 Long-term barrier retreat rates have been estimated, based on a conceptual model of the long-
term evolution of the Slapton Sands coastline, and a numerical formulation relating sea level
rise to barrier retreat rate. The retreat rates calculated are not precise, and for the present day
are somewhat higher than observed sustained retreat rates.
11.77 The historical data analysis suggests that in overall terms the Slapton Sands shingle ridge has
been stable over the last century, but with some net beach accretion at Strete gate and
recession at Torcross. Long-term net erosion rates for the crest of the barrier are low, with a
Slapton Coastal Zone Management Main Study Volume 1: Phase 1 Report (I)
August 2006, Scott Wilson
11-45
best estimate over 100 years of 0.1m/year for the centre of the Bay. Analysis of a number of
maps and photographs for different periods of time between 1890 and the present day all
indicate little overall movement of the crest. However, over shorter time periods rates of 0.4-
0.6m have been found.
11.78 The geomorphologically based estimates for long-term barrier retreat give values of 0.3m/year
at the present day, increasing to at least 0.4m/year due to sea level rise.
11.79 The maps shown as Figures 11.52(a-g) (Volume 2), show areas at risk within different time
epochs along the shingle bank. In accordance with guidance for Shoreline Management Plans,
three epochs have been used: 0-20 years, 20-50 years and 50-100 years. The retreat rates
used in preparing these maps are those of a ‘Low Emission Scenario’ and are applicable to the
next 100 years.
11.80 The rates used in the Low Emission Scenario are derived from the geomorphology-based
retreat rates from the low emission scenario for climate change and sea level rise up to year
100. The geomorphology-based projection suggests more rapid rate in years 50-100, of the
order of a further 30m.
11.81 In the geomorphology-based projections for the high emission scenario both sea level rise and
retreat rates over years 50-100 are predicted to accelerate rapidly and are higher still. These are
displayed on Figures 11.53 (a-g) (Volume 2).
11.82 In using the maps the following should be noted:
• The projections are indicative, with a considerable degree of uncertainty, despite any
appearance of precision. The uncertainty increases over time.
• The retreat rates used (even for the lower emission scenario) are higher than the long-term
historical change which has actually occurred.
• Erosion may occur landward of the ‘At Risk’ areas in particularly severe events.
• If the high emission scenario becomes reality, or indeed if any scenario occurs other than
the low emission scenario, then the ‘At Risk’ areas will rapidly project landwards after year
100.
• The projections are long-term averages, and will only occur if a given period of time has the
expected number of severe storm events. It is the severe storm events which drive retreat
of the barrier.
11.83 It has been postulated by various authors that the shingle bank is likely to break down
irreversibly and breach, forming tidal inlets, within the next 30 to 50 years. This is considered to

Slapton Coastal Zone Management Main Study Volume 1: Phase 1 Report (I)
August 2006, Scott Wilson
11-46
be highly unlikely. Neither of the storm events which have occurred in the last 10 years have
had a major impact on the shingle barrier height or width, and neither has come close to causing
a breach of the barrier. The current return period for a breach is considered to be much less
than 100 years.
11.84 Sea level rise and increased storminess will increase the rate of erosion and the risk of major
recession event, but the risk of a breach of the shingle bank will remain low over the next 20 or
50 years.
11.85 Possibly after 50 years, and definitely beyond 100 years, a No Intervention scenario will result in
breakdown of the shingle barrier, with breaching and forming of intermittent tidal inlets.
11.86 Retreat of the shingle barrier will eventually result in lowered beaches in front of Torcross, and
leave the northern part of Torcross exposed to wave attack. Protection of Torcross will require
an extension of the sea wall to link up with the retreated barrier location.

Slapton Coastal Zone Management Main Study Volume 1: Phase 1 Report (I)
August 2006, Scott Wilson
12-1
12 Option Development
Introduction 12.1 The option development carried out as part of this study will lead to a strategic appraisal rather
than scheme specific appraisal, to fit in with the strategic framework for the area. The appraisal
considers broader shoreline management options rather than more specific ‘scheme scale’
options.
12.2 The broad scale options considered for this study are in accordance with guidance for shoreline
management:
• Do nothing (also described as ‘No Active Intervention’)
• Keep the Coast Road -Do minimum (short-term options)
• Keep the Coast Road (long-term options)
• Advance the line
• Managed realignment (of the road)
12.3 Within the context of these broad scale options, some more detailed options are considered in
order to fully understand the viability of the above management options. These more detailed
considerations include proactive and reactive do minimum options, forms of defence for the
purpose of holding the line and potential options for relocating the line of defence for the
managed realignment option.
12.4 The options development only considers the technical viability of options at this stage.
Environmental and economic issues are considered in later sections of this report.
12.5 Options development has been carried out in accordance with DEFRA’s PAG series of
documents, taking into account the latest changes following publication of the Treasury’s Green
Book. Options are defined and developed in this section and compared in Chapter 14. Since
the objective of this part of the study is to evaluate the viability of the hold the line option, the
selection of a preferred option is not carried out in detail. Instead, Chapter 17 provides
recommendations on how to proceed in Phases 2 and 3 of this study in order to determine the
final preferred management strategy.
Objectives 12.6 English Nature have indicated that although a breach of the barrier would cause them concern
since SSSI features could be affected; such a breach would be possible in future and
considered as part of the natural geomorphological evolution of the shingle barrier.
Slapton Coastal Zone Management Main Study Volume 1: Phase 1 Report (I)
August 2006, Scott Wilson
12-2
12.7 Analysis carried out as part of this study has shown that following a breach the number of
properties at risk from flooding would be less than 10. Furthermore, a breach would be unlikely
to remain open in the short to medium term.
12.8 The risk to human life and property is limited and the Slapton barrier beach is therefore unusual
in coast defence terms, in that a breach of the barrier would not necessarily have a significant
negative impact.
12.9 However, the road that runs along the barrier is of significant importance to the local community,
and the socio economic impact of losing this transport link is a critical factor in determining the
long-term strategy for this area. The main issue in determining the options for long-term
management of the Slapton Line is whether or not the road can be maintained in its current
position or whether alternative options should be considered. The shoreline management
standard concept of holding the line has therefore been recast as Keeping the Coast Road.
12.10 It is therefore important to distinguish between a breach in the barrier beach, leading to saline
intrusion into the freshwater Ley, and an erosion event or ‘breach’ to the road, leading to a loss
of the transport link but no physical breakdown of the barrier separating the Ley from the sea. In
order to make this distinction clear during the development of options the term road damage
event will be used to describe any event leading to the loss of the road as a functioning
transport link. The term breach will only be used to refer to events leading to a physical breach
in the barrier beach leading to saline intrusion into the Ley.
12.11 Based on the above issues, one key objective is maintaining the local infrastructure for socio-
economic reasons. The other is minimising adverse environmental impact.
No Active Intervention (Do Nothing) Introduction
12.12 The Do Nothing scenario forms the baseline case against which all other options are compared.
Under this scenario no action would be taken to protect the shingle ridge from erosion or to
mitigate the effects of erosion.
12.13 The development of a realistic Do Nothing scenario is essential for a rigorous appraisal of
options so that the most appropriate strategy is proposed.
12.14 As discussed in the previous section, the critical event in terms of the management of the
Slapton Line is an event leading to the destruction of the road, termed a road damage event.
Slapton Coastal Zone Management Main Study Volume 1: Phase 1 Report (I)
August 2006, Scott Wilson
12-3
Probability and timing of a road damage event
12.15 An analysis of shoreline evolution and the probability of destructive storm events has shown that
the most vulnerable section of the road is just either side of the recently relocated section
between Slapton and Strete. In this area the road would be damaged under an event similar to
that in January 2001, which has an estimated return period of 1 in 25 years. The annual
probability of a road damage event in a single storm or short sequence of storms is therefore
4%.
12.16 Given this probability a further road damage event can be expected to occur within the next ten
to twenty years. Since such an event is not primarily dependent on long-term erosion rates, but
rather the probabilistic occurrence of a storm with the required intensity and duration,
estimations of the timing of the event can only be given in probabilistic terms.
Breach mechanism
12.17 As the road construction is less easily eroded than the shingle beach, the presence of the road
will slow down the gradual erosion of the shingle barrier to some extent, although eventual
breaching of the barrier would inevitably take place in the long term. It is unlikely that a breach
will occur within the next 50 years, but possible that a breach could take place during the period
of concern for this study (100 years). This assumption is based on adoption of projections
consistent with the low emission climate change scenario.
Consequences of a breach
12.18 A complete breach of the shingle ridge would allow saline intrusion into Slapton Ley and would
alter the ecological make up of the area. However, it is likely that this would at first be temporary
and that the first breach would repair itself temporarily by natural means. Breaches would then
occur on a more frequent basis until eventually a permanent breach would be formed. Following
this the ecological makeup of Slapton Ley would be permanently changed into a saline
environment.
12.19 Roll back of the shingle barrier, and formation of tidal inlets due to breaching, would expose
areas of the Slapton coast to flooding and wave action. One such area is likely to be in
Torcross, where properties currently lie very close to the shores of Slapton Ley. If the barrier
was to roll back as shown by the geomorphological projections, then it would be necessary to
protect Torcross by extension of the existing sea wall along the coast and linking in with the
barrier location.
12.20 Other impacts expected within the 100-year study period are likely to be limited to loss of the
monument, car park and road with the associated socio economic, and historic environmental
impacts.
Slapton Coastal Zone Management Main Study Volume 1: Phase 1 Report (I)
August 2006, Scott Wilson
12-4
Do Minimum 12.21 For the purpose of this study the Do Minimum option has been divided into reactive and
proactive approaches. Both would maintain the coast road for a limited period of time.
12.22 If a road damage event were to occur then emergency repairs would be carried out to reinstate
the road or at least make it passable in one direction. The advantage of such an approach
would be that the residual strength of the existing natural defences would be used to the full and
financial input would not be required until a road damage event occurred. However, the
disruption caused by such an event and by the emergency repairs required afterwards would be
likely to be significant, and no planning with regard to the timing of expenditure would be
possible.
12.23 The proactive Do Minimum option would involve close monitoring of the beaches and road in
order to be able to carry out works to protect the road from undermining just before any actual
damage occurs. Clearly it would not always be possible to accurately predict when such works
would be necessary and the risk of unexpected damage to the road would have to be accepted,
although an agreed management plan, including action and emergency trigger levels, could be
used to reduce this risk. Planning with regard to expenditure might be limited under such an
option. The advantage of this scenario would be similar to the reactive option in that the existing
defences would be used until the last moment.
12.24 This option would need to include provision for protection of the 20 or so buildings at Torcross at
some point in the future.
12.25 Both these options are technically viable, and since these options do not result in an
unacceptably high risk to human life or property they will be included in the options appraisal in
Chapter 14.
Keep the Coast Road 12.26 This option would involve a commitment to maintain the current position of the road for the
duration of the study period – 100 years. Since the analysis of beach processes has shown that
some sections of the road will be at risk of undermining, the construction of some form of
defence would be required in order to guarantee the structural stability of the road.
12.27 A number of options for holding the road have been considered as follows:
• Beach nourishment
• Beach recycling
• Revetment
• Sheet piled retaining wall
Slapton Coastal Zone Management Main Study Volume 1: Phase 1 Report (I)
August 2006, Scott Wilson
12-5
12.28 Shore perpendicular structures such as timber or rock groynes have not been included in this
appraisal since the problem experienced at the site is caused mainly by extreme storm events
against which groynes would afford little protection. Offshore structures such as breakwaters are
very expensive to construct and given the limited value of property at risk are unlikely to yield
and acceptable benefit cost ratio. They would also have a number of negative environmental
impacts, which are unlikely to make such structures acceptable.
Beach nourishment
12.29 Beach nourishment would involve importing a suitable material from an offshore source and
depositing it on the foreshore to provide additional material for the natural defences. Such an
option may not be acceptable from an environmental point of view due to the importance of the
beach material to the environmental value of the area. However, it would potentially be less
intrusive than the construction of hard defences and is a technically viable solution. Beach
recharge will therefore be included in the option appraisal in Chapter 14.
Beach recycling
12.30 Beach recycling has been carried out in the past with material moved in trucks from the
foreshore at Strete to the area affected by the erosion in January 2001. Such an operation could
be carried out on a regular basis in order to protect the most vulnerable areas of the Slapton
Line in combination with a regular monitoring programme.
12.31 There would be disturbance due to the movement of trucks, but it should be possible to mitigate
this. The use of material that already originates from the Slapton Line area would resolve the
potential problems associated with introducing a new material through beach recharge.
Revetment
12.32 The construction of a rock revetment would provide a hard defence against erosion that could
be designed to withstand the most severe events for the strategy period. However, the
introduction of hard defences into such an environmentally sensitive area poses problems.
Steel sheetpile retaining wall
12.33 A sheetpiling retaining wall, similar to that already built at Torcross, would act as a final line of
defence during extreme storm events. The wall would be constructed at the seaward side of the
road and would remain buried under the sand. If the beach were to be eroded during an
extreme event then such erosion could only progress as far as the sheetpile wall and the
structural stability of the road would be maintained. However, such vertical structures are highly
reflective and once exposed would lead to accelerated erosion in front of the wall.

Slapton Coastal Zone Management Main Study Volume 1: Phase 1 Report (I)
August 2006, Scott Wilson
12-6
Advance the Line 12.34 Advancing the line of the defences would involve either the construction of a large broad crested
revetment or substantial renourishment volumes beyond what would be required for coastal
defence purposes. Since such an option would require considerable expenditure without
providing a justifiably higher defence standard this option has not been considered further.
Managed Realignment 12.35 Managed realignment usually refers to the repositioning of defences further inland. However, in
this case it is more appropriate to refer to the realignment of the road that currently runs along
the crest of the barrier beach.
12.36 There are a number of options for realignment. One option would be to keep the road on the
Slapton Line but relocate it further back, thereby increasing the distance between the beach and
the road. This could be done in stages to spread out the cost and to deal with the most
vulnerable sections first. In the long term the beach is likely to eventually erode entirely, leading
to a breach of the barrier beach and hence the road. This option is essentially the same as the
Do Minimum Proactive option and so has not been considered separately.
12.37 The second option would be to relocate the road inland of the Ley, constructing a new link along
the west side of the Ley. While such an option would be technically viable it may be prohibitively
expensive.
12.38 The third option is to use the existing road network, with minor upgrades at junctions to make
the route acceptably safe.

Slapton Coastal Zone Management Main Study Volume 1: Phase 1 Report (I)
August 2006, Scott Wilson
12-7
Summary 12.39 Only the advance the line option has been discounted at this stage since it would be
considerably more expensive and environmentally intrusive than the other options, but offers no
advantages over the hold the line option
12.40 All options considered include a certain degree of environmental impact, which is considered
further in Chapter 13.
12.41 The financial viability of the options is considered in Chapter 14.
12.42 The final list of options is:
• Option 1: No Active Intervention i.e. no further investment in coastal defences or road
maintenance;
• Option 2: Beach Nourishment; increase beach width/height to prevent road
closure/damage;
• Option 3: Beach Recycling; extract beach material from the northern end, transport south
and widen beach in front of the existing road at the southern end of the beach;
• Option 4: Rock Revetment; construct a rock revetment along the seaward side of the
existing road on the upper beach;
• Option 5: Sheet Pile; construct sheet pile wall along the seaward edge of the existing road,
the top of the piling level with road;
• Option 6: Realign the existing road along the shingle ridge; retreat road to evade erosion;
• Option 7: Upgraded Route along existing road network landward of Slapton Ley;
• Option 8: New Road landward of Slapton Ley
Slapton Coastal Zone Management Main Study Volume 1: Phase 1 Report (I)
August 2006, Scott Wilson
12-1
12 Option Development
Introduction 12.1 The option development carried out as part of this study will lead to a strategic appraisal rather
than scheme specific appraisal, to fit in with the strategic framework for the area. The appraisal
considers broader shoreline management options rather than more specific ‘scheme scale’
options.
12.2 The broad scale options considered for this study are in accordance with guidance for shoreline
management:
• Do nothing (also described as ‘No Active Intervention’)
• Keep the Coast Road -Do minimum (short-term options)
• Keep the Coast Road (long-term options)
• Advance the line
• Managed realignment (of the road)
12.3 Within the context of these broad scale options, some more detailed options are considered in
order to fully understand the viability of the above management options. These more detailed
considerations include proactive and reactive do minimum options, forms of defence for the
purpose of holding the line and potential options for relocating the line of defence for the
managed realignment option.
12.4 The options development only considers the technical viability of options at this stage.
Environmental and economic issues are considered in later sections of this report.
12.5 Options development has been carried out in accordance with DEFRA’s PAG series of
documents, taking into account the latest changes following publication of the Treasury’s Green
Book. Options are defined and developed in this section and compared in Chapter 14. Since
the objective of this part of the study is to evaluate the viability of the hold the line option, the
selection of a preferred option is not carried out in detail. Instead, Chapter 17 provides
recommendations on how to proceed in Phases 2 and 3 of this study in order to determine the
final preferred management strategy.
Objectives 12.6 English Nature have indicated that although a breach of the barrier would cause them concern
since SSSI features could be affected; such a breach would be possible in future and
considered as part of the natural geomorphological evolution of the shingle barrier.

Slapton Coastal Zone Management Main Study Volume 1: Phase 1 Report (I)
August 2006, Scott Wilson
12-2
12.7 Analysis carried out as part of this study has shown that following a breach the number of
properties at risk from flooding would be less than 10. Furthermore, a breach would be unlikely
to remain open in the short to medium term.
12.8 The risk to human life and property is limited and the Slapton barrier beach is therefore unusual
in coast defence terms, in that a breach of the barrier would not necessarily have a significant
negative impact.
12.9 However, the road that runs along the barrier is of significant importance to the local community,
and the socio economic impact of losing this transport link is a critical factor in determining the
long-term strategy for this area. The main issue in determining the options for long-term
management of the Slapton Line is whether or not the road can be maintained in its current
position or whether alternative options should be considered. The shoreline management
standard concept of holding the line has therefore been recast as Keeping the Coast Road.
12.10 It is therefore important to distinguish between a breach in the barrier beach, leading to saline
intrusion into the freshwater Ley, and an erosion event or ‘breach’ to the road, leading to a loss
of the transport link but no physical breakdown of the barrier separating the Ley from the sea. In
order to make this distinction clear during the development of options the term road damage
event will be used to describe any event leading to the loss of the road as a functioning
transport link. The term breach will only be used to refer to events leading to a physical breach
in the barrier beach leading to saline intrusion into the Ley.
12.11 Based on the above issues, one key objective is maintaining the local infrastructure for socio-
economic reasons. The other is minimising adverse environmental impact.
No Active Intervention (Do Nothing) Introduction
12.12 The Do Nothing scenario forms the baseline case against which all other options are compared.
Under this scenario no action would be taken to protect the shingle ridge from erosion or to
mitigate the effects of erosion.
12.13 The development of a realistic Do Nothing scenario is essential for a rigorous appraisal of
options so that the most appropriate strategy is proposed.
12.14 As discussed in the previous section, the critical event in terms of the management of the
Slapton Line is an event leading to the destruction of the road, termed a road damage event.

Slapton Coastal Zone Management Main Study Volume 1: Phase 1 Report (I)
August 2006, Scott Wilson
12-3
Probability and timing of a road damage event
12.15 An analysis of shoreline evolution and the probability of destructive storm events has shown that
the most vulnerable section of the road is just either side of the recently relocated section
between Slapton and Strete. In this area the road would be damaged under an event similar to
that in January 2001, which has an estimated return period of 1 in 25 years. The annual
probability of a road damage event in a single storm or short sequence of storms is therefore
4%.
12.16 Given this probability a further road damage event can be expected to occur within the next ten
to twenty years. Since such an event is not primarily dependent on long-term erosion rates, but
rather the probabilistic occurrence of a storm with the required intensity and duration,
estimations of the timing of the event can only be given in probabilistic terms.
Breach mechanism
12.17 As the road construction is less easily eroded than the shingle beach, the presence of the road
will slow down the gradual erosion of the shingle barrier to some extent, although eventual
breaching of the barrier would inevitably take place in the long term. It is unlikely that a breach
will occur within the next 50 years, but possible that a breach could take place during the period
of concern for this study (100 years). This assumption is based on adoption of projections
consistent with the low emission climate change scenario.
Consequences of a breach
12.18 A complete breach of the shingle ridge would allow saline intrusion into Slapton Ley and would
alter the ecological make up of the area. However, it is likely that this would at first be temporary
and that the first breach would repair itself temporarily by natural means. Breaches would then
occur on a more frequent basis until eventually a permanent breach would be formed. Following
this the ecological makeup of Slapton Ley would be permanently changed into a saline
environment.
12.19 Roll back of the shingle barrier, and formation of tidal inlets due to breaching, would expose
areas of the Slapton coast to flooding and wave action. One such area is likely to be in
Torcross, where properties currently lie very close to the shores of Slapton Ley. If the barrier
was to roll back as shown by the geomorphological projections, then it would be necessary to
protect Torcross by extension of the existing sea wall along the coast and linking in with the
barrier location.
12.20 Other impacts expected within the 100-year study period are likely to be limited to loss of the
monument, car park and road with the associated socio economic, and historic environmental
impacts.

Slapton Coastal Zone Management Main Study Volume 1: Phase 1 Report (I)
August 2006, Scott Wilson
12-4
Do Minimum 12.21 For the purpose of this study the Do Minimum option has been divided into reactive and
proactive approaches. Both would maintain the coast road for a limited period of time.
12.22 If a road damage event were to occur then emergency repairs would be carried out to reinstate
the road or at least make it passable in one direction. The advantage of such an approach
would be that the residual strength of the existing natural defences would be used to the full and
financial input would not be required until a road damage event occurred. However, the
disruption caused by such an event and by the emergency repairs required afterwards would be
likely to be significant, and no planning with regard to the timing of expenditure would be
possible.
12.23 The proactive Do Minimum option would involve close monitoring of the beaches and road in
order to be able to carry out works to protect the road from undermining just before any actual
damage occurs. Clearly it would not always be possible to accurately predict when such works
would be necessary and the risk of unexpected damage to the road would have to be accepted,
although an agreed management plan, including action and emergency trigger levels, could be
used to reduce this risk. Planning with regard to expenditure might be limited under such an
option. The advantage of this scenario would be similar to the reactive option in that the existing
defences would be used until the last moment.
12.24 This option would need to include provision for protection of the 20 or so buildings at Torcross at
some point in the future.
12.25 Both these options are technically viable, and since these options do not result in an
unacceptably high risk to human life or property they will be included in the options appraisal in
Chapter 14.
Keep the Coast Road 12.26 This option would involve a commitment to maintain the current position of the road for the
duration of the study period – 100 years. Since the analysis of beach processes has shown that
some sections of the road will be at risk of undermining, the construction of some form of
defence would be required in order to guarantee the structural stability of the road.
12.27 A number of options for holding the road have been considered as follows:
• Beach nourishment
• Beach recycling
• Revetment
• Sheet piled retaining wall

Slapton Coastal Zone Management Main Study Volume 1: Phase 1 Report (I)
August 2006, Scott Wilson
12-5
12.28 Shore perpendicular structures such as timber or rock groynes have not been included in this
appraisal since the problem experienced at the site is caused mainly by extreme storm events
against which groynes would afford little protection. Offshore structures such as breakwaters are
very expensive to construct and given the limited value of property at risk are unlikely to yield
and acceptable benefit cost ratio. They would also have a number of negative environmental
impacts, which are unlikely to make such structures acceptable.
Beach nourishment
12.29 Beach nourishment would involve importing a suitable material from an offshore source and
depositing it on the foreshore to provide additional material for the natural defences. Such an
option may not be acceptable from an environmental point of view due to the importance of the
beach material to the environmental value of the area. However, it would potentially be less
intrusive than the construction of hard defences and is a technically viable solution. Beach
recharge will therefore be included in the option appraisal in Chapter 14.
Beach recycling
12.30 Beach recycling has been carried out in the past with material moved in trucks from the
foreshore at Strete to the area affected by the erosion in January 2001. Such an operation could
be carried out on a regular basis in order to protect the most vulnerable areas of the Slapton
Line in combination with a regular monitoring programme.
12.31 There would be disturbance due to the movement of trucks, but it should be possible to mitigate
this. The use of material that already originates from the Slapton Line area would resolve the
potential problems associated with introducing a new material through beach recharge.
Revetment
12.32 The construction of a rock revetment would provide a hard defence against erosion that could
be designed to withstand the most severe events for the strategy period. However, the
introduction of hard defences into such an environmentally sensitive area poses problems.
Steel sheetpile retaining wall
12.33 A sheetpiling retaining wall, similar to that already built at Torcross, would act as a final line of
defence during extreme storm events. The wall would be constructed at the seaward side of the
road and would remain buried under the sand. If the beach were to be eroded during an
extreme event then such erosion could only progress as far as the sheetpile wall and the
structural stability of the road would be maintained. However, such vertical structures are highly
reflective and once exposed would lead to accelerated erosion in front of the wall.
Slapton Coastal Zone Management Main Study Volume 1: Phase 1 Report (I)
August 2006, Scott Wilson
12-6
Advance the Line 12.34 Advancing the line of the defences would involve either the construction of a large broad crested
revetment or substantial renourishment volumes beyond what would be required for coastal
defence purposes. Since such an option would require considerable expenditure without
providing a justifiably higher defence standard this option has not been considered further.
Managed Realignment 12.35 Managed realignment usually refers to the repositioning of defences further inland. However, in
this case it is more appropriate to refer to the realignment of the road that currently runs along
the crest of the barrier beach.
12.36 There are a number of options for realignment. One option would be to keep the road on the
Slapton Line but relocate it further back, thereby increasing the distance between the beach and
the road. This could be done in stages to spread out the cost and to deal with the most
vulnerable sections first. In the long term the beach is likely to eventually erode entirely, leading
to a breach of the barrier beach and hence the road. This option is essentially the same as the
Do Minimum Proactive option and so has not been considered separately.
12.37 The second option would be to relocate the road inland of the Ley, constructing a new link along
the west side of the Ley. While such an option would be technically viable it may be prohibitively
expensive.
12.38 The third option is to use the existing road network, with minor upgrades at junctions to make
the route acceptably safe.
Slapton Coastal Zone Management Main Study Volume 1: Phase 1 Report (I)
August 2006, Scott Wilson
12-7
Summary 12.39 Only the advance the line option has been discounted at this stage since it would be
considerably more expensive and environmentally intrusive than the other options, but offers no
advantages over the hold the line option
12.40 All options considered include a certain degree of environmental impact, which is considered
further in Chapter 13.
12.41 The financial viability of the options is considered in Chapter 14.
12.42 The final list of options is:
• Option 1: No Active Intervention i.e. no further investment in coastal defences or road
maintenance;
• Option 2: Beach Nourishment; increase beach width/height to prevent road
closure/damage;
• Option 3: Beach Recycling; extract beach material from the northern end, transport south
and widen beach in front of the existing road at the southern end of the beach;
• Option 4: Rock Revetment; construct a rock revetment along the seaward side of the
existing road on the upper beach;
• Option 5: Sheet Pile; construct sheet pile wall along the seaward edge of the existing road,
the top of the piling level with road;
• Option 6: Realign the existing road along the shingle ridge; retreat road to evade erosion;
• Option 7: Upgraded Route along existing road network landward of Slapton Ley;
• Option 8: New Road landward of Slapton Ley
Slapton Coastal Zone Management Main Study Volume 1: Phase 1 Report (I)
August 2006, Scott Wilson
13-1
13 Environmental & Socio-economic Appraisal
13.1 This chapter reviews the implications of the possible options (Chapter 12) on the environment,
using the baseline information in accordance with TAG methodology. The TAG methodology
has developed from and incorporates many of the features of GOMMS. Specific guidance is
provided in the TAG Unit 3.3.1 on the approach taken to appraising options against
environmental objectives.
13.2 The appraisal tables within Chapter 15 provide an overview on the environmental and socio-
economic implications of each option. In accordance with the TAG guidance the assessment
and appraisal of the options is at a level of detail sufficient to compare them in order to allow for
the decision making process to be taken forward. Within this assessment, an abbreviated form
of the TAG methodology has been used and a weighted scoring system introduced to enable
some rudimentary quantitative comparison between options.
13.3 The options have been assessed in terms of their impact on ecology, geomorphology,
heritage/archaeology, landscape and socio-economic criteria. At the time of writing this report
(October 2004) the socio-economic appraisals were awaiting the results of the business survey.
However, tentative qualitative appraisals have been made by Atlantic Consultants having
considered the likely changes arising from retention or loss of the existing road and its possible
replacement with an alternative route. Although transportation issues are reviewed within this
chapter, they are not included within the scoring system adopted as it is felt that this would lead
to substantial double counting as the transportation issues and solutions underpin many of the
other assessments, most notably for socio-economic criteria.
13.4 The future routing of the South-West Coast Path National Trail is not considered within the
options reviewed below. The issue might variously sit (at least in part) within the landscape, the
socio-economic or the transportation appraisals. The current route of the trail follows the
Slapton Line and retaining its alignment will depend on the physical presence of the shingle
ridge, but not the retention of the road. Retention of the existing route in the long term is thus
dependant upon options (or a combinations of options) that maintain the Slapton Line. In the
event of abandonment of the Line, it likely that the existing route could be retained for
substantially longer that the road alignment. By the time when actual physical fragmentation of
the shingle bar occurs, an inland route would need to have been identified. Potential routes for
this exist in part although substantial elements of new footpath would need to be designated and
potentially two crossings of reed bed areas and streams by boardwalks would be required. The
latter may however prove unacceptable from an ecological perspective, requiring major
rerouting of the Trail further inland.
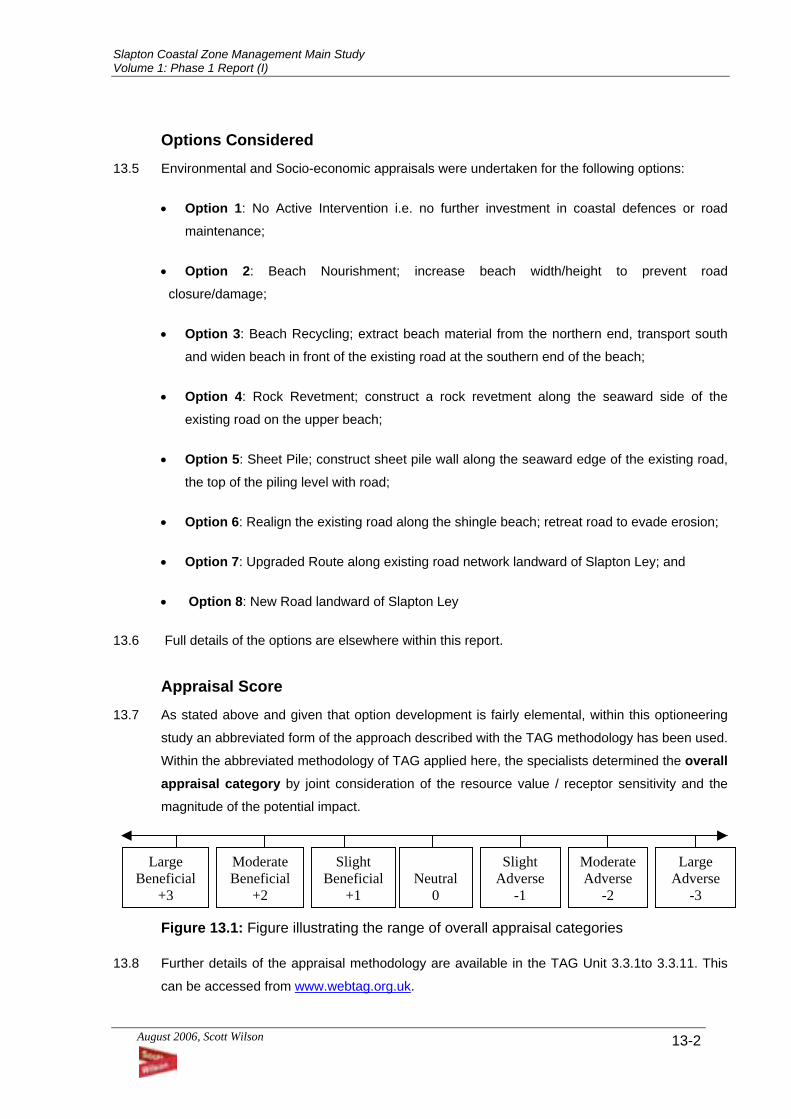
Slapton Coastal Zone Management Main Study Volume 1: Phase 1 Report (I)
August 2006, Scott Wilson
13-2
Options Considered 13.5 Environmental and Socio-economic appraisals were undertaken for the following options:
• Option 1: No Active Intervention i.e. no further investment in coastal defences or road
maintenance;
• Option 2: Beach Nourishment; increase beach width/height to prevent road
closure/damage;
• Option 3: Beach Recycling; extract beach material from the northern end, transport south
and widen beach in front of the existing road at the southern end of the beach;
• Option 4: Rock Revetment; construct a rock revetment along the seaward side of the
existing road on the upper beach;
• Option 5: Sheet Pile; construct sheet pile wall along the seaward edge of the existing road,
the top of the piling level with road;
• Option 6: Realign the existing road along the shingle beach; retreat road to evade erosion;
• Option 7: Upgraded Route along existing road network landward of Slapton Ley; and
• Option 8: New Road landward of Slapton Ley
13.6 Full details of the options are elsewhere within this report.
Appraisal Score 13.7 As stated above and given that option development is fairly elemental, within this optioneering
study an abbreviated form of the approach described with the TAG methodology has been used.
Within the abbreviated methodology of TAG applied here, the specialists determined the overall appraisal category by joint consideration of the resource value / receptor sensitivity and the
magnitude of the potential impact.
Figure 13.1: Figure illustrating the range of overall appraisal categories 13.8 Further details of the appraisal methodology are available in the TAG Unit 3.3.1to 3.3.11. This
can be accessed from www.webtag.org.uk.
Large Beneficial
+3
Moderate Beneficial
+2
Slight Beneficial
+1
Slight Adverse
-1
Moderate Adverse
-2
Large Adverse
-3
Neutral
0
Slapton Coastal Zone Management Main Study Volume 1: Phase 1 Report (I)
August 2006, Scott Wilson
13-3
13.9 In order to compare the various options against each other, the methodology has been
extended using an amended version of a weighted scoring system used successfully for a
coastal scheme in Yorkshire. The conversion factors and weighting are defined in detail within
Chapter 15, which also includes the integrated assessment tables for technical, socio-economic
and environmental sub-objectives.
Ecology Existing Situation
13.10 The Ecology baseline for Slapton Ley and its immediate environs has been well documented
through the activities of the Slapton Ley Field Centre and other organisations and individuals
who have studied the various floral and faunal groups at this important wildlife site. The site is
designated as a Site of Special Scientific Interest (SSSI) and a National Nature Reserve (NNR),
with the detail documented in Chapter 4 ‘The Ecological Baseline’.
13.11 In summary, the reasons for designation as a SSSI are:
• Coastal Geomorphology;
• Vegetated shingle;
• Open water;
• Reed-bed, tall-herb fen and fen woodland;
• Breeding bird assemblage of ‘Lowland open waters and their margins’
Breeding Cetti’s warbler (nationally important breeding bird);
• Non-breeding passage birds;
• Wintering bittern (nationally important wintering bird);
• Vascular plant assemblage (including strapwort); and
• Lichen assemblage.
13.12 The NNR was designated for the following reasons:
• Slapton Ley is the largest natural freshwater lake in South West England;
• The shingle barrier is a nationally important example of a bay barrier;
• Slapton Ley demonstrates better than any other site in the British coast, the links between
seabed features and shoreline landforms;
• The reedbeds and rich fen and willow carr vegetation of the Leys support a very diverse
flora and fauna with one national rarity;
Slapton Coastal Zone Management Main Study Volume 1: Phase 1 Report (I)
August 2006, Scott Wilson
13-4
• There are over 2000 species of macro and micro fungi, 29 of which are described are new
to science; and
• Slapton Ley is an important staging post for wintering and passage birds.
• A number of locally designated County Wildlife Sites and Local Wildlife Sites are also
present within the study area.
• The nature conservation value of the SSSI/NNR is considered to be High. Locally
designated sites within the wider study area are considered to be of Medium importance,
whilst other undesignated habitats are likely to be of Negligible to Medium importance.
Potential Impacts
13.13 Impacts of the options on the geomorphology are addressed in the Geomorphological Section.
Option 1: No Active Intervention
13.14 If no shoreline management works or works to the existing A379 are undertaken, the shingle
barrier will migrate inland in response to rising sea levels. At the same time there will be
increased potential for breaching or over washing. Although in the short-medium term,
breaches are not expected to be permanent, tidal flows or over-washing will result in the
seawater inputs into the Ley causing a change in habitats and species. This would be a major
negative impact on the existing features of the SSSI/NNR that are dependent on a freshwater
influence. However, the saline influence would probably create habitats of at least equal
importance to those that are already present, such that there could be an overall neutral impact
on the SSSI/NNR, dependant on the magnitude of changes that occur and the relative value of
the habitats. Over the longer term, it is likely that there will be net loss of wetland habitat (of any
type) as it is squeezed against the hinterland. However given that the magnitude of change is
difficult to predict, for the purposes of this appraisal a neutral effect is given to this option
(Overall Appraisal Category = 0).
Option 2: Beach Nourishment
13.15 This option would provide protection for the inland features of the SSSI/NNR assuming that
nourishment raises the crest of the shingle bank relative to sea level. The placement of
imported material on to the beach, presumably at the southern end close to Torcross, would
also provide some element of protection to the existing shingle vegetation further north. It is
anticipated that, with appropriate mitigation during the import of material, this option would result
in a neutral effect (no observable impact in either direction) on ecology resources within the
project area (Overall Appraisal Category = 0)
Slapton Coastal Zone Management Main Study Volume 1: Phase 1 Report (I)
August 2006, Scott Wilson
13-5
Option 3: Beach Recycling
13.16 As for Option 2, this option would provide protection for inland features of the SSSI/NNR
assuming that nourishment raises the crest of the shingle bank relative to sea level. It would
also protect the existing shingle vegetation, described in Chapter 4. It is anticipated that this
option would result in a neutral impact on ecological resources, giving rise to a neutral effect
score for this option (Overall Appraisal Category = 0)
Option 4: Rock Revetment
13.17 The construction of a rock revetment along the road on the upper beach would provide
protection for the inland features of the SSSI/NNR. In the long-term the revetment would
prevent the landward movement of the shingle barrier and could also result in the possible
erosion of the existing beach. This erosion would, in turn, result in a loss of the shingle
vegetation that represents several stages of landward zonation in the colonisation of the shingle.
In the longer term fixing the crest height will result in an increased overwashing ratio and hence
salt water inputs to the Ley. It is also possible that there will be impacts on overall barrier
permeability (reduced) and resultant changes in water level with the Ley. Overall, the impact is
anticipated to be of intermediate negative magnitude in the long-term, giving rise to a large
adverse effect (Overall Appraisal Category = -3).
Option 5: Sheet Pile
13.18 As for Option 4 Rock Revetment, Option 5 Sheet Pile would prevent the landward movement of
the shingle barrier resulting in a long-term loss of shingle vegetation. In the longer term fixing
the crest height will result in an increased overwashing ratio and hence salt water inputs to the
Ley. It is also possible that there will be impacts on overall barrier permeability (reduced) and
resultant changes in water level with the Ley. The reduction is permeability would be greater
than for rock revetment protection (Option 4). This is considered to be a long-term intermediate
negative impact, giving rise to a large adverse effect (Overall Appraisal Category = -3).
Option 6: Realign the existing Coast Road on Slapton Line
13.19 This option would allow the landward movement of the shingle barrier and probably the
establishment of new vegetated shingle areas. Associated protection, that will be necessary for
the medium to long-term retention of the realigned road, would provide protection for the inland
features of the SSSI/NNR. However, the realignment of the existing road along the shingle
barrier would probably result in the loss of some scrub habitats from the SSSI/NNR. In the
longer term fixing the crest height (the new road alignment) will probably result in an increased
over-washing ratio and hence salt water inputs to the Ley. With appropriate advance mitigation
for the loss of habitat during construction, it is likely that an adverse habitat effect can be
Slapton Coastal Zone Management Main Study Volume 1: Phase 1 Report (I)
August 2006, Scott Wilson
13-6
avoided and for the purposes of this assessment, a neutral effect is predicted (Overall Appraisal
Category = 0). It is however possible that it may not be possible to re-create vegetated shingle
habitats on the seaward side of the new alignment and there could be a net loss of this habitat
(M Lees in litt.)
Option 7: Upgraded Existing Roads Landward of Slapton Ley
13.20 The abandonment of the existing road in favour of a newly upgraded route corridor landward of
Slapton Ley, involving upgrading of existing roads, would allow natural processes along the
shingle beach to occur unhindered, including barrier migration, increased saltwater inflows and
net loss of existing wetland habitats over time. There would be some local habitat related
impacts inland where upgrading was required although this should be outside sites designated
for their nature conservation importance. It is accepted that this option would result in the
breach in the long term of the shingle barrier, with the existing freshwater lake becoming a
saline lagoon. This would probably be a major negative impact on the fresh water features of
the SSSI/NNR although it is possible that, over time, freshwater habitats could migrate up the
low-lying river valleys. However, the saline influence would probably create habitats of at least
equal importance to those that are already present, such that there could be an overall neutral
impact on the SSSI/NNR, dependant on the magnitude of changes that occur and the relative
value of the habitats. Over the longer term, it is likely that there will be net loss of wetland
habitat (of any type) as it is squeezed against the hinterland. However given that the magnitude
of change is difficult to predict, for the purposes of this appraisal, and to account for habitat
losses along the upgraded inland route, a slight adverse effect is given to this option (Overall
Appraisal Category = -1).
Option 8: New Road Landward of Slapton Ley
13.21 As for Option 7, the abandonment of the existing road in favour of a new road just landward of
Slapton Ley, would also allow natural processes along the shingle beach to occur unhindered,
including barrier migration, increased saltwater inflows and net loss of existing wetland habitats
over time. As for option 7, it is accepted that this would result in the breach in the long term of
the shingle barrier, with the existing freshwater lake becoming a saline lagoon. This would
result in a change in those habitats and species present within and around Slapton Ley at that
point in time. However, the saline influence would probably create habitats of at least equal
importance to those that are already present, such that there could be an overall neutral impact
on the SSSI/NNR, dependant on the magnitude of changes that occur and the relative value of
the habitats. Over the longer term, it is likely that there will be net loss of wetland habitat (of any
type) as it is squeezed against the hinterland.
Slapton Coastal Zone Management Main Study Volume 1: Phase 1 Report (I)
August 2006, Scott Wilson
13-7
13.22 For the purposes of this assessment and given that there are no obvious unprotected possible
route corridors just inland of the Ley, it is assumed that a new ‘theoretical’ road, along a
preferred engineering alignment, would follow the western boundary of the Ley. This would
result in the loss of wetland habitats from the SSSI/NNR and would be likely to result in the loss
of hedgerows and farmland. This would be a major negative impact, giving rise to a large
adverse effect. Any new bridge, or road works could result in a substantial loss of habitats and
impacts on sensitive species.
13.23 Although it is possible that impacts to the Ley as a result of the increased salinity are difficult to
predict (and are judged here to be neutral for this assessment), the likely substantial losses to
habitats within protected areas for a new road corridor will give rise to a large adverse effect
(Overall Appraisal Category = -3)
Geomorphology Existing Situation
13.24 Slapton Sands is one of a series of shingle barrier beaches along the east-facing shoreline of
Start Bay. These beaches are composed predominantly of fine gravels and small pebbles with
flint the dominant sediment type. There is a gradual decrease in beach crest height and
coarsening of the beach material towards the south. These beaches can also be regarded as
swash aligned i.e. the beach planform is adjusted to an orientation that minimises the angle
between shoreline and approaching wave crest so limiting net longshore sediment transport.
Full details of the geomorphologic interests are described in Chapter 5 ‘Geomorphology
Baseline’.
13.25 The potential impacts of scheme options on the geomorphology of the Slapton barrier beach
have been considered in terms of:
1. Impact on the GCR interest of the site:
• Distinctive beach materials i.e. flints and chert shingle, with little local material;
• Longshore sediment grading i.e. sediment size increases towards the south;
• The easterly aspect of the beach i.e. a unique barrier orientation for the south coast of
England.
2. Impact on the dynamic behaviour of the barrier beach:
• Longshore sediment transport;
• Beach profile changes i.e. overtopping (barrier crest height increases) and overwashing
(reduction in barrier crest height and transfer of material to the back beach).
Slapton Coastal Zone Management Main Study Volume 1: Phase 1 Report (I)
August 2006, Scott Wilson
13-8
13.26 Note that this assessment does not consider impacts on the hydrological connectivity between
the barrier and the lagoons/wetlands.
13.27 Note that it is assumed that the “hold the line” options would provide protection for the entire
barrier section of the beach. Partial protection schemes would have additional impacts over and
above those described here.
Barrier Beach Behaviour
13.28 Two components of beach behaviour are important considerations for the purposes of this
assessment:
1. Longshore sediment transport; the longshore component of wave power (i.e. sediment transport
potential) is related to the wave approach angle relative to the shoreline. Longshore wave power
(PL) is defined by:
PL = 0.5 (EC) sin 2β
(β is the angle between the wave crest and the shoreline; E (wave energy density) = 1/8 ρgH2 and Cb (wave phase velocity) = (2gHb)0.5)
2. Profile response to surging waves; surge flows up the beach face include:
• Overtopping surge that transports material up the beach face and leads to increase in crest
height;
• Overwashing surge that carries gravel over the crest and towards the back-beach. This
involves a greater magnitude of surge than overtopping events.
The overwashing ratio is the proportion of waves of sufficient magnitude to generate overwash events.
Beach behaviour involves, therefore, brief episodes of overwashing and crest lowering, followed by
longer periods of recovery during which the “damage” to the beach crest caused by storm events is
“healed” during overtopping surge events.
Slapton Coastal Zone Management Main Study Volume 1: Phase 1 Report (I)
August 2006, Scott Wilson
13-9
The overwashing ratio (OWR) is a function of the wave climate and the barrier crest height relative
to sea level (Orford et al 1995). It is a measure of the potential for breaching. A number of conditions
can be defined:
Barrier Crest Constant
Barrier Crest Increase
Barrier Crest Decrease
Sea-level fall OWR decrease OWR decrease OWR constant*
Sea-level constant OWR constant OWR decrease OWR increase
Sea-level rise OWR increase OWR constant* OWR increase
Note: * assumes that crest height change is equivalent to sea-level change.
Increased storminess is likely to be accompanied by an increase in overwashing ratio.
Potential Impacts Option 1: No Active Intervention
13.29 The barrier beach will migrate inland, becoming progressively anchored onto hinterland slopes.
Eventually this will lead to the formation of a fringing beach. In addition there is likely to be a
loss of the barrier beach and back barrier wetlands. In geomorphologic terms the potential
impact of this option is considered to be neutral (Overall Appraisal Category = 0).
This option could potentially affect the wetland areas of the Higher and Lower Leys, as any
option that is likely to increase the overwashing ratio will increase the threat to these habitats.
These issues are addressed in the ecology appraisal.
Option 2: Beach Nourishment
13.30 This option will involve the potential altering of the beach composition by placing ‘alien’ material
onto the beach. Furthermore, the composition of the imported material could have an effect on
the shingle barberries permeability with allied effects on the water levels in the Lower Ley.
It is also likely that the associated beach widening will result in the extension of the beach profile
into deeper water impacting on the dynamic behaviour of the barrier beach. This will result in a
higher wave energy setting than the current beach profile, leading to an increase in longshore
wave power and sediment transport rates and is likely to result in an acceleration of beach face
erosion.
The effect on the geomorphology of this option would indicate an intermediate negative impact
that is therefore likely to be large adverse effect (Overall Appraisal Category -3).
Slapton Coastal Zone Management Main Study Volume 1: Phase 1 Report (I)
August 2006, Scott Wilson
13-10
Option 3: Beach Recycling
13.31 As with Option 2, Beach Recycling will result in the extension of the beach profile into deeper
water impacting on the dynamic behaviour of the barrier beach. This will result in a higher wave
energy setting than the current beach profile, leading to an increase in longshore wave power
and sediment transport rates and an acceleration of beach face erosion. However beach
grading is likely to become re-established over time.
Furthermore, removal of beach material from the north (i.e. in front of the Strete Gate to Pilchard
Cove cliff line) will cause beach lowering/narrowing in this area. This could lead to increased cliff
recession along this section, although increased northwards sediment transport from the barrier
section may offset these beach changes. The effect on the geomorphology of this option would
indicate an intermediate negative impact that is therefore likely to be slight to moderate adverse
effect (Overall Appraisal Category -1 to -2)
Option 4: Rock Revetment
13.32 Barrier crest protection (i.e. rock revetments) will cause a reduction in the up-beach transport of
sediment by surging waves. Although this will reduce the tendency for barrier retreat (i.e. roll-
over), it will also prevent crest height increase during overtopping events. As sea level rises, the
net effect will be a reduction in the relative crest height and, hence, an increase in the
overwashing ratio and increased likelihood of overwashing of the road, beach face and crest
erosion and breaching (Figure 13.2). The revetment may affect the water levels in the lower Ley
due to changes in the barberries permeability.
The effect on the geomorphology of this option would indicate an intermediate negative impact
that is therefore likely to be large adverse effect (Overall Appraisal Category -3).
Option 5: Sheet Pile
13.33 Barrier crest protection (i.e. piling) will cause a reduction in the up-beach transport of sediment
by surging waves. Although this will reduce the tendency for barrier retreat (i.e. roll-over), it will
also prevent crest height increase during overtopping events. As sea level rises, the net effect
will be a reduction in the relative crest height and, hence, an increase in the overwashing ratio
and increased likelihood of overwashing of the road, beach face and crest erosion and
breaching (Figure 13.2).
This option would have no effect on the composition of the beach materials or the easterly
orientation of the beach, nor would it result in the disruption of the longshore beach grading.
However, the sheet pile may affect the water levels in the lower Ley due to changes in the
barberries permeability. The effect on the geomorphology of this option would indicate an
Slapton Coastal Zone Management Main Study Volume 1: Phase 1 Report (I)
August 2006, Scott Wilson
13-11
intermediate negative impact that is therefore likely to be a large adverse effect (Overall
Appraisal Category -3)
Option 6: Realign the existing Coast Road
13.34 This option would have no direct effect on the barrier beach. However, the dynamic behaviour of
the barrier beach would be affected if overwash material is removed from road surface and
returned to beach face, rather than allowed to migrate inland, preventing barrier beach
migration. As sea level rises, this will lead to a reduction in the relative crest height, an increase
in the overwashing ratio (OWR) and increased likelihood of overwashing of the road,
crest/beach face erosion and breaching.
There would not be any effect on the composition, grading or orientation of the beach as a result
of this option. As there would be no observable impact in either direction this option will score
neutral (Overall Appraisal Category = 0).
This option would potentially affect the wetland areas of the Higher and Lower Leys, as any
option that is likely to increase the overwashing ratio will increase the threat to these habitats.
These are addressed in the ecology appraisal.
Option 7 and Option 8: Upgraded Existing Roads Landward of Slapton Ley & New
Road Landward of Slapton Ley
13.35 The abandonment of the existing road in favour of a new road or an upgraded route landward of
Slapton Ley would allow the barrier beach to migrate inland, becoming progressively anchored
onto the hinterland slopes, and forming a fringing beach. Over time, this would result in the loss
of the barrier beach and back-barrierrier wetlands. It would not however affect the composition
of the beach materials, there would be neither disruption of longshore beach grading nor any
change to the Easterly beach orientation.
13.36 A new road l or an upgraded route landward of Slapton Ley would also have a likely effect on
the hill slopes by impacting on the soils, slopes, surface and groundwater – the exact impacts
dependant on the final alignment and design. These two options are considered as having a
neutral impact on the geomorphology of the barrier beach, whilst the effect of these options on
the hill slopes is considered to have a slightly adverse impact on the geomorphology (depending
on the alignment and design of the road) and therefore both are given a slight adverse score
(Overall Appraisal Category = -1).
13.37 It is difficult to provide reliable estimates about the timing, rate and significance of the impacts,
especially the change in overwashing ratio. However, current views of shingle barrier behaviour
suggest that although protection works will reduce the likelihood of breaching in the short term

Slapton Coastal Zone Management Main Study Volume 1: Phase 1 Report (I)
August 2006, Scott Wilson
13-12
(e.g. 5 – 10 years), over time (>10 years) the chances of a “catastrophic change” will increase
(e.g. Orford 2001). In reality, the potential for overwashing-induced breach will be controlled by
the crest height of any defence line. Further details are provided in Chapter 5 ‘Geomorphology
Baseline – Conceptual Framework’.
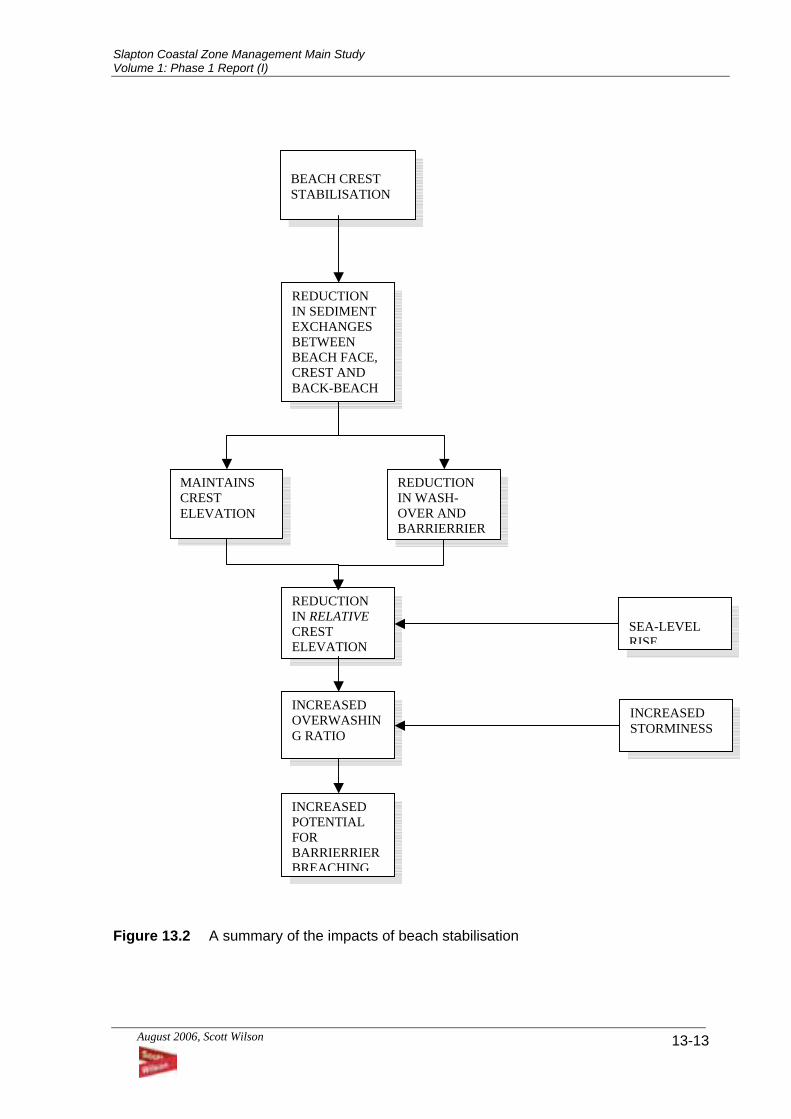
Slapton Coastal Zone Management Main Study Volume 1: Phase 1 Report (I)
August 2006, Scott Wilson
13-13
Figure 13.2 A summary of the impacts of beach stabilisation
BEACH CREST STABILISATION
REDUCTION IN SEDIMENT EXCHANGES BETWEEN BEACH FACE, CREST AND BACK-BEACH
MAINTAINS CREST ELEVATION
REDUCTION IN WASH-OVER AND BARRIERRIER
SEA-LEVEL RISE
REDUCTION IN RELATIVE CREST ELEVATION
INCREASED OVERWASHING RATIO
INCREASED POTENTIAL FOR BARRIERRIER BREACHING
INCREASED STORMINESS
Slapton Coastal Zone Management Main Study Volume 1: Phase 1 Report (I)
August 2006, Scott Wilson
13-14
Archaeology Existing Situation
13.38 The baseline assessment for the Slapton Line identified a number of archaeological sites within
a 3km radius of the road. The sites represented date from the prehistoric to modern period and
include prehistoric earthworks, artefact scatters and post-medieval features/structures. The
majority of the sites recorded are not located within close proximity of the proposed options
therefore the impact on these is regarded as negligible. However, sites, which may be impacted
upon, include prehistoric earthworks, medieval features, post-medieval buildings and World War
II defensive sites.
13.39 Situated within the northwestern, southwestern and northeastern extent of the study area are
clusters of prehistoric, medieval, post-medieval and modern sites, which are outlined in the
baseline study. This would suggest extensive activity within these areas. It is likely that similar
sites may occur which may be affected by the proposed options.
13.40 Located within the immediate vicinity of Slapton Line are a number of World War II defensive
structures, which were either built in 1940, or between 1943 and 1944. Those built in 1940 were
constructed to deter a German invasion. In 1943 the area surrounding the Slapton Line was
designated as the Slapton Battle Training Area. A number of structures including pillboxes and
gun emplacements were constructed to allow for the invasion of Europe to be rehearsed. It is
reported that during one exercise code named Tiger, German E-boats successfully infiltrated the
defences. There are a number of structures including pillboxes and gun emplacements, which
still survive in the area. These bear testament to the part that Slapton played in the Defence of
Britain thus are of importance to the heritage of the area.
13.41 To reference the full list of sites affected please refer to table in Chapter 6.
Potential Impacts
Option 1: No Active Intervention
13.42 If no active intervention is undertaken it is likely that a number of archaeological/historical sites
will be destroyed or impacted upon by natural erosion processes. These sites include prehistoric
defensive sites and artefact scatters, post-medieval buildings, a shipwreck and World War II
defensive sites. Similarly the unknown archaeological resource along the barrier beach will be
affected. The impact of this option is considered to be moderate adverse (Overall Appraisal
Category = -2).
Known Sites possibly affected (23, 30, 31, 51, 56, 59, 77, 78, 79, 80, 143, 162-167 & 171-173).
Slapton Coastal Zone Management Main Study Volume 1: Phase 1 Report (I)
August 2006, Scott Wilson
13-15
Option 2: Beach Nourishment
13.43 It is possible that dredging associated with works undertaken for Option 2 may impact on
unknown archaeological remains associated with the marine environment and/or wreck sites. It
is also likely that nourishment would bury/conceal artefacts that are emerging from the beach
face. This option is therefore considered to have a moderate adverse effect (Overall Appraisal
Category = -2).
Option 3: Beach Recycling
13.44 It is likely in the short-term that operations associated with beach recycling will lead to increased
erosion within close proximity to the northern extent of the Slapton Line. This will indirectly
impact upon World War II Defensive sites and may directly impact upon possible remains
associated with the prehistoric scatter (102) discovered within the northern extent of Slapton
Ley. It is also likely that re-cycling would bury/conceal artefacts that are emerging from the
beach face and its also possible that unknown archaeological sites may be affected. This option
is considered as having a slight adverse effect (Overall Appraisal Category = -1).
Known Sites possibly affected (102, 77, 171-173).
Option 4 and Option 5: Rock Revetment and Sheet Pile
13.45 It is likely that groundworks and/or main construction works associated with options 4 and 5 will
directly or indirectly impact on prehistoric sites and World War II defensive sites (including pill
boxes and gun emplacements) located within close proximity to the Slapton Line. Similarly
operations associated with these options may impact on the unknown archaeological resource,
however, such remains may have been destroyed by the construction of the existing road. It is
therefore considered that either of these options would have a slight/moderate effect (Overall
Appraisal Category = -1 to -2)
Known Sites possibly affected (30, 31, 77, 102, 143, 163-166 and 171-173) Option 6: Realign the existing Coast Road
13.46 Ground works and or main construction works are likely to directly impact on the known and
unknown archaeological sites within close proximity to the proposed road option. Those sites
recorded date from the prehistoric to modern period and include prehistoric standing stones and
artefact scatters, medieval and post-medieval features and World War II defensive sites
including pillboxes and gun emplacements.
There are a number of historic buildings and structures within the study area that date from the
medieval to modern period. These either carry a statutory or local listing and include churches,
priories, crosses, public houses and bridges. The majority of these will not be impacted upon,
Slapton Coastal Zone Management Main Study Volume 1: Phase 1 Report (I)
August 2006, Scott Wilson
13-16
however, those located within close proximity to the line including the coast guard station (23), a
public house (56) and kennels (59) will be either directly or indirectly affected upon by this
option. It is therefore considered that this option will have a moderate to large adverse effect
(Overall Appraisal Category -2 to -3)
Known Sites possibly affected (12, 23, 30, 31, 51, 52, 56, 59, 69, 70, 77, 78, 79, 80, 93,102,
132-135, 162-167, 169-173)
Option 7 and Option 8: Upgraded Existing Roads Landward of Slapton Ley & New
Road Landward of Slapton Ley
13.47 Both of these options could potentially have a significant impact on the known and unknown
archaeological resource in the area, as demonstrated by the number of archaeological sites
recorded within in close proximity to the road option. The sites recorded within near vicinity to
the line date from the prehistoric to modern period and include prehistoric standing stones,
prehistoric artefact scatters, medieval and post-medieval features and World War II pillboxes
and gun emplacements. These may be impacted upon during groundworks associated with the
construction of the road and associated bridge. Similarly the setting of surviving structures
including pillboxes may be affected. A new road (Option 8) would passes through a rural
landscape which has not been impacted upon by modern development, therefore there is
potential for archaeological sites to be discovered during groundworks. The potential would be
reduced for the upgrade of existing roads.
13.48 A number of historic buildings and structures are recorded within the study area (encompassing
a new alignment inland of the Ley but not all of likely route of upgraded roads) date from the
medieval to modern period. These either carry a statutory or local listing and include churches,
priories, crosses, public houses and bridges. Most of these will not be impacted upon, however,
those within close proximity to Option 8 including a public house (56) and a mansion (67) will be
directly or indirectly affected.
It is therefore considered that Option 8 will potentially have a large adverse effect (Overall
Appraisal Category = -3) whilst Option 7, with less landtake, will potentially have a moderate
adverse effect (Overall Appraisal Category = -2).
Known Sites possibly affected for Option 8 only (16, 42, 52, 70, 69, 92, 93, 102, 114, 115, 132-135 142, 143, 157, 159, 160 and 168-170)
Qualitative Comments
13.49 Although the options appraisal has given an outline of the potential for the known and unknown
cultural heritage resource in the area the sites identified will need to be assessed in greater
detail to determine the level of impact that the options will have on individual sites. Analysis of
Slapton Coastal Zone Management Main Study Volume 1: Phase 1 Report (I)
August 2006, Scott Wilson
13-17
aerial photographs, documentary and historic sources will need to be assessed to determine the
potential for the unknown archaeological resource, however these further assessments are
outside the remit of this study and should be conducted during a later detailed design stage.
Following this a mitigation strategy will need to be devised to reduce/alleviate the impacts of the
preferred option.
Landscape Existing situation 13.50 The study site lies within the much dissected plateau landscape of the South Hams within South
Devon. The study zone covers a 3km radius area centred on the memorial car park at Slapton
sands. The shingle barrier of Slapton Sands divides the study area from the South Devon coast
to the east, and retains the fresh water body of Slapton Ley to the west. Behind the Ley the
landscape quickly rises up to form a rolling agricultural plateau landscape, regularly dissected
by wooded steep river valleys, which gradually widen as they approach and terminate within the
Ley. The study site is located within the South Devon Area of Outstanding Natural Beauty
(AONB). The primary importance of the AONB is to conserve and enhance the natural beauty of
the landscape. In addition to its AONB status the study area contains the following designations.
• Coastal Preservation area
• Slapton Ley and the shingle has also been designated as Site of Special Scientific Interest
13.51 In order for qualification as an AONB the landscape must fulfil the following criteria:
• The landscape should be a resource of national importance, for reasons of rarity or
representativeness;
• It should be of high scenic quality, with important aesthetic factors;
• The landscape within the area should be unspoilt by large scale, intrusive industrial or other
inharmonious development;
• It should have a distinctive and common character, including topography and
• visual unity and a clear sense of place;
• In addition to scenic qualities, it should include other notable conservation interests, such as
features of historical, wildlife or architectural interest;
• There should be a consensus of both professional and public opinion as to its importance.
Slapton Coastal Zone Management Main Study Volume 1: Phase 1 Report (I)
August 2006, Scott Wilson
13-18
13.52 The study site and its immediate environs consist of the following landscape elements.
• Shingle Beach.
• Fresh Open Water.
• Reed Beds/Marginal aquatics/Carr woodland.
• Deciduous woodland areas.
• Sea Cliffs.
• Arable Plateau.
• Pastoral Plateau.
• Settlements of Slapton, Torcross and Stokenham.
Potential Impacts Option 1: No Active Intervention
13.53 This option would initially present no landscape or visual changes, however, modelling of
potential sea level rise suggest that in time the beachcrest will retreat and eventually the A379
will be cut off. The shingle barrier will continue to retreat and will either breach or be
overwashed. Once breached the Ley will presumably over time become a brackish or saline
lagoon. Although these changes would occur as the result of natural events the impact in terms
of landscape and visual change may be significant if substantial areas of the shingle ridge
height are lost or if the ridge becomes fragmented.
13.54 With reference to landscape change a number of landscape character areas would potentially
be affected. Over time the man-made elements contained within ‘LCA1’ including the road, car
park and associated buildings would also be lost. There would also be changes to the
landscape character of the shingle ridge, dependant upon the exact nature of the shingle ridge
morphological changes. Currently the shingle barrier forms a rare landscape feature, which due
to it’s shear scale and juxtaposition next to the open water body of Slapton Ley creates a
visually impressive landscape element within the South Devon AONB. The predicted
overwashing and modification of the existing shingle barrier will result in significant visual
change.
13.55 The second landscape character area to be affected would be ‘LCA2’, the fresh open water
body. The breaching and overwashing of the shingle barrier by the sea would change the
ecology of the Ley from a freshwater body to a brackish or salt-water lagoon. The changes
above could result in the loss of the freshwater marginal and aquatic vegetation along the
margins of the Ley although vegetation suited to the newly saline environment would colonise.
Slapton Coastal Zone Management Main Study Volume 1: Phase 1 Report (I)
August 2006, Scott Wilson
13-19
13.56 The loss of the road and associated infrastructure elements would, however, be beneficial
reducing the impact of these features within the AONB, however this is of lesser importance if
the shingle barrier itself became reduced in scale or fragmented.
13.57 Although the landscape that will evolve, if and when the shingle barrier is breached, is to some
extent uncertain, it is likely to include the modification over time of the morphology of the shingle
barrier and the fresh water habitats of the Ley. This is classed as a large adverse (negative)
visual effect due to the loss of existing aesthetically outstanding landscape elements, which are
highly visible and of great landscape value within the existing context of the AONB, and their
likely replacement with more ubiquitous landscape elements. The changes to the landscape
character and the associated visual impact are classed as having a moderate adverse impact
(Overall Appraisal Category = -2).
Option 2: Beach Nourishment
13.58 This option would require the incorporation of approximately 20,000m3 a year of shingle,
imported from other areas to replenish lost material. This scheme would have neutral effect
following site operations, as the scheme will blend in well with surrounding landscape features
and existing elements. Selection of aggregate for beach nourishment will be the critical issue to
ensure that colour, size, shape and texture is the same of the current beach material.
13.59 During the construction period the option will have a slight adverse impact on the landscape due
to the high visibility and prominence of the constructions operations (Overall Appraisal Category
= -1).
Option 3: Beach Recycling
13.60 This option will have a neutral effect on the landscape. Following completion of the operations, it
is anticipated that the beach profile will become slightly modified although wave action will re-
establish an equilibrium in beach profile naturally. During the construction period highly frequent
vehicle movements are expected along the A379 transporting aggregates from the northern end
of Slapton sands to the areas requiring additional shingle. These identified vehicle movements
and the operation of heavy plant on the beach will visually have a slight adverse effect during
the construction phase of this option (Overall Appraisal Category = -1).
Option 4: Rock Revetment
13.61 This option will have a moderate adverse (negative) effect upon the landscape due to the
incorporation of this unnatural linear element along the length of the shingle barrier. This will not
only affect the landscape character of the barrier but will also reduce access to the beach and
waterfront. The revetment will be visible to a number of sensitive receptors including users of
Slapton Coastal Zone Management Main Study Volume 1: Phase 1 Report (I)
August 2006, Scott Wilson
13-20
the ‘South West Coast Path National Trail’ and residents of properties at Strete Gate and
Torcross and in addition be visible to inshore boat users. During construction to revetment
works will be highly visible due to the machinery required to carry out this operation and this will
visually have a slight adverse effect (Overall Appraisal Category = -1).
Option 5: Sheet Pile
13.62 This option will potentially have a neutral landscape impact following construction due to the
buried nature of the sheet plies. However, if the piles become exposed due to the coastal
erosion then this feature will have a major adverse effect on the landscape. This will be due to
the linear engineered appearance of the piling within the naturalistic setting of the study zone. If
the piles become exposed and the beach levels were reduced then access to the beach could
also be compromised. The piling would be visible to a number of sensitive visual receptors
including residential properties located at Torcross and Strete Gate users of the South West
Coast Path National Trail and inshore boat users. During construction of sheet piling, works will
be highly visible due to the machinery required to carry out this operation. Overall the
landscape and visual effects are judged to be moderate adverse (Overall Appraisal Category = -
2).
Option 6: Realign the existing Coast Road
13.63 Realigning the coast road, without any additional measures, would not maintain the shingle bar
although it would likely extend the life of the route corridor. This option would therefore be
similar to that for no active intervention and have a large adverse landscape effect, as the
existing landscape will be lost over time. Both areas ‘LCA1’ and 'LCA2' would probably reduce
in extent over time at an unknown rate.
13.64 Currently the shingle barrier forms a rare landscape feature, which due to it’s shear scale and
juxtaposition next to the open water body of Slapton Ley creates a visually impressive
landscape element within the South Devon AONB. Option 6 in isolation would not maintain
these features and therefore have a potentially large adverse effect following construction.
During the construction period the option will also have a slight adverse (negative) effect on the
landscape due to the high visibility and prominence of the constructions operations (Overall
Appraisal Category = -3).
Option 7: Upgraded Existing Roads Landward of Slapton Ley
13.65 The option to upgrade the existing road network well to the west of the Ley will have some
implications to the landscape of the wider study zone. The upgrading of the route would require
Slapton Coastal Zone Management Main Study Volume 1: Phase 1 Report (I)
August 2006, Scott Wilson
13-21
loss of some boundary features (loss of Devon hedgerows) and probably some cuttings and
bridge building works across valleys.
13.66 The upgraded road and in particular those elements that require major works would be visible
from a relatively small number of sensitive receptors. The implication of this scale of
development will be a moderate adverse effect (Overall Appraisal Category = -2)
Option 8: New Road Landward of Slapton Ley
13.67 An option to realign the road immediately west of the Ley would have major implications to the
landscape of the study zone, all of which would lie within the AONB. The construction of the
road would result in a major cutting operation along the western edge of the Ley and in addition
three new bridges would probably require construction one from Strete Gate across the higher
key, one below Slapton village and the third south of the Lower Ley between Torcross and
Stokenham.
13.68 The road construction would also require two new junction upgrades. The new road will be
visible from a greater number of sensitive visual receptors including residences at Strete Gate,
Slapton and Torcross , users of the South Devon Coastal Path and inshore boat users. The
implication of this scale of development within the study zone would be a large adverse effect
(Overall Appraisal Category = -3).
Transportation Existing Situation
13.69 The road along the shingle bank at Slapton Ley is approximately midway along the A379, which
links Kingsbridge to Dartmouth. This road is classified as a Secondary County Route in the
Devon Road Network. It is a relatively low speed / low capacity route which contains numerous
narrow single lane sections, particularly within the villages through which it passes. An
alternative route exists between Kingsbridge and Dartmouth via the A381 and A3122, which are
classified as Primary County Routes in the Devon Road Network. This route is of a generally
better standard than the A379 and passes through far fewer settlements of any size.
13.70 The A379 is however no doubt chosen, particularly by visitors, as it follows the coast in part and
provides interesting and spectacular views. Visitors typically also stop at the car parks at
Slapton Sands and Torcross in the middle of their journey. The area contained within the A379,
A381 and A3122 is criss-crossed by a network of narrow country lanes, typically bordered by
high ‘Devon Hedges’. The lanes are for the most part single track and the provision of passing
places varies greatly; some are properly formed and surfaced, others are informal in gateways.
Slapton Coastal Zone Management Main Study Volume 1: Phase 1 Report (I)
August 2006, Scott Wilson
13-22
13.71 During the period of the last closure of the A379 in January-March 2001 it is understood from
DCC that no alternative routes through the local lanes were signed. It is further understood that
the immediately local population ‘chose’ the better of the substandard country lanes and
generally followed informal one-way routes in order to minimise conflict.
Impact of the closure of the A379 at Slapton Ley
13.72 The impact of the closure of the A379 obviously becomes greater the closer one gets to the
point of closure. This is demonstrated in the table 13.2 where column 3 shows travel distances
via the A379, column 4 shows travel distances via the A3122/A381 and column 5 the difference
between the two. For non-commercial vehicles the route into/out of Kingsbridge via Belle Hill
would be available and this reduces the distances shown via the A381/A3122 by approximately
2km.
Table 13.2 Impact of the Closure of the A379 on travel distances 1 2 3 4 5
To From via via difference A379 A3122/A381 km km km (Palegate X)
Kingsbridge Dartmouth 24.1 22.4 -1.7 Stoke Fleming 21.0 25.5 4.5 Strete 17.6 28.9 11.3 Strete Gate 14.8 31.7 16.9 Dartmouth Kingsbridge 24.1 22.4 -1.7 West Charleton 22.0 24.5 2.5 Frogmore 20.0 28.2 8.2 Chillington 18.2 30.0 11.8 Stokenham 15.4 32.8 17.4 Torcross 13.1 35.1 22.0 Torcross Strete Gate 3.8 42.7 38.9
13.73 First Western National uses the A379 to link Kingsbridge to Dartmouth by its route number 93
with over 10 services daily, Monday to Saturday, and 4 on Sundays. Given the number of
settlements along this route it clearly would not be replicated by transferring the service onto the
A381/A3122. This service also links to Plymouth and Derriford Hospital and its importance
should not be understated. Were the A379 to be closed it would seem that this service would
have to be replaced by small feeder services from Torcross to Kingsbridge and Strete to
Dartmouth with interchanges at the larger towns to continue the journeys. This is essentially
what happened during the last temporary closure.
13.74 The secondary school catchment areas divide at Strete Gate and hence there should be limited
disruption were the road to be closed. The situation with regard to school transport is however
Slapton Coastal Zone Management Main Study Volume 1: Phase 1 Report (I)
August 2006, Scott Wilson
13-23
complex due to parental choice. The situation at present is that the number of pupils from the
Dartmouth area electing to be educated at Kingsbridge has reduced the capacity at the
Kingsbridge Community College for pupils within its own catchment area and hence some of the
latter are ‘forced’ to travel to Dartmouth. The County Council provides funding for the latter to
travel on public service buses to Dartmouth but does not provide funding for the former who
have ‘chosen’ to travel to Kingsbridge. A secondary effect is that the scholars from Dartmouth fill
the service bus towards Kingsbridge such that as the bus passes Torcross there is standing
room only for Kingsbridge catchment area scholars from Stokenham etc. The County Council
therefore provides a funded bus service for the latter pupils. The County Council is not finding it
easy to obtain school bus providers and this particular service utilises the same bus, which also
does a run to Stoke Fleming School and uses Slapton Line to travel between the two. School
transport is not provided for primary school children and parental choice will again blur nominal
catchment areas and result in criss-crossing parental journeys.
13.75 The area is covered by two fire stations, at Kingsbridge and Dartmouth. The Home Office
standard for the area is Class D whereby one appliance is expected to attend within 20 minutes
of the alarm being raised. The division between their territories occurs at Strete Gate however
where an incident involves property fire or trapped persons it is normal for one appliance to
attend from each station. A closure of the A379 in the vicinity of Torcross could prevent the
attendance time to Slapton village from Kingsbridge being maintained and a closure anywhere
could give problems during the busier summer months. A closure would have a similar effect
upon the emergency ambulance, patient transport and police services in being able to carry out
their duties to the standard expected.
13.76 Those options under consideration, which retain the route between Strete and Stokenham at or
close to its current alignment, would have little if any impact on journey time or distance. The
options requiring works or intervention to the shingle bank are likely to involve an increase in
heavy goods vehicle movements through the villages along the A379, which is likely to be
unwelcome and cause congestion and increased hazard. Similarly works requiring road
construction will involve construction traffic using this road. The inland route option would have
an impact on journey time and distance and require a positive effort on the part of drivers to visit
Torcross or the other car parks along the Ley. It would make the shore less accessible to those
reliant on public transport.
13.77 During the period of the previous closure, the Doctors Surgery at Chillington reported severe
difficulty in maintaining a normal service for its patients, whilst the surgeries at Kingsbridge and
Dartmouth, being further from the closure, appear not to have been affected.
13.78 There will be several ‘end-to-end’ trips on the A379 that would also be affected by a closure of
the road, including postal delivery/collection, refuse collection, deliveries of milk, fuel, goods,
newspapers etc. A closure would reduce the ‘passing trade’ to the local shops, hostelries,
cafes, tourist facilities, etc. To maintain their trading position they would have to market
Slapton Coastal Zone Management Main Study Volume 1: Phase 1 Report (I)
August 2006, Scott Wilson
13-24
themselves in a similar fashion to the many other areas around the coast of Devon that were at
the end of cul-de sac.
13.79 It is clear that whilst the route between Kingsbridge and Dartmouth via Slapton Ley is not
required for through traffic (other than for maintaining the livelihood of businesses reliant on
passing trade) it does perform an important local movement function. The events during the last
temporary closure demonstrated that not maintaining a route of some description is not an
option.
13.80 Were the road on the shingle bank ceases to exist, allowing vehicles to find their own way
through the existing network of country lanes is not considered to be an acceptable alternative.
The lanes are, in particular, not suitable for commercial vehicles and it is unrealistic to expect
that the police would have the resources to adequately enforce a wide-ranging weight or width
restriction. Physical measures to enforce such restrictions are likely to be impractical since
access will have to be retained for servicing and the passage of local farm vehicles.
Potential Impacts
Option 1. No active intervention
13.81 The closure, either temporary or permanent, of the A379 will increase traffic flow in unsuitable
country lanes. It is likely that highway accidents will increase. Costs will rise to virtually all road
users. It is doubtful whether replacement public transport services could be provided. Non-car
owners would be unlikely to have access to the Slapton area apart from by cycle. It is therefore
considered that this option will have a large adverse effect (Not scored)
Option 2. Beach nourishment and Option 3. Beach recycling
13.82 There would be no change to existing access arrangements associated with these two options.
There would however be issues with congestion, environmental and safety implications of
additional HGV movements through the villages on the A379 during shingle transportation
activities. It is therefore considered that this option will have a moderate adverse effect (Not
scored).
Option 4. Rock Revetment
13.83 If sea transport is used there would be a minimal increase in HGV movements through the
villages along the A379. If land transport is used, congestion, environmental and safety
implications of additional HGV movements through the villages on the A379 may apply. It is
therefore considered that this option will have a slight adverse effect (Not scored)
Slapton Coastal Zone Management Main Study Volume 1: Phase 1 Report (I)
August 2006, Scott Wilson
13-25
Option 5. Sheet piling
13.84 During the construction stage there will be an increase in HGV movements through the villages
on the A379. When the piles are finally exposed there would need to be beach replenishment
that would have the effect as for Option 2. It is therefore considered that this option will have a
moderate adverse effect (Not scored).
Option 6. Realign the existing Coast Road
13.85 If the realignment is reactive then there will be periods when the road is closed in advance and
during construction. This temporary closure of the A379 will increase traffic flow in unsuitable
country lanes and as for Option 1 would probably lead to an increase in highway accidents.
Costs will rise to virtually all road users. It is doubtful whether replacement public transport
services could be provided. Non-car owners would be unlikely to have access to the Slapton
area apart from by cycle. If the realignment is proactive then it should be possible to keep the
road open. Construction traffic will impact on communities along the A379 to a greater extent
than Option 4. It is therefore considered that this option will have a moderate adverse effect
(Not scored).
Option 7: Upgraded Existing Roads Landward of Slapton Ley
13.86 The option to upgrade the existing road network well to the west of the Ley would have ongoing
implications for transportation in the wider area. The upgrading of the route would cause
temporary disruption due to construction and temporary management measures for the period
of construction. It is likely that this Option would comprise discrete construction events over a
period of years.
13.87 A newly upgraded inland route, combined with the eventual abandonment of the existing route,
would lead to a longer journey times for some users, particularly between Torcross and Strete.
There would be increased public transport costs if the bus diverts into and out of Torcross. and
accessibility to the beach for non-car owners would be substantially worsened. There would be
benefits for existing users of the inland routes that would be improved. However, overall this
option is considered to produce a large adverse effect (Not scored).
Option 8: New Road Landward of Slapton Ley
13.88 There would be little change in length, journey time or highway safety between the existing a
new route just inland of the Ley. Construction traffic would have a greater effect than option 6,
possibly as great as for options 2 and 3, but for a one off period. There would be increased
public transport costs if the bus diverts into and out of Torcross. Accessibility to the beach for
non-car owners would be worsened. It is therefore considered that this option will have a slight
adverse effect (Not scored).
Slapton Coastal Zone Management Main Study Volume 1: Phase 1 Report (I)
August 2006, Scott Wilson
13-26
Socio- Economic Issues Baseline
13.89 The population of both Skerries and Stokenham (wards within which Slapton and Torcross are
sited) is just under 4,000. To set this within a context, the nearest largest settlements are
Dartmouth and Kingsbridge, both with populations in excess of 6,000.
13.90 Within both wards the total number of businesses is just under 150 (as identified via the Annual
Business Inquiry (ABI). It should be noted that this source excludes the ‘informal economy’ and
as such it is possible that businesses such as self-catering accommodation providers and some
self-employed residents will be omitted from these figures. In an area such as South Hams
where farming, tourism and lifestyle businesses are a key element of the local economy, these
omitted businesses could amount substantially.
13.91 Looking specifically at Slapton and Torcross however, the audit of businesses within the
settlements thus far (awaiting input from consultations and Slapton Line Partnership) indicates a
total of approximately 50 businesses, of which a significant proportion (over half) of businesses
are tourism based. Others provide local services e.g. village stores, pubs etc but these clearly
still retain strong links with the tourism sector as this swells the population of the area for
significant periods of the year.
13.92 This baseline profile therefore indicates that both the total population and number of businesses
within the area are fairly small though clearly this is not to say that any impacts to communities
and businesses are insignificant. Surveys and consultations will provide clearer substantiation
of the potential impacts of engineering options on local businesses and communities.
Option 1: No Active Intervention Community & Social Impacts 13.93 Intermittent breaching of A379 would cause diversions and disruption to access/accessibility of
services. Examples of these disruptions include bus services, travel to work times, emergency
service access. The following impacts may also arise:
• Longer term loss of road and necessary use of other roads may increase drive
times to services/facilities e.g. schools, workplace, doctors etc
• Use of minor roads may cause difficulties for larger vehicles – buses, vans, and
lorries.
• Lack of planned approach to change and consequential disruption to traffic
movements will lead to confusion and difficulties for residents and service providers
e.g. bus companies.
Slapton Coastal Zone Management Main Study Volume 1: Phase 1 Report (I)
August 2006, Scott Wilson
13-27
• The perception of Slapton and Torcross as more isolated communities will increase
i.e. not on main road link between Kingsbridge and Dartmouth. This may be
significant.
13.94 A provisional view, in the absence of the survey results is that the community and social effects
associated with Option 1 are likely to be moderate adverse (Overall Appraisal Category = -2).
Business Impacts 13.95 The unplanned nature of road diversions would be difficult for businesses to manage and this
could affect trade especially for businesses reliant on passing trade e.g. B&B’s and village
stores. The following impacts may also arise:
• Ultimate loss of main road link will increase the ‘isolation’ of the villages and this could lead
to reduction in trade. Loss of trade may be as a result of reduced passing trade and may be
experienced by B&B’s, local stores, ley (visitor attraction). This could also arise as a result of
increasing access difficulties or problems with supply chains to/from local businesses.
• Dependant on the importance of the Ley in its freshwater state to tourists, there may be a
reduction in visitor numbers.
13.96 It must also be noted that there is the potential for positive impacts to be associated with the
severance of the road. It is possible that some specialist businesses, e.g. recreational pursuits
& natural history related, may actually benefit from the closure if it is perceived by some visitors
that the area has been enhanced by the closure. The creation of changing and new fresh
water/saline wildlife environments will attract specialist interest, and may be of interest to a more
general market if actively marketed and interpreted. Any positive benefits re likely to be realised
in the longer term and may require some initial capital investment in a "replacement" tourist
infrastructure (e.g. new visitor centres). Furthermore, if the changes to the road structure inland
include suitable parking and walking trail development then it may be possible to add to leisure
and tourism use of the countryside in the area. If this work takes in existing local businesses
then some economic benefits can be gained.
13.97 A provisional view, in the absence of the survey results, is however that the business effects
associated with Option 1 are likely to be large adverse (Overall Appraisal Category = -3).
Option 2: Beach Nourishment and Option 3: Beach Recycling Community & Social Impacts 13.98 Under these two options, the road would be maintained with a consequential continuation in the
through flow of traffic with associated ‘benefits’. These will be quantified/qualified by the
Slapton Coastal Zone Management Main Study Volume 1: Phase 1 Report (I)
August 2006, Scott Wilson
13-28
business survey and consultations plus the potential visitor survey [results awaited]. Examples of such benefits include:
• Continuation of access to services e.g. local schools/doctors (i.e. access times not affected)
• Continuation of access by emergency services (i.e. access times not affected)
13.99 It is a reasonable assumption that the community and social effects associated with Options 2 &
3 are likely to be neutral (Overall Appraisal Category = 0).
Business Impacts 13.100 The maintenance of the road link should ensure that businesses dependent on the ability of
suppliers/customers to easily access the village are not affected. Examples of such benefits
include:
• Continuing ability/willingness of suppliers to meet the needs of Slapton area businesses,
• Continuing access by Slapton businesses to customers/markets in the wider area
13.101 The ‘nourishment’ works require some additional truck movements and dredging works. This
may have some impact upon the aesthetic quality of the beach environment and therefore upon
the numbers of visitors. This is however likely to be fairly minimal.
13.102 It is a reasonable assumption that the business effects associated with Options 2 & 3 are likely
to be neutral (Overall Appraisal Category = 0).
Option 4: Rock Revetment and Option 5: Sheet Pile Community & Social Impact 13.103 Under this option, as for Options 2 and 3, the road would be maintained with a consequential
continuation in the through flow of traffic with associated ‘benefits’. Examples of such benefits
include:
• Continuation of access to services e.g. local schools/doctors (i.e. access times not affected)
• Continuation of access by emergency services (i.e. access times not affected)
13.104 It is a reasonable assumption that the community and social effects associated with Options 4 &
5 are likely to be neutral (Overall Appraisal Category = 0).
Business Impacts 13.105 As for options 2 and 3, the maintenance of the road link should ensure that businesses
dependent on the ability of suppliers/customers to easily access the village are not affected.
Examples of such benefits include:
Slapton Coastal Zone Management Main Study Volume 1: Phase 1 Report (I)
August 2006, Scott Wilson
13-29
• Continuing ability/willingness of suppliers to meet the needs of Slapton area businesses,
• Continuing access by Slapton businesses to customers/markets in the wider area
13.106 The construction of the revetment under Option 4 would cause some temporary disruption. In
the longer term however the impacts of the revetment are likely to be minimal and the aesthetic
quality of the beach environment should not be affected given that the revetment will, at least
initially, be buried. Over time however the revetment may be exposed with some minimal
detriment to the visual environment although it is not considered likely that this will be of
detriment to visitor motivations/numbers.
13.107 The sheet pile construction under Option 5 would cause some temporary disruption. Longer-
term impacts are difficult to establish. Pile will not affect the erosion of the beach and beach
loss will still occur. The combined effect of a loss of beach and the exposure of potentially
unattractive sheet piling may be detrimental to the aesthetic quality of the beach environment.
The effects of this upon visitor motivations/numbers are however difficult to quantify.
13.108 It is a reasonable assumption that the business effects associated with Options 4 & 5 are likely
to be neutral (Overall Appraisal Category = 0).
Option 6: Realign the existing Coast Road Community & Social Impacts 13.109 The ultimate replacement of the road with another, which is set back approximately 25m from
the route of the original, is considered to have minimal impact upon the community though this
is of course dependant on the exact location of the road. Should the realignment necessitate
purchase of residential properties/businesses, there will clear impacts upon the specific
members of the community. If the road is constructed "as and when required", the disruption
before a complete replacement is provided could be considerable and temporary traffic
management measures may create temporary congestion/increased drive times.
13.110 Overall however the road would be maintained and therefore a continuation in the through flow
of traffic with associated ‘benefits’ would be provided. These ‘benefits’ will be
quantified/qualified by the business survey and consultations plus potential visitor survey.
Examples of such benefits to the community have been outlined in Options 2, 3,4 and 5.
13.111 It is a reasonable assumption that the community and social effects associated with Option 6
are likely to be neutral (Overall Appraisal Category = 0).
Business Impacts 13.112 The retention of a main road link along roughly the same alignment should mean that long-term
impacts upon businesses will be minimal although the following impacts may occur:
Slapton Coastal Zone Management Main Study Volume 1: Phase 1 Report (I)
August 2006, Scott Wilson
13-30
• Some disruption to businesses may occur due to the phasing of the construction of the new
road.
• It is not clear what the impacts upon the Ley will be as a result of a new road inland.
Should the nature of the Ley be changed, there may be some affect upon the number/type
of visitor.
• Aesthetic impacts of the new road are unlikely to be significantly different to those resulting
from the existing road however; this cannot be clarified until the design has been worked up.
Should the visual impacts be significant there may be detrimental impacts upon visitor
numbers to the immediate locality.
13.113 It is a reasonable assumption that the business effects associated with Option 6 are likely to be
neutral (Overall Appraisal Category = 0).
Option 7 and Option 8: Upgraded Existing Roads Landward of Slapton Ley & New
Road Landward of Slapton Ley Community & Social Impacts 13.114 The replacement of the road with another inland of the Ley is considered to have less of an
impact upon the community than loss of the road altogether. Any impacts upon the community
are however directly dependant on the exact location of the new road. In theory a new inland
route, whether a new road close to the Ley, or an upgraded route along existing roads, would
remove the need for a coast road. However the additional distance of any new alignment as
well as the new route itself will create impacts:
• A lack of through trade to businesses sited adjacent to the original road may have impacts
upon the community – businesses close which causes problems to local communities.
• Additional driving distance and travel time to access/receive services will be dependant on
the location of new road.
• There may be some changes in the level of service provision within the villages. For
example if Torcross was no longer on the main road link the level of bus service provision
may b reduced.
• Along the new route, purchase of new land would be required for road building and there will
clear impacts upon specific members of the community. The impact of Option 8 may be
greater than for option 7
• Disruption during the road-building programme may be considerable and temporary traffic
management measures may create temporary congestion and increased drive times. The
impact of Option 7 may be greater than for option 8.
Slapton Coastal Zone Management Main Study Volume 1: Phase 1 Report (I)
August 2006, Scott Wilson
13-31
13.115 A provisional view, in the absence of the survey results is that the community and social effects
associated with Options 7 and 8 are likely to be moderate adverse (Overall Appraisal Category
= -2) and slight beneficial (Overall Appraisal Category = +1) respectively.
Business Impacts 13.116 The level of impact upon businesses will differ dependent upon their proximity to the new road
or upgraded route and the reliance on passing trade. Should businesses be heavily reliant on
passing trade e.g. B&B’s, village shops, attractions etc, the relocation of the main road link may
have significant consequences:
• Some businesses may benefit from an upturn in business due to their position away from
new road – quieter situation.
• Dependent on the new alignment of the road, additional drive times incurred by Slapton area
businesses may be problematic.
• The change in the nature of the Ley may have some impact upon the number/type of visitor
to the area.
13.117 A provisional view, in the absence of the survey results is that the business effects associated
with Options 7 and 8 are likely to be moderate adverse (Overall Appraisal Category = -2) and
neutral (Overall Appraisal Category = 0).
Slapton Coastal Zone Management Main Study Volume 1: Phase 1 Report (I)
August 2006, Scott Wilson
14-1
14 Option Economic Appraisal
Introduction 14.1 This Chapter first presents an assessment of options in terms of economics.
14.2 The assessment of economic viability and justification presented below has been undertaken in
accordance with the requirements and methodology of DEFRA, for coastal defence schemes,
as set out in the PAG3 guidance and more recent guidance from DEFRA. This assessment
does not assume that DEFRA funding will be available, but the use of the DEFRA approach
provides consistent methods of evaluating both costs and benefits of any option.
14.3 The methodology starts with an assessment of the economic damages that would occur if a ‘Do
Nothing’ approach was adopted. Other options are then compared to the Do Nothing case, and
to each other, in terms of their whole-life costs and their whole-life benefits (i.e. the damages
avoided).
14.4 Both costs and damages are estimated over a period of 100 years, and the totals are
discounted using a prescribed interest rate to determine present value costs and damages.
Benefits and costs have not been presented for the inland upgrade option. The reason for this
is that the benefits will be very small, arising from minor improvements in road junctions and so
on, and the costs correspondingly small also.
Do Nothing Damages (Option 1) 14.5 Tangible damages that would be incurred under the do nothing scenario over the next 100 years
are likely to be limited to the cost of traffic disruption caused by the break in the transport link if
the road is rendered unusable.
14.6 It is possible that some damage to property may occur at a late stage in the strategy period if
the barrier beach were to breach entirely, but in terms of flooding this would be limited to a less
than 10 properties at worst, and therefore by the time any damages are discounted over time
the contribution is negligible. Similarly, perhaps 20 properties at Torcross would be affected in
the long term if the barrier retreated rapidly, but again the value of discounted damages
resulting from this is a relatively small part of the total damages.
14.7 An estimate of the traffic damages has been made based on the traffic flows determined during
the origin and destination traffic survey of July 2004. Based on out of season and peak season
daily traffic flows of 1,500 and 2,700 vehicles respectively, an average increase in travel
distance of six miles for 70% of journeys and a cost of £0.4 per mile, the annual damages due to
traffic disruption have been estimated as £1 million (Table 14.1).
Slapton Coastal Zone Management Main Study Volume 1: Phase 1 Report (I)
August 2006, Scott Wilson
14-2
14.8 It should be noted that this estimate of traffic damages presents a much more simplified
calculation than might normally be expected for a transport study. However, the level of detail is
considered sufficient for the broad scale economic appraisal developed for this Phase of the
current study. A more detailed traffic analysis may be required during the next stage, if the
analysis identifies feasible options.
14.9 Intangible damages, such as loss of tourism and changes in environmental habitats are more
difficult to evaluate. Information on visitor numbers is not currently available. However, it is likely
that any visitors who would not travel to the area following a road damage event would find
alternative areas to visit. Hence the economic damage to the nation as a whole would be
limited, although it could be significant for the local economy. Numbers have been multiplied by
70% as it has been assumed that some will chose not to travel, and others may not be affected.
Annual Traffic Damages Average increase in journey 6 miles Out of season daily traffic flow 1,500 vehicles Peak season daily traffic flow 2,700 vehicles Percentage of traffic incurring costs 70 % Out of season period 323 days Peak season period 42 days Out of season additional miles 2,034,900 miles Peak season additional miles 476,280 miles Cost per mile 0.4 £ Out of season cost 813,960 £ Peak season cost 190,512 £ Total annual traffic damages 1,004,472 £ Table 14.1: Annual Traffic Damages
14.10 In total, the traffic damages that can be expected over the 100-year strategy period under the
Do Nothing scenario have been estimated as £29.9 million.
14.11 The present value (PV) traffic damages have been determined by applying a probability of
failure to the current defences, and hence the road. This has been based on an estimated
residual life of 15 years. The PV traffic damages under the Do Nothing option have thus been
estimated as £23.1 million.
Do Minimum and Do Something Damages 14.12 Since none of the options could absolutely guarantee the structural integrity of the road over the
entire strategy period, a certain amount of potential damages are likely to be associated with
each option. These have been determined by estimating the probability of damage to the road
occurring under each of the options. However, the damages incurred for each road damage
event are limited to the cost of repairing the affected road section and the associated traffic
disruption and management costs.
Slapton Coastal Zone Management Main Study Volume 1: Phase 1 Report (I)
August 2006, Scott Wilson
14-3
14.13 The cost of repairing/realigning a damaged section of the road has been estimated as £200,000
per event based on the cost of the road realignment in 2001. Traffic disruption has been
calculated as £83,700 based on a month of disruption and the same parameters as those used
for the Do Nothing option.
14.14 For the Do Minimum (Option 6) damages the overall damage has been limited to the cost of
traffic disruption since the repair costs are taken into account in the costing for these options.
The probabilities have been adjusted such that an event cutting the road is likely on average
once every 15 years. For the proactive option the probability has been further adjusted to allow
for the fact that works will be carried out before an actual road erosion event takes place. In
both Do Minimum scenarios the PV damages due to the abandonment of the road in year 60
have been determined using the PAG3 erosion value calculation sheet. The total PV damages
under the reactive and proactive Do Minimum scenarios have been estimated as £4.54 and
£4.51 million respectively.
14.15 Damages under the Beach Recharge (Option 2) option have been determined using the
standard PAG3 damage cost calculation sheet (exponential) and a defence standard of 1 in 100
years. The total PV damages have been calculated as £85,000.
14.16 The PV damages for the Recycling option (Option 3) have been determined as £481,000, based
on the same method as for the Beach Recharge option, but with a proposed defence standard
of only 1 in 50 years.
14.17 Similarly, the PV damages for the Hard Defence options (revetment and sheet piles, Options 4
and 5) have been determined using a 1 in 200 years defence standard as £42,000.
14.18 Damages for the Realignment option where the road would be relocated behind the Ley (Option
8) have been based on the potential damages that could occur in the first ten years of the
strategy while the new road is designed and constructed. On this basis the PV damages for this
option have been estimated as £163,000.
Option Costs 14.19 Option costs have been developed based on a number of assumptions regarding the type,
extent and timing of construction required. A brief description of the costs for each of the options
is presented below.
14.20 All options include for monitoring of the foreshore and removal of shingle from the road after
storms, as well as costs for design and supervision where required.
Keep the Coast Road - Do Minimum (Option 6) 14.21 The reactive Do Minimum costs would involve regular repairs to the road until this was no longer
feasible, after which the road would be abandoned and no further work would be carried out. It
Slapton Coastal Zone Management Main Study Volume 1: Phase 1 Report (I)
August 2006, Scott Wilson
14-4
is anticipated that the first repairs would become necessary within the next fifteen years
between Slapton and Strete Gate. Within a further ten to twenty years a further road damage
event could also be expected between Torcross and Slapton, and every ten to twenty years
after that. It is anticipated that by year 60 it would no longer be viable to continue with
emergency repairs and the road would therefore be abandoned. Monitoring would continue for
the entire strategy period in order to evaluate the risk of a breach of the barrier. Due to the
emergency nature of the repair works the costs are likely to be higher than for planned works
and an allowance of £300,000 per repair has been made.
14.22 Under the proactive Do Minimum option it has been assumed that works would be carried out
every ten years to ensure the integrity of the road and reduce the risk of damage to an
acceptable level. As with the reactive option, works on the road would be abandoned after year
60. Since these works could be planned reasonably well in advance the cost of each repair has
been assumed as £200,000.
14.23 The PV costs for the two Do Minimum scenarios over the 100-year strategy period are £878k
and £1,121k for the reactive and proactive options respectively. The reactive approach has a
lower cost because works are only undertaken if damage occurs. However, these costs exclude
the costs associated with protecting Torcross. A sum of £2.0 million has been allowed for in
year 40 for a 250m extension of the sea wall and rock revetment. This increases the PV costs
to £1.41m and £1.65m.
Keep the Coast Road (Options 2 to 5) 14.24 The Beach Recharge option for holding the road would require regular placement of a suitable
material on the foreshore in order to enable the beaches to respond to storm events without
undermining the road. The quantity of material placed should be similar to the annual potential
sediment transport rate, which has been estimated as between 75,000m3 and 150,000m3. Since
the system is a closed sediment cell, annual renourishment should not be required and a capital
recharge scheme of 75,000m3 every ten years, together with some reprofiling when necessary,
should be sufficient to provide the required level of confidence in the natural defences. An
indicative rate of £15 per cubic metre of recharge material has been used, which provides a cost
of £1.125 million per recharge campaign. The total PV costs over the period of the strategy have
been estimated as £4.51 million.
14.25 Beach Recycling would require the transportation of shingle from the Strete Gate end of the line
to those areas most at risk from storm damage. This would necessitate a substantial number of
truck movements, although this could be timed to coincide with the quieter periods of the year. It
is estimated that the transport of around 100,000m3 of material would cost in the region of
£400,000. Such a redistribution of beach material every five years should be sufficient to reduce
the risk of damage to an acceptable level, although the risk may remain higher than under the
beach recharge option. The total PV costs of this option have been estimated as £3.26 million.
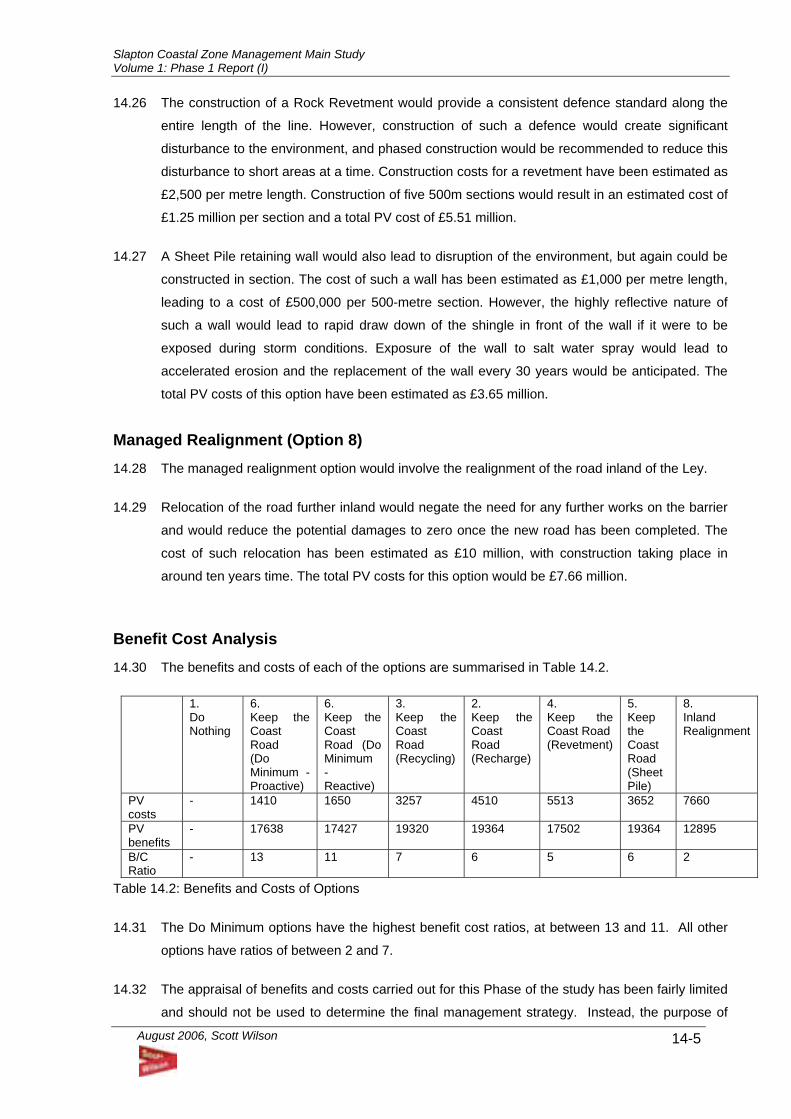
Slapton Coastal Zone Management Main Study Volume 1: Phase 1 Report (I)
August 2006, Scott Wilson
14-5
14.26 The construction of a Rock Revetment would provide a consistent defence standard along the
entire length of the line. However, construction of such a defence would create significant
disturbance to the environment, and phased construction would be recommended to reduce this
disturbance to short areas at a time. Construction costs for a revetment have been estimated as
£2,500 per metre length. Construction of five 500m sections would result in an estimated cost of
£1.25 million per section and a total PV cost of £5.51 million.
14.27 A Sheet Pile retaining wall would also lead to disruption of the environment, but again could be
constructed in section. The cost of such a wall has been estimated as £1,000 per metre length,
leading to a cost of £500,000 per 500-metre section. However, the highly reflective nature of
such a wall would lead to rapid draw down of the shingle in front of the wall if it were to be
exposed during storm conditions. Exposure of the wall to salt water spray would lead to
accelerated erosion and the replacement of the wall every 30 years would be anticipated. The
total PV costs of this option have been estimated as £3.65 million.
Managed Realignment (Option 8) 14.28 The managed realignment option would involve the realignment of the road inland of the Ley.
14.29 Relocation of the road further inland would negate the need for any further works on the barrier
and would reduce the potential damages to zero once the new road has been completed. The
cost of such relocation has been estimated as £10 million, with construction taking place in
around ten years time. The total PV costs for this option would be £7.66 million.
Benefit Cost Analysis 14.30 The benefits and costs of each of the options are summarised in Table 14.2.
1. Do Nothing
6. Keep the Coast Road (Do Minimum - Proactive)
6. Keep the Coast Road (Do Minimum - Reactive)
3. Keep the Coast Road (Recycling)
2. Keep the Coast Road (Recharge)
4. Keep the Coast Road (Revetment)
5. Keep the Coast Road (Sheet Pile)
8. Inland Realignment
PV costs
- 1410 1650 3257 4510 5513 3652 7660
PV benefits
- 17638 17427 19320 19364 17502 19364 12895
B/C Ratio
- 13 11 7 6 5 6 2
Table 14.2: Benefits and Costs of Options
14.31 The Do Minimum options have the highest benefit cost ratios, at between 13 and 11. All other
options have ratios of between 2 and 7.
14.32 The appraisal of benefits and costs carried out for this Phase of the study has been fairly limited
and should not be used to determine the final management strategy. Instead, the purpose of
Slapton Coastal Zone Management Main Study Volume 1: Phase 1 Report (I)
August 2006, Scott Wilson
14-6
this appraisal is to determine whether there is sufficient justification to explore further the
possibility of holding the road in its current position.
14.33 Applying DEFRA rules on benefit-costs would result in only 2 options being at all feasible:
proactive realignment and reactive realignment. All other options would be ruled out on grounds
of inadequate incremental benefit-cost ratio.
Funding Review 14.34 A brief evaluation of the DEFRA priority scores that could be achieved has shown that a
minimum benefit cost ratio of 8 would be required in order to achieve a sufficiently high priority
score to secure government funding, which is currently around 15.
14.35 Based on this threshold, none of the hard defence options would be likely to achieve the
required priority score. Beach recharge and relocation of the road further inland would also not
have a sufficiently high benefit cost ratio to justify such works.
Summary of Economic Assessment 14.36 Some form of managed realignment on the barrier would be the preferred option, as it would be
the only option meeting DEFRA criteria. The differences between reactive and proactive are
marginal.
Overall Technical Option Assessment 14.37 Summarising, the following courses of action have been contemplated:
• No active intervention: does not require funding, but is likely to result in loss of use of
road by year 20.
• Keep the Coast Road (Do Minimum - Proactive or Reactive Realignment): highly likely
to meet DEFRA economic assessment criteria. Would preserve the road for 50 years or
so, but after that road would probably be abandoned.
• Keep the Coast Road (Beach Recycling and Beach Recharge): will not meet DEFRA
economic assessment criteria. Would preserve the road for 50 years but after year 50
there is some uncertainty over the technical feasibility if rates of sea level rise increase
rapidly. Less technical certainty for these options than for hard defences – rates of
recycling and renourishment may vary considerably from initial estimates. Significant
adverse impact on beach material for beach recharge option.
Slapton Coastal Zone Management Main Study Volume 1: Phase 1 Report (I)
August 2006, Scott Wilson
14-7
• Keep the Coast Road (Sheet piling and rock revetment): will not meet DEFRA
economic assessment criteria. Would preserve the road for 50 years, and probably 100
years. Major technical issues with sheet piling.
• Managed Realignment (inland): will not meet DEFRA economic assessment criteria.
Would preserve a transport route indefinitely.
14.38 Based on the above it is concluded that a Keep the Coast Road option for a period of 50 years,
consisting of localised realignment of the coast road on the barrier, and future protection of
Torcross, would meet DEFRA economic assessment criteria. The cost would be approximately
£2.0m for the first 40 years, equating to £50,000 per year, plus a further £2.5m in years 40-50.
Slapton Coastal Zone Management Main Study Volume 1: Phase 1 Report (I)
August 2006, Scott Wilson
15-1
15 Option Appraisal
Introduction 15.1 This New Chapter first presents an assessment of options in terms of technical issues combined
with environmental and socio-economic impact.
15.2 Appraisals were undertaken for the following options:
• Option 1: No Active Intervention i.e. no further investment in coastal defences or road
maintenance;
• Option 2: Beach Nourishment; increase beach width/height to prevent road
closure/damage;
• Option 3: Beach Recycling; extract beach material from the northern end, transport south
and widen beach in front of the existing road at the southern end of the beach;
• Option 4: Rock Revetment; construct a rock revetment along the seaward side of the
existing road on the upper beach;
• Option 5: Sheet Pile; construct sheet pile wall along the seaward edge of the existing road,
the top of the piling level with road;
• Option 6: Realign the existing road along the shingle ridge; retreat road to evade erosion;
• Option 7: Upgraded Route along existing road network landward of Slapton Ley; and
• Option 8: New Road landward of Slapton Ley
15.3 In order to compare the various options against each other, a methodology has been adopted
using an amended version of a weighted scoring system used successfully for a coastal scheme
in Yorkshire. Table 15.1 below shows the weightings for each factor within this assessment.
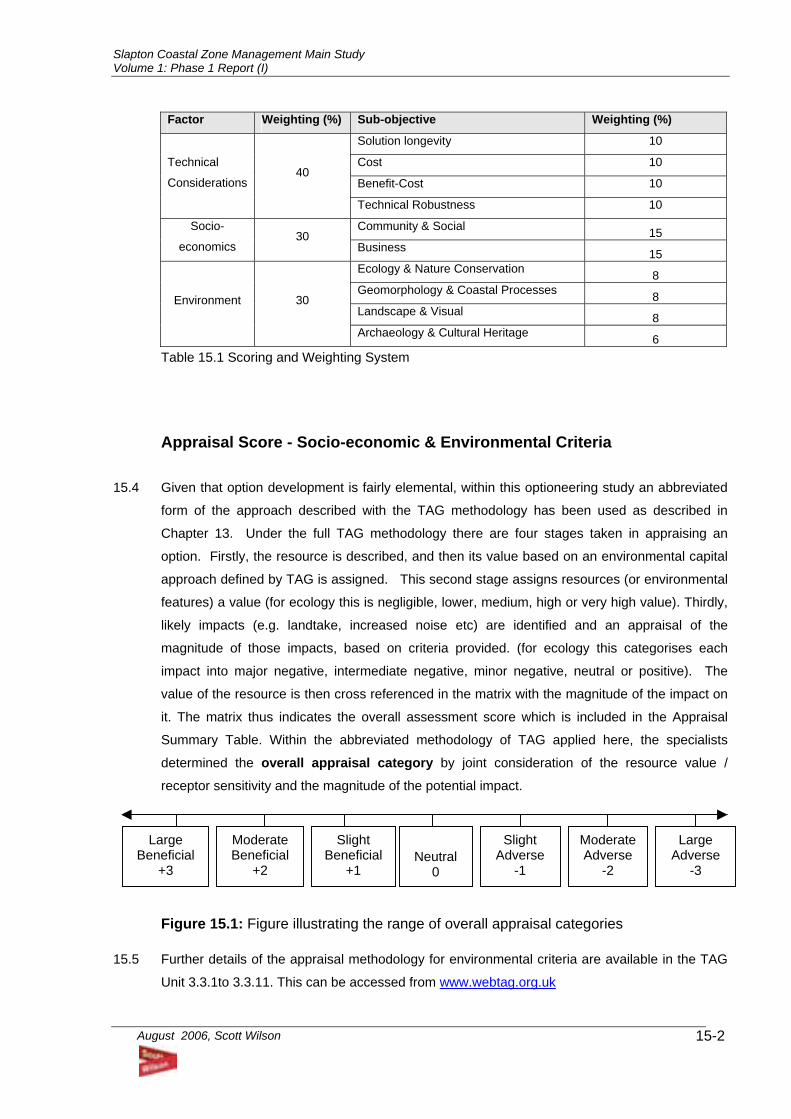
Slapton Coastal Zone Management Main Study Volume 1: Phase 1 Report (I)
August 2006, Scott Wilson
15-2
Factor Weighting (%) Sub-objective Weighting (%)
Solution longevity 10
Cost 10
Benefit-Cost 10
Technical
Considerations 40
Technical Robustness 10
Community & Social 15 Socio-
economics 30
Business 15 Ecology & Nature Conservation 8 Geomorphology & Coastal Processes 8 Landscape & Visual 8
Environment 30
Archaeology & Cultural Heritage 6 Table 15.1 Scoring and Weighting System
Appraisal Score - Socio-economic & Environmental Criteria 15.4 Given that option development is fairly elemental, within this optioneering study an abbreviated
form of the approach described with the TAG methodology has been used as described in
Chapter 13. Under the full TAG methodology there are four stages taken in appraising an
option. Firstly, the resource is described, and then its value based on an environmental capital
approach defined by TAG is assigned. This second stage assigns resources (or environmental
features) a value (for ecology this is negligible, lower, medium, high or very high value). Thirdly,
likely impacts (e.g. landtake, increased noise etc) are identified and an appraisal of the
magnitude of those impacts, based on criteria provided. (for ecology this categorises each
impact into major negative, intermediate negative, minor negative, neutral or positive). The
value of the resource is then cross referenced in the matrix with the magnitude of the impact on
it. The matrix thus indicates the overall assessment score which is included in the Appraisal
Summary Table. Within the abbreviated methodology of TAG applied here, the specialists
determined the overall appraisal category by joint consideration of the resource value /
receptor sensitivity and the magnitude of the potential impact.
Figure 15.1: Figure illustrating the range of overall appraisal categories
15.5 Further details of the appraisal methodology for environmental criteria are available in the TAG
Unit 3.3.1to 3.3.11. This can be accessed from www.webtag.org.uk
Large Beneficial
+3
Moderate Beneficial
+2
Slight Beneficial
+1
Slight Adverse
-1
Moderate Adverse
-2
Large Adverse
-3
Neutral
0
Slapton Coastal Zone Management Main Study Volume 1: Phase 1 Report (I)
August 2006, Scott Wilson
15-3
15.6 For both socio-economic and the environmental criteria, for each option, the 7-point Overall
Appraisal Category (-3 to +3) from the individual assessments has been converted into a
multiplier from 0 (poor) to 1 (best). The overall percentage score of the option is the total
percentage derived by using the multiplying this figure for each sub-objective by the percentage
weighting of that sub-objective and relevant socio-economic or environmental topic.
Appraisal Score - Technical Criteria 15.7 Solution Longevity – a score from 0 to 1 has been directly applied according to whether the
option provides a long-term solution (1) or a short-term solution (0).
15.8 Cost – a score from 0 to 1 has been directly applied according to the relative total cost likely to
be incurred in implementing the option.
15.9 Benefit-cost - a score from 0 to 1 has been directly applied according to the relative benefit-cost
ratio which would be achieved by the option under DEFRA rules. This is a measure of value for
money.
15.10 Technical Robustness - a score from 0 to 1 has been directly applied according to the relative
degree of confidence that the option can achieve its stated aims.
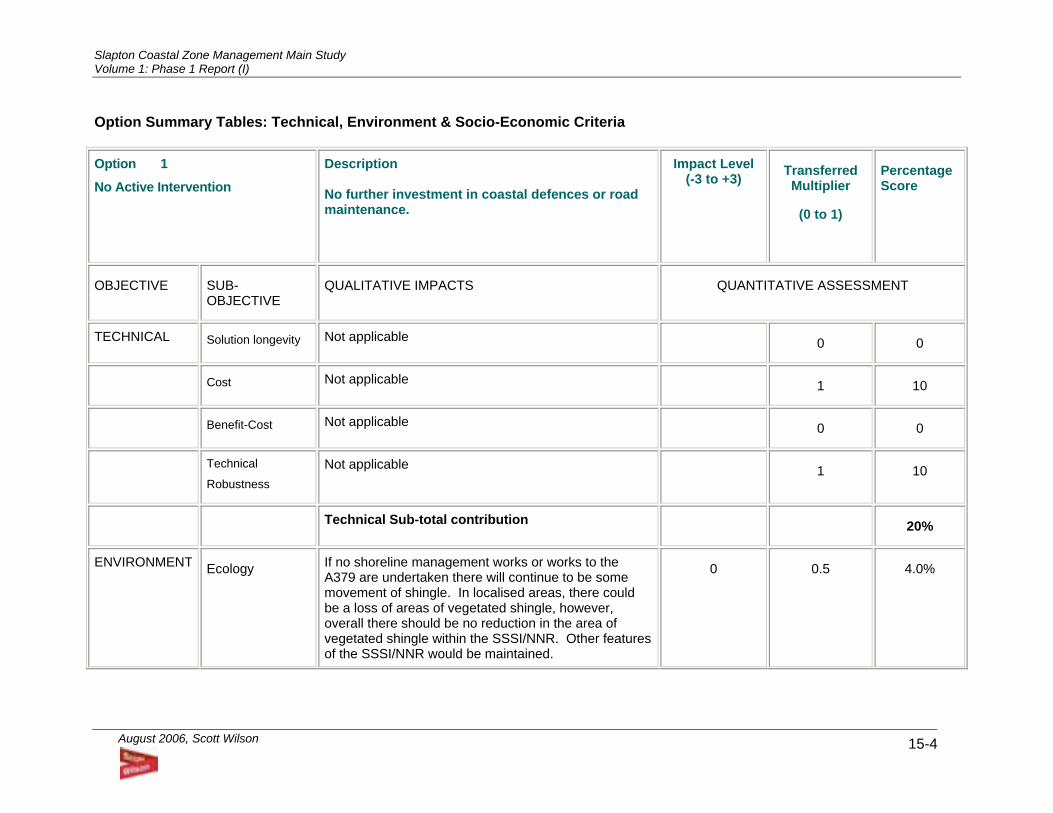
Slapton Coastal Zone Management Main Study Volume 1: Phase 1 Report (I)
August 2006, Scott Wilson 15-4
Option Summary Tables: Technical, Environment & Socio-Economic Criteria
Option 1
No Active Intervention Description No further investment in coastal defences or road maintenance.
Impact Level (-3 to +3) Transferred
Multiplier
(0 to 1)
Percentage Score
OBJECTIVE SUB-OBJECTIVE
QUALITATIVE IMPACTS QUANTITATIVE ASSESSMENT
TECHNICAL Solution longevity Not applicable 0 0
Cost Not applicable 1 10
Benefit-Cost Not applicable 0 0
Technical
Robustness Not applicable 1 10
Technical Sub-total contribution 20%
ENVIRONMENT Ecology If no shoreline management works or works to the A379 are undertaken there will continue to be some movement of shingle. In localised areas, there could be a loss of areas of vegetated shingle, however, overall there should be no reduction in the area of vegetated shingle within the SSSI/NNR. Other features of the SSSI/NNR would be maintained.
0 0.5 4.0%
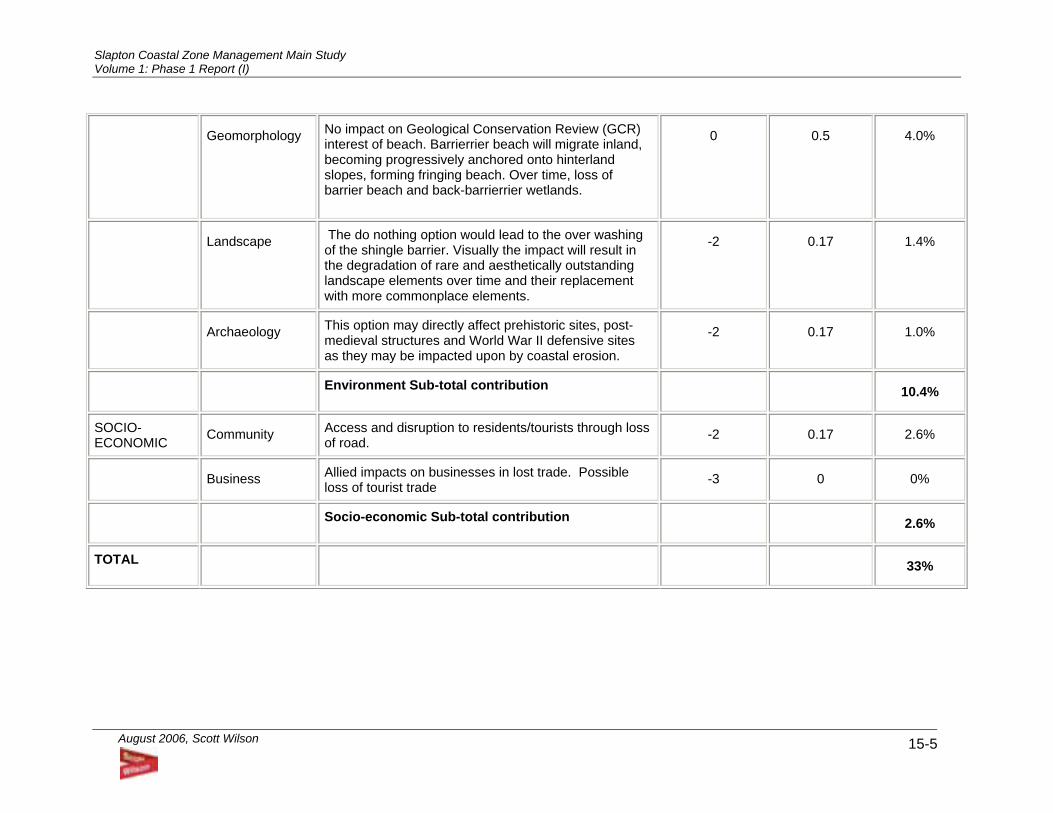
Slapton Coastal Zone Management Main Study Volume 1: Phase 1 Report (I)
August 2006, Scott Wilson 15-5
Geomorphology No impact on Geological Conservation Review (GCR) interest of beach. Barrierrier beach will migrate inland, becoming progressively anchored onto hinterland slopes, forming fringing beach. Over time, loss of barrier beach and back-barrierrier wetlands.
0 0.5 4.0%
Landscape The do nothing option would lead to the over washing of the shingle barrier. Visually the impact will result in the degradation of rare and aesthetically outstanding landscape elements over time and their replacement with more commonplace elements.
-2 0.17 1.4%
Archaeology This option may directly affect prehistoric sites, post-medieval structures and World War II defensive sites as they may be impacted upon by coastal erosion.
-2 0.17 1.0%
Environment Sub-total contribution 10.4%
SOCIO-ECONOMIC Community Access and disruption to residents/tourists through loss
of road. -2 0.17 2.6%
Business Allied impacts on businesses in lost trade. Possible loss of tourist trade -3 0 0%
Socio-economic Sub-total contribution 2.6%
TOTAL 33%
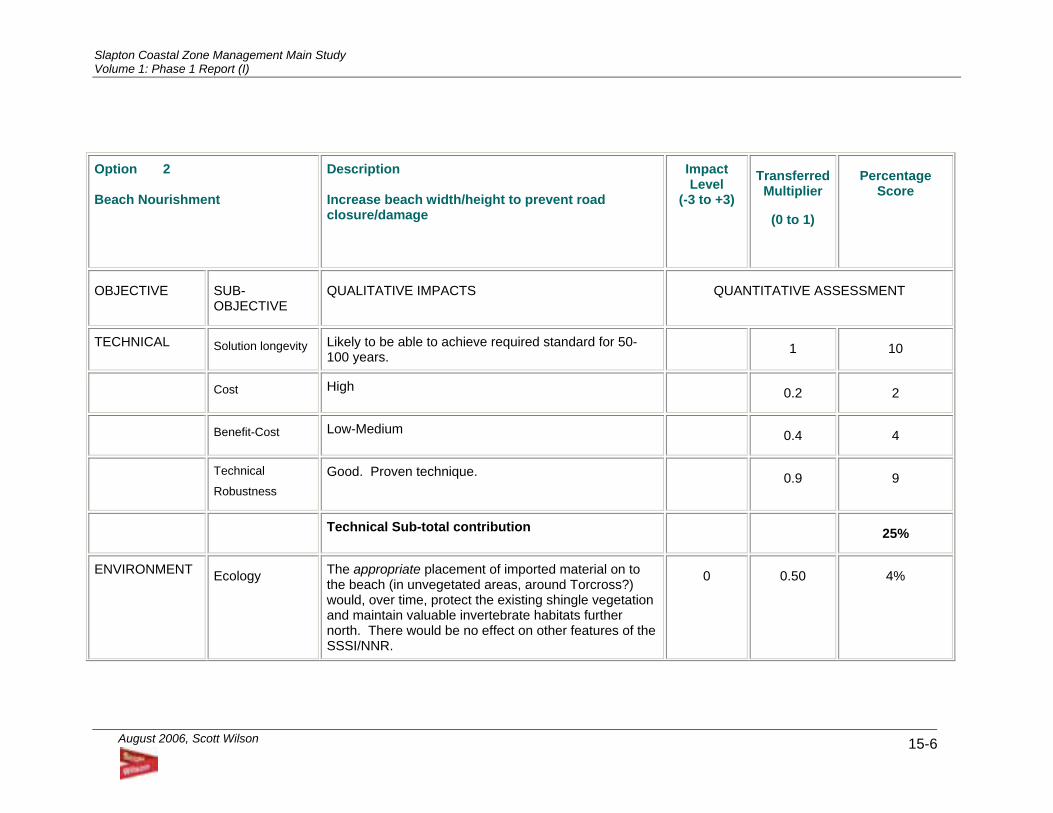
Slapton Coastal Zone Management Main Study Volume 1: Phase 1 Report (I)
August 2006, Scott Wilson 15-6
Option 2 Beach Nourishment
Description Increase beach width/height to prevent road closure/damage
Impact Level
(-3 to +3)
Transferred Multiplier
(0 to 1)
Percentage Score
OBJECTIVE SUB-OBJECTIVE
QUALITATIVE IMPACTS QUANTITATIVE ASSESSMENT
TECHNICAL Solution longevity Likely to be able to achieve required standard for 50-100 years.
1 10
Cost High 0.2 2
Benefit-Cost Low-Medium 0.4 4
Technical
Robustness Good. Proven technique. 0.9 9
Technical Sub-total contribution 25%
ENVIRONMENT Ecology The appropriate placement of imported material on to the beach (in unvegetated areas, around Torcross?) would, over time, protect the existing shingle vegetation and maintain valuable invertebrate habitats further north. There would be no effect on other features of the SSSI/NNR.
0 0.50 4%
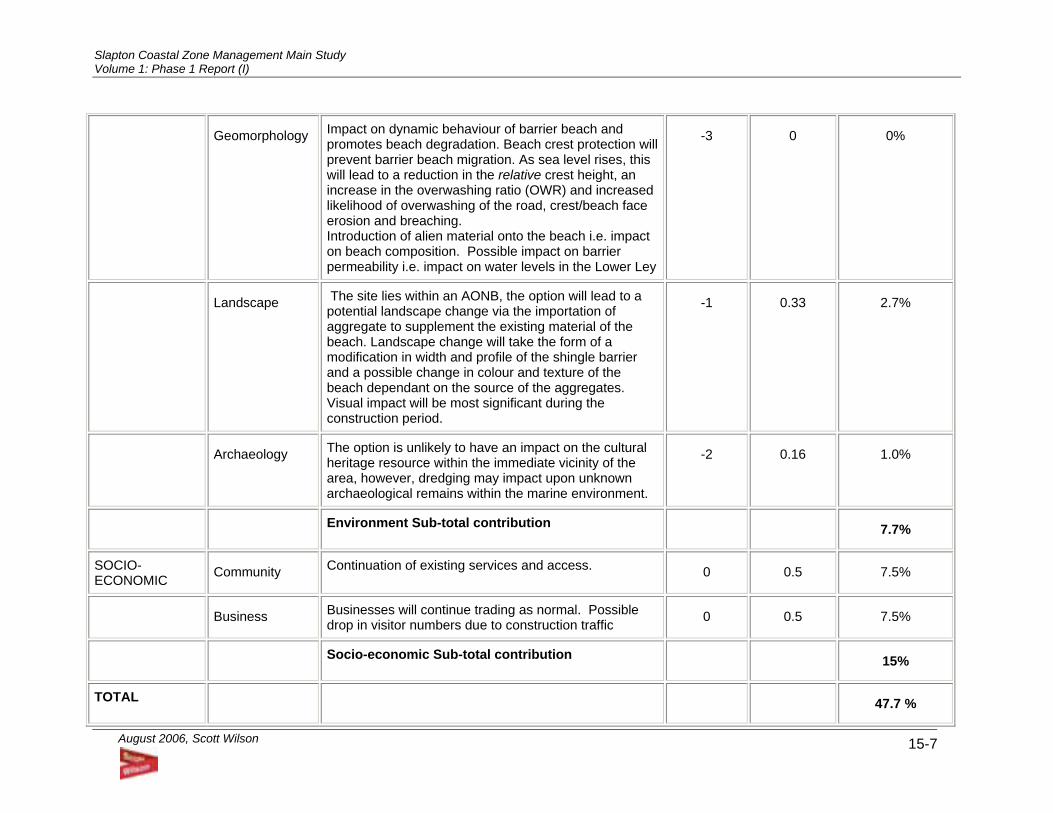
Slapton Coastal Zone Management Main Study Volume 1: Phase 1 Report (I)
August 2006, Scott Wilson 15-7
Geomorphology Impact on dynamic behaviour of barrier beach and promotes beach degradation. Beach crest protection will prevent barrier beach migration. As sea level rises, this will lead to a reduction in the relative crest height, an increase in the overwashing ratio (OWR) and increased likelihood of overwashing of the road, crest/beach face erosion and breaching. Introduction of alien material onto the beach i.e. impact on beach composition. Possible impact on barrier permeability i.e. impact on water levels in the Lower Ley
-3 0 0%
Landscape The site lies within an AONB, the option will lead to a potential landscape change via the importation of aggregate to supplement the existing material of the beach. Landscape change will take the form of a modification in width and profile of the shingle barrier and a possible change in colour and texture of the beach dependant on the source of the aggregates. Visual impact will be most significant during the construction period.
-1 0.33 2.7%
Archaeology The option is unlikely to have an impact on the cultural heritage resource within the immediate vicinity of the area, however, dredging may impact upon unknown archaeological remains within the marine environment.
-2 0.16 1.0%
Environment Sub-total contribution 7.7%
SOCIO-ECONOMIC Community Continuation of existing services and access. 0 0.5 7.5%
Business Businesses will continue trading as normal. Possible drop in visitor numbers due to construction traffic 0 0.5 7.5%
Socio-economic Sub-total contribution 15%
TOTAL 47.7 %
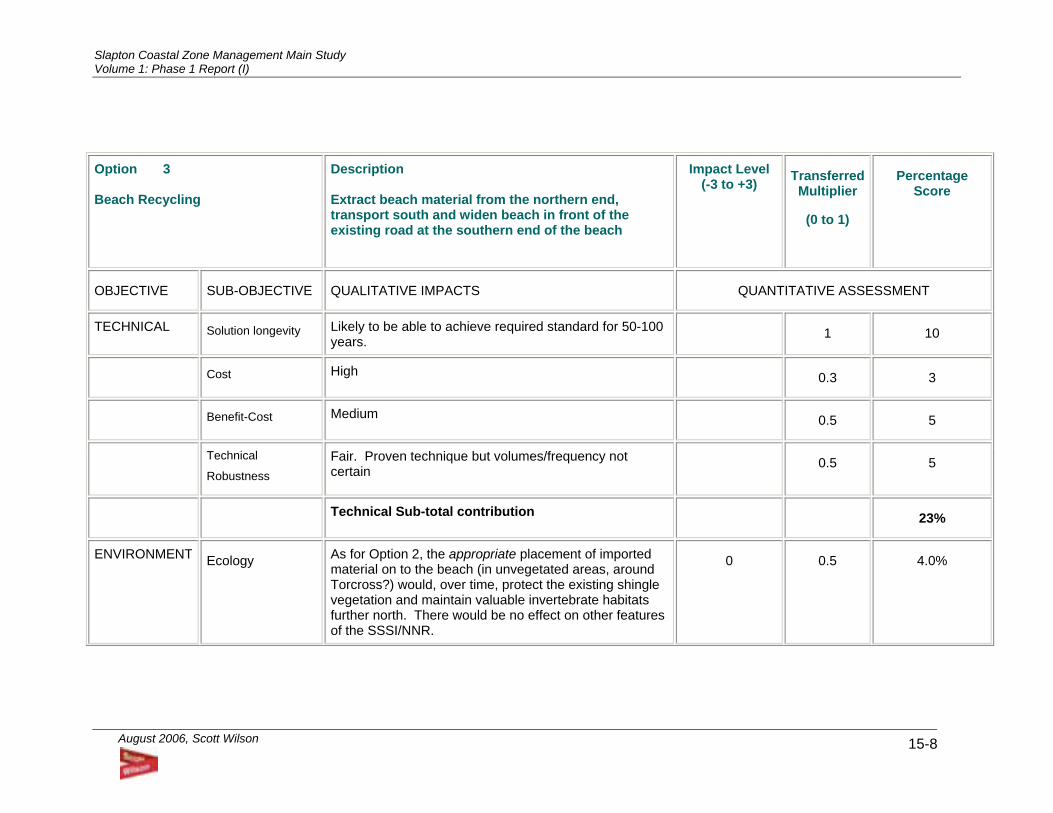
Slapton Coastal Zone Management Main Study Volume 1: Phase 1 Report (I)
August 2006, Scott Wilson 15-8
Option 3 Beach Recycling
Description Extract beach material from the northern end, transport south and widen beach in front of the existing road at the southern end of the beach
Impact Level (-3 to +3) Transferred
Multiplier
(0 to 1)
Percentage Score
OBJECTIVE SUB-OBJECTIVE QUALITATIVE IMPACTS QUANTITATIVE ASSESSMENT
TECHNICAL Solution longevity Likely to be able to achieve required standard for 50-100 years.
1 10
Cost High 0.3 3
Benefit-Cost Medium 0.5 5
Technical
Robustness Fair. Proven technique but volumes/frequency not certain
0.5 5
Technical Sub-total contribution 23%
ENVIRONMENT Ecology As for Option 2, the appropriate placement of imported material on to the beach (in unvegetated areas, around Torcross?) would, over time, protect the existing shingle vegetation and maintain valuable invertebrate habitats further north. There would be no effect on other features of the SSSI/NNR.
0 0.5 4.0%
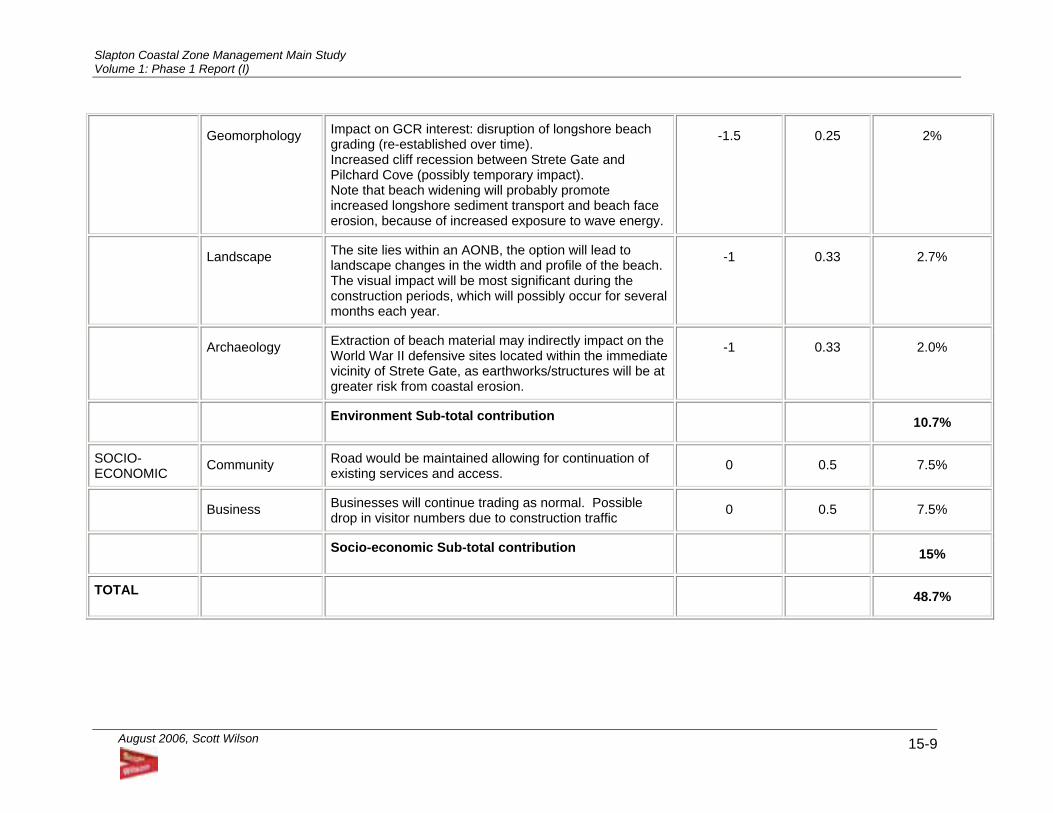
Slapton Coastal Zone Management Main Study Volume 1: Phase 1 Report (I)
August 2006, Scott Wilson 15-9
Geomorphology Impact on GCR interest: disruption of longshore beach grading (re-established over time). Increased cliff recession between Strete Gate and Pilchard Cove (possibly temporary impact). Note that beach widening will probably promote increased longshore sediment transport and beach face erosion, because of increased exposure to wave energy.
-1.5 0.25 2%
Landscape The site lies within an AONB, the option will lead to landscape changes in the width and profile of the beach. The visual impact will be most significant during the construction periods, which will possibly occur for several months each year.
-1 0.33 2.7%
Archaeology Extraction of beach material may indirectly impact on the World War II defensive sites located within the immediate vicinity of Strete Gate, as earthworks/structures will be at greater risk from coastal erosion.
-1 0.33 2.0%
Environment Sub-total contribution 10.7%
SOCIO-ECONOMIC Community Road would be maintained allowing for continuation of
existing services and access. 0 0.5 7.5%
Business Businesses will continue trading as normal. Possible drop in visitor numbers due to construction traffic 0 0.5 7.5%
Socio-economic Sub-total contribution 15%
TOTAL 48.7%
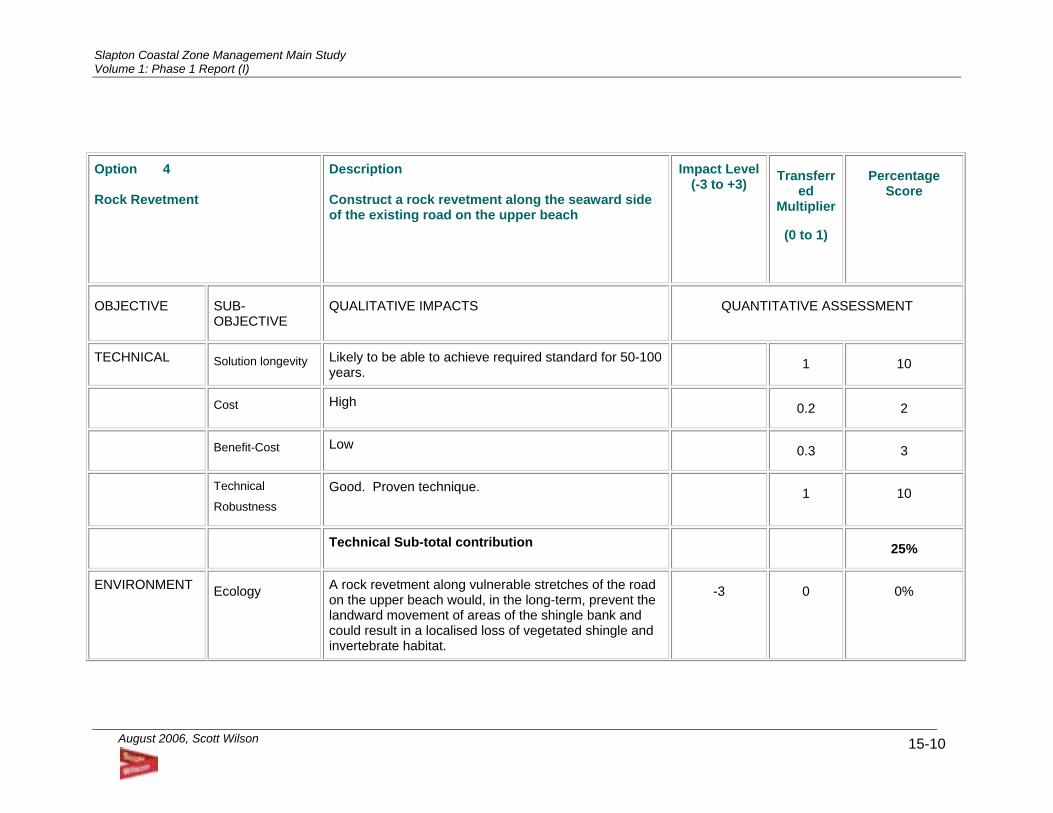
Slapton Coastal Zone Management Main Study Volume 1: Phase 1 Report (I)
August 2006, Scott Wilson 15-10
Option 4 Rock Revetment
Description Construct a rock revetment along the seaward side of the existing road on the upper beach
Impact Level (-3 to +3) Transferr
ed Multiplier
(0 to 1)
Percentage Score
OBJECTIVE SUB-OBJECTIVE
QUALITATIVE IMPACTS QUANTITATIVE ASSESSMENT
TECHNICAL Solution longevity Likely to be able to achieve required standard for 50-100 years.
1 10
Cost High 0.2 2
Benefit-Cost Low 0.3 3
Technical
Robustness Good. Proven technique. 1 10
Technical Sub-total contribution 25%
ENVIRONMENT Ecology A rock revetment along vulnerable stretches of the road on the upper beach would, in the long-term, prevent the landward movement of areas of the shingle bank and could result in a localised loss of vegetated shingle and invertebrate habitat.
-3 0 0%
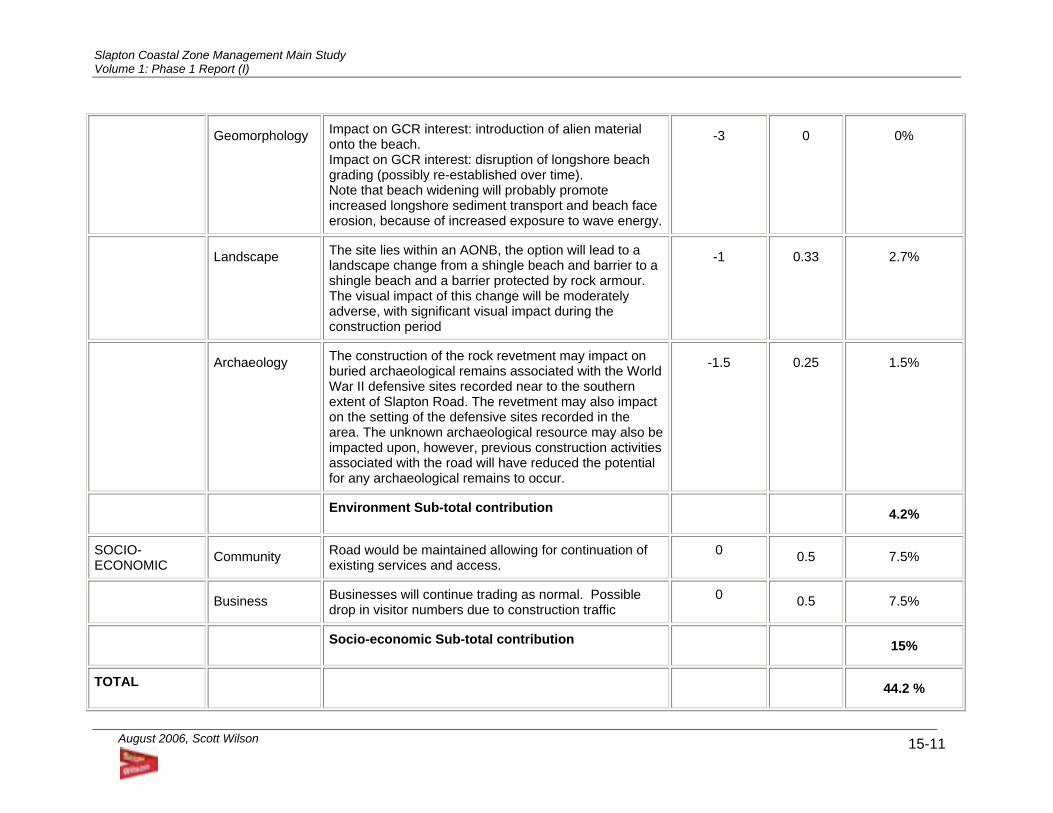
Slapton Coastal Zone Management Main Study Volume 1: Phase 1 Report (I)
August 2006, Scott Wilson 15-11
Geomorphology Impact on GCR interest: introduction of alien material onto the beach. Impact on GCR interest: disruption of longshore beach grading (possibly re-established over time). Note that beach widening will probably promote increased longshore sediment transport and beach face erosion, because of increased exposure to wave energy.
-3 0 0%
Landscape The site lies within an AONB, the option will lead to a landscape change from a shingle beach and barrier to a shingle beach and a barrier protected by rock armour. The visual impact of this change will be moderately adverse, with significant visual impact during the construction period
-1 0.33 2.7%
Archaeology The construction of the rock revetment may impact on buried archaeological remains associated with the World War II defensive sites recorded near to the southern extent of Slapton Road. The revetment may also impact on the setting of the defensive sites recorded in the area. The unknown archaeological resource may also be impacted upon, however, previous construction activities associated with the road will have reduced the potential for any archaeological remains to occur.
-1.5 0.25 1.5%
Environment Sub-total contribution 4.2%
SOCIO-ECONOMIC Community Road would be maintained allowing for continuation of
existing services and access. 0 0.5 7.5%
Business Businesses will continue trading as normal. Possible drop in visitor numbers due to construction traffic
0 0.5 7.5%
Socio-economic Sub-total contribution 15%
TOTAL 44.2 %
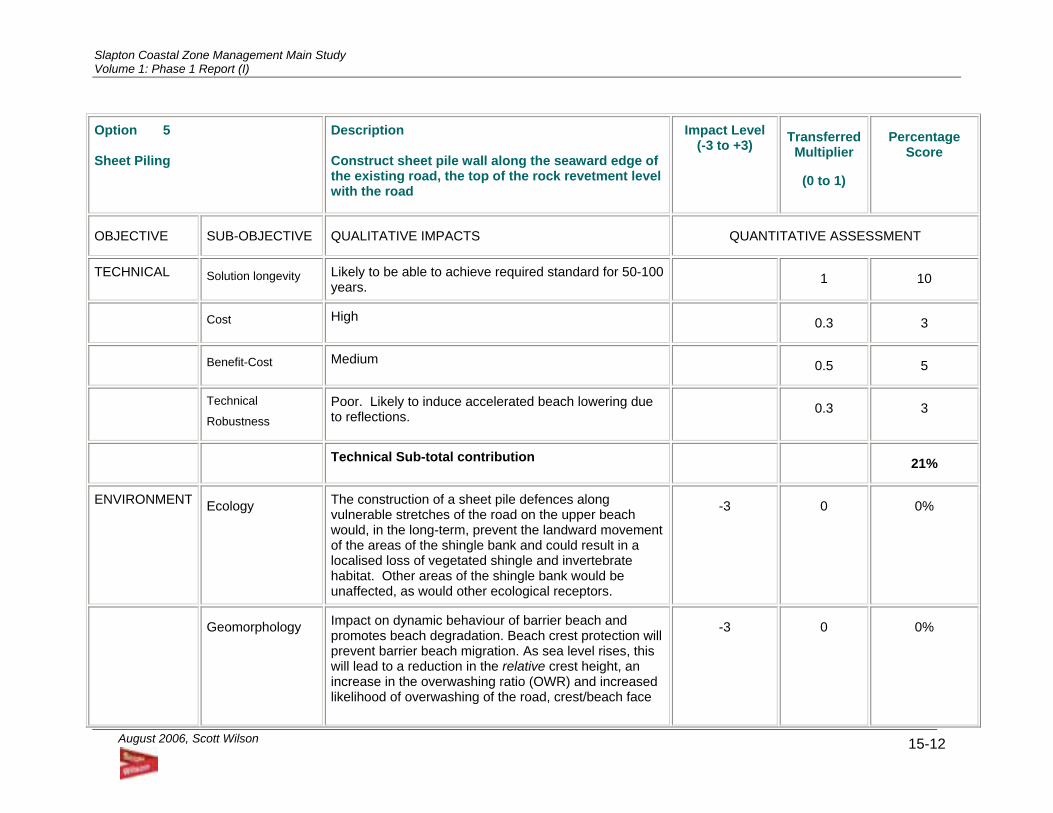
Slapton Coastal Zone Management Main Study Volume 1: Phase 1 Report (I)
August 2006, Scott Wilson 15-12
Option 5 Sheet Piling
Description Construct sheet pile wall along the seaward edge of the existing road, the top of the rock revetment level with the road
Impact Level (-3 to +3) Transferred
Multiplier
(0 to 1)
Percentage Score
OBJECTIVE SUB-OBJECTIVE QUALITATIVE IMPACTS QUANTITATIVE ASSESSMENT
TECHNICAL Solution longevity Likely to be able to achieve required standard for 50-100 years.
1 10
Cost High 0.3 3
Benefit-Cost Medium 0.5 5
Technical
Robustness Poor. Likely to induce accelerated beach lowering due to reflections.
0.3 3
Technical Sub-total contribution 21%
ENVIRONMENT Ecology The construction of a sheet pile defences along vulnerable stretches of the road on the upper beach would, in the long-term, prevent the landward movement of the areas of the shingle bank and could result in a localised loss of vegetated shingle and invertebrate habitat. Other areas of the shingle bank would be unaffected, as would other ecological receptors.
-3 0 0%
Geomorphology Impact on dynamic behaviour of barrier beach and promotes beach degradation. Beach crest protection will prevent barrier beach migration. As sea level rises, this will lead to a reduction in the relative crest height, an increase in the overwashing ratio (OWR) and increased likelihood of overwashing of the road, crest/beach face
-3 0 0%
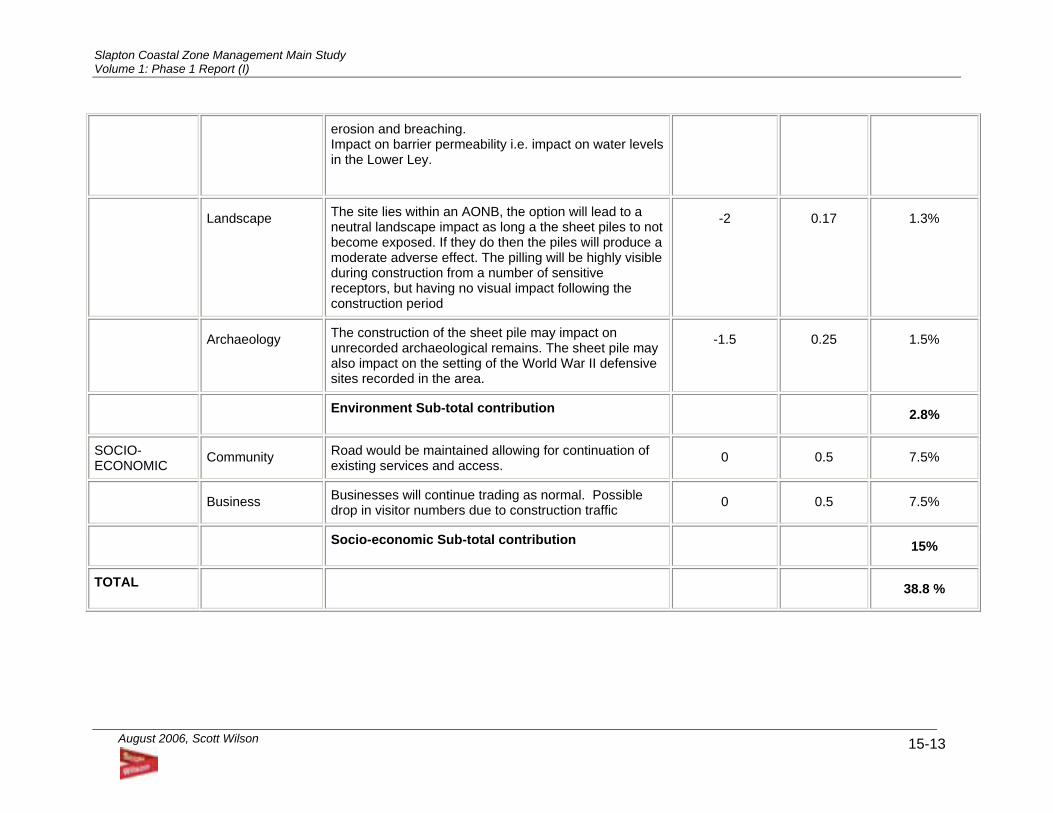
Slapton Coastal Zone Management Main Study Volume 1: Phase 1 Report (I)
August 2006, Scott Wilson 15-13
erosion and breaching. Impact on barrier permeability i.e. impact on water levels in the Lower Ley.
Landscape The site lies within an AONB, the option will lead to a neutral landscape impact as long a the sheet piles to not become exposed. If they do then the piles will produce a moderate adverse effect. The pilling will be highly visible during construction from a number of sensitive receptors, but having no visual impact following the construction period
-2 0.17 1.3%
Archaeology The construction of the sheet pile may impact on unrecorded archaeological remains. The sheet pile may also impact on the setting of the World War II defensive sites recorded in the area.
-1.5 0.25 1.5%
Environment Sub-total contribution 2.8%
SOCIO-ECONOMIC Community Road would be maintained allowing for continuation of
existing services and access. 0 0.5 7.5%
Business Businesses will continue trading as normal. Possible drop in visitor numbers due to construction traffic 0 0.5 7.5%
Socio-economic Sub-total contribution 15%
TOTAL 38.8 %
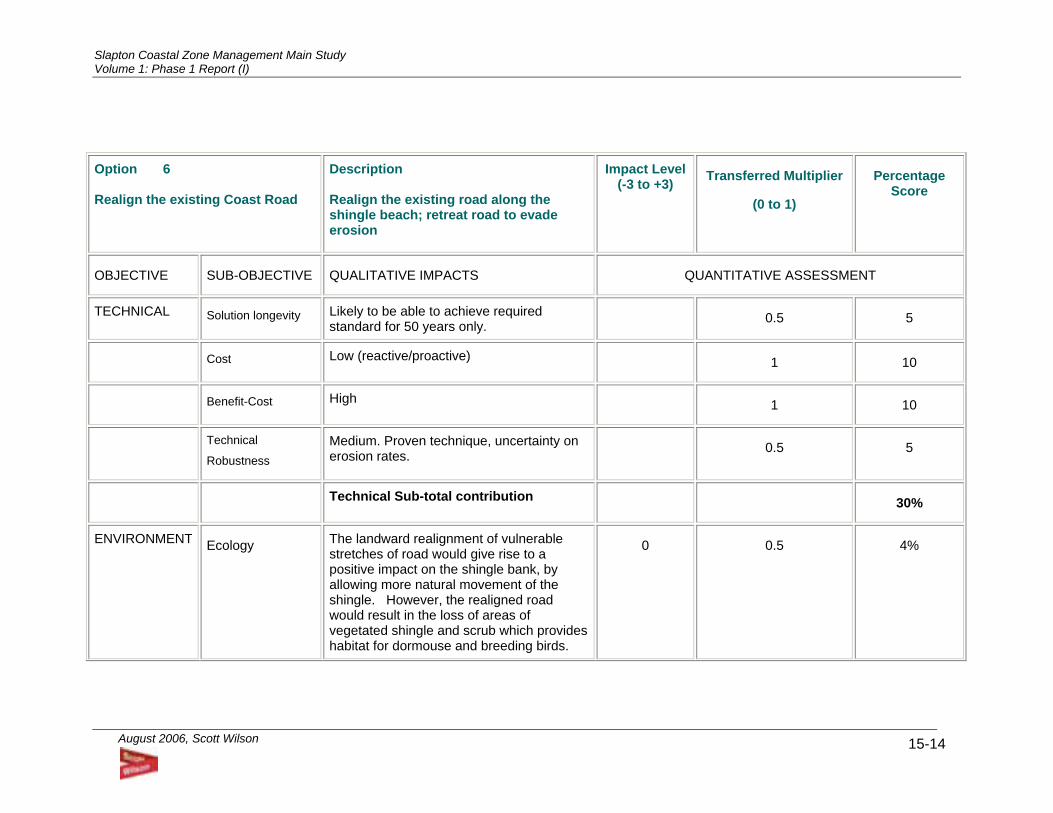
Slapton Coastal Zone Management Main Study Volume 1: Phase 1 Report (I)
August 2006, Scott Wilson 15-14
Option 6 Realign the existing Coast Road
Description Realign the existing road along the shingle beach; retreat road to evade erosion
Impact Level (-3 to +3) Transferred Multiplier
(0 to 1)
Percentage Score
OBJECTIVE SUB-OBJECTIVE QUALITATIVE IMPACTS QUANTITATIVE ASSESSMENT
TECHNICAL Solution longevity Likely to be able to achieve required standard for 50 years only.
0.5 5
Cost Low (reactive/proactive) 1 10
Benefit-Cost High 1 10
Technical
Robustness Medium. Proven technique, uncertainty on erosion rates.
0.5 5
Technical Sub-total contribution 30%
ENVIRONMENT Ecology The landward realignment of vulnerable stretches of road would give rise to a positive impact on the shingle bank, by allowing more natural movement of the shingle. However, the realigned road would result in the loss of areas of vegetated shingle and scrub which provides habitat for dormouse and breeding birds.
0 0.5 4%
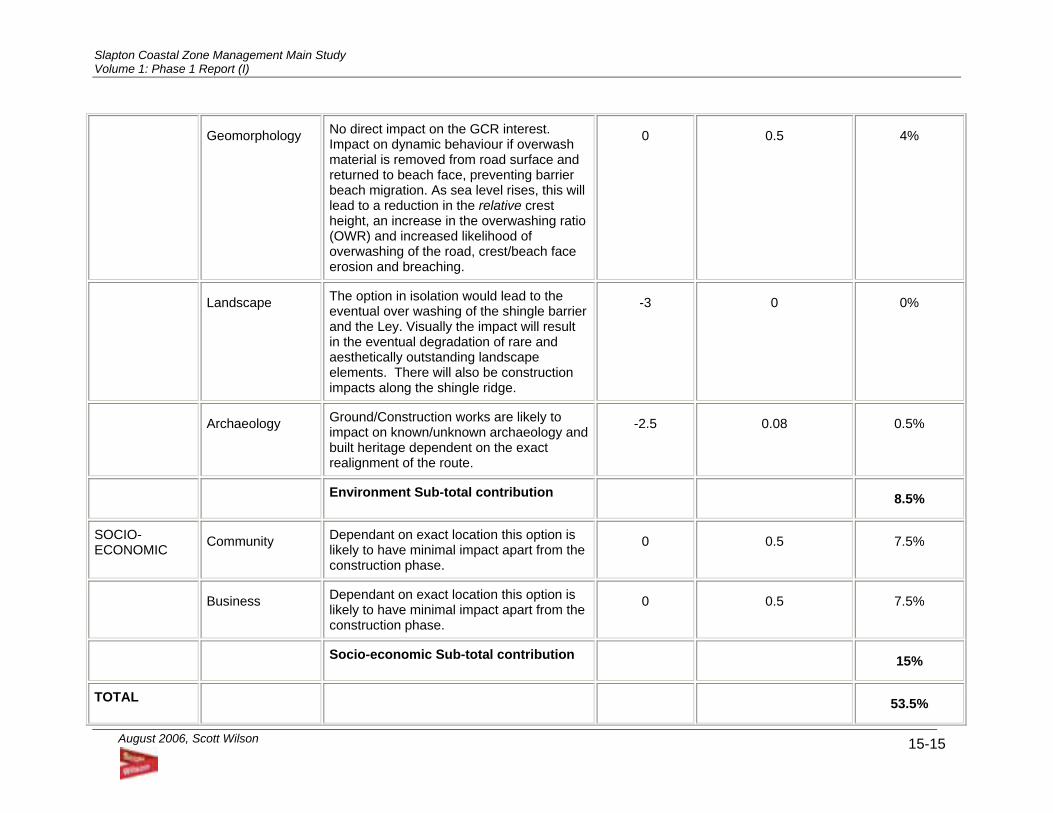
Slapton Coastal Zone Management Main Study Volume 1: Phase 1 Report (I)
August 2006, Scott Wilson 15-15
Geomorphology No direct impact on the GCR interest. Impact on dynamic behaviour if overwash material is removed from road surface and returned to beach face, preventing barrier beach migration. As sea level rises, this will lead to a reduction in the relative crest height, an increase in the overwashing ratio (OWR) and increased likelihood of overwashing of the road, crest/beach face erosion and breaching.
0 0.5 4%
Landscape The option in isolation would lead to the eventual over washing of the shingle barrier and the Ley. Visually the impact will result in the eventual degradation of rare and aesthetically outstanding landscape elements. There will also be construction impacts along the shingle ridge.
-3 0 0%
Archaeology Ground/Construction works are likely to impact on known/unknown archaeology and built heritage dependent on the exact realignment of the route.
-2.5 0.08 0.5%
Environment Sub-total contribution 8.5%
SOCIO-ECONOMIC Community Dependant on exact location this option is
likely to have minimal impact apart from the construction phase.
0 0.5 7.5%
Business Dependant on exact location this option is likely to have minimal impact apart from the construction phase.
0 0.5 7.5%
Socio-economic Sub-total contribution 15%
TOTAL 53.5%
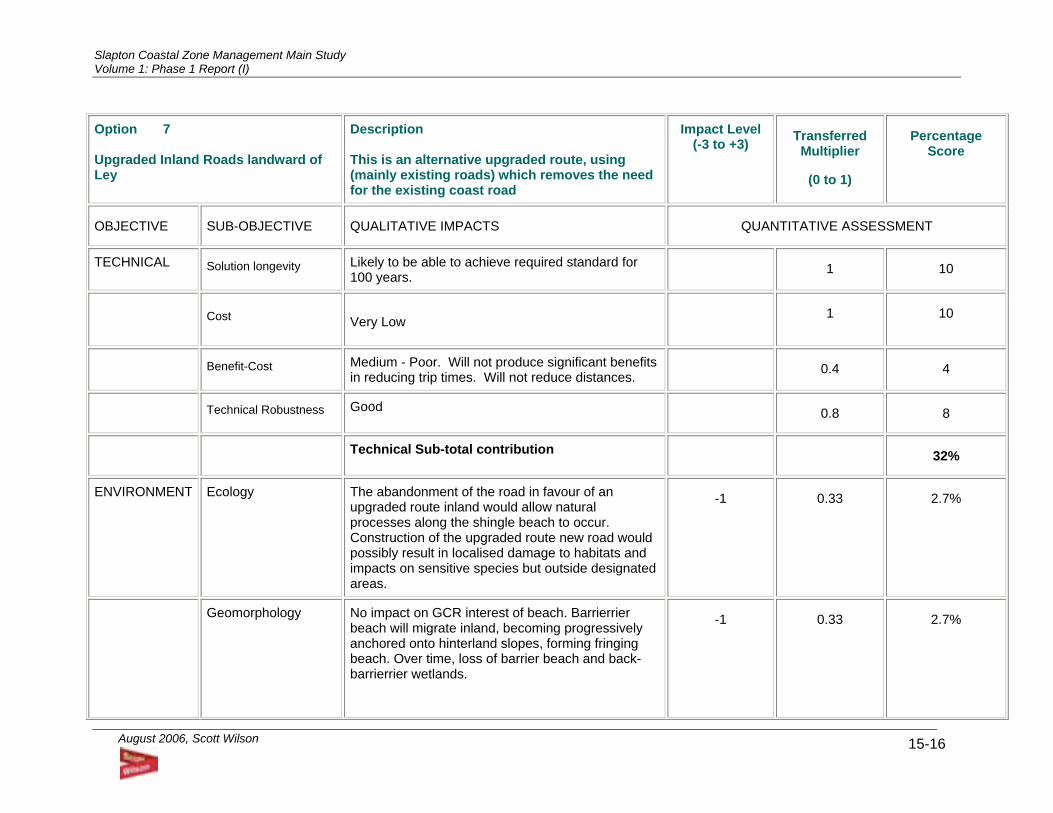
Slapton Coastal Zone Management Main Study Volume 1: Phase 1 Report (I)
August 2006, Scott Wilson 15-16
Option 7 Upgraded Inland Roads landward of Ley
Description This is an alternative upgraded route, using (mainly existing roads) which removes the need for the existing coast road
Impact Level (-3 to +3) Transferred
Multiplier
(0 to 1)
Percentage Score
OBJECTIVE SUB-OBJECTIVE QUALITATIVE IMPACTS QUANTITATIVE ASSESSMENT
TECHNICAL Solution longevity Likely to be able to achieve required standard for 100 years.
1 10
Cost
Very Low
1 10
Benefit-Cost Medium - Poor. Will not produce significant benefits in reducing trip times. Will not reduce distances.
0.4 4
Technical Robustness Good 0.8 8
Technical Sub-total contribution 32%
ENVIRONMENT Ecology The abandonment of the road in favour of an upgraded route inland would allow natural processes along the shingle beach to occur. Construction of the upgraded route new road would possibly result in localised damage to habitats and impacts on sensitive species but outside designated areas.
-1 0.33 2.7%
Geomorphology No impact on GCR interest of beach. Barrierrier beach will migrate inland, becoming progressively anchored onto hinterland slopes, forming fringing beach. Over time, loss of barrier beach and back-barrierrier wetlands.
-1 0.33 2.7%
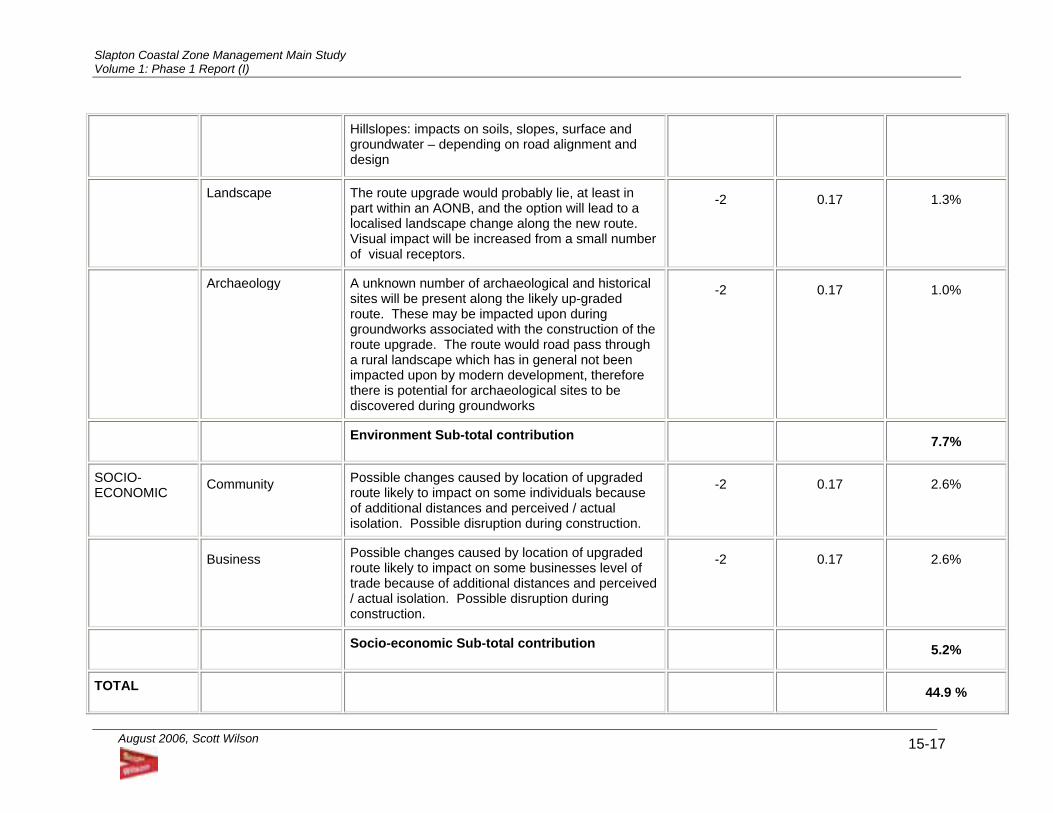
Slapton Coastal Zone Management Main Study Volume 1: Phase 1 Report (I)
August 2006, Scott Wilson 15-17
Hillslopes: impacts on soils, slopes, surface and groundwater – depending on road alignment and design
Landscape The route upgrade would probably lie, at least in part within an AONB, and the option will lead to a localised landscape change along the new route. Visual impact will be increased from a small number of visual receptors.
-2 0.17 1.3%
Archaeology A unknown number of archaeological and historical sites will be present along the likely up-graded route. These may be impacted upon during groundworks associated with the construction of the route upgrade. The route would road pass through a rural landscape which has in general not been impacted upon by modern development, therefore there is potential for archaeological sites to be discovered during groundworks
-2 0.17 1.0%
Environment Sub-total contribution 7.7%
SOCIO-ECONOMIC Community Possible changes caused by location of upgraded
route likely to impact on some individuals because of additional distances and perceived / actual isolation. Possible disruption during construction.
-2 0.17 2.6%
Business Possible changes caused by location of upgraded route likely to impact on some businesses level of trade because of additional distances and perceived / actual isolation. Possible disruption during construction.
-2 0.17 2.6%
Socio-economic Sub-total contribution 5.2%
TOTAL 44.9 %
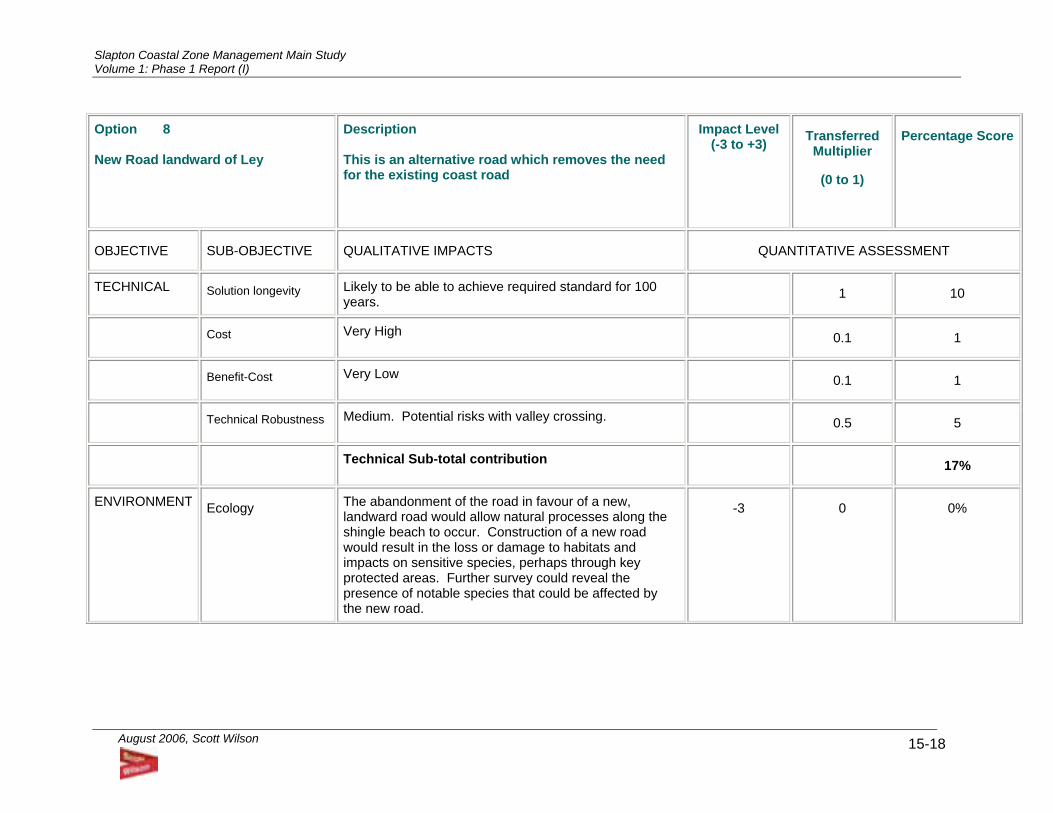
Slapton Coastal Zone Management Main Study Volume 1: Phase 1 Report (I)
August 2006, Scott Wilson 15-18
Option 8 New Road landward of Ley
Description This is an alternative road which removes the need for the existing coast road
Impact Level (-3 to +3) Transferred
Multiplier
(0 to 1)
Percentage Score
OBJECTIVE SUB-OBJECTIVE QUALITATIVE IMPACTS QUANTITATIVE ASSESSMENT
TECHNICAL Solution longevity Likely to be able to achieve required standard for 100 years.
1 10
Cost Very High 0.1 1
Benefit-Cost Very Low 0.1 1
Technical Robustness Medium. Potential risks with valley crossing. 0.5 5
Technical Sub-total contribution 17%
ENVIRONMENT Ecology The abandonment of the road in favour of a new, landward road would allow natural processes along the shingle beach to occur. Construction of a new road would result in the loss or damage to habitats and impacts on sensitive species, perhaps through key protected areas. Further survey could reveal the presence of notable species that could be affected by the new road.
-3 0 0%
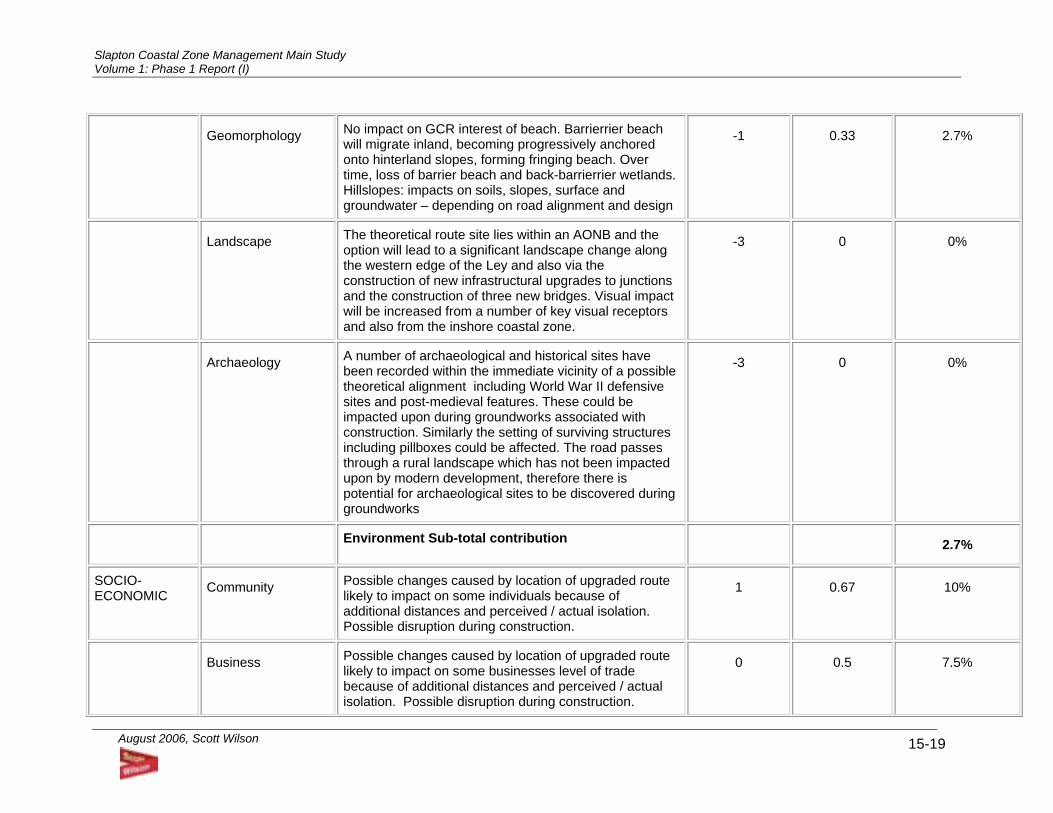
Slapton Coastal Zone Management Main Study Volume 1: Phase 1 Report (I)
August 2006, Scott Wilson 15-19
Geomorphology No impact on GCR interest of beach. Barrierrier beach will migrate inland, becoming progressively anchored onto hinterland slopes, forming fringing beach. Over time, loss of barrier beach and back-barrierrier wetlands. Hillslopes: impacts on soils, slopes, surface and groundwater – depending on road alignment and design
-1 0.33 2.7%
Landscape The theoretical route site lies within an AONB and the option will lead to a significant landscape change along the western edge of the Ley and also via the construction of new infrastructural upgrades to junctions and the construction of three new bridges. Visual impact will be increased from a number of key visual receptors and also from the inshore coastal zone.
-3 0 0%
Archaeology A number of archaeological and historical sites have been recorded within the immediate vicinity of a possible theoretical alignment including World War II defensive sites and post-medieval features. These could be impacted upon during groundworks associated with construction. Similarly the setting of surviving structures including pillboxes could be affected. The road passes through a rural landscape which has not been impacted upon by modern development, therefore there is potential for archaeological sites to be discovered during groundworks
-3 0 0%
Environment Sub-total contribution 2.7%
SOCIO-ECONOMIC Community Possible changes caused by location of upgraded route
likely to impact on some individuals because of additional distances and perceived / actual isolation. Possible disruption during construction.
1 0.67 10%
Business Possible changes caused by location of upgraded route likely to impact on some businesses level of trade because of additional distances and perceived / actual isolation. Possible disruption during construction.
0 0.5 7.5%

Slapton Coastal Zone Management Main Study Volume 1: Phase 1 Report (I)
August 2006, Scott Wilson 15-20
Socio-economic Sub-total contribution 17.5%
TOTAL 37.2%
Slapton Coastal Zone Management Main Study Volume 1: Phase 1 Report (I)
August 2006, Scott Wilson
16-1
16 Funding Review
16.1 DEFRA has overall policy responsibility for flood and coastal erosion risk in England and funds
most of the Environment Agency's flood management activities in England. DEFRA also
provides grant aid on a project by project basis to the other flood and coastal defence operating
authorities to support their investment in improvement projects to manage flood and coastal
erosion risk. DEFRA have a fixed national budget for all projects.
16.2 From 2004/05 Government support for capital investment will be described as either Supported
Capital Expenditure (Revenue), known as SCE(R), or Supported Capital Expenditure (Capital
Grant), known as SCE(C). SCE can be further classified as either single pot SCE(R)/SCE(C) or
ringfenced SCE(R)/SCE(C) - although of course this distinction is irrelevant to single purpose
authorities and the GLA, who are outside the single capital pot. DEFRA grant aid to local
authorities for flood and coastal defence will be paid as ring-fenced Supported Capital
Expenditure (Capital) - SCE(C).
16.3 Additional support will be available in the form of Supported Capital Expenditure (Revenue) -
SCE(R). For example, if a project costs £10,000 and DEFRA provides SCE(C) at 45% this still
leaves £5,500 for the operating authority to fund. Local authorities can apply to DEFRA for
SCE(R) to help with this. The eligible amount would be reduced if the authority was also
receiving funds from elsewhere, for example a contribution towards the cost from another local
authority. DEFRA writes to local authorities three times a year to ascertain their SCE(R)
requirement. Authorities will also be asked to confirm details of their SCE(R) requirement as
their projects are approved for grant during the year. Once approved by DEFRA, funding
dependent on SCE(R) is administered by the Office of the Deputy Prime Minister.
16.4 DEFRA grant aid is available when the flood and coastal defence solutions are shown to be
technically, economically and environmentally sound and sustainable, subject to the availability
of funds. DEFRA guidance on the appraisal of projects for this purpose is contained in their
Project Appraisal Guidance (FCDPAG) series of documents. On top of this basic individual
project appraisal DEFRA also apply a system of prioritisation to decide which of all the
worthwhile capital projects will be eligible for grant aid. Economic appraisal and prioritisation
are necessary where the demand for investment exceeds available resources.
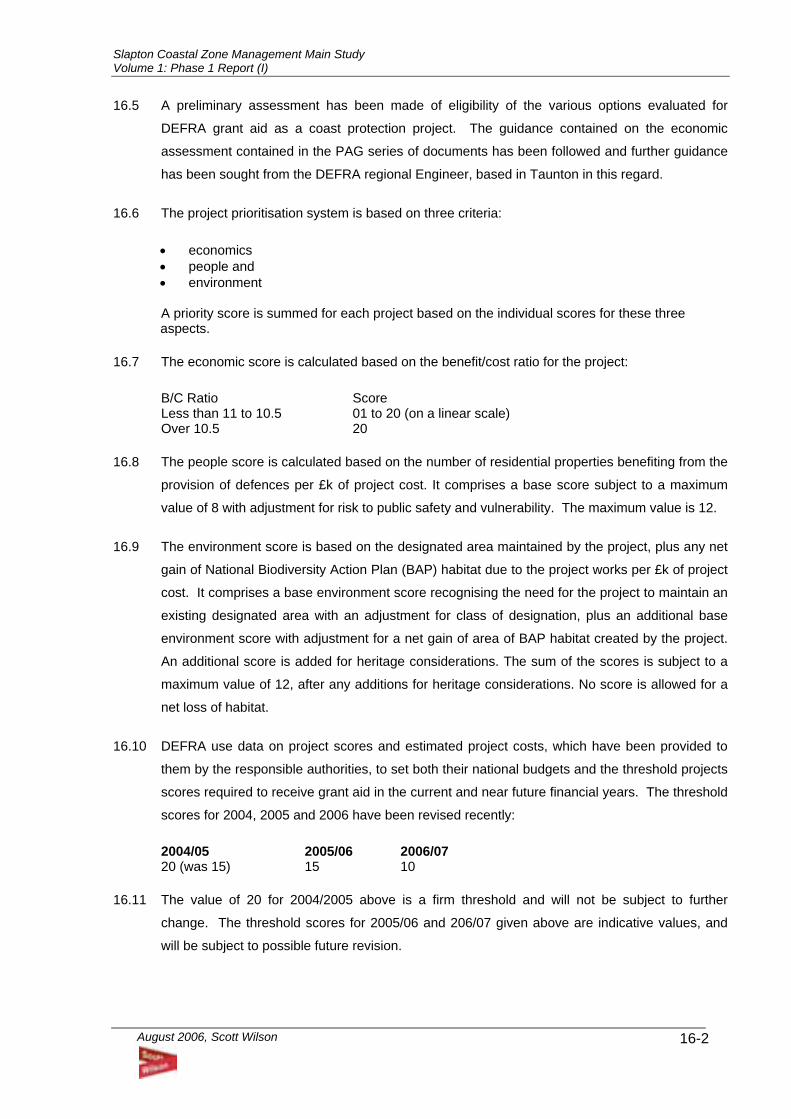
Slapton Coastal Zone Management Main Study Volume 1: Phase 1 Report (I)
August 2006, Scott Wilson
16-2
16.5 A preliminary assessment has been made of eligibility of the various options evaluated for
DEFRA grant aid as a coast protection project. The guidance contained on the economic
assessment contained in the PAG series of documents has been followed and further guidance
has been sought from the DEFRA regional Engineer, based in Taunton in this regard.
16.6 The project prioritisation system is based on three criteria:
• economics • people and • environment
A priority score is summed for each project based on the individual scores for these three aspects.
16.7 The economic score is calculated based on the benefit/cost ratio for the project:
B/C Ratio Score Less than 11 to 10.5 01 to 20 (on a linear scale) Over 10.5 20
16.8 The people score is calculated based on the number of residential properties benefiting from the
provision of defences per £k of project cost. It comprises a base score subject to a maximum
value of 8 with adjustment for risk to public safety and vulnerability. The maximum value is 12.
16.9 The environment score is based on the designated area maintained by the project, plus any net
gain of National Biodiversity Action Plan (BAP) habitat due to the project works per £k of project
cost. It comprises a base environment score recognising the need for the project to maintain an
existing designated area with an adjustment for class of designation, plus an additional base
environment score with adjustment for a net gain of area of BAP habitat created by the project.
An additional score is added for heritage considerations. The sum of the scores is subject to a
maximum value of 12, after any additions for heritage considerations. No score is allowed for a
net loss of habitat.
16.10 DEFRA use data on project scores and estimated project costs, which have been provided to
them by the responsible authorities, to set both their national budgets and the threshold projects
scores required to receive grant aid in the current and near future financial years. The threshold
scores for 2004, 2005 and 2006 have been revised recently:
2004/05 2005/06 2006/07 20 (was 15) 15 10
16.11 The value of 20 for 2004/2005 above is a firm threshold and will not be subject to further
change. The threshold scores for 2005/06 and 206/07 given above are indicative values, and
will be subject to possible future revision.
Slapton Coastal Zone Management Main Study Volume 1: Phase 1 Report (I)
August 2006, Scott Wilson
16-3
16.12 It should be noted that the source of costs and benefits is important to DEFRA in assessing
whether a project is eligible for grant aid. DEFRA have indicated that they will consider
contributing to a project in proportion to the type of benefits, which accrue. In this project an
outline economic assessment has been carried out and only the tangible benefits have been
assessed. The majority of the benefits arising from the various options (more than 90%) are
avoidance costs related to the additional journey distances should the A379 be damaged or lost.
In this case DEFRA have indicated that it is unlikely that the scheme would be eligible for
significant grant aid. A small amount of grant aid may be available in proportion to the non-
transport related benefits that would accrue, but the scheme would have to comply with all other
DEFRA requirements.
16.13 DEFRA have also indicated that since the majority of the benefits, arising from the options
considered are related to the road, they would consider these schemes to be primarily transport
schemes. Consequently they would expect the majority of funding to be provided from the
appropriate transport agency or body. Initial comments from Devon County Council suggest
that Department for Transport funding is likely to be concentrated on major urban area schemes
of regional priority, and that sustaining the coast road is unlikely to be seen as a priority highway
project, and therefore funding is likely to be very limited or unavailable.
16.14 Funding would potentially be available for the costs associated with protection of Torcross.
DEFRA currently only provide a 35% grant aid contribution to South Hams District Council.
16.15 The assessment concluded that it is unlikely that the a road protection project or beach
management scheme would be eligible for DEFRA funding, even though such a scheme can be
shown to be economically viable using the DEFRA criteria. The property protection element
would be eligible.
16.16 In Chapter 14 it was estimated that a technically viable scheme to keep the road for at least 50
years would have a cost in the order of £4.5m over the 50-year period at present day prices. It
is likely that the majority of this funding would have to have to be funded by the Slapton Line
Partnership.
16.17 At this stage investigations have not been made into availability of other sources of funding.
However the scoping study refers to alternative funding opportunities, and these are
summarised below (after Atkins, 2001). More work is required to evaluate possible funding
sources, once the option shortlist has been determined.
Slapton Coastal Zone Management Main Study Volume 1: Phase 1 Report (I)
August 2006, Scott Wilson
16-4
Alternative funding sources English Nature
16.18 Potential funding from the Biodiversity Grant Scheme, if the community were to become
involved in enhancing the biodiversity at Slapton. Funding through the National Nature Reserve
as a result of reserve management, access and interpretation.
European Regional Development Fund (ERDF)
16.19 Possible funding under the South West Objective 2 Programme, representing coastal protection
works with the potential to significantly benefit existing tourist attractions such as Slapton Ley
SSSI and NNR, and to maintain and improve an important multiple user communication route
such as the A379.
Government Office for the South West (GOSW)
16.20 Based on the programme and policies set out in the Devon County Local Transport Plan and the
recommendations for the SWARMMS report, it may be possible to access funding from the
GOSW.
Leader +
16.21 This programme is EU funded and aims to encourage long-term potential of rural areas through
high-quality, original and sustainable projects. Could gain part funding through the Leader
programme, as part of a wider partnership project to improve natural environment and economic
environment through better transport links in South Devon.
Life Nature
16.22 This is a European Union programme that provides funding to conserve natural habitats and
wild fauna and flora of EU interest. Funding could be possible for mitigation works on the sluice,
as well as providing an opportunity to enhance the natural biodiversity of the area through
management of the shingle ridge during transition phase.
Natural Environment Research Council (NERC)
16.23 Funding awarded for science research of international quality, with the opportunity for scientists
to bid for free use of NERC research vessels. Potential funding for marine and environmental
research through the academic community, could allow further site investigations into
geomorphological processes and ecological interest in and around Start Bay. To assist in
appraising the impacts on the habitat and effects on the flora and fauna should the Ley be
inundated.

Slapton Coastal Zone Management Main Study Volume 1: Phase 1 Report (I)
August 2006, Scott Wilson
16-5
The Countryside Agency
16.24 Grants are available for environmentally based projects that serve to increase peoples
enjoyment of the countryside through improved access and landscape features.
The South West of England Regional Development Agency (SWERDA)
16.25 Potential funding available if the A379 route was demonstrated as being of fundamental
importance in supporting existing and facilitating further economic development, possibly
through tourism development at Slapton Sands and Ley.
Slapton Coastal Zone Management Main Study Volume 1: Phase 1 Report (I)
August 2006, Scott Wilson
17-1
17 Conclusions
17.1 The key beach processes affecting Slapton Sands are:
Short-term storm impacts
Medium term longshore transport gradients
Long-term sea level rise causing the shingle barrier to rollback landwards
17.2 Each of these processes was studied. Short- and medium-term impacts are coastal process
issues, whereas long-term changes are best considered within a geomorphological framework.
17.3 The cross-shore profile predicted by Powell’s model, at the time and location of the road
collapse in January 2001, shows that the storm event was of a sufficient severity (wave height)
and occurred in conjunction with a sufficiently high still water level to impact on the crest of the
shingle ridge. The breach prediction model of Bradbury suggests that at the time of the road
collapse in January 2001, the loss of road was due to beach cut back not due to the mechanism
of over washing and roll back. The sensitivity tests showed that neither a sea level rise of
250mm, nor a reduction in barrier cross-sectional area of 30% would significantly increase the
chances of this mechanism becoming dominant.
17.4 The January 2001 erosion event can clearly be categorised as cut-back of the edge of the
shingle barrier as indicated on Figure 10.25 in Volume 2, and not as a breach of the barrier.
17.5 Examination of aerial photographs from 1999 shows that, compared to adjacent areas, the face
of the shingle ridge was further seawards at the central car park and at the location where the
road was undermined. Therefore these areas had steeper beaches and were at higher risk of
greater erosion than other areas.
17.6 Large changes in beach areas and shoreline position occur over medium term time scales
(weeks, months). The observed trends in the amount of beach volume above the mid and high
water lines have been of gradual increase to the north of Strete Gate, decrease at the road
collapse location and more gradual decrease at Torcross. However, these trends are based on
a data set which is probably statistically unreliable.
17.7 Longshore transport rates have been calculated based on a new and comprehensive analysis of
4 year’s data, which includes the effect of varying water levels and thus the influence of the
Skerries Bank on the waves and sediment movements. The results show that high rates of net
annual sediment transport do occur (of the order of 150,000 m3 per annum), but that the rate
and direction varies from year to year and with location along the frontage. Averaged over the 4-
Slapton Coastal Zone Management Main Study Volume 1: Phase 1 Report (I)
August 2006, Scott Wilson
17-2
year period, the net transport rates are lower (about 75,000 m3), indicating landward retreat at
Torcross and accretion at Strete Gate over this period. Given that a 4-year record is short
compared to the expected natural variability of climate over decadal time scales, these results
should not be extrapolated to decadal time scales.
17.8 Results from a numerical model demonstrate that quite large changes in the shoreline position
(of the order of 5 to 10m) can occur in medium term periods (weeks, months). Model results
show that at the time of the road collapse in January 2001, the shoreline position around the
location of the collapsed road had receded by about 4m from 1st October 2000 to 10th January
2001.
17.9 At the time of the road collapse event in January 2001, the beach volumes above mid and high
water levels at the location were at the lowest recorded value in the 31-year record.
17.10 The storm was an unusual combination of moderately high water levels at Spring tide and a
sustained period of high waves from the east. Based on analysis of wind speeds, wind direction,
and storm duration from a data set from 1980 to 2004, it is estimated that the storm had a return
period of approximately 25 years. The storm of 1995, which was notable but did not cause such
extensive damage, was identified by the same analysis of wind data as being the second most
severe storm in the 24-year period.
17.11 The overall assessment of the January 2001 event is that it was caused by a combination of
beach line recession due to differential longshore transport rates in the preceding autumn and
the occurrence of a severe storm, which further cut back the beach profile, with the beach crest
reaching road level.
17.12 Because the storm coincided with a period when the beach was at a historically narrow state, its
observed effect on infrastructure (road, car park) was greater than it may have otherwise have
been.
17.13 Figure 11.51 (Volume 2) shows areas at risk at any time from a single storm event. Using the
2001 storm event, when 5m width of shingle ridge was eroded, it is assumed that a similar event
of 1 in 25 year return period would have a similar erosion impact. Therefore a 5m setback from
the vegetated crest line has generally been drawn. However, the extent of erosion expected to
occur at any particular point along the beach is a function of two other main variables: beach
steepness (the steeper the beach, the more likely is erosion of the crest); and the presence of
defences (these inhibit erosion of the crest). The steepest beaches occur in the central area
near the car park and previous road realignment.
Slapton Coastal Zone Management Main Study Volume 1: Phase 1 Report (I)
August 2006, Scott Wilson
17-3
17.14 The figure shows that the main areas at risk are (south to north):
The length of road immediately north of the rock revetment, including the length where the
rock revetment is badly degraded
The central car park
The two road sections north of the car park where the new road alignment joins the original
road alignment
17.15 Long-term barrier retreat rates have been estimated, based on a conceptual model of the long-
term evolution of the Slapton Sands coastline, and a numerical formulation relating sea level
rise to barrier retreat rate. The retreat rates calculated are not precise, and for the present day
are somewhat higher than observed sustained retreat rates.
17.16 Mean sea level is predicted to be at least 20 cm higher by 2080 (low emission scenario) and
may be as high as 80 cm above present level (high emission scenario). The most conservative
estimate indicates that water levels that today occur once every 7-8 years are expected to
occur, by 2080, about 3 times per year.
17.17 The historical data analysis suggests that in overall terms the Slapton Sands shingle ridge has
been largely stable over the last century, but with some net beach accretion at Strete gate and
recession at Torcross. Long-term net erosion rates for the crest of the barrier are low, with a
best estimate over 100 years of 0.1m/year for the centre of the Bay. Analysis of a number of
maps and photographs for different periods of time between 1890 and the present day all
indicate little overall movement of the crest. However, over shorter time periods rates of 0.4-
0.6m have been found.
17.18 The geomorphologically based estimates for long-term barrier retreat give values of 0.3m/year
at the present day, increasing to at least 0.4m/year due to sea level rise.
17.19 The maps shown as Figures 11.52(a-g)(Volume 2), show areas at risk within different time
epochs along the shingle bank. In accordance with guidance for Shoreline Management Plans,
three epochs have been used: 0-20 years, 20-50 years and 50-100 years. The retreat rates
used in preparing these maps are those of a ‘Low Emission Scenario’ and are applicable to the
next 100 years.
17.20 The rates used in the Low Emission Scenario are derived from the geomorphology-based
retreat rates from the low emission scenario for climate change and sea level rise up to year
100. The geomorphology-based projection suggests more rapid rate in years 50-100, of the
order of a further 30m.
Slapton Coastal Zone Management Main Study Volume 1: Phase 1 Report (I)
August 2006, Scott Wilson
17-4
17.21 In the geomorphology-based projections for the high emission scenario both sea level rise and
retreat rates over years 50-100 are predicted to accelerate rapidly and are higher still. These are
displayed on Figures 11.53 (a-g) (Volume 2).
17.22 In using the maps the following should be noted:
• The projections are indicative, with a considerable degree of uncertainty, despite any
appearance of precision. The uncertainty increases over time.
• The retreat rates used (even for the lower emission scenario) are higher than the long-term
historical change which has actually occurred.
• Erosion may occur landward of the ‘At Risk’ areas in particularly severe events.
• If the high emission scenario becomes reality, or indeed if any scenario occurs other than
the low emission scenario, then the ‘At Risk’ areas will rapidly project landwards after year
100.
• The projections are long-term averages, and will only occur if a given period of time has the
expected number of severe storm events. It is the severe storm events which drive retreat
of the barrier.
17.23 It has been postulated by various authors that the shingle bank is likely to break down
irreversibly and breach, forming tidal inlets, within the next 30 to 50 years. This is considered to
be highly unlikely. Neither of the storm events which have occurred in the last 10 years have
had a major impact on the shingle barrier height or width, and neither has come close to causing
a breach of the barrier. The current probability for a breach is considered to be much less than
1 in 100 years.
17.24 Sea level rise and increased storminess will increase the rate of erosion and the risk of a major
recession event, but the risk of a breach of the shingle bank will remain low over the next 20 or
50 years.
17.25 Possibly after 50 years, and probably beyond 100 years, a No Intervention scenario will result in
breakdown of the shingle barrier, with breaching and forming of intermittent tidal inlets.
17.26 Retreat of the shingle barrier will eventually result in lowered beaches in front of Torcross, and
leave the northern part of Torcross exposed to wave attack. Protection of Torcross will require
an extension of the sea wall to link up with the retreated barrier location.
Slapton Coastal Zone Management Main Study Volume 1: Phase 1 Report (I)
August 2006, Scott Wilson
17-5
17.27 The following broad scale options were considered for this study:
• Do nothing (also described as ‘No Active Intervention’)
• Do minimum (keep the coast road for a limited period)
• Hold the line (keep the coast road)
• Advance the line
• Managed realignment of the coast road
17.28 At the Strategic level, advance the line was discarded as it offered no advantages and would be
excessively costly. All other options were considered further. The hold the line option would
involve a commitment to maintain the road on the shingle barrier, either by realignment to
accommodate erosion or by provision of defences.
17.29 A number of options for keeping the coast road were considered:
• Beach nourishment
• Beach recycling
• Revetment
• Sheet piled retaining wall
17.30 Three options for realignment were considered. One option would be to keep the road on the
Slapton Line but relocate it further back, thereby increasing the distance between the beach and
the road. This could be done in stages to spread out the cost and to deal with the most
vulnerable sections first. In the long term the beach is likely to eventually erode entirely, leading
to a breach of the barrier beach and hence the road. This option, which could be either a
reactive or a proactive realignment, has been evaluated and found to be feasible and to have
the minimum cost of any option.
17.31 One alternative option would be to relocate the route inland of the Ley, using the existing road
network wherever possible and upgrading over time as and when finances allowed. The most
radical solution would be to build an entirely new road to the west of the Ley although even if the
latter option was technically and environmentally viable it would probably be prohibitively
expensive.
17.32 A third option would be to abandon the use of the coast road, and make limited upgrades to the
existing inland road network.
Slapton Coastal Zone Management Main Study Volume 1: Phase 1 Report (I)
August 2006, Scott Wilson
17-6
17.33 A preliminary assessment has been made of eligibility for funding from DEFRA as a coast
protection project. The assessment of the economics of each option was undertaken in
accordance with the methodology of DEFRA for coastal defence projects. The assessment was
a preliminary exercise, using only outline traffic data and excluding environmental and socio-
economic costs and benefits.
17.34 Based on these figures, the proactive or reactive Managed Realignment on the barrier option
would be the preferred option, and such a scheme would meet the benefit-cost and priority
scoring requirements of DEFRA within the next 5 years. All other options would fail to meet the
criteria.
17.35 It was estimated that a technically viable scheme to hold the road for 50 years, and protect
Torcross for 100 years, would have a cost in the order of £4.5m over the 50-year period at
present day prices.
17.36 Since this work was undertaken DEFRA have advised that although it might meet their
economic criteria, they would probably not fund the road protection part of the option, as their
primary function is protection of people, property and environment. Therefore the cost would
have to be borne by the members of the Slapton Line Partnership or through funding from other
sources. Initial comments from Devon County Council suggest that sustaining the coast road is
not a priority highway project and therefore funding is likely to be very limited or unavailable. It
is likely that DEFRA funding would be available for the works required to protect Torcross, as
the shingle barrier retreats, however DEFRA currently provide only a 35% grant aid contribution.
17.37 At this stage investigations have not been made into availability of other sources of funding.
However the scoping study refers to alternative funding opportunities. More work is required
into this, once the Phase 2 approach has been finalised. However, it is critical that the
Partnership comes to a decision in principle on the level of funding that it will be able to provide,
since it is unlikely that other sources will provide the entire level of funding required to keep the
road.
17.38 An outline environmental assessment has been made of the impact of all eight options
identified. The evaluation method used for environmental impact is an abbreviated version of
the TAG methodology using four environmental criteria (ecology, geomorphology, landscape,
heritage and archaeology) and two socio-economic criteria (social & community issues and
business impacts). A business questionnaire has been issued in order to quantify impacts of
the options on local business both qualitatively and quantitatively. However, returns were not
available at the time of preparation of this report.
17.39 The key impacts of the no intervention option are in the socio-economic and traffic areas. Main
socio-economic impacts are provisionally:
Slapton Coastal Zone Management Main Study Volume 1: Phase 1 Report (I)
August 2006, Scott Wilson
17-7
• Intermittent breaching of A379 will cause diversions and disruption to access/accessibility
of services. Examples of these disruptions include bus services, travel to work times,
emergency service access.
• Longer term loss of road and necessary use of other roads may increase drive times to
services/facilities e.g. schools, workplace, doctors etc
• Use of minor roads may cause difficulties for larger vehicles – buses, vans, lorries.
• Lack of planned approach to change and consequential disruption to traffic movements will
lead to confusion and difficulties for residents and service providers e.g. bus companies.
• The perception of Slapton and Torcross as more isolated communities will increase i.e. not
on main road link between Kingsbridge and Dartmouth. This may be significant.
• Unplanned nature of road diversions will be difficult for businesses to manage. May affect
trade especially for businesses reliant on passing trade e.g. B&B’s and village stores.
• Ultimate loss of main road link will increase the ‘isolation’ of the villages – may lead to
reduction in trade. Loss of trade may be as a result of reduced passing trade – may be
experienced by B&B’s, local stores, Ley (visitor attraction). Also may be as a result of
increasing access difficulties – problems with supply chains to/from local businesses.
• Dependant on the importance of the Ley in its freshwater state to tourists, there may be a
reduction in visitor numbers
17.40 There is also the potential for positive impacts to be associated with the severance of the road.
It is possible that some specialist businesses, e.g. recreational pursuits & natural history related,
may actually benefit from the closure if it is perceived by some visitors that the area has been
enhanced by the closure. The creation of new wildlife environments will attract specialist
interest, and may be of interest to a more general market if actively marketed and interpreted.
Any positive benefits are likely to be realised in the longer term and may require some initial
capital investment in a "replacement" tourist infrastructure (e.g. new visitor centres).
Furthermore, if the changes to the road structure inland include suitable parking and walking
trail development then it may be possible to add to leisure and tourism use of the countryside in
the area. If this work takes in existing local businesses then some economic benefits can be
gained.
17.41 An origins and destinations traffic survey was undertaken during July 2004, and combined with
traffic data obtained previously showed that whilst the route between Kingsbridge and
Dartmouth via Slapton Ley is not required for all through traffic it does perform an important
local movement function and helps maintain the livelihood of businesses reliant on passing
trade.
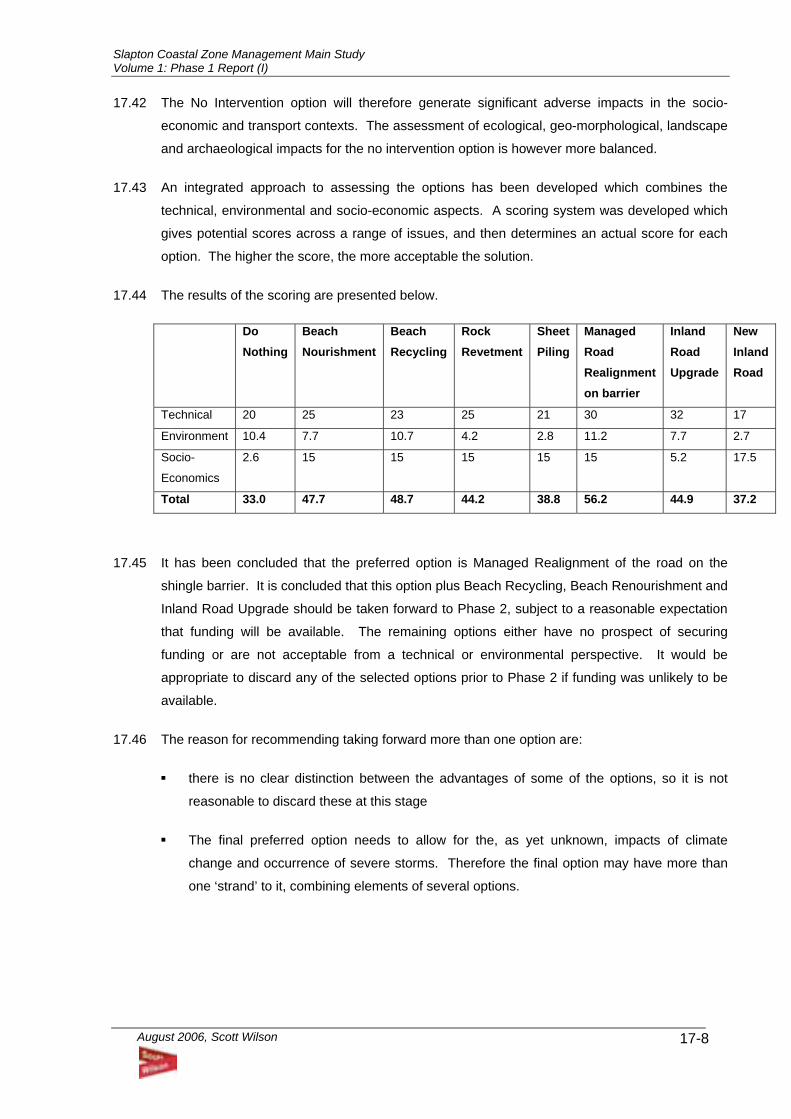
Slapton Coastal Zone Management Main Study Volume 1: Phase 1 Report (I)
August 2006, Scott Wilson
17-8
17.42 The No Intervention option will therefore generate significant adverse impacts in the socio-
economic and transport contexts. The assessment of ecological, geo-morphological, landscape
and archaeological impacts for the no intervention option is however more balanced.
17.43 An integrated approach to assessing the options has been developed which combines the
technical, environmental and socio-economic aspects. A scoring system was developed which
gives potential scores across a range of issues, and then determines an actual score for each
option. The higher the score, the more acceptable the solution.
17.44 The results of the scoring are presented below.
Do Nothing
Beach Nourishment
Beach Recycling
Rock Revetment
Sheet Piling
Managed Road Realignment on barrier
Inland Road Upgrade
New Inland Road
Technical 20 25 23 25 21 30 32 17
Environment 10.4 7.7 10.7 4.2 2.8 11.2 7.7 2.7
Socio-
Economics
2.6 15 15 15 15 15 5.2 17.5
Total 33.0 47.7 48.7 44.2 38.8 56.2 44.9 37.2
17.45 It has been concluded that the preferred option is Managed Realignment of the road on the
shingle barrier. It is concluded that this option plus Beach Recycling, Beach Renourishment and
Inland Road Upgrade should be taken forward to Phase 2, subject to a reasonable expectation
that funding will be available. The remaining options either have no prospect of securing
funding or are not acceptable from a technical or environmental perspective. It would be
appropriate to discard any of the selected options prior to Phase 2 if funding was unlikely to be
available.
17.46 The reason for recommending taking forward more than one option are:
there is no clear distinction between the advantages of some of the options, so it is not
reasonable to discard these at this stage
The final preferred option needs to allow for the, as yet unknown, impacts of climate
change and occurrence of severe storms. Therefore the final option may have more than
one ‘strand’ to it, combining elements of several options.
Slapton Coastal Zone Management Main Study Volume 1: Phase 1 Report (I)
August 2006, Scott Wilson
18-1
18 The Way Forward
18.1 It is recommended that Consultation is undertaken on the findings of this report. It is suggested
that this should be through a presentation to the Slapton Line Partnership Advisory Forum, and
through a 2-day open exhibition held in Slapton. The exhibition would give members f the
Forum and the public at larger the opportunity to assess the report and to meet members of the
Scott Wilson study team and put forward views directly. A questionnaire would be prepared to
provide a basis for statistical assessment of comments.
18.2 Following consultation Phase 2 Study should proceed. The purpose of Phase 2 is to identify the
single preferred option. The Study will need to include a more detailed assessment of costs,
impacts and benefits of short-listed options.
18.3 In the longer term, beach profile monitoring should be continued. This is critical to improving the
data set on beach width variability and long-term trends.
18.4 The monitoring should be undertaken in conjunction with aerial photography undertaken every
year. Photography provides additional data on changes in position of the line of vegetation.