Embed Size (px)
Citation preview
Standard Life Aberdeen plc
Building a world-class investment company
30 May 2018
1
This presentation may contain certain “forward-looking statements” with respect to the financial condition, performance, results, strategy, objectives, plans, goals and expectations of Standard Life Aberdeen plc (“Standard Life Aberdeen”) and its affiliates. These forward-looking statements can be identified by the fact that they do not relate only to historical or current facts. Forward-looking statements are prospective in nature and are not based on historical facts, but rather on current expectations and projections of the management of Standard Life Aberdeen about future events, and are therefore subject to risks and uncertainties which could cause actual results to differ materially from the future results expressed or implied by the forward-looking statements. For example, statements containing words such as “may”, “will”, “should”, “could”, “continue”, “aims”, “estimates”, “projects”, “believes”, “intends”, “expects”, “hopes”, “plans”, “pursues”, “seeks”, “targets” and “anticipates”, and words of similar meaning, may be forward-looking. These statements are based on assumptions and assessments made by Standard Life Aberdeen in light of its experience and its perception of historical trends, current conditions, future developments and other factors it believes appropriate. By their nature, all forward-looking statements involve risk and uncertainty because they are based on information available at the time they are made, including current expectations and assumptions, and relate to future events and depend on circumstances which may be or are beyond Standard Life Aberdeen’s control, including among other things: UK domestic and global political, economic and business conditions (such as the United Kingdom’s exit from the European Union); market related risks such as fluctuations in interest rates and exchange rates, and the performance of financial markets generally; the impact of inflation and deflation; experience in particular with regard to mortality and morbidity trends, lapse rates and policy renewal rates; the impact of competition; the timing, impact and other uncertainties associated with future acquisitions, disposals or combinations undertaken by Standard Life Aberdeen or its affiliates (including those associated with acquisitions, disposals or combinations announced by Standard Life Aberdeen or its affiliates which have yet to complete including the recently announced sale of Standard Life Aberdeen’s UK and European insurance business to Phoenix Group Holdings) and/or within relevant industries; default by counterparties; information technology or data security breaches; natural or man-made catastrophic events; the failure to attract or retain necessary key personnel; the policies and actions of regulatory authorities; and the impact of changes in capital, solvency or accounting standards, and tax and other legislation and regulations (including changes to the regulatory capital requirements that Standard Life Aberdeen is subject to) in the jurisdictions in which Standard Life Aberdeen and its affiliates operate. These may for example result in changes to assumptions used for determining results of operations or re-estimations of reserves for future policy benefits. As a result, Standard Life Aberdeen’s actual future financial condition, performance and results may differ materially from the plans, goals, objectives and expectations set forth in the forward-looking statements. Persons receiving this presentation should not place undue reliance on forward-looking statements. Neither Standard Life Aberdeen nor its affiliates assume any obligation to update or correct any of the forward-looking statements contained in this presentation or any other forward-looking statements it or they may make (whether as a result of new information, future events or otherwise), except as required by law. Past performance is not an indicator of future results and the results of Standard Life Aberdeen and its affiliates in this presentation may not be indicative of, and are not an estimate, forecast or projection of, Standard Life Aberdeen’s or its affiliates’ future results.
All figures are presented on a Pro forma basis unless otherwise stated. Pro forma results for the Group are prepared as if Standard Life plc and Aberdeen Asset Management PLC had always been merged and are included in this presentation to assist in explaining trends in financial performance.
2
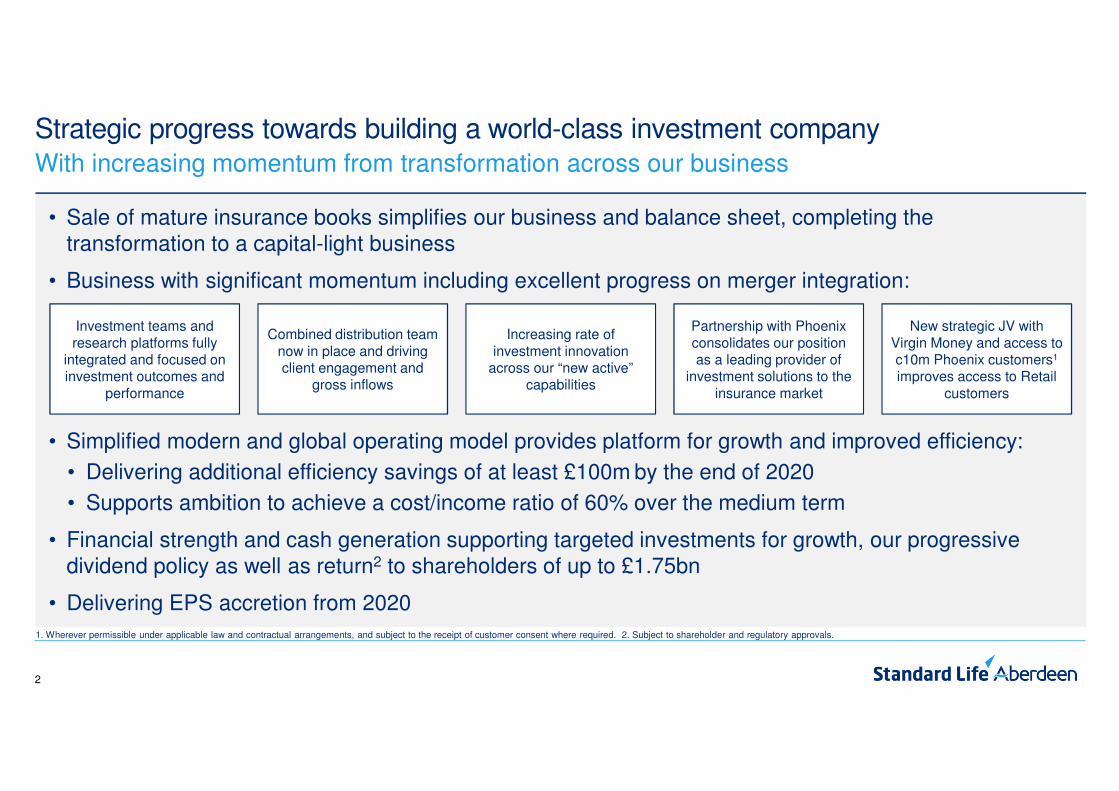
• Sale of mature insurance books simplifies our business and balance sheet, completing the transformation to a capital-light business
• Business with significant momentum including excellent progress on merger integration:
• Simplified modern and global operating model provides platform for growth and improved efficiency:
• Delivering additional efficiency savings of at least £100m by the end of 2020
• Supports ambition to achieve a cost/income ratio of 60% over the medium term
• Financial strength and cash generation supporting targeted investments for growth, our progressive dividend policy as well as return2 to shareholders of up to £1.75bn
• Delivering EPS accretion from 2020
Strategic progress towards building a world-class investment companyWith increasing momentum from transformation across our business
1. Wherever permissible under applicable law and contractual arrangements, and subject to the receipt of customer consent where required. 2. Subject to shareholder and regulatory approvals.
Investment teams and research platforms fully
integrated and focused on investment outcomes and
performance
Combined distribution team now in place and driving client engagement and
gross inflows
Increasing rate of investment innovation
across our “new active” capabilities
Partnership with Phoenix consolidates our position as a leading provider of
investment solutions to the insurance market
New strategic JV with Virgin Money and access to c10m Phoenix customers1
improves access to Retail customers
3
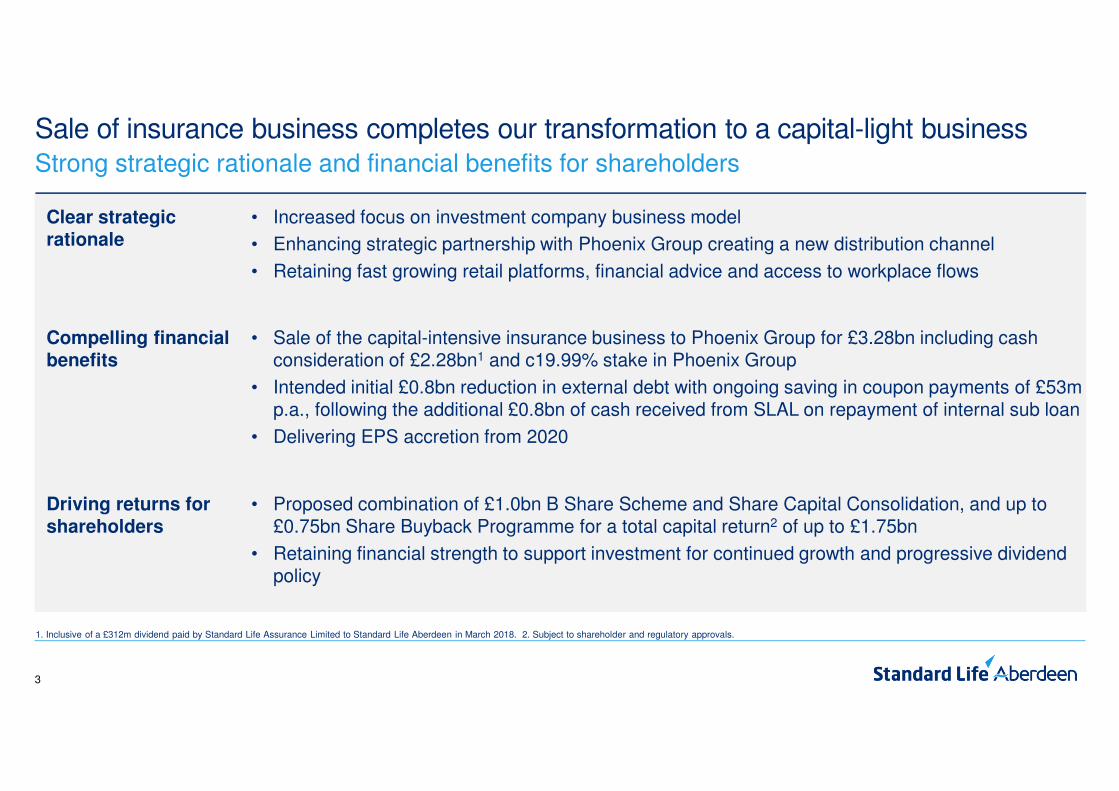
Sale of insurance business completes our transformation to a capital-light businessStrong strategic rationale and financial benefits for shareholders
Clear strategic rationale
• Increased focus on investment company business model
• Enhancing strategic partnership with Phoenix Group creating a new distribution channel
• Retaining fast growing retail platforms, financial advice and access to workplace flows
Compelling financial benefits
• Sale of the capital-intensive insurance business to Phoenix Group for £3.28bn including cash consideration of £2.28bn1 and c19.99% stake in Phoenix Group
• Intended initial £0.8bn reduction in external debt with ongoing saving in coupon payments of £53m p.a., following the additional £0.8bn of cash received from SLAL on repayment of internal sub loan
• Delivering EPS accretion from 2020
Driving returns for shareholders
• Proposed combination of £1.0bn B Share Scheme and Share Capital Consolidation, and up to £0.75bn Share Buyback Programme for a total capital return2 of up to £1.75bn
• Retaining financial strength to support investment for continued growth and progressive dividend policy
1. Inclusive of a £312m dividend paid by Standard Life Assurance Limited to Standard Life Aberdeen in March 2018. 2. Subject to shareholder and regulatory approvals.
4
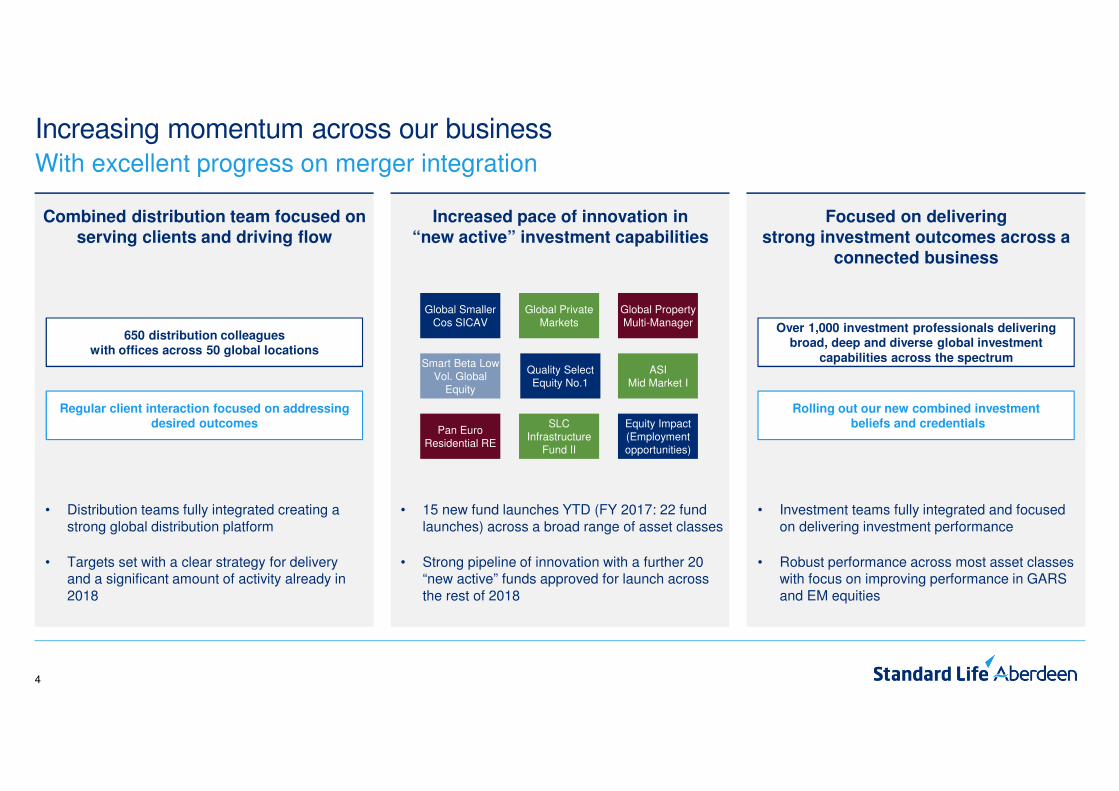
Increased pace of innovation in
“new active” investment capabilities
• 15 new fund launches YTD (FY 2017: 22 fund launches) across a broad range of asset classes
• Strong pipeline of innovation with a further 20 “new active” funds approved for launch across the rest of 2018
• Distribution teams fully integrated creating a strong global distribution platform
• Targets set with a clear strategy for delivery and a significant amount of activity already in 2018
Increasing momentum across our businessWith excellent progress on merger integration
Focused on delivering
strong investment outcomes across a
connected business
Combined distribution team focused on
serving clients and driving flow
Regular client interaction focused on addressing desired outcomes
650 distribution colleagues with offices across 50 global locations
Global Smaller Cos SICAV
Global Private Markets
Global Property Multi-Manager
ASIMid Market I
Equity Impact (Employment opportunities)
Smart Beta Low Vol. Global
Equity
Pan Euro Residential RE
SLC Infrastructure
Fund II
Quality Select Equity No.1
• Investment teams fully integrated and focused on delivering investment performance
• Robust performance across most asset classes with focus on improving performance in GARS and EM equities
Over 1,000 investment professionals delivering broad, deep and diverse global investment
capabilities across the spectrum
Rolling out our new combined investmentbeliefs and credentials
5
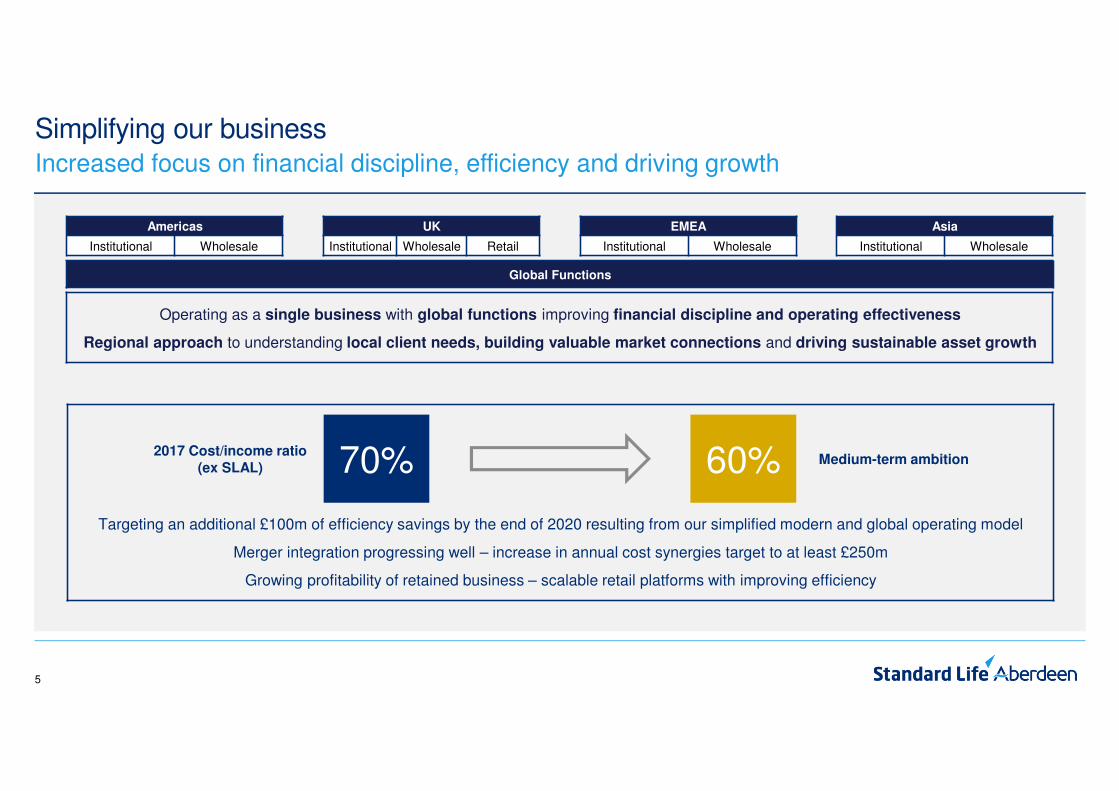
Targeting an additional £100m of efficiency savings by the end of 2020 resulting from our simplified modern and global operating model
Merger integration progressing well – increase in annual cost synergies target to at least £250m
Growing profitability of retained business – scalable retail platforms with improving efficiency
Simplifying our businessIncreased focus on financial discipline, efficiency and driving growth
Americas
Institutional Wholesale
EMEA
Institutional Wholesale
Asia
Institutional Wholesale
UK
Institutional Wholesale Retail
Global Functions
70% 60%2017 Cost/income ratio
(ex SLAL)Medium-term ambition
Operating as a single business with global functions improving financial discipline and operating effectiveness
Regional approach to understanding local client needs, building valuable market connections and driving sustainable asset growth
6
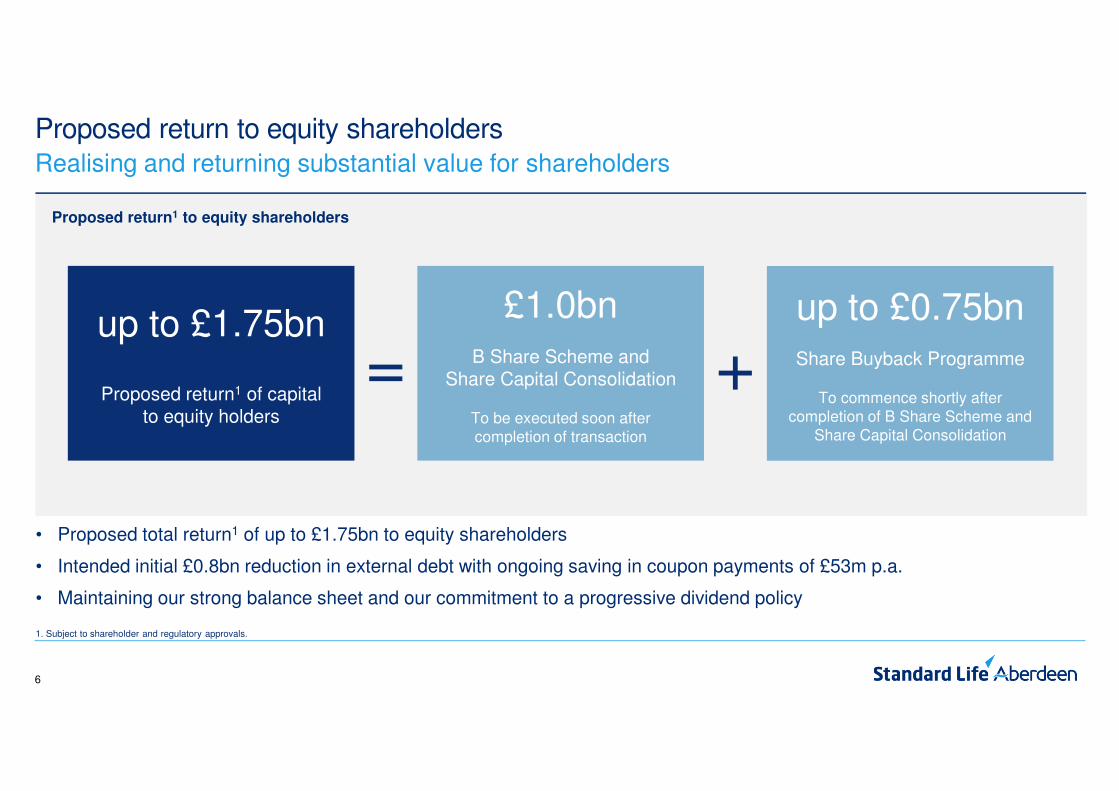
Proposed return to equity shareholders
Proposed return1 to equity shareholders
Realising and returning substantial value for shareholders
• Proposed total return1 of up to £1.75bn to equity shareholders
• Intended initial £0.8bn reduction in external debt with ongoing saving in coupon payments of £53m p.a.
• Maintaining our strong balance sheet and our commitment to a progressive dividend policy
up to £1.75bn
Proposed return1 of capitalto equity holders
=£1.0bn
B Share Scheme and Share Capital Consolidation
To be executed soon aftercompletion of transaction
up to £0.75bnShare Buyback Programme
To commence shortly after completion of B Share Scheme and
Share Capital Consolidation
+
1. Subject to shareholder and regulatory approvals.
7
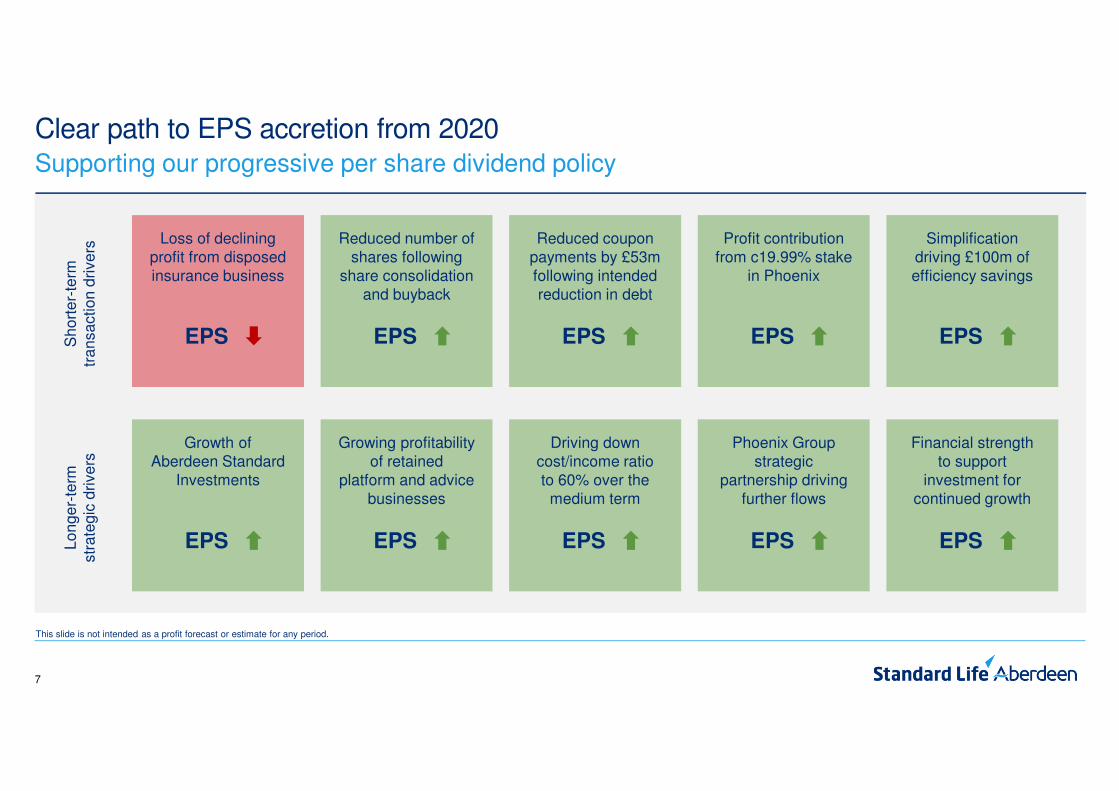
Profit contribution from c19.99% stake
in Phoenix
EPS
Clear path to EPS accretion from 2020Supporting our progressive per share dividend policy
Loss of declining profit from disposed insurance business
EPS
Reduced number of shares following
share consolidation and buyback
EPS
Reduced coupon payments by £53m following intended reduction in debt
EPS
Simplification driving £100m of efficiency savings
EPS
Growing profitability of retained
platform and advice businesses
EPS
Driving down cost/income ratio to 60% over the
medium term
EPS
Phoenix Group strategic
partnership driving further flows
EPS
Financial strength to support
investment for continued growth
EPS
Sh
ort
er-
term
tr
an
sa
ctio
n d
rive
rsL
on
ge
r-te
rmstr
ate
gic
dri
ve
rs
Growth of Aberdeen Standard
Investments
EPS
This slide is not intended as a profit forecast or estimate for any period.
Well positioned to drive sustainable long-term growth
9
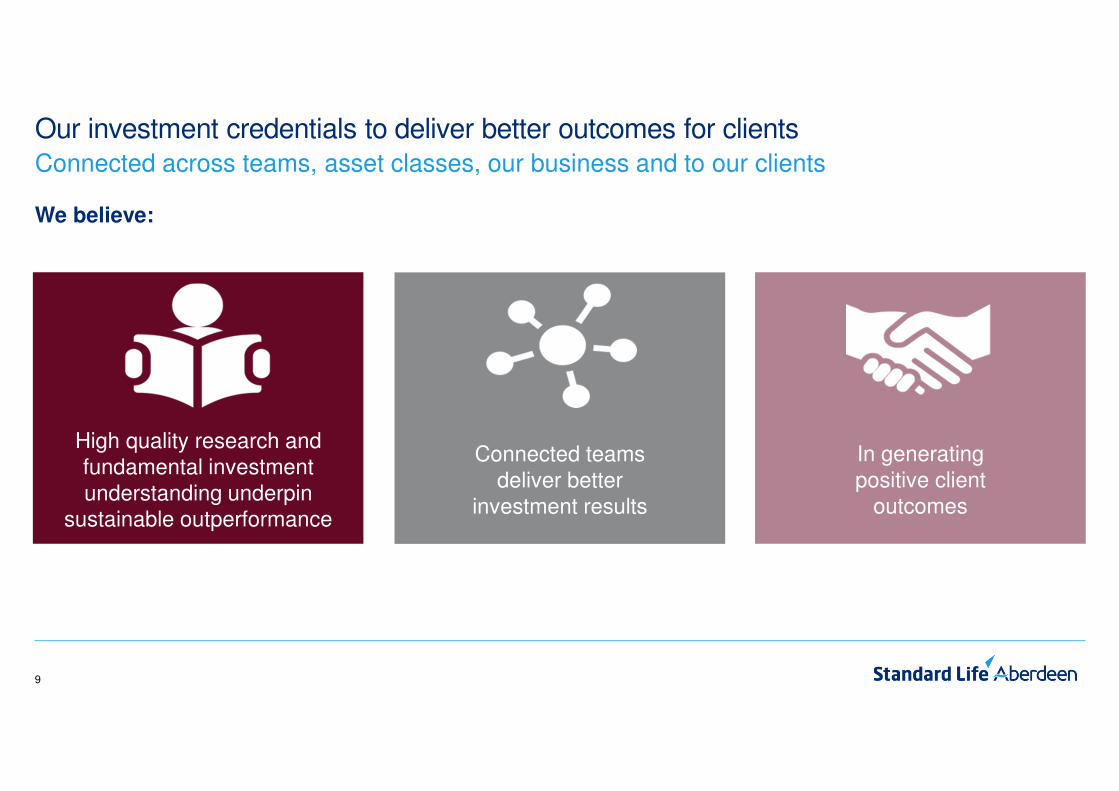
Our investment credentials to deliver better outcomes for clients
High quality research and fundamental investment understanding underpin
sustainable outperformance
Connected teams deliver better
investment results
In generating positive client
outcomes
We believe:
Connected across teams, asset classes, our business and to our clients
10
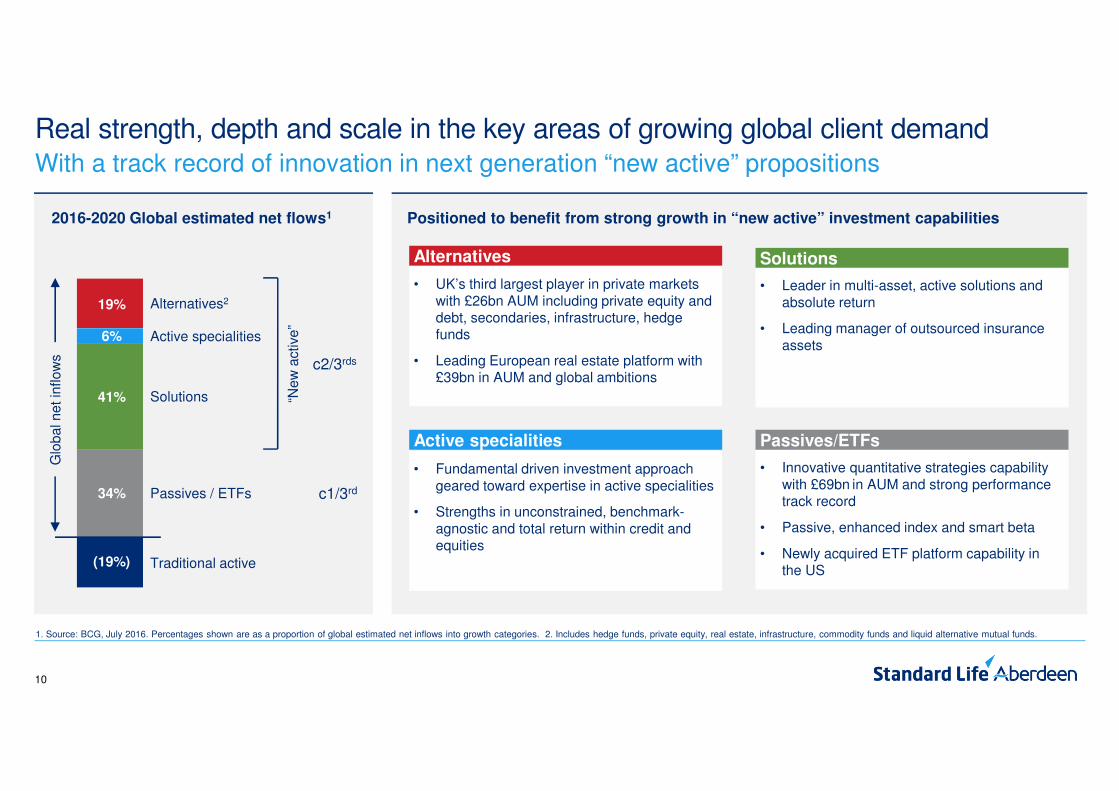
Real strength, depth and scale in the key areas of growing global client demandWith a track record of innovation in next generation “new active” propositions
41%
34%
(19%)
6%
19% Alternatives2
Active specialities
Solutions
Passives / ETFs
Traditional active
Glo
ba
l ne
t in
flo
ws
“Ne
w a
ctive
”
c2/3rds
c1/3rd
Positioned to benefit from strong growth in “new active” investment capabilities
• Leader in multi-asset, active solutions and absolute return
• Leading manager of outsourced insurance assets
Solutions
• Innovative quantitative strategies capability with £69bn in AUM and strong performance track record
• Passive, enhanced index and smart beta
• Newly acquired ETF platform capability in the US
Passives/ETFs
• UK’s third largest player in private markets with £26bn AUM including private equity and debt, secondaries, infrastructure, hedge funds
• Leading European real estate platform with £39bn in AUM and global ambitions
Alternatives
• Fundamental driven investment approach geared toward expertise in active specialities
• Strengths in unconstrained, benchmark-agnostic and total return within credit and equities
Active specialities
2016-2020 Global estimated net flows1
1. Source: BCG, July 2016. Percentages shown are as a proportion of global estimated net inflows into growth categories. 2. Includes hedge funds, private equity, real estate, infrastructure, commodity funds and liquid alternative mutual funds.
11
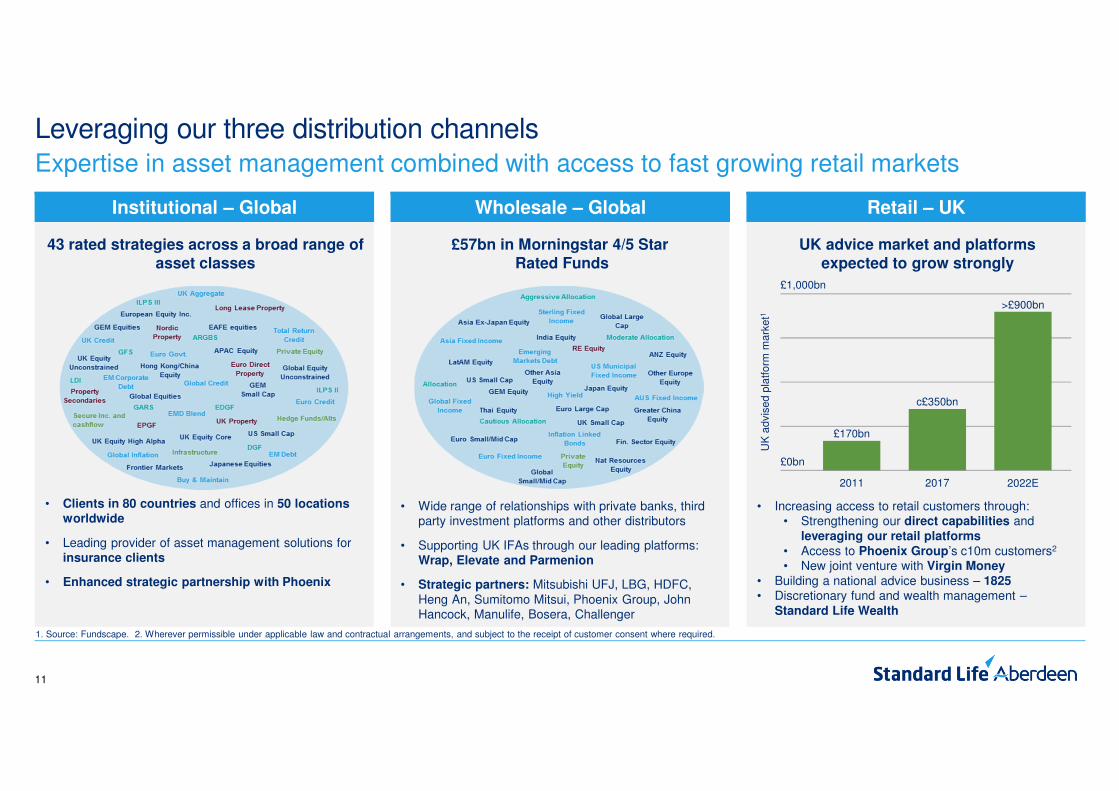
43 rated strategies across a broad range of
asset classes
£57bn in Morningstar 4/5 Star
Rated Funds
UK advice market and platforms
expected to grow strongly
1. Source: Fundscape. 2. Wherever permissible under applicable law and contractual arrangements, and subject to the receipt of customer consent where required.
Wholesale – Global
• Wide range of relationships with private banks, third party investment platforms and other distributors
• Supporting UK IFAs through our leading platforms: Wrap, Elevate and Parmenion
• Strategic partners: Mitsubishi UFJ, LBG, HDFC, Heng An, Sumitomo Mitsui, Phoenix Group, John Hancock, Manulife, Bosera, Challenger
• Clients in 80 countries and offices in 50 locations worldwide
• Leading provider of asset management solutions for insurance clients
• Enhanced strategic partnership with Phoenix
Leveraging our three distribution channelsExpertise in asset management combined with access to fast growing retail markets
• Increasing access to retail customers through:• Strengthening our direct capabilities and
leveraging our retail platforms
• Access to Phoenix Group’s c10m customers2
• New joint venture with Virgin Money
• Building a national advice business – 1825• Discretionary fund and wealth management –
Standard Life Wealth
Retail – UKInstitutional – Global
2022E
>£900bn
2011
£170bn
2017
c£350bn
£0bn
£1,000bn
UK
ad
vis
ed
pla
tfo
rm m
ark
et1
12
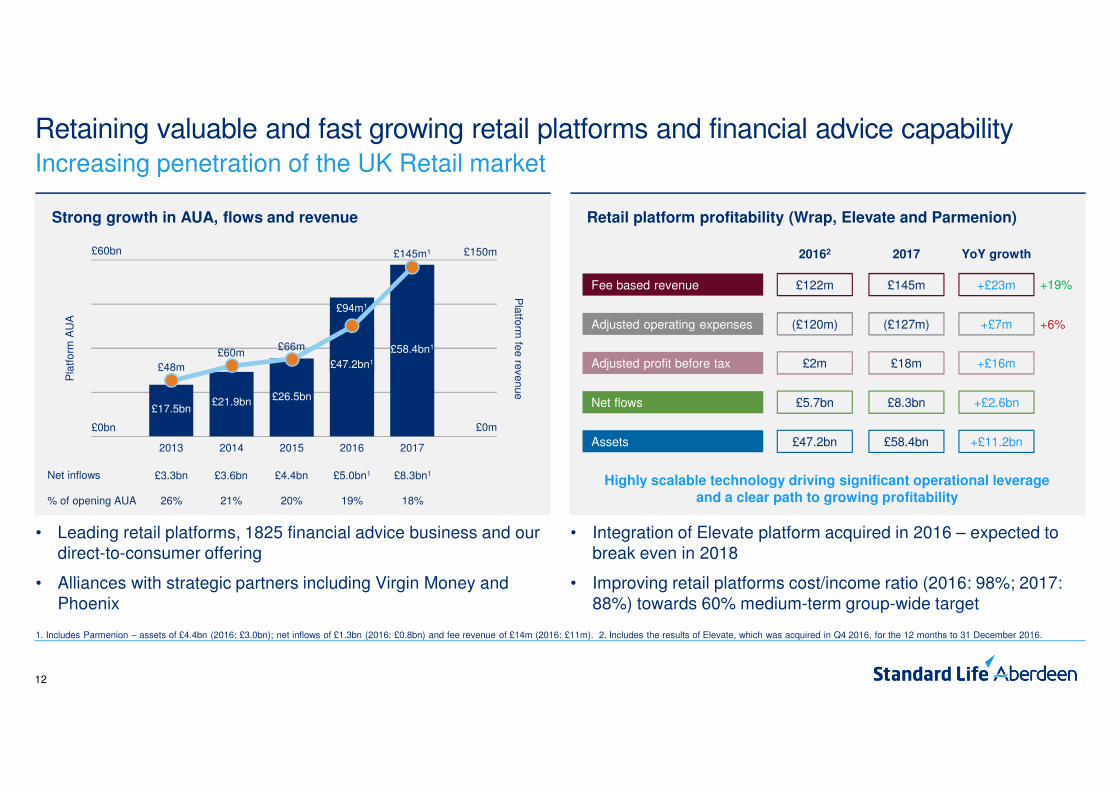
Retail platform profitability (Wrap, Elevate and Parmenion)
Retaining valuable and fast growing retail platforms and financial advice capability
• Leading retail platforms, 1825 financial advice business and our direct-to-consumer offering
• Alliances with strategic partners including Virgin Money and Phoenix
• Integration of Elevate platform acquired in 2016 – expected to break even in 2018
• Improving retail platforms cost/income ratio (2016: 98%; 2017: 88%) towards 60% medium-term group-wide target
Increasing penetration of the UK Retail market
Strong growth in AUA, flows and revenue
£17.5bn
2013
£60bn
£0bn
2015
£26.5bn
2017
£58.4bn1
2014
£21.9bn
2016
2016
£47.2bn1
£150m
£0m
Pla
tfo
rm A
UA
Pla
tform
fee
reve
nu
e
Net inflows
% of opening AUA
£3.3bn
26%
£3.6bn
21%
£4.4bn
20%
£5.0bn1
19%
£8.3bn1
18%
£48m
£60m£66m
£94m1
£145m1 20162 2017
Net flows £5.7bn £8.3bn +£2.6bn
Adjusted profit before tax £2m £18m +£16m
YoY growth
Assets £47.2bn £58.4bn +£11.2bn
Fee based revenue £122m £145m +£23m +19%
Adjusted operating expenses (£120m) (£127m) +£7m +6%
Highly scalable technology driving significant operational leverage
and a clear path to growing profitability
1. Includes Parmenion – assets of £4.4bn (2016: £3.0bn); net inflows of £1.3bn (2016: £0.8bn) and fee revenue of £14m (2016: £11m). 2. Includes the results of Elevate, which was acquired in Q4 2016, for the 12 months to 31 December 2016.
13
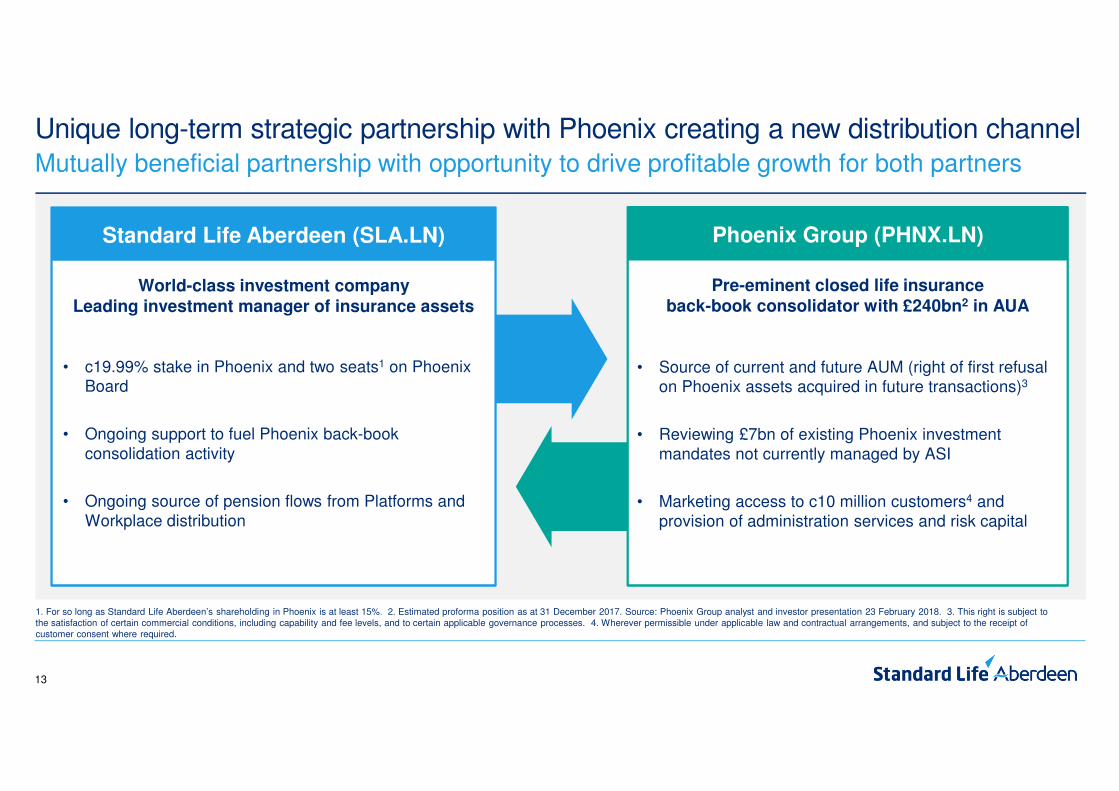
Unique long-term strategic partnership with Phoenix creating a new distribution channelMutually beneficial partnership with opportunity to drive profitable growth for both partners
World-class investment company
Leading investment manager of insurance assets
Standard Life Aberdeen (SLA.LN)
Pre-eminent closed life insurance
back-book consolidator with £240bn2 in AUA
Phoenix Group (PHNX.LN)
1. For so long as Standard Life Aberdeen’s shareholding in Phoenix is at least 15%. 2. Estimated proforma position as at 31 December 2017. Source: Phoenix Group analyst and investor presentation 23 February 2018. 3. This right is subject to the satisfaction of certain commercial conditions, including capability and fee levels, and to certain applicable governance processes. 4. Wherever permissible under applicable law and contractual arrangements, and subject to the receipt of customer consent where required.
• c19.99% stake in Phoenix and two seats1 on Phoenix Board
• Ongoing support to fuel Phoenix back-book consolidation activity
• Ongoing source of pension flows from Platforms and Workplace distribution
• Source of current and future AUM (right of first refusal on Phoenix assets acquired in future transactions)3
• Reviewing £7bn of existing Phoenix investment mandates not currently managed by ASI
• Marketing access to c10 million customers4 and provision of administration services and risk capital
14
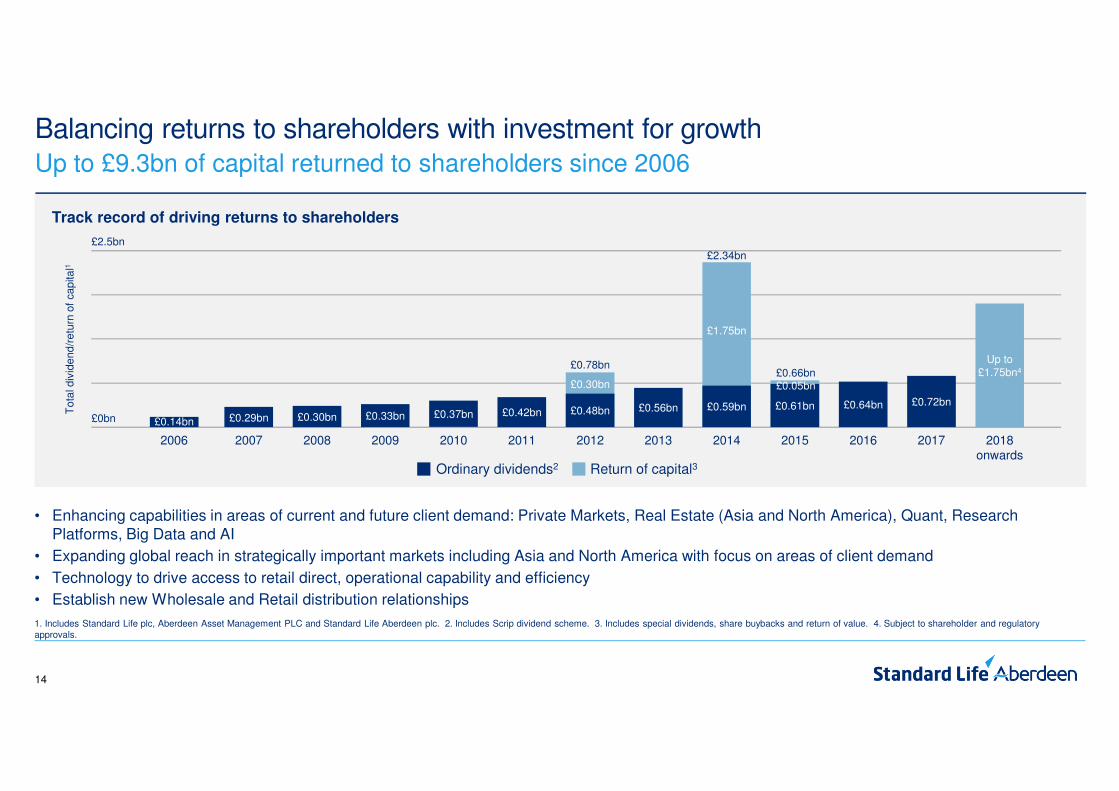
Track record of driving returns to shareholders
£2.5bn
£0bn
To
tal d
ivid
en
d/r
etu
rn o
f ca
pita
l1
2007 2008 2009 2010 2011 2012 2013 2015 2016 2017 2018onwards
2014
£0.29bn £0.30bn £0.33bn £0.37bn £0.42bn £0.48bn £0.56bn £0.61bn £0.64bn £0.72bn£0.59bn
£0.30bn
£0.78bn
£1.75bn
£2.34bn
£0.05bn£0.66bn
Up to £1.75bn4
2006
£0.14bn
Up to £9.3bn of capital returned to shareholders since 2006
1. Includes Standard Life plc, Aberdeen Asset Management PLC and Standard Life Aberdeen plc. 2. Includes Scrip dividend scheme. 3. Includes special dividends, share buybacks and return of value. 4. Subject to shareholder and regulatory approvals.
Balancing returns to shareholders with investment for growth
Ordinary dividends2 Return of capital3
• Enhancing capabilities in areas of current and future client demand: Private Markets, Real Estate (Asia and North America), Quant, Research Platforms, Big Data and AI
• Expanding global reach in strategically important markets including Asia and North America with focus on areas of client demand
• Technology to drive access to retail direct, operational capability and efficiency
• Establish new Wholesale and Retail distribution relationships
15
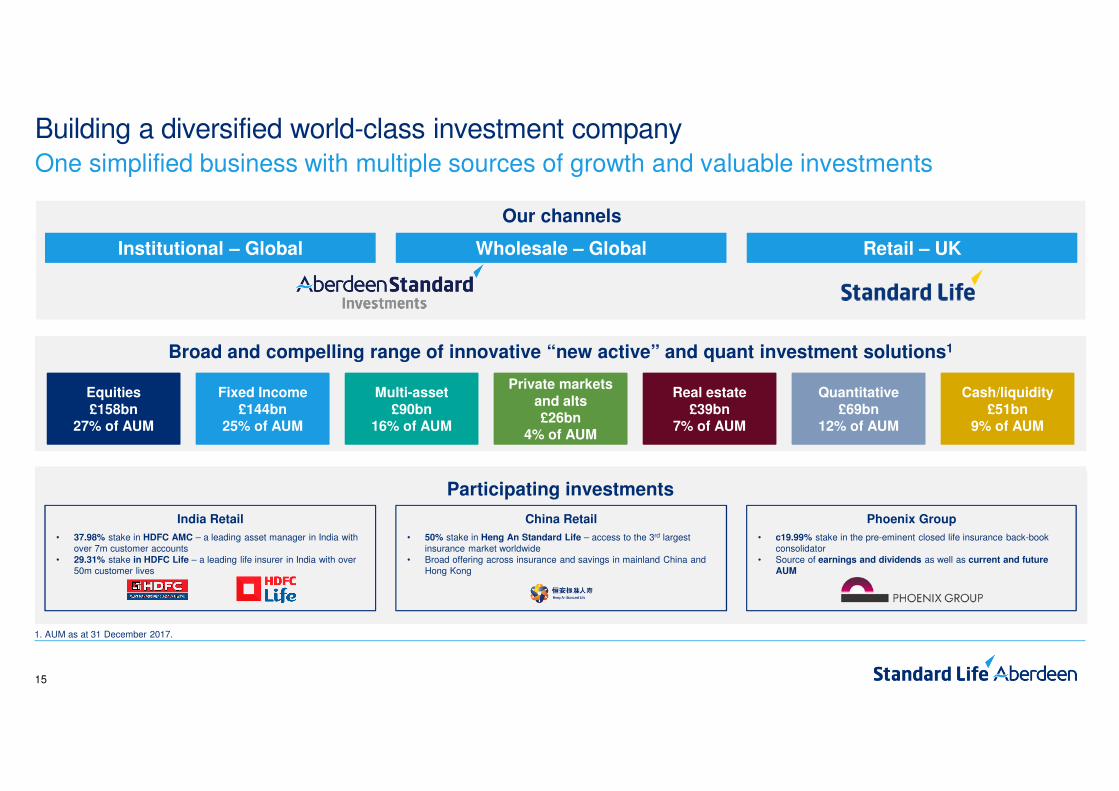
Wholesale – Global
Our channels
Building a diversified world-class investment companyOne simplified business with multiple sources of growth and valuable investments
Participating investments
• c19.99% stake in the pre-eminent closed life insurance back-book consolidator
• Source of earnings and dividends as well as current and future
AUM
Phoenix Group
• 37.98% stake in HDFC AMC – a leading asset manager in India with over 7m customer accounts
• 29.31% stake in HDFC Life – a leading life insurer in India with over 50m customer lives
India Retail
Retail – UKInstitutional – Global
Private markets
and alts£26bn
4% of AUM
Equities
£158bn27% of AUM
Fixed Income
£144bn25% of AUM
Multi-asset
£90bn16% of AUM
Real estate
£39bn7% of AUM
Quantitative
£69bn12% of AUM
Cash/liquidity
£51bn9% of AUM
Broad and compelling range of innovative “new active” and quant investment solutions1
• 50% stake in Heng An Standard Life – access to the 3rd largest insurance market worldwide
• Broad offering across insurance and savings in mainland China and Hong Kong
China Retail
1. AUM as at 31 December 2017.

16
• Sale of mature insurance books simplifies our business and balance sheet, completing the transformation to a capital-light business
• Business with significant momentum including excellent progress on merger integration:
• Simplified modern and global operating model provides platform for growth and improved efficiency:
• Delivering additional efficiency savings of at least £100m by the end of 2020
• Supports ambition to achieve a cost/income ratio of 60% over the medium term
• Financial strength and cash generation supporting targeted investments for growth, our progressive dividend policy as well as return2 to shareholders of up to £1.75bn
• Delivering EPS accretion from 2020
Strategic progress towards building a world-class investment companyWith increasing momentum from transformation across our business
1. Wherever permissible under applicable law and contractual arrangements, and subject to the receipt of customer consent where required. 2. Subject to shareholder and regulatory approvals.
Investment teams and research platforms fully
integrated and focused on investment outcomes and
performance
Combined distribution team now in place and driving client engagement and
gross inflows
Increasing rate of investment innovation
across our “new active” capabilities
Partnership with Phoenix consolidates our position as a leading provider of
investment solutions to the insurance market
New strategic JV with Virgin Money and access to c10m Phoenix customers1
improves access to Retail customers
Questions
Appendix
19
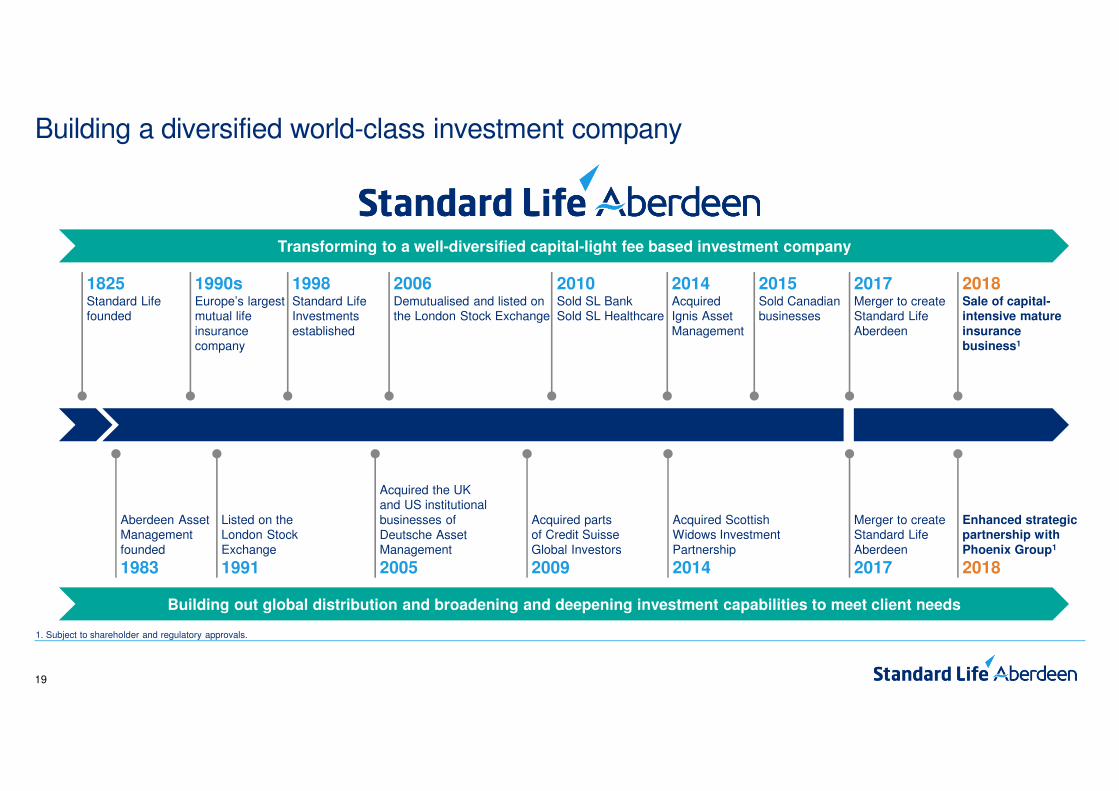
2006Demutualised and listed on the London Stock Exchange
2015Sold Canadian businesses
Aberdeen AssetManagementfounded
1983
Listed on theLondon Stock Exchange
1991
Acquired the UKand US institutional businesses of Deutsche Asset Management
2005
Acquired partsof Credit SuisseGlobal Investors
2009
2010Sold SL BankSold SL Healthcare
2014Acquired Ignis Asset Management
Acquired Scottish Widows Investment Partnership
2014
1825Standard Life founded
1998Standard LifeInvestmentsestablished
2017Merger to create Standard Life Aberdeen
Merger to create Standard Life Aberdeen
2017
2018Sale of capital-intensive mature
insurance business1
Enhanced strategic partnership with
Phoenix Group1
2018
Transforming to a well-diversified capital-light fee based investment company
Building out global distribution and broadening and deepening investment capabilities to meet client needs
1990sEurope’s largest mutual life insurance company
Building a diversified world-class investment company
1. Subject to shareholder and regulatory approvals.
20
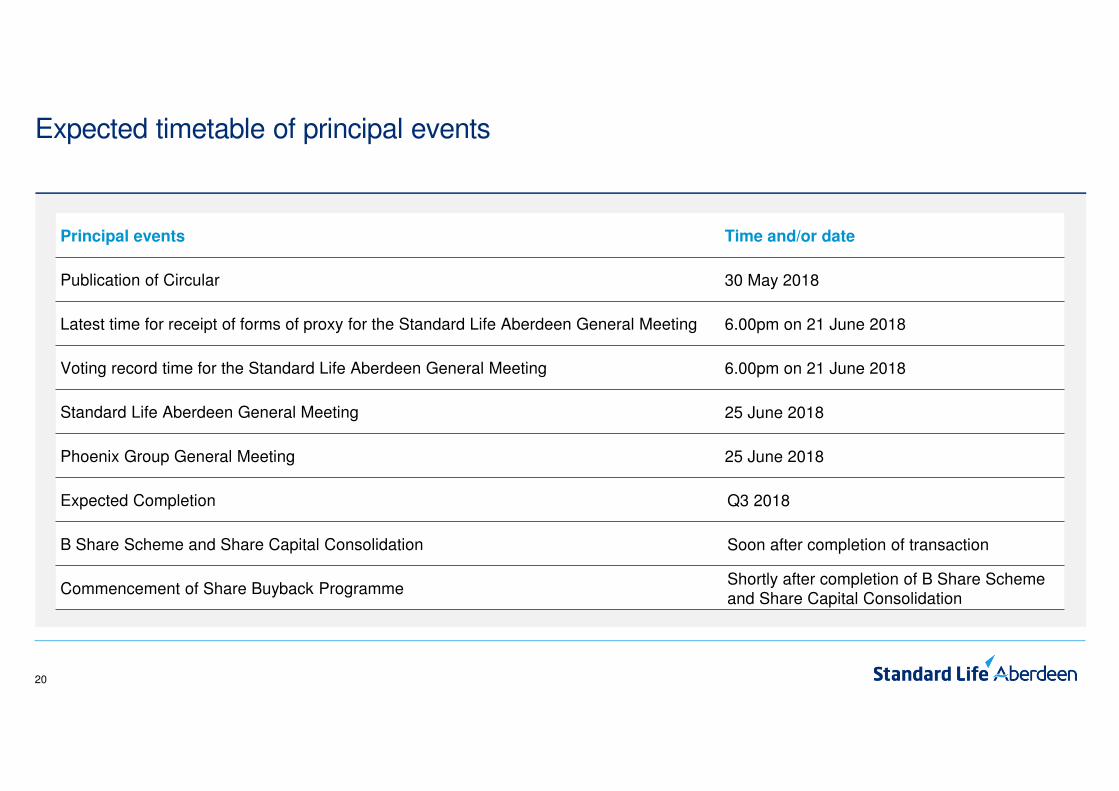
Expected timetable of principal events
Principal events Time and/or date
Publication of Circular 30 May 2018
Latest time for receipt of forms of proxy for the Standard Life Aberdeen General Meeting 6.00pm on 21 June 2018
Voting record time for the Standard Life Aberdeen General Meeting 6.00pm on 21 June 2018
Standard Life Aberdeen General Meeting 25 June 2018
Phoenix Group General Meeting 25 June 2018
Expected Completion Q3 2018
B Share Scheme and Share Capital Consolidation Soon after completion of transaction
Commencement of Share Buyback ProgrammeShortly after completion of B Share Scheme and Share Capital Consolidation
21
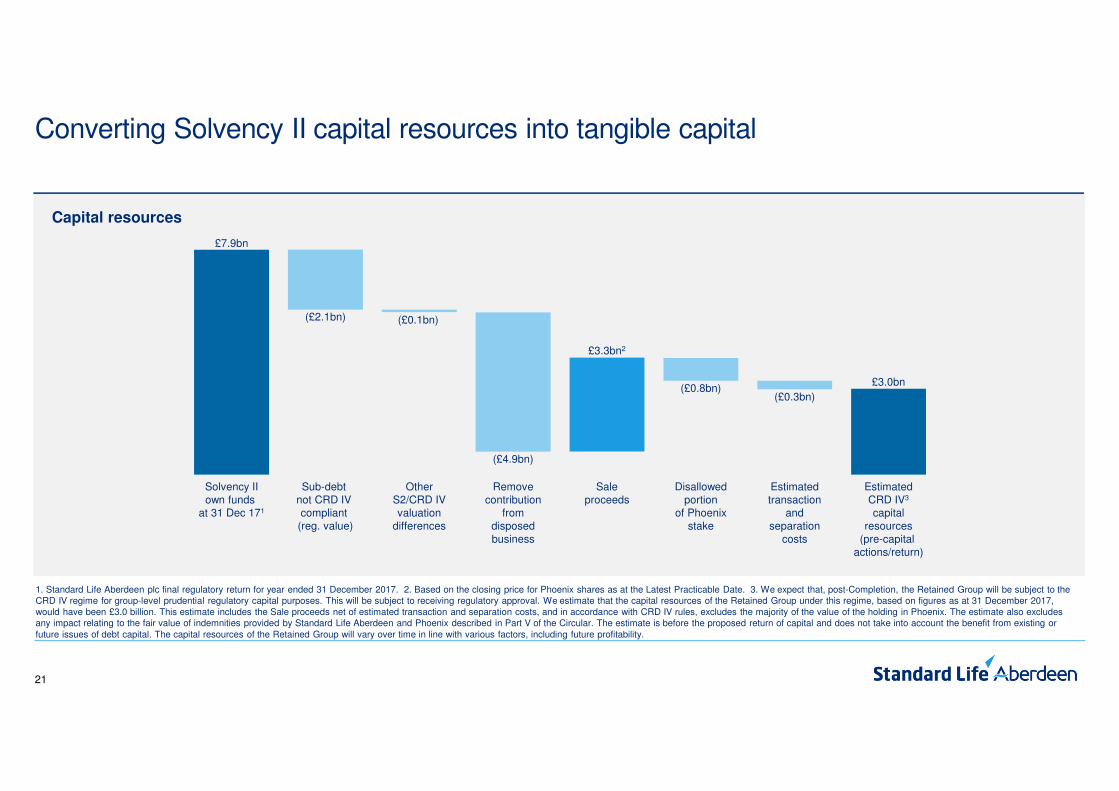
Converting Solvency II capital resources into tangible capital
Capital resources
Solvency IIown funds
at 31 Dec 171
Sub-debt not CRD IV compliant
(reg. value)
OtherS2/CRD IVvaluation
differences
Removecontribution
fromdisposedbusiness
Saleproceeds
Disallowedportion
of Phoenixstake
Estimatedtransaction
andseparation
costs
EstimatedCRD IV3
capitalresources
(pre-capital actions/return)
£7.9bn
(£2.1bn) (£0.1bn)
(£4.9bn)
£3.3bn2
(£0.8bn)(£0.3bn)
£3.0bn
1. Standard Life Aberdeen plc final regulatory return for year ended 31 December 2017. 2. Based on the closing price for Phoenix shares as at the Latest Practicable Date. 3. We expect that, post-Completion, the Retained Group will be subject to the CRD IV regime for group-level prudential regulatory capital purposes. This will be subject to receiving regulatory approval. We estimate that the capital resources of the Retained Group under this regime, based on figures as at 31 December 2017, would have been £3.0 billion. This estimate includes the Sale proceeds net of estimated transaction and separation costs, and in accordance with CRD IV rules, excludes the majority of the value of the holding in Phoenix. The estimate also excludes any impact relating to the fair value of indemnities provided by Standard Life Aberdeen and Phoenix described in Part V of the Circular. The estimate is before the proposed return of capital and does not take into account the benefit from existing or future issues of debt capital. The capital resources of the Retained Group will vary over time in line with various factors, including future profitability.
22
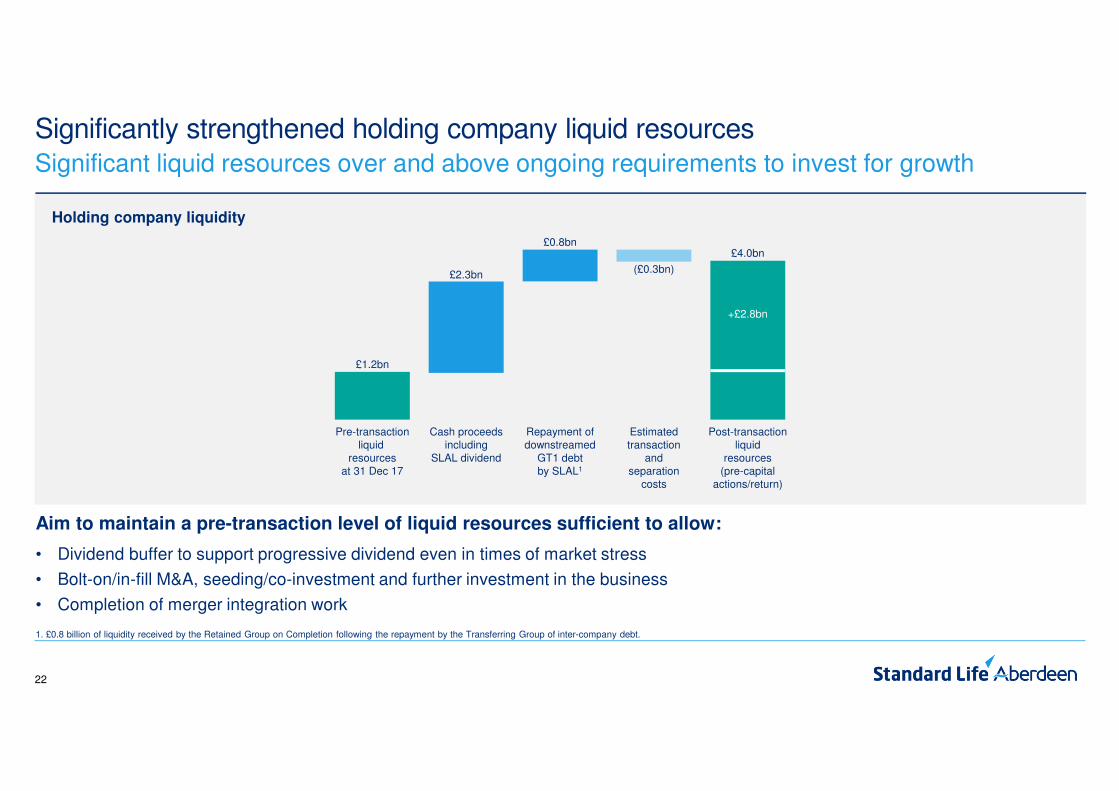
Significantly strengthened holding company liquid resources
Holding company liquidity
Significant liquid resources over and above ongoing requirements to invest for growth
Pre-transactionliquid
resourcesat 31 Dec 17
Cash proceedsincluding
SLAL dividend
Repayment ofdownstreamed
GT1 debtby SLAL1
Estimatedtransaction
andseparation
costs
Post-transactionliquid
resources(pre-capital
actions/return)
£1.2bn
£2.3bn
£0.8bn
(£0.3bn)
£4.0bn
Aim to maintain a pre-transaction level of liquid resources sufficient to allow:
• Dividend buffer to support progressive dividend even in times of market stress
• Bolt-on/in-fill M&A, seeding/co-investment and further investment in the business
• Completion of merger integration work
+£2.8bn
1. £0.8 billion of liquidity received by the Retained Group on Completion following the repayment by the Transferring Group of inter-company debt.
23
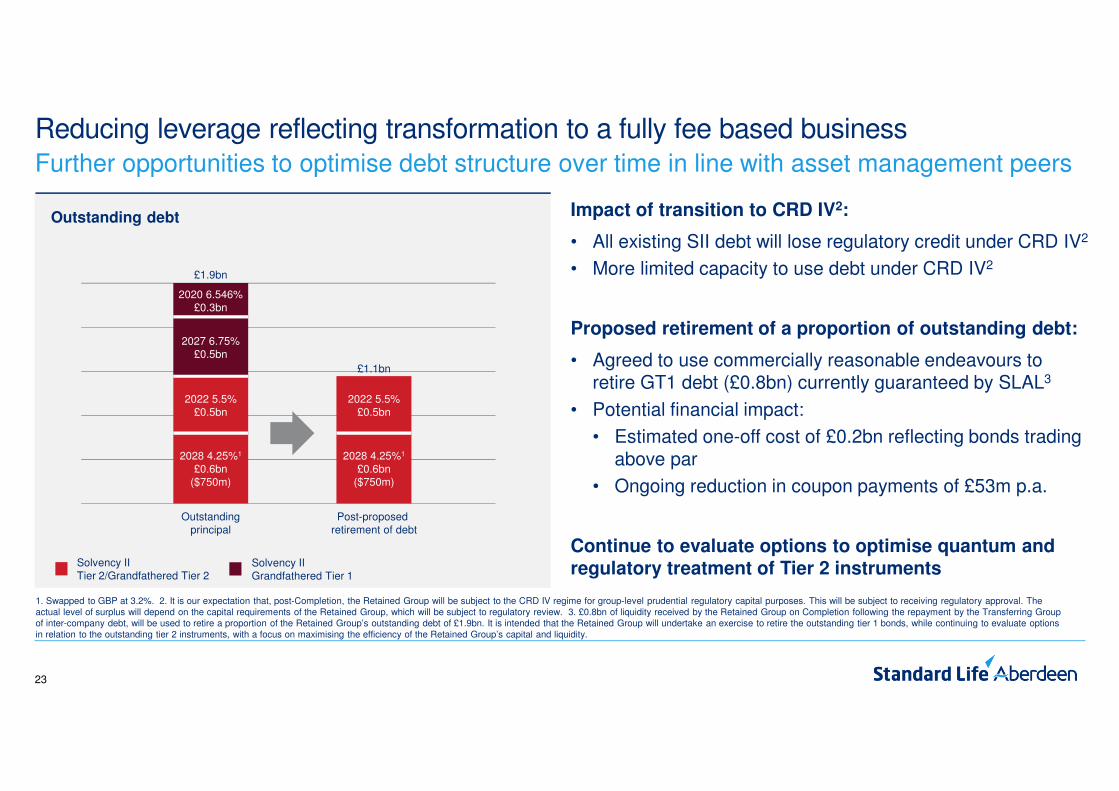
Reducing leverage reflecting transformation to a fully fee based businessFurther opportunities to optimise debt structure over time in line with asset management peers
Outstanding debt
2020 6.546%£0.3bn
Outstandingprincipal
£1.9bn
2027 6.75%£0.5bn
2022 5.5%£0.5bn
2028 4.25%1
£0.6bn($750m)
1. Swapped to GBP at 3.2%. 2. It is our expectation that, post-Completion, the Retained Group will be subject to the CRD IV regime for group-level prudential regulatory capital purposes. This will be subject to receiving regulatory approval. The actual level of surplus will depend on the capital requirements of the Retained Group, which will be subject to regulatory review. 3. £0.8bn of liquidity received by the Retained Group on Completion following the repayment by the Transferring Group of inter-company debt, will be used to retire a proportion of the Retained Group’s outstanding debt of £1.9bn. It is intended that the Retained Group will undertake an exercise to retire the outstanding tier 1 bonds, while continuing to evaluate options in relation to the outstanding tier 2 instruments, with a focus on maximising the efficiency of the Retained Group’s capital and liquidity.
Post-proposed retirement of debt
2022 5.5%£0.5bn
2028 4.25%1
£0.6bn($750m)
£1.1bn
Impact of transition to CRD IV2:
• All existing SII debt will lose regulatory credit under CRD IV2
• More limited capacity to use debt under CRD IV2
Proposed retirement of a proportion of outstanding debt:
• Agreed to use commercially reasonable endeavours to retire GT1 debt (£0.8bn) currently guaranteed by SLAL3
• Potential financial impact:
• Estimated one-off cost of £0.2bn reflecting bonds trading above par
• Ongoing reduction in coupon payments of £53m p.a.
Continue to evaluate options to optimise quantum and regulatory treatment of Tier 2 instrumentsSolvency II
Grandfathered Tier 1Solvency IITier 2/Grandfathered Tier 2
24
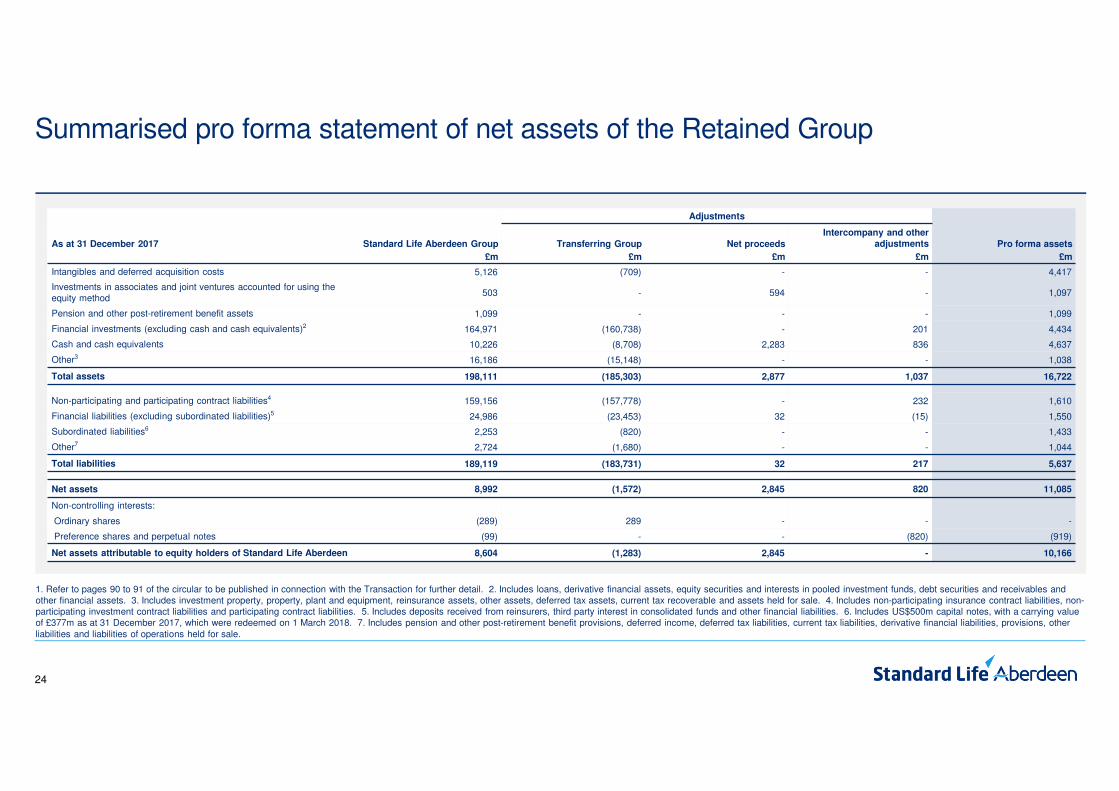
Summarised pro forma statement of net assets of the Retained Group
1. Refer to pages 90 to 91 of the circular to be published in connection with the Transaction for further detail. 2. Includes loans, derivative financial assets, equity securities and interests in pooled investment funds, debt securities and receivables and other financial assets. 3. Includes investment property, property, plant and equipment, reinsurance assets, other assets, deferred tax assets, current tax recoverable and assets held for sale. 4. Includes non-participating insurance contract liabilities, non-participating investment contract liabilities and participating contract liabilities. 5. Includes deposits received from reinsurers, third party interest in consolidated funds and other financial liabilities. 6. Includes US$500m capital notes, with a carrying value of £377m as at 31 December 2017, which were redeemed on 1 March 2018. 7. Includes pension and other post-retirement benefit provisions, deferred income, deferred tax liabilities, current tax liabilities, derivative financial liabilities, provisions, other liabilities and liabilities of operations held for sale.
Adjustments
As at 31 December 2017 Standard Life Aberdeen Group Transferring Group Net proceeds
Intercompany and other
adjustments Pro forma assets
£m £m £m £m £m
Intangibles and deferred acquisition costs 5,126 (709) - - 4,417
Investments in associates and joint ventures accounted for using the equity method
503 - 594 - 1,097
Pension and other post-retirement benefit assets 1,099 - - - 1,099
Financial investments (excluding cash and cash equivalents)2 164,971 (160,738) - 201 4,434
Cash and cash equivalents 10,226 (8,708) 2,283 836 4,637
Other3 16,186 (15,148) - - 1,038
Total assets 198,111 (185,303) 2,877 1,037 16,722
Non-participating and participating contract liabilities4 159,156 (157,778) - 232 1,610
Financial liabilities (excluding subordinated liabilities)5 24,986 (23,453) 32 (15) 1,550
Subordinated liabilities6 2,253 (820) - - 1,433
Other7 2,724 (1,680) - - 1,044
Total liabilities 189,119 (183,731) 32 217 5,637
Net assets 8,992 (1,572) 2,845 820 11,085
Non-controlling interests:
Ordinary shares (289) 289 - - -
Preference shares and perpetual notes (99) - - (820) (919)
Net assets attributable to equity holders of Standard Life Aberdeen 8,604 (1,283) 2,845 - 10,166
25
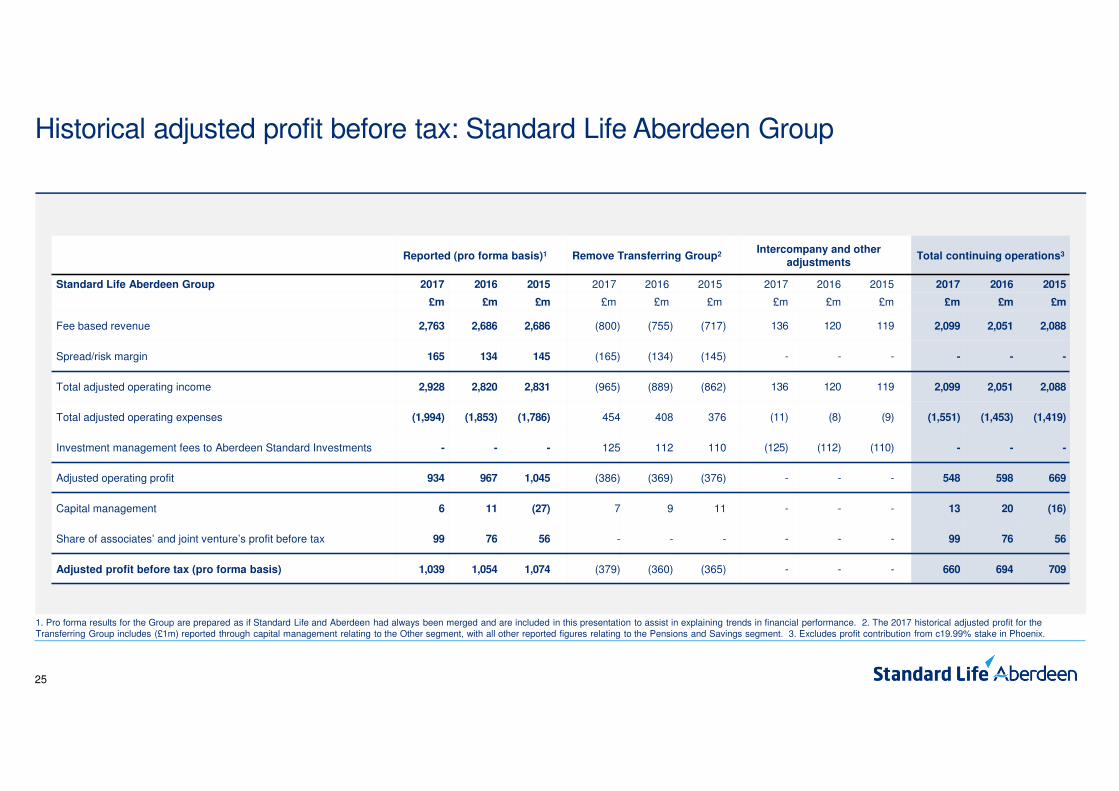
Historical adjusted profit before tax: Standard Life Aberdeen Group
Reported (pro forma basis)1 Remove Transferring Group2Intercompany and other
adjustmentsTotal continuing operations3
Standard Life Aberdeen Group 2017 2016 2015 2017 2016 2015 2017 2016 2015 2017 2016 2015
£m £m £m £m £m £m £m £m £m £m £m £m
Fee based revenue 2,763 2,686 2,686 (800) (755) (717) 136 120 119 2,099 2,051 2,088
Spread/risk margin 165 134 145 (165) (134) (145) - - - - - -
Total adjusted operating income 2,928 2,820 2,831 (965) (889) (862) 136 120 119 2,099 2,051 2,088
Total adjusted operating expenses (1,994) (1,853) (1,786) 454 408 376 (11) (8) (9) (1,551) (1,453) (1,419)
Investment management fees to Aberdeen Standard Investments - - - 125 112 110 (125) (112) (110) - - -
Adjusted operating profit 934 967 1,045 (386) (369) (376) - - - 548 598 669
Capital management 6 11 (27) 7 9 11 - - - 13 20 (16)
Share of associates’ and joint venture’s profit before tax 99 76 56 - - - - - - 99 76 56
Adjusted profit before tax (pro forma basis) 1,039 1,054 1,074 (379) (360) (365) - - - 660 694 709
1. Pro forma results for the Group are prepared as if Standard Life and Aberdeen had always been merged and are included in this presentation to assist in explaining trends in financial performance. 2. The 2017 historical adjusted profit for the Transferring Group includes (£1m) reported through capital management relating to the Other segment, with all other reported figures relating to the Pensions and Savings segment. 3. Excludes profit contribution from c19.99% stake in Phoenix.
26
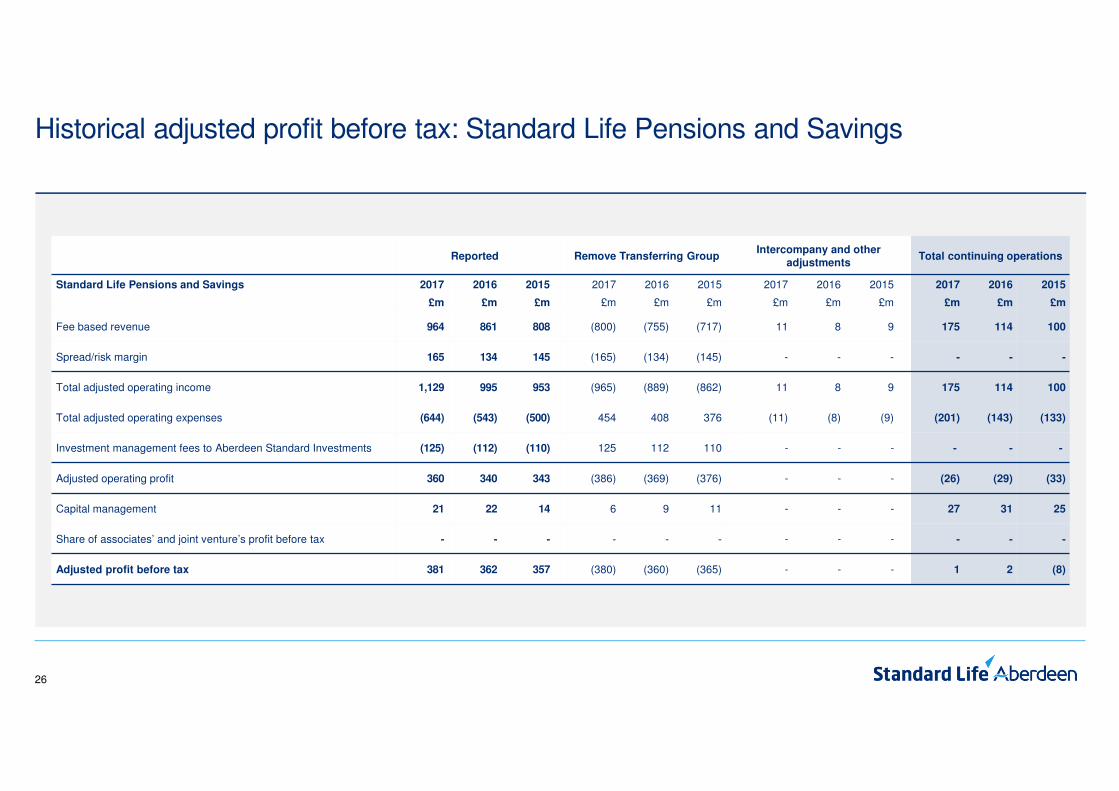
Historical adjusted profit before tax: Standard Life Pensions and Savings
Reported Remove Transferring GroupIntercompany and other
adjustmentsTotal continuing operations
Standard Life Pensions and Savings 2017 2016 2015 2017 2016 2015 2017 2016 2015 2017 2016 2015
£m £m £m £m £m £m £m £m £m £m £m £m
Fee based revenue 964 861 808 (800) (755) (717) 11 8 9 175 114 100
Spread/risk margin 165 134 145 (165) (134) (145) - - - - - -
Total adjusted operating income 1,129 995 953 (965) (889) (862) 11 8 9 175 114 100
Total adjusted operating expenses (644) (543) (500) 454 408 376 (11) (8) (9) (201) (143) (133)
Investment management fees to Aberdeen Standard Investments (125) (112) (110) 125 112 110 - - - - - -
Adjusted operating profit 360 340 343 (386) (369) (376) - - - (26) (29) (33)
Capital management 21 22 14 6 9 11 - - - 27 31 25
Share of associates’ and joint venture’s profit before tax - - - - - - - - - - - -
Adjusted profit before tax 381 362 357 (380) (360) (365) - - - 1 2 (8)
27
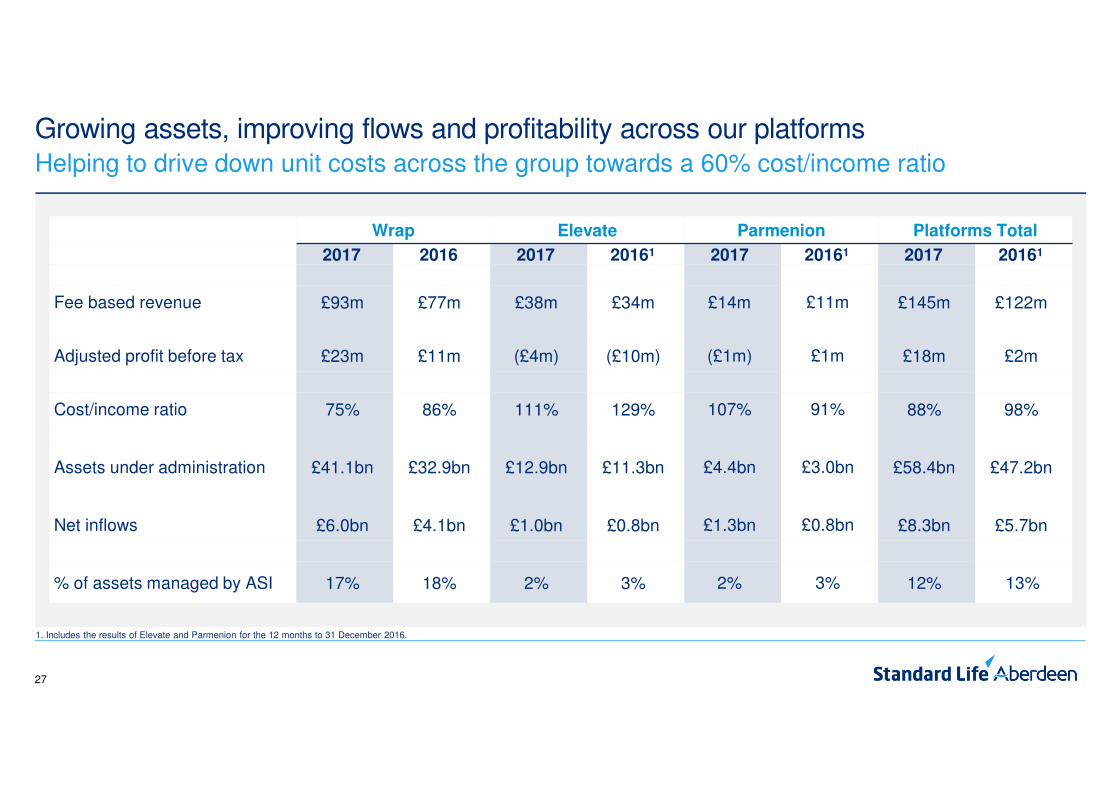
Growing assets, improving flows and profitability across our platformsHelping to drive down unit costs across the group towards a 60% cost/income ratio
Wrap Elevate Parmenion Platforms Total
2017 2016 2017 20161 2017 20161 2017 20161
Fee based revenue £93m £77m £38m £34m £14m £11m £145m £122m
Adjusted profit before tax £23m £11m (£4m) (£10m) (£1m) £1m £18m £2m
Cost/income ratio 75% 86% 111% 129% 107% 91% 88% 98%
Assets under administration £41.1bn £32.9bn £12.9bn £11.3bn £4.4bn £3.0bn £58.4bn £47.2bn
Net inflows £6.0bn £4.1bn £1.0bn £0.8bn £1.3bn £0.8bn £8.3bn £5.7bn
% of assets managed by ASI 17% 18% 2% 3% 2% 3% 12% 13%
1. Includes the results of Elevate and Parmenion for the 12 months to 31 December 2016.
28
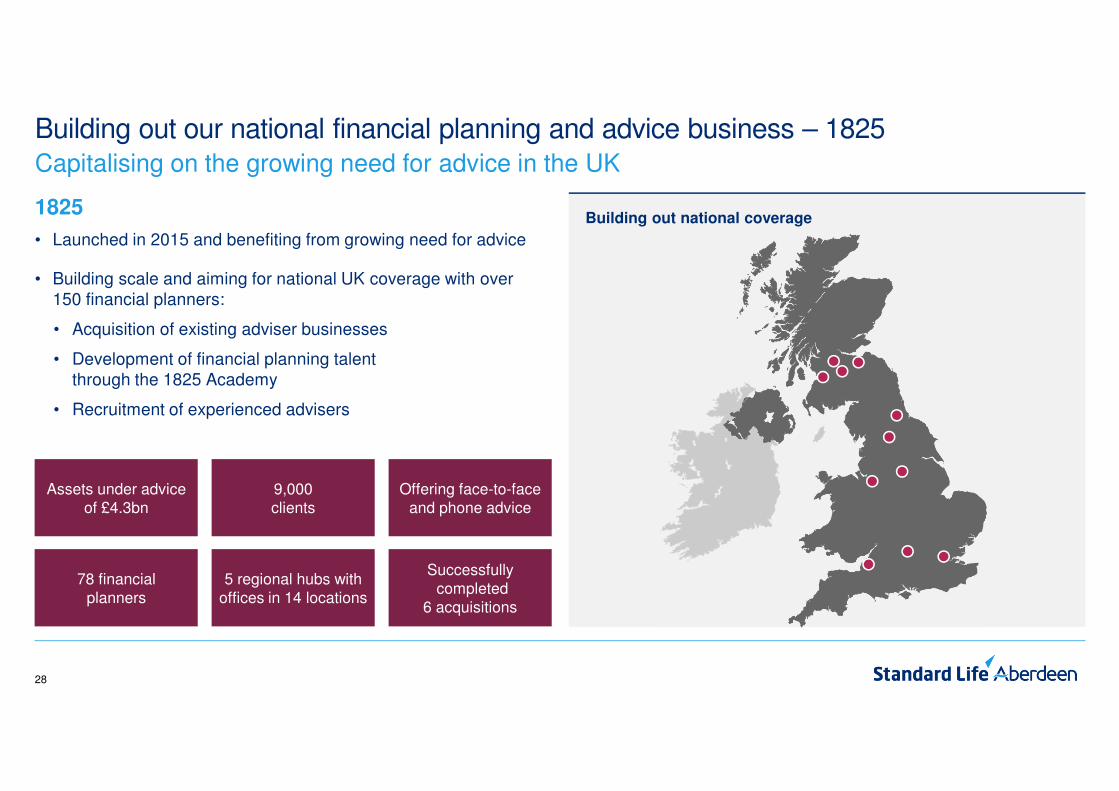
Building out our national financial planning and advice business – 1825
Building out national coverage
Capitalising on the growing need for advice in the UK
1825
• Launched in 2015 and benefiting from growing need for advice
• Building scale and aiming for national UK coverage with over 150 financial planners:
• Acquisition of existing adviser businesses
• Development of financial planning talent through the 1825 Academy
• Recruitment of experienced advisers
Assets under adviceof £4.3bn
Offering face-to-face and phone advice
9,000 clients
78 financialplanners
Successfullycompleted
6 acquisitions
5 regional hubs with offices in 14 locations
29
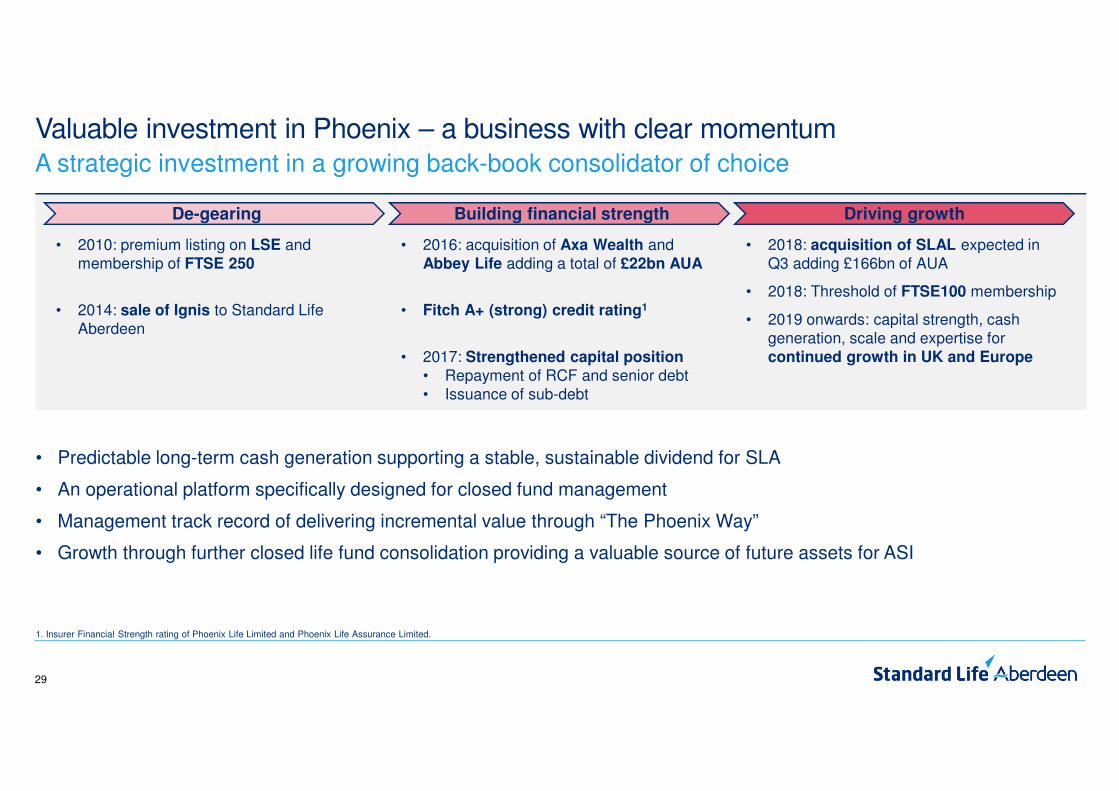
Valuable investment in Phoenix – a business with clear momentumA strategic investment in a growing back-book consolidator of choice
• Predictable long-term cash generation supporting a stable, sustainable dividend for SLA
• An operational platform specifically designed for closed fund management
• Management track record of delivering incremental value through “The Phoenix Way”
• Growth through further closed life fund consolidation providing a valuable source of future assets for ASI
1. Insurer Financial Strength rating of Phoenix Life Limited and Phoenix Life Assurance Limited.
De-gearing Building financial strength Driving growth
• 2010: premium listing on LSE and membership of FTSE 250
• 2014: sale of Ignis to Standard Life Aberdeen
• 2016: acquisition of Axa Wealth and Abbey Life adding a total of £22bn AUA
• Fitch A+ (strong) credit rating1
• 2017: Strengthened capital position
• Repayment of RCF and senior debt• Issuance of sub-debt
• 2018: acquisition of SLAL expected in Q3 adding £166bn of AUA
• 2018: Threshold of FTSE100 membership
• 2019 onwards: capital strength, cash generation, scale and expertise for continued growth in UK and Europe
30
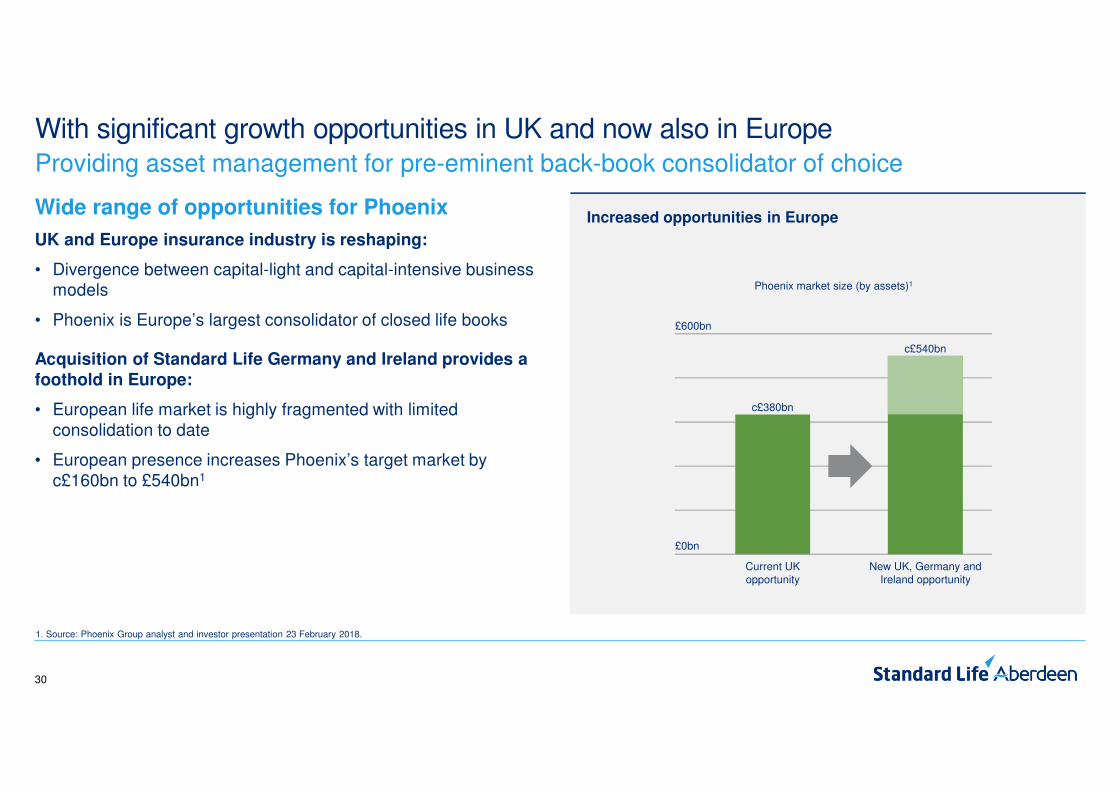
Increased opportunities in Europe
With significant growth opportunities in UK and now also in EuropeProviding asset management for pre-eminent back-book consolidator of choice
Wide range of opportunities for Phoenix
UK and Europe insurance industry is reshaping:
• Divergence between capital-light and capital-intensive business models
• Phoenix is Europe’s largest consolidator of closed life books
Acquisition of Standard Life Germany and Ireland provides a
foothold in Europe:
• European life market is highly fragmented with limited consolidation to date
• European presence increases Phoenix’s target market by c£160bn to £540bn1
1. Source: Phoenix Group analyst and investor presentation 23 February 2018.
Current UKopportunity
New UK, Germany andIreland opportunity
Phoenix market size (by assets)1
£600bn
£0bn
c£380bn
c£540bn
31
R2,306bn
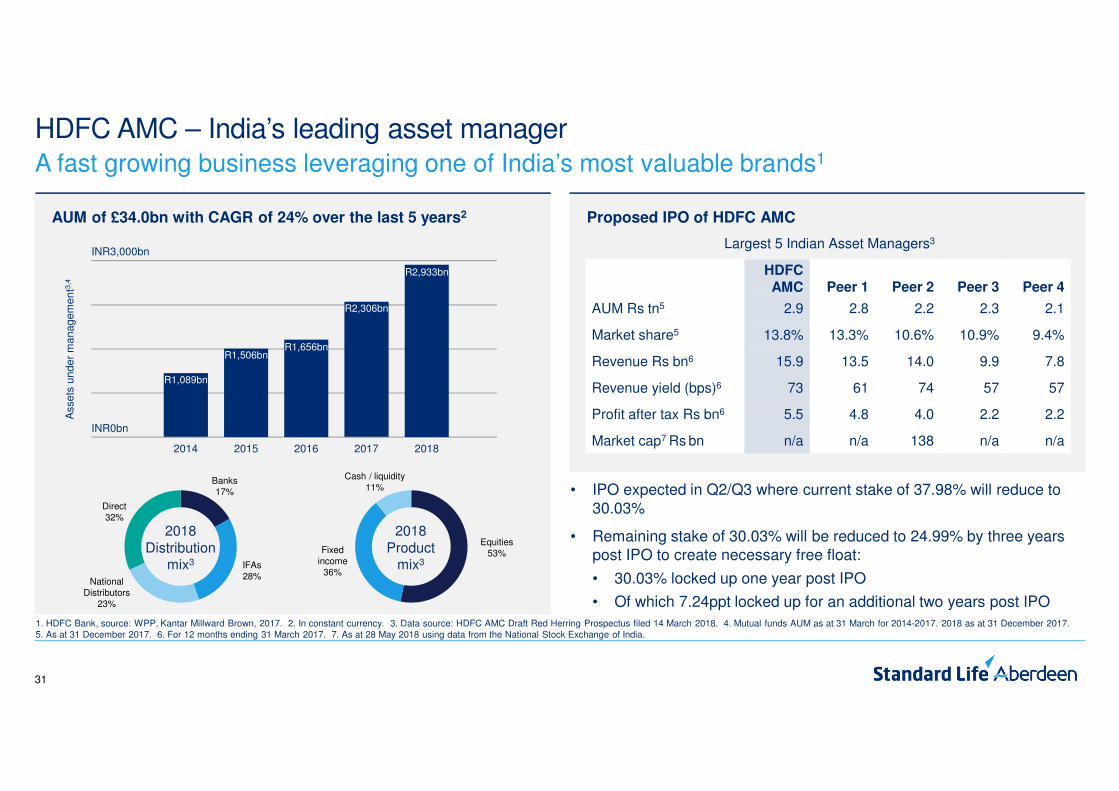
HDFC AMC – India’s leading asset manager
1. HDFC Bank, source: WPP, Kantar Millward Brown, 2017. 2. In constant currency. 3. Data source: HDFC AMC Draft Red Herring Prospectus filed 14 March 2018. 4. Mutual funds AUM as at 31 March for 2014-2017. 2018 as at 31 December 2017. 5. As at 31 December 2017. 6. For 12 months ending 31 March 2017. 7. As at 28 May 2018 using data from the National Stock Exchange of India.
A fast growing business leveraging one of India’s most valuable brands1
• IPO expected in Q2/Q3 where current stake of 37.98% will reduce to 30.03%
• Remaining stake of 30.03% will be reduced to 24.99% by three years post IPO to create necessary free float:
• 30.03% locked up one year post IPO
• Of which 7.24ppt locked up for an additional two years post IPO
Proposed IPO of HDFC AMCAUM of £34.0bn with CAGR of 24% over the last 5 years2
R1,089bn
2014
INR3,000bn
INR0bn
2016
R1,656bn
2018
R2,933bn
2015
R1,506bn
2017
Asse
ts u
nd
er
ma
na
ge
me
nt3
,4
2018Distribution
mix3
2018Product
mix3
Largest 5 Indian Asset Managers3
HDFC
AMC Peer 1 Peer 2 Peer 3 Peer 4
AUM Rs tn5 2.9 2.8 2.2 2.3 2.1
Market share5 13.8% 13.3% 10.6% 10.9% 9.4%
Revenue Rs bn6 15.9 13.5 14.0 9.9 7.8
Revenue yield (bps)6 73 61 74 57 57
Profit after tax Rs bn6 5.5 4.8 4.0 2.2 2.2
Market cap7 Rs bn n/a n/a 138 n/a n/a
Direct32%
Banks17%
IFAs28%
National Distributors
23%
Equities53%Fixed
income36%
Cash / liquidity11%
32
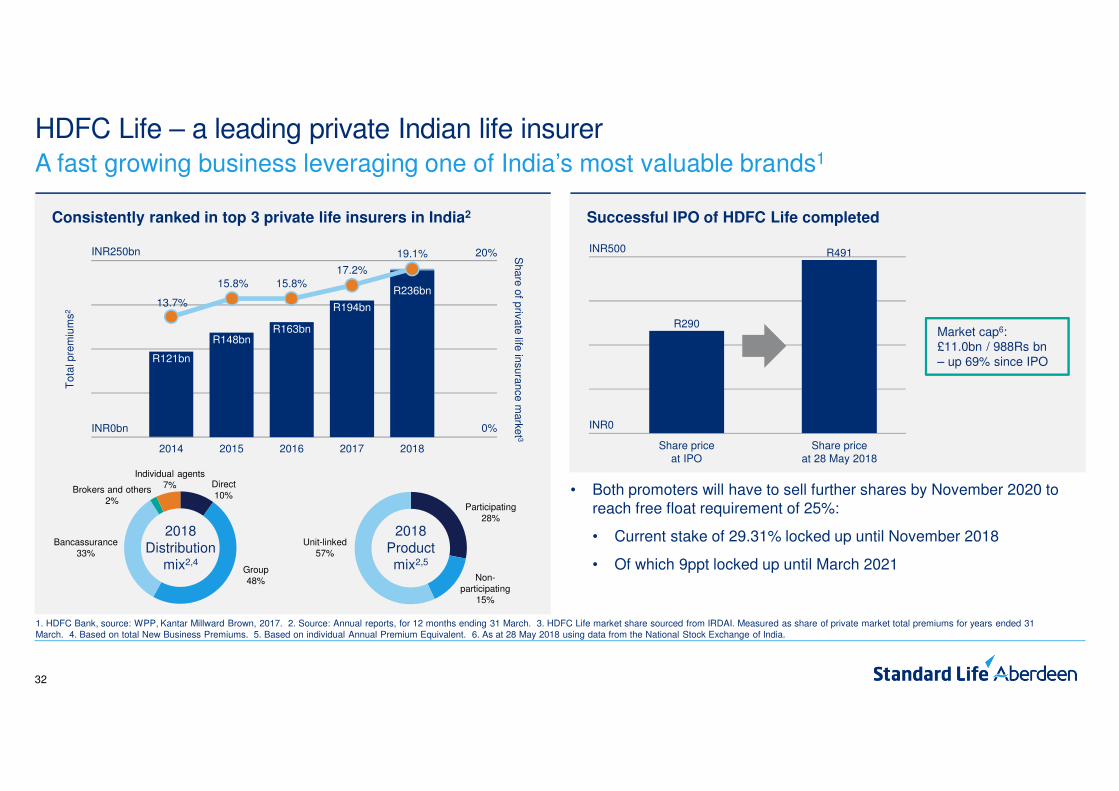
HDFC Life – a leading private Indian life insurer
1. HDFC Bank, source: WPP, Kantar Millward Brown, 2017. 2. Source: Annual reports, for 12 months ending 31 March. 3. HDFC Life market share sourced from IRDAI. Measured as share of private market total premiums for years ended 31 March. 4. Based on total New Business Premiums. 5. Based on individual Annual Premium Equivalent. 6. As at 28 May 2018 using data from the National Stock Exchange of India.
A fast growing business leveraging one of India’s most valuable brands1
• Both promoters will have to sell further shares by November 2020 to reach free float requirement of 25%:
• Current stake of 29.31% locked up until November 2018
• Of which 9ppt locked up until March 2021
Successful IPO of HDFC Life completedConsistently ranked in top 3 private life insurers in India2
Share priceat IPO
Share priceat 28 May 2018
INR500
INR0
R290
R491
Market cap6: £11.0bn / 988Rs bn – up 69% since IPOR121bn
2014
INR250bn
INR0bn
2016
R163bn
2018
R236bn
2015
R148bn
2017
2016
R194bn
20%
0%
To
tal p
rem
ium
s2
Sh
are
of p
riva
te life
insu
ran
ce
ma
rke
t 3
13.7%
15.8%
17.2%
19.1%
2018Distribution
mix2,4
2018Product mix2,5
Bancassurance33%
Direct10%
Group48%
Brokers and others2%
Individual agents7%
Participating 28%
Non-participating
15%
Unit-linked 57%
15.8%
33
£2m
2012
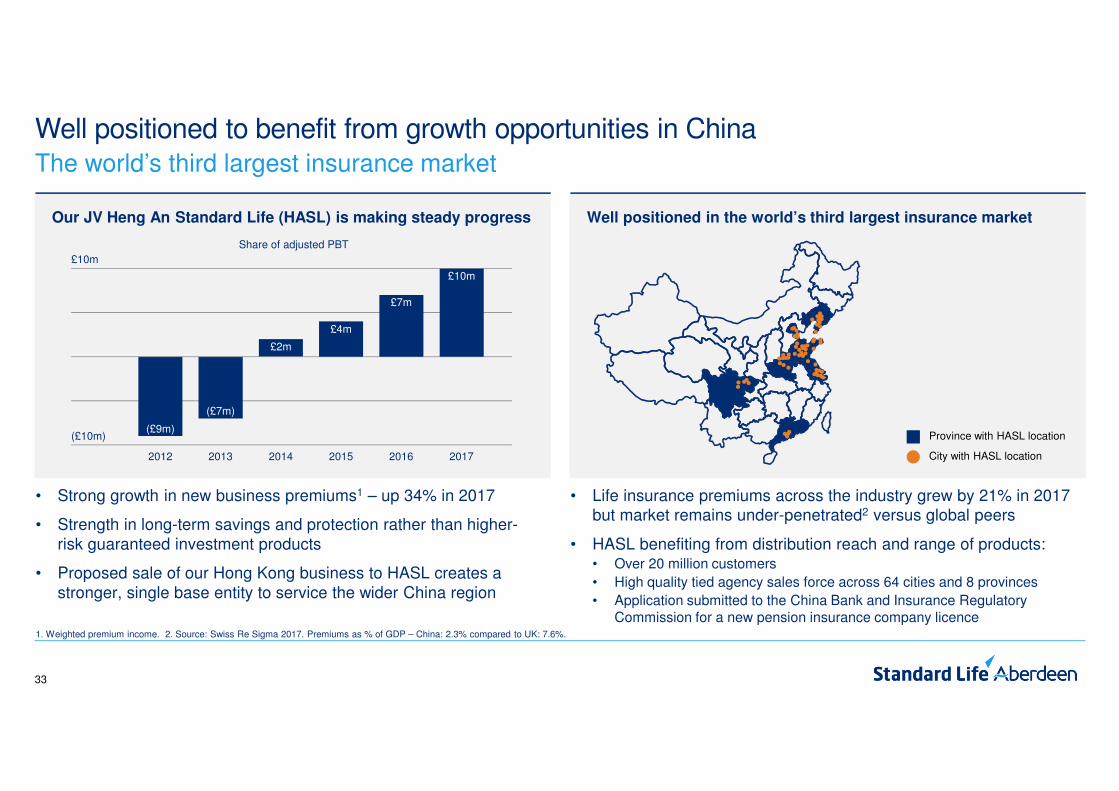
Well positioned in the world’s third largest insurance market
Well positioned to benefit from growth opportunities in China
Our JV Heng An Standard Life (HASL) is making steady progress
• Strong growth in new business premiums1 – up 34% in 2017
• Strength in long-term savings and protection rather than higher-risk guaranteed investment products
• Proposed sale of our Hong Kong business to HASL creates a stronger, single base entity to service the wider China region
• Life insurance premiums across the industry grew by 21% in 2017 but market remains under-penetrated2 versus global peers
• HASL benefiting from distribution reach and range of products:• Over 20 million customers
• High quality tied agency sales force across 64 cities and 8 provinces
• Application submitted to the China Bank and Insurance Regulatory Commission for a new pension insurance company licence
1. Weighted premium income. 2. Source: Swiss Re Sigma 2017. Premiums as % of GDP – China: 2.3% compared to UK: 7.6%.
The world’s third largest insurance market
Province with HASL location
City with HASL location
(£9m)
£10m
(£10m)
2014 20162013
(£7m)
2015 2017
Share of adjusted PBT
£4m
£7m
£10m
34
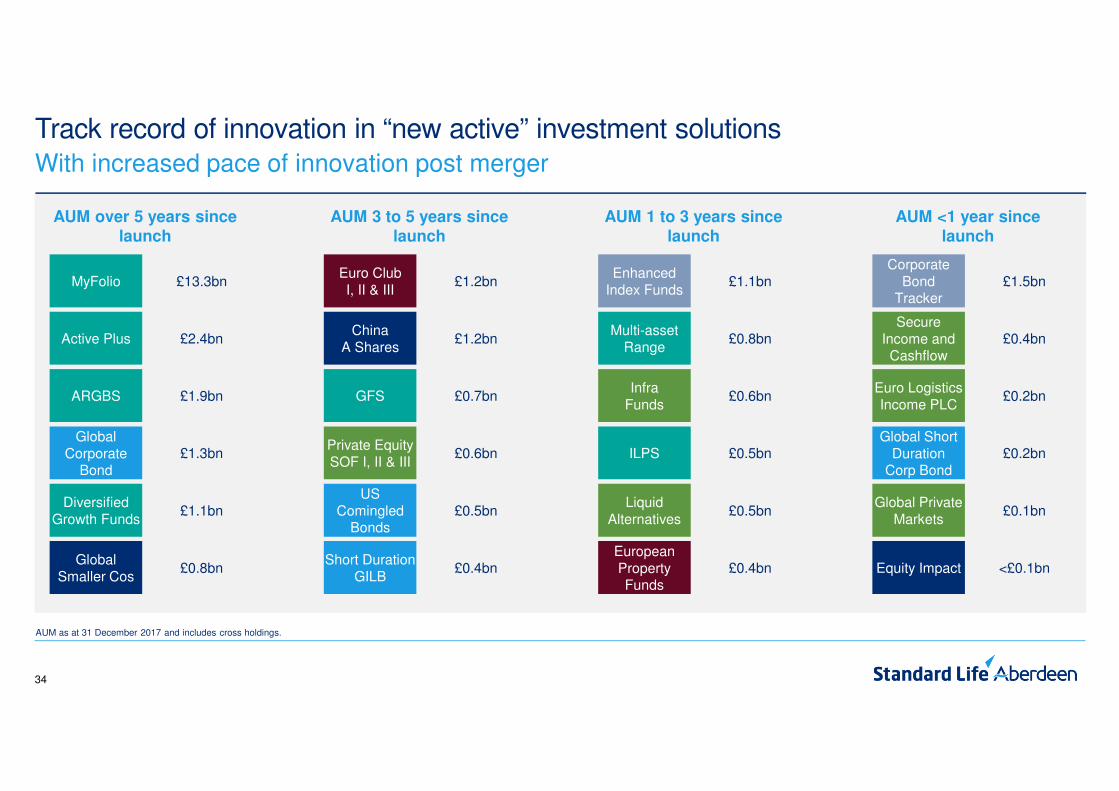
Track record of innovation in “new active” investment solutionsWith increased pace of innovation post merger
AUM as at 31 December 2017 and includes cross holdings.
Active Plus
ARGBS
Global Corporate
Bond
Diversified Growth Funds
Global Smaller Cos
MyFolio £13.3bn
AUM over 5 years since launch
£2.4bn
£1.9bn
£1.3bn
£1.1bn
£0.8bn
China A Shares
GFS
Private Equity SOF I, II & III
US Comingled
Bonds
Short Duration GILB
Euro ClubI, II & III
£1.2bn
AUM 3 to 5 years since launch
£1.2bn
£0.7bn
£0.6bn
£0.5bn
£0.4bn
Multi-assetRange
InfraFunds
ILPS
Liquid Alternatives
European Property Funds
Enhanced Index Funds
£1.1bn
AUM 1 to 3 years since launch
£0.8bn
£0.6bn
£0.5bn
£0.5bn
£0.4bn
Secure Income and Cashflow
Euro Logistics Income PLC
Global Short Duration
Corp Bond
Global Private Markets
Equity Impact
Corporate Bond
Tracker£1.5bn
AUM <1 year since launch
£0.4bn
£0.2bn
£0.2bn
£0.1bn
<£0.1bn
35
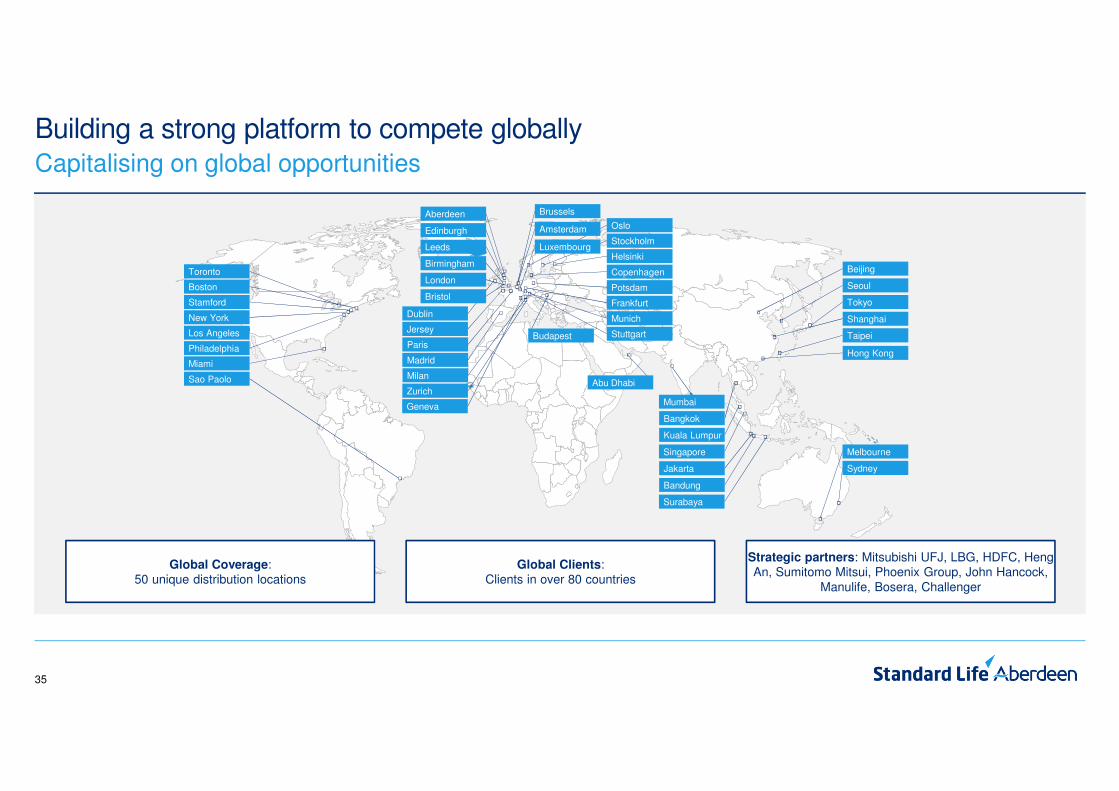
Building a strong platform to compete globallyCapitalising on global opportunities
Aberdeen
JerseyBudapest
Copenhagen
Helsinki
Oslo
Miami
Philadelphia
Sao Paolo
Stamford
Bangkok
Kuala Lumpur
Shanghai
Jakarta
Bandung
Melbourne
Surabaya
Taipei
Abu Dhabi
Luxembourg
Birmingham
Leeds
Dublin
Geneva
Munich
Potsdam
StuttgartLos Angeles
Beijing
Brussels
London
Edinburgh
Bristol
Madrid
Milan
Paris
Frankfurt
Stockholm
Zurich
Boston
New York
Toronto
Hong Kong
Seoul
Singapore
Sydney
Tokyo
Amsterdam
Mumbai
Strategic partners: Mitsubishi UFJ, LBG, HDFC, Heng An, Sumitomo Mitsui, Phoenix Group, John Hancock,
Manulife, Bosera, Challenger
Global Clients: Clients in over 80 countries
Global Coverage: 50 unique distribution locations
Standard Life Aberdeen plc is registered in Scotland (SC286832) at Standard Life House, 30 Lothian Road, Edinburgh EH1 2DH.
www.standardlifeaberdeen.com © 2018 Standard Life Aberdeen, images reproduced under licence. All rights reserved.


![qbr1-1info.brightgauge.com/hubfs/qbr1-1.pdf[QBR] SLA Statistics by I-HT Normal Priority - Last 90 Days PRIORITY TOTAL MET SLA - 65 Normal MET SLA MET RESPONSE SLA RESPONSE SLA MET](https://img.pdfslide.us/doc/110x75/613b13f2f8f21c0c8268ccdd/qbr1-1info-qbr-sla-statistics-by-i-ht-normal-priority-last-90-days-priority.jpg)