Embed Size (px)
Citation preview
SKY NETWORK TELEVISION ANNUAL RESULTS 2011
CEO
JOHN FELLET
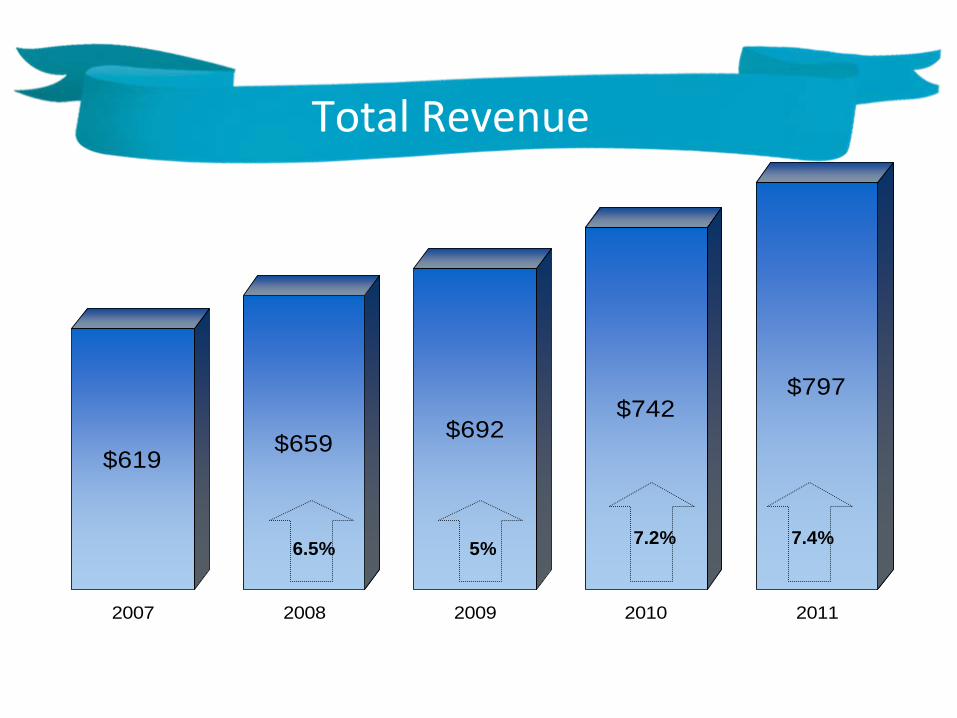
$619$659 $692
$742$797
2007 2008 2009 2010 2011
Total Revenue
5% 7.2% 7.4%6.5%
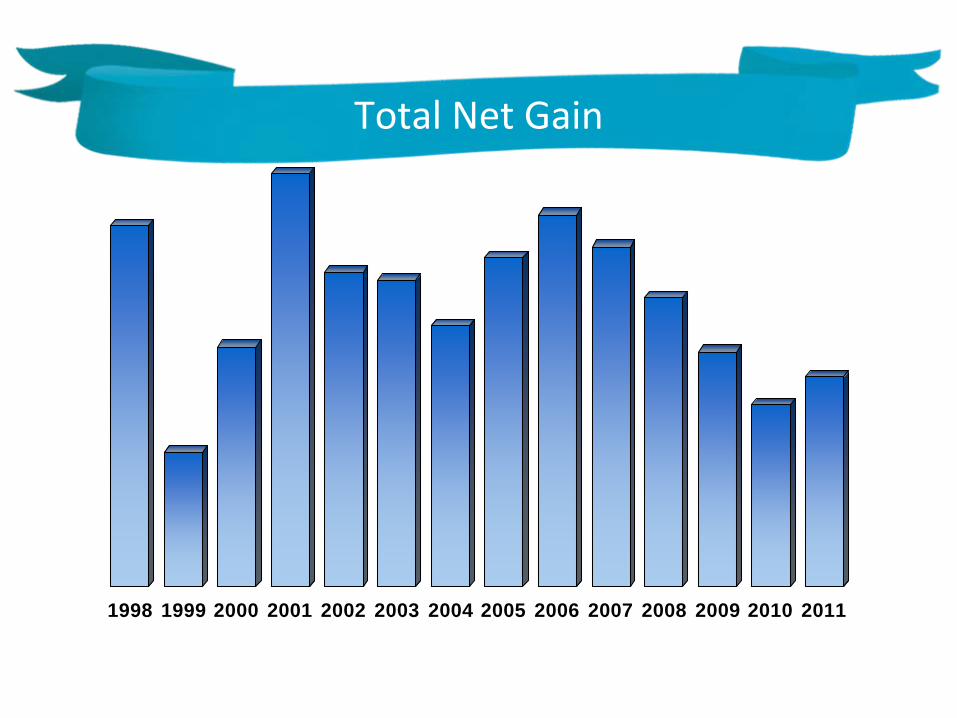
Total Net Gain
1998 1999 2000 2001 2002 2003 2004 2005 2006 2007 2008 2009 2010 2011
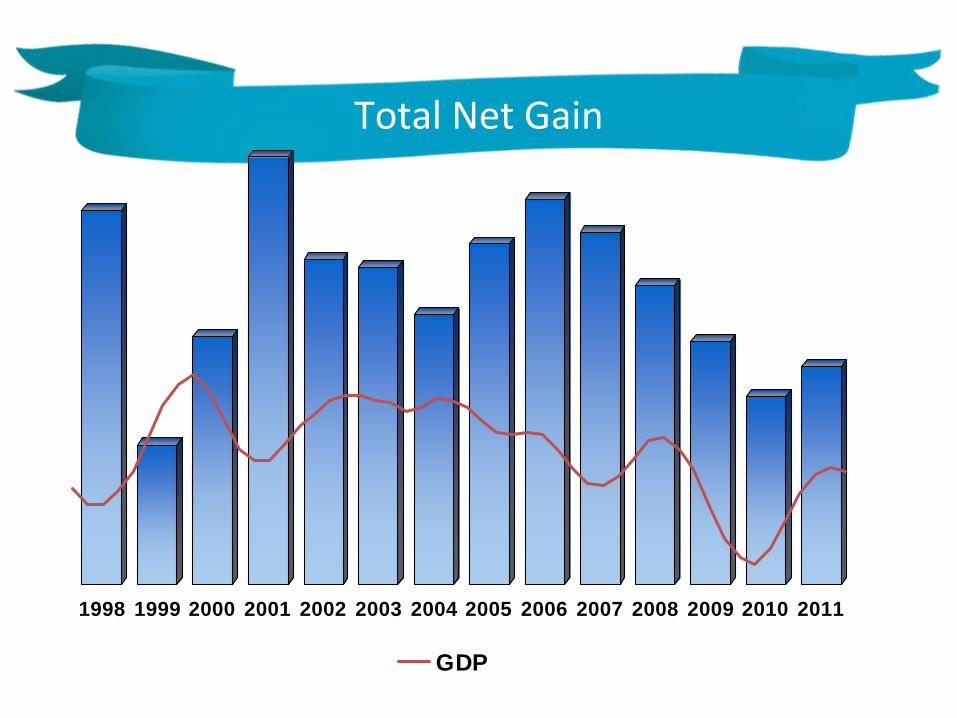
Total Net Gain
1998 1999 2000 2001 2002 2003 2004 2005 2006 2007 2008 2009 2010 2011
-8.00%
-3.00%
2.00%
7.00%
12.00%
GDP
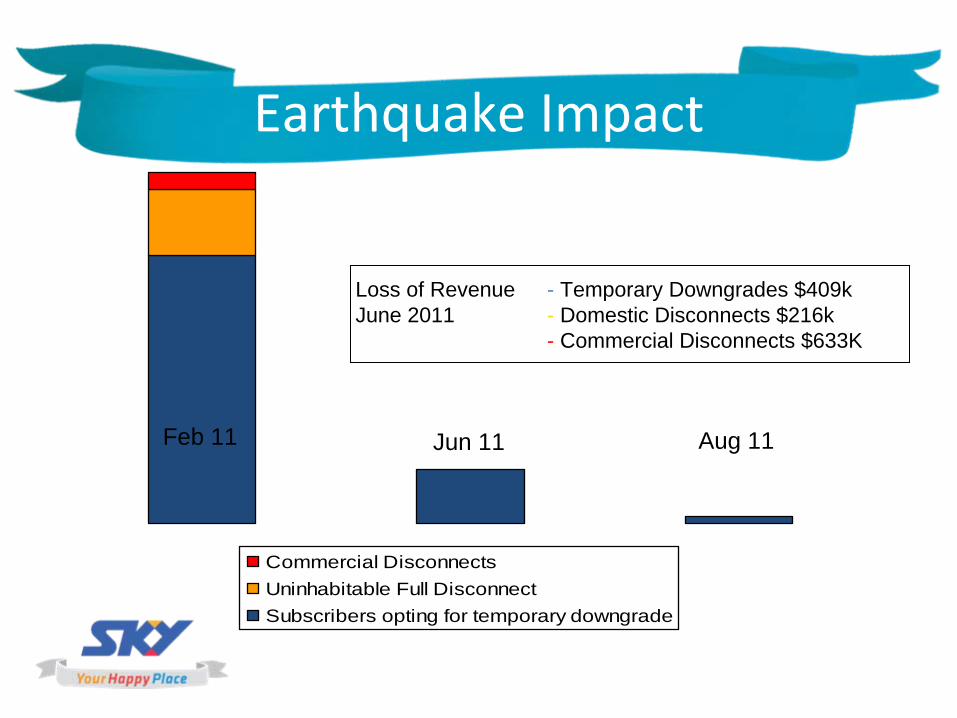
Earthquake Impact
Commercial DisconnectsUninhabitable Full Disconnect Subscribers opting for temporary downgrade
Loss of Revenue - Temporary Downgrades $409kJune 2011 - Domestic Disconnects $216k
- Commercial Disconnects $633K
Feb 11 Jun 11 Aug 11
10%12%14%16%18%20%22%24%26%28%30%32%
Jun-98
Jun-99
Jun-00
Jun-01
Jun-02
Jun-03
Jun-04
Jun-05
Jun-06
Jun-07
Jun-08
Jun-09
Jun-10
Jun-11
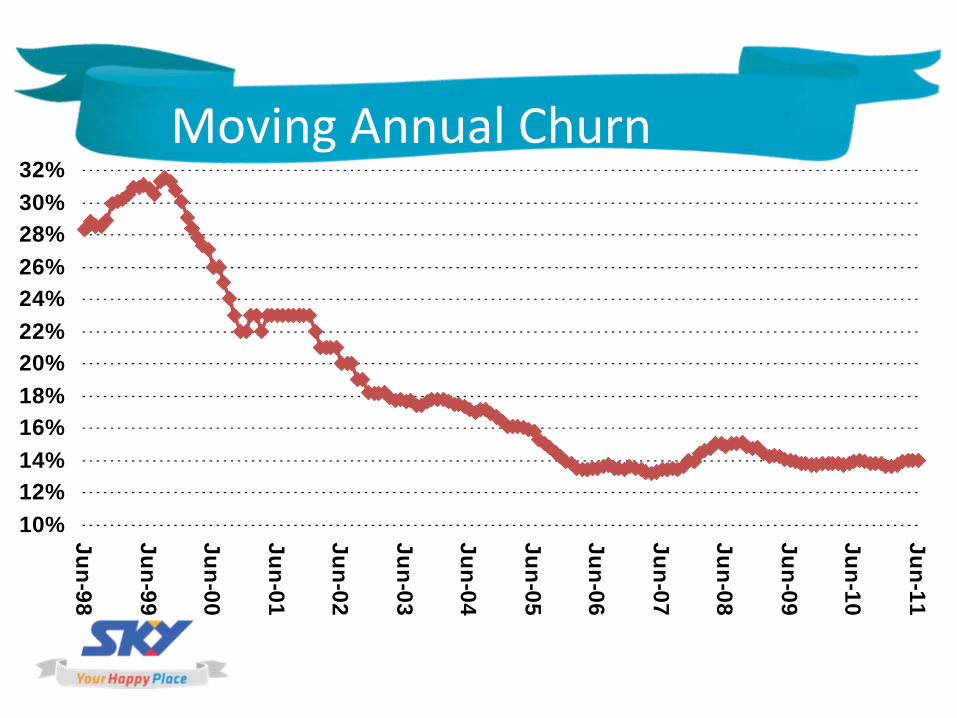
Moving Annual Churn
0.50%
1.00%
1.50%
2.00%
2.50%
Jul
Aug
Sep OctNov
Dec Jan
Feb Mar AprMay Ju
n
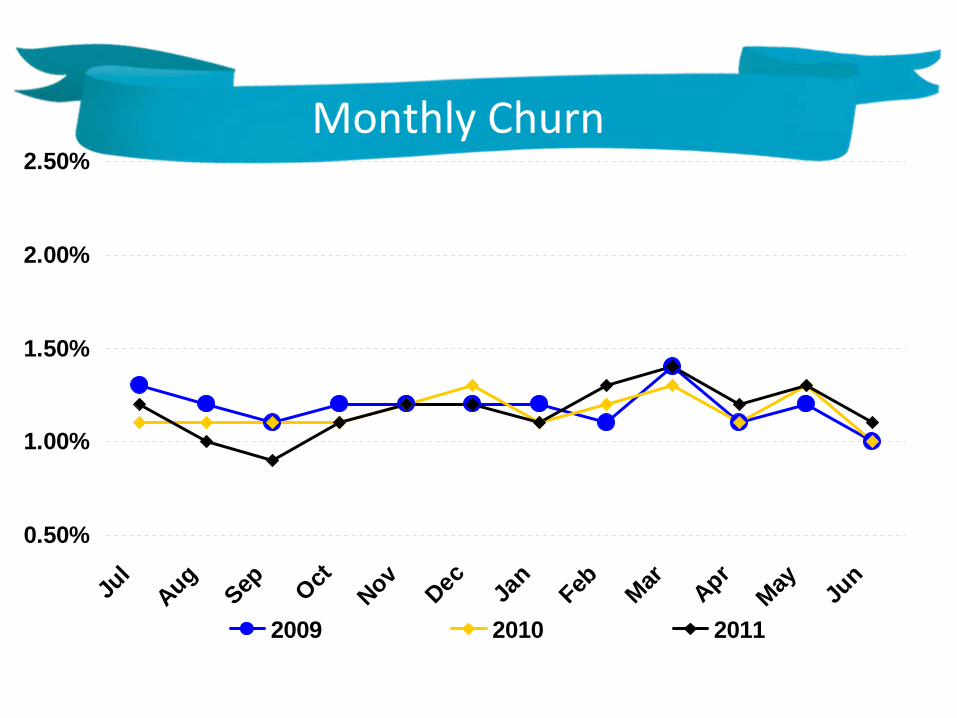
2009 2010 2011
Monthly Churn
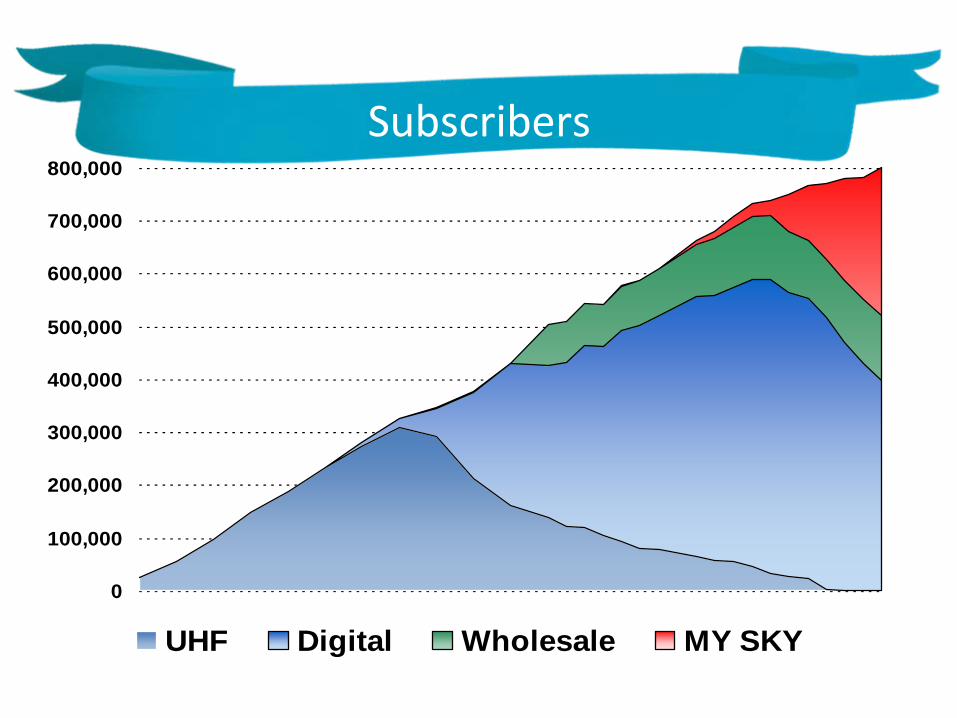
Subscribers
0
100,000
200,000
300,000
400,000
500,000
600,000
700,000
800,000
UHF Digital Wholesale MY SKY
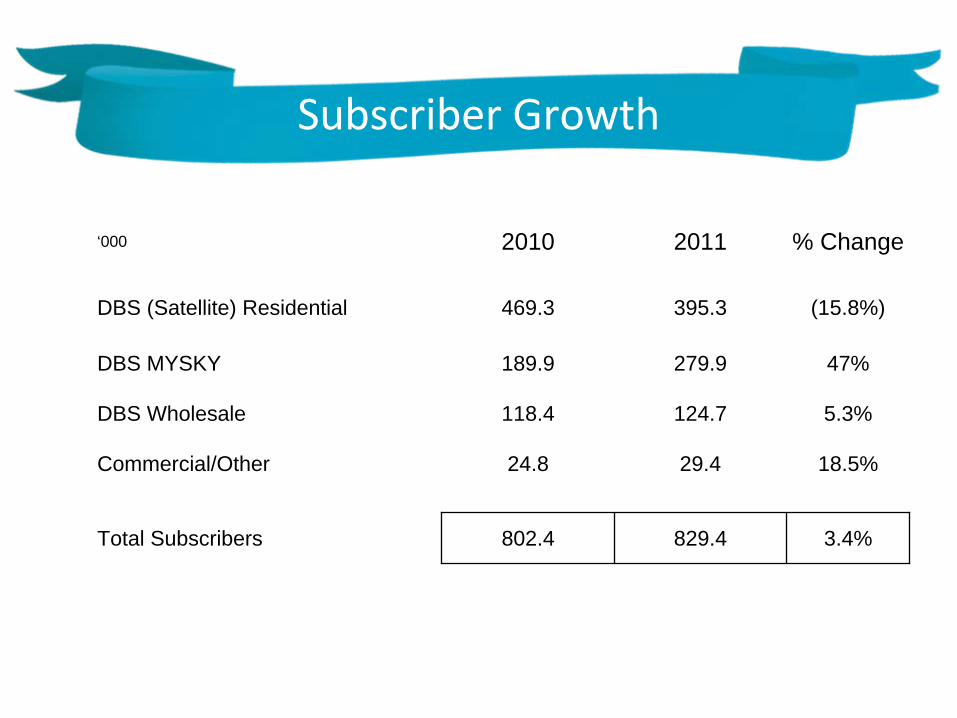
Subscriber Growth
‘000 2010 2011 % Change
DBS (Satellite) Residential 469.3 395.3 (15.8%)
DBS MYSKY 189.9 279.9 47%
DBS Wholesale 118.4 124.7 5.3%
Commercial/Other 24.8 29.4 18.5%
Total Subscribers 802.4 829.4 3.4%
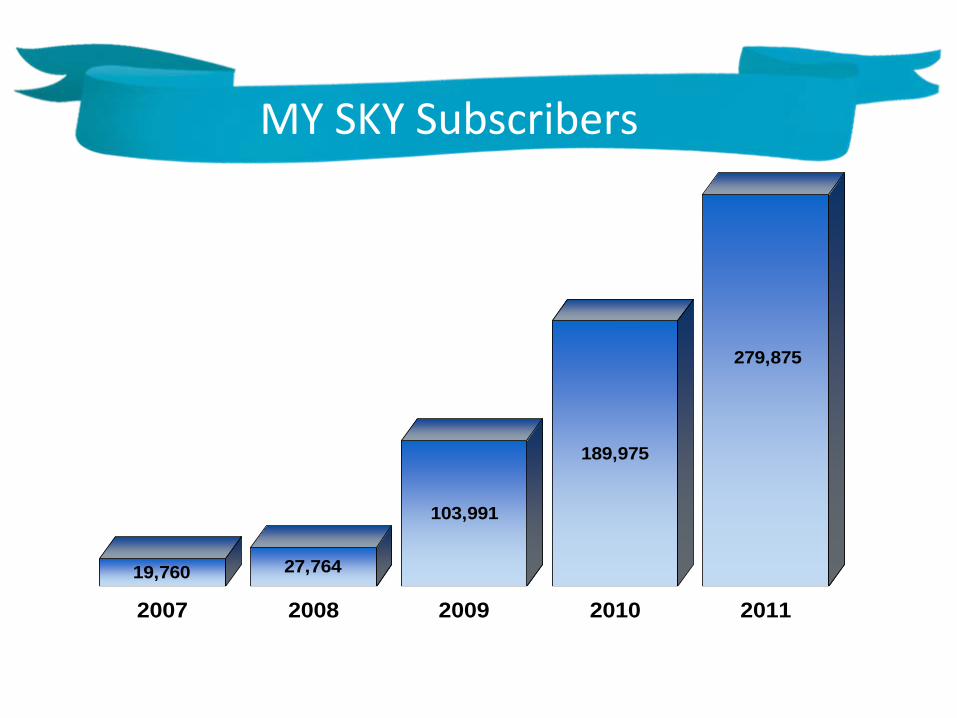
19,760 27,764
103,991
189,975
279,875
0
25,000
50,000
75,000
100,000
125,000
150,000
175,000
200,000
225,000
250,000
275,000
2007 2008 2009 2010 2011
MY SKY Subscribers
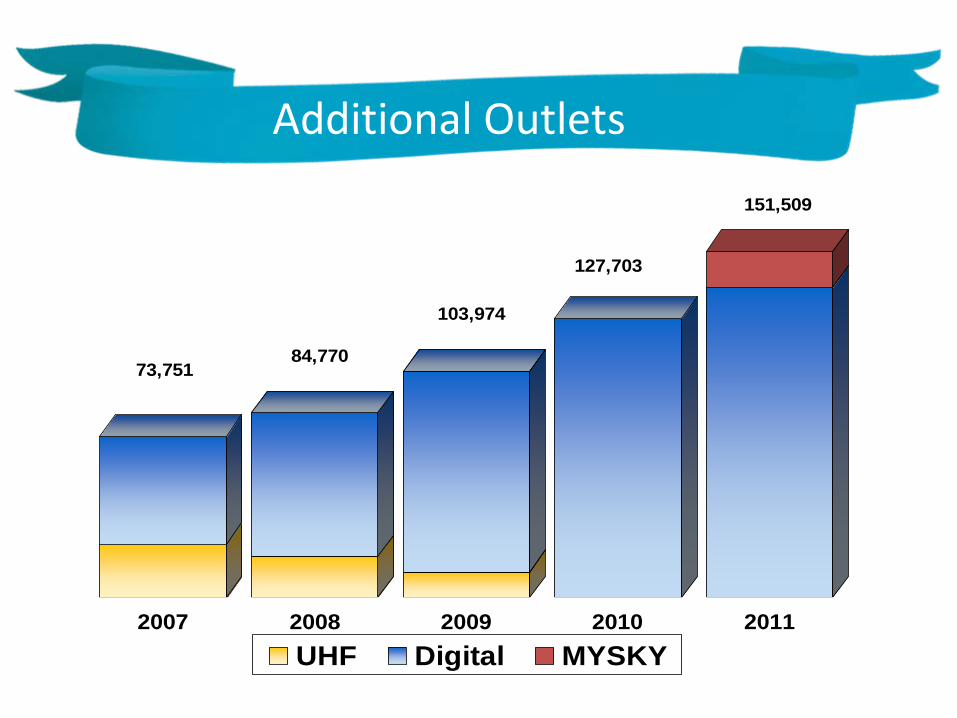
73,75184,770
103,974
127,703
151,509
0
25,000
50,000
75,000
100,000
125,000
150,000
175,000
2007 2008 2009 2010 2011UHF Digital MYSKY
Additional Outlets
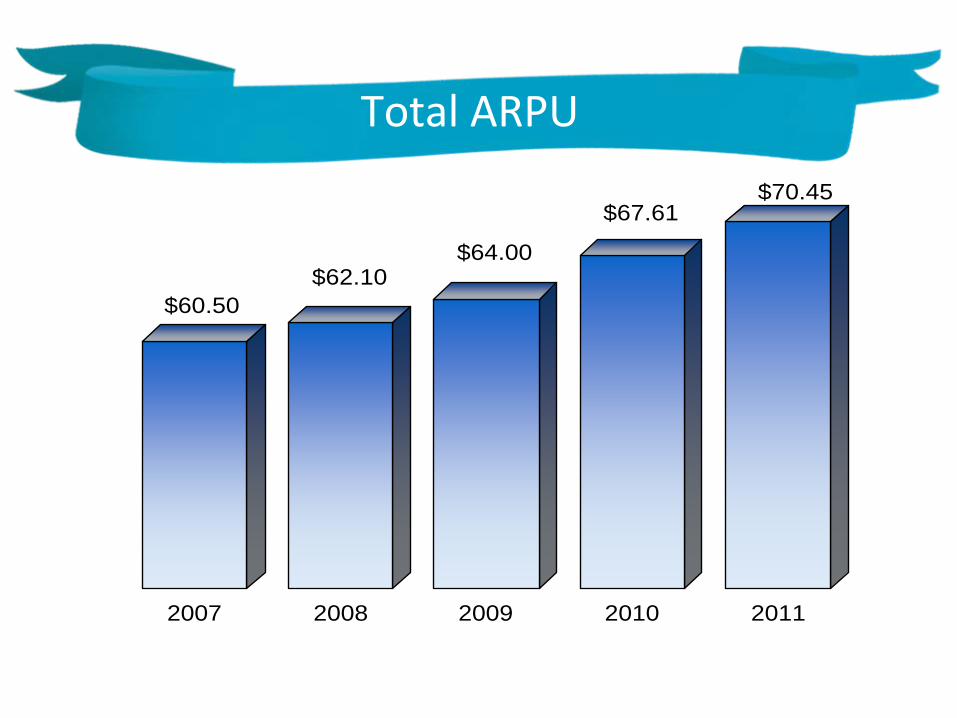
Total ARPU
$60.50$62.10
$64.00
$67.61$70.45
2007 2008 2009 2010 2011
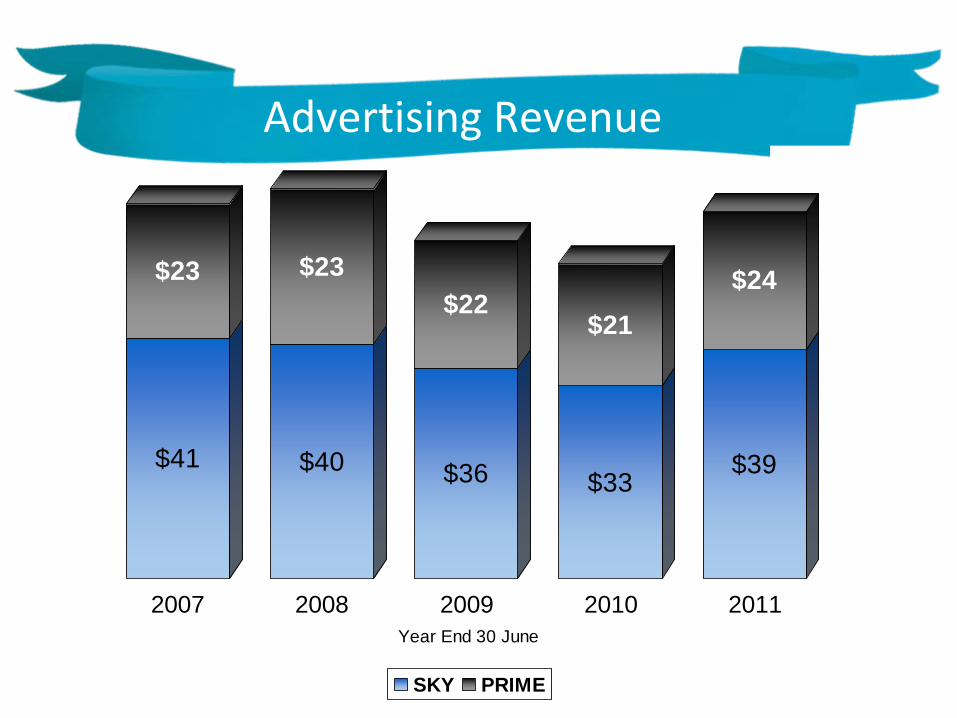
$41
$23
$40
$23
$36
$22
$33
$21
$39
$24
2007 2008 2009 2010 2011Year End 30 June
SKY PRIME
Advertising Revenue
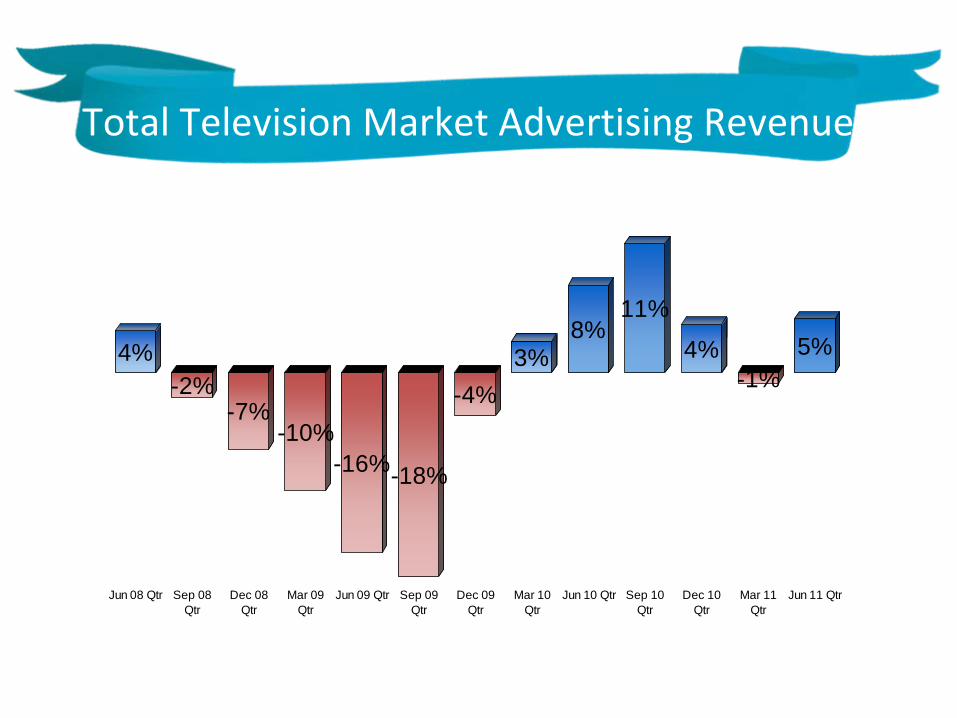
Total Television Market Advertising Revenue
4%-2%
-7%-10%
-16%-18%
-4%3%
8%11%
4%-1%
5%
Jun 08 Qtr Sep 08Qtr
Dec 08Qtr
Mar 09Qtr
Jun 09 Qtr Sep 09Qtr
Dec 09Qtr
Mar 10Qtr
Jun 10 Qtr Sep 10Qtr
Dec 10Qtr
Mar 11Qtr
Jun 11 Qtr
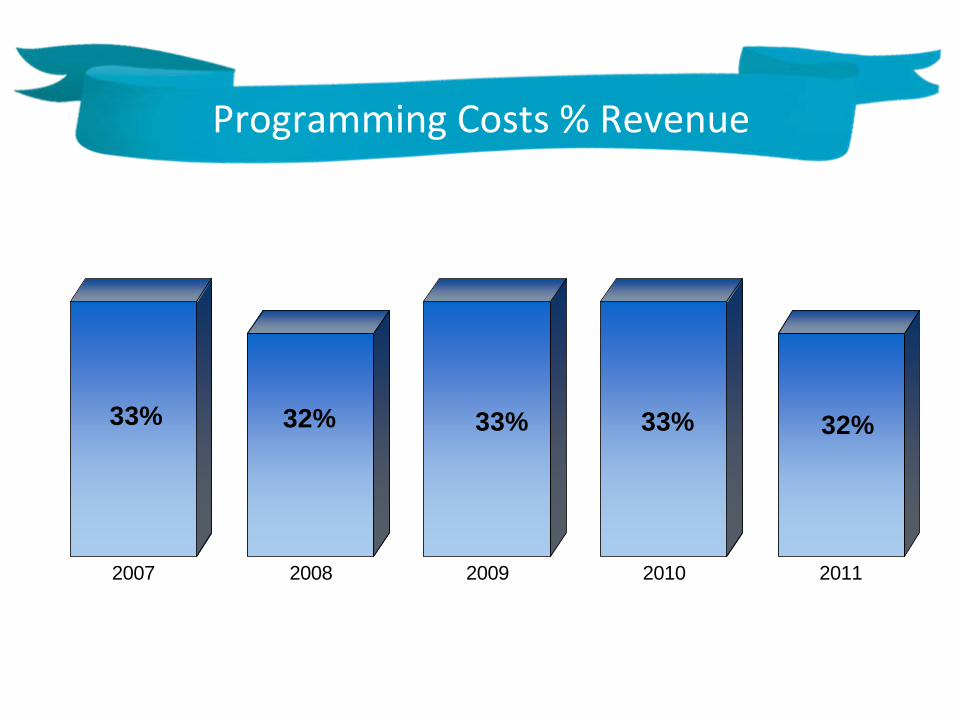
Programming Costs % Revenue
33% 32% 33% 33% 32%
2007 2008 2009 2010 2011
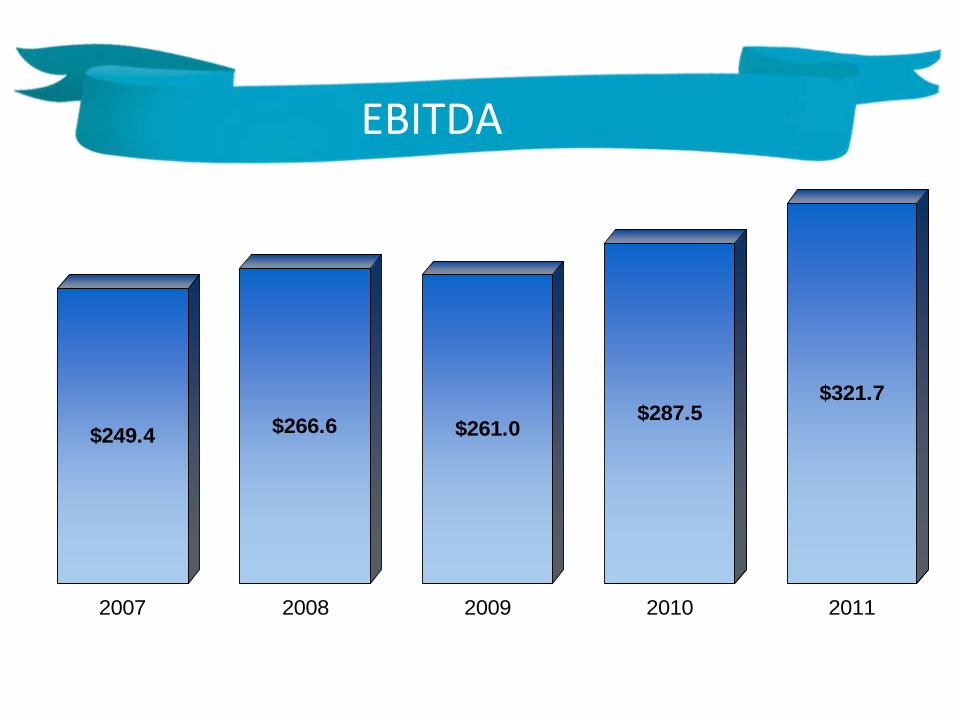
$249.4 $266.6 $261.0$287.5
$321.7
2007 2008 2009 2010 2011
EBITDA
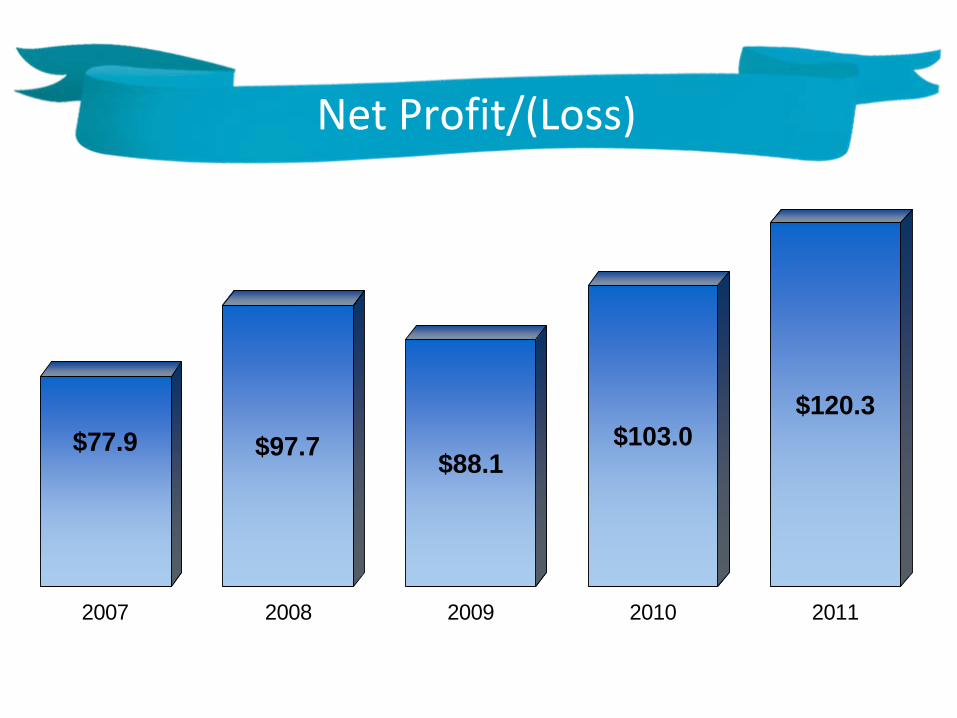
$77.9 $97.7 $88.1$103.0
$120.3
2007 2008 2009 2010 2011
Net Profit/(Loss)

CFO
JASON HOLLINGWORTH
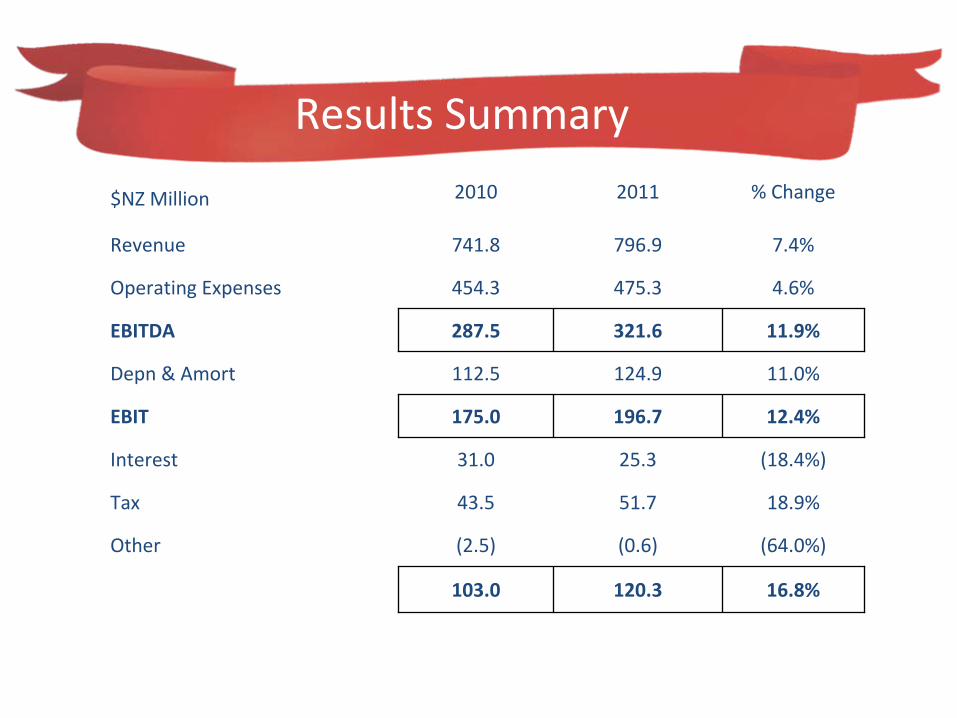
Results Summary
$NZ Million 2010 2011 % Change
Revenue 741.8 796.9 7.4%
Operating Expenses 454.3 475.3 4.6%
EBITDA 287.5 321.6 11.9%
Depn & Amort 112.5 124.9 11.0%
EBIT 175.0 196.7 12.4%
Interest 31.0 25.3 (18.4%)
Tax 43.5 51.7 18.9%
Other (2.5) (0.6) (64.0%)
Net Profit after Tax 103.0 120.3 16.8%
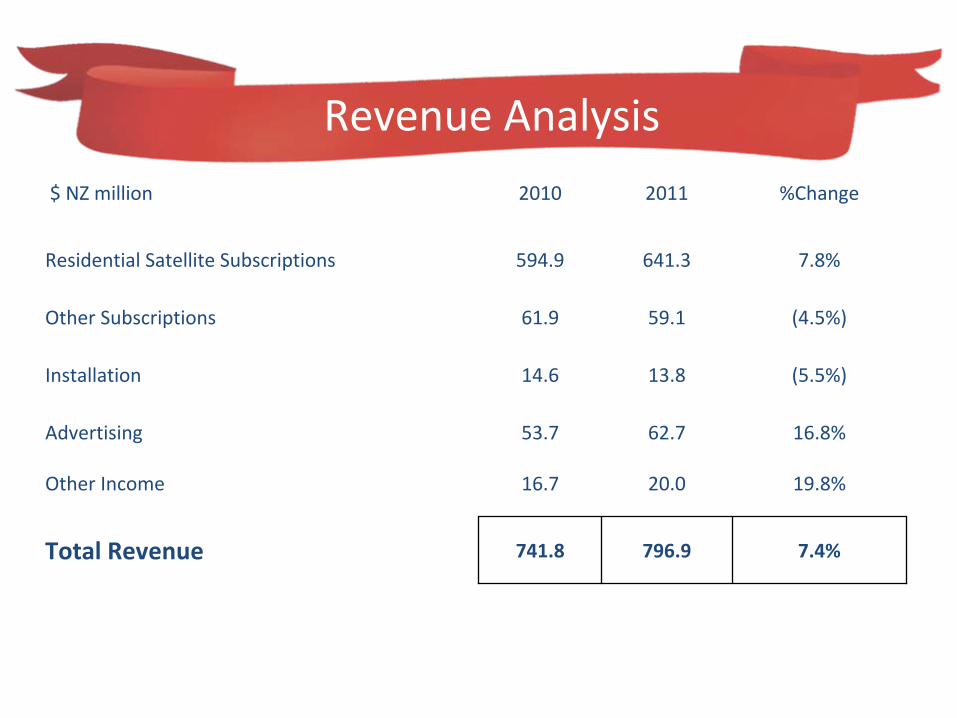
Revenue Analysis
$ NZ million 2010 2011 %Change
Residential Satellite Subscriptions 594.9 641.3 7.8%
Other Subscriptions 61.9 59.1 (4.5%)
Installation 14.6 13.8 (5.5%)
Advertising 53.7 62.7 16.8%
Other Income 16.7 20.0 19.8%
Total Revenue 741.8 796.9 7.4%
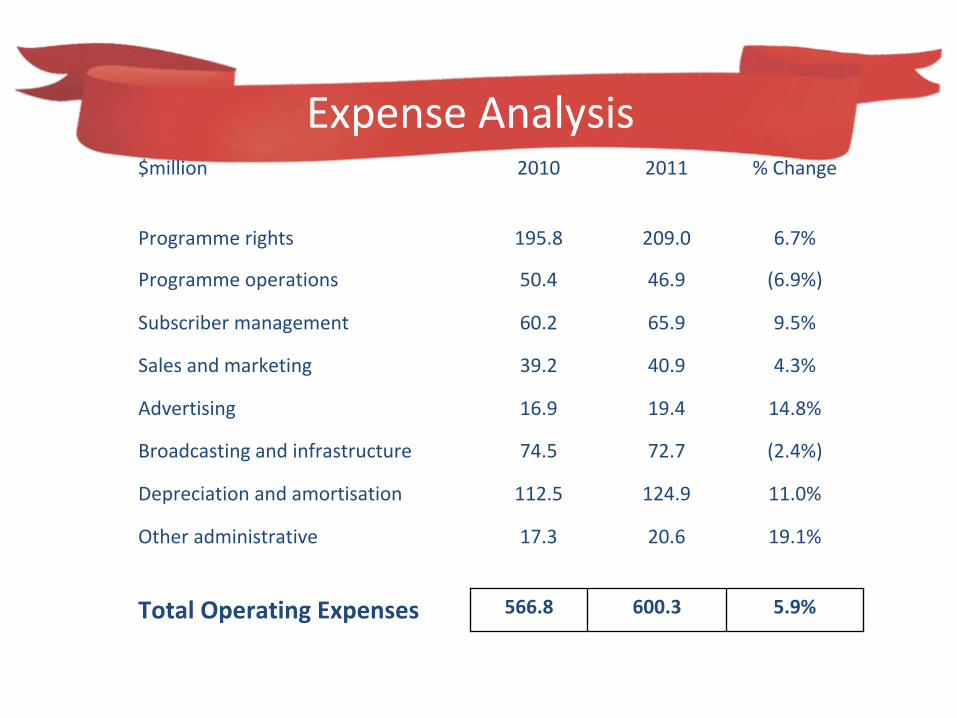
Expense Analysis$million 2010 2011 % Change
Programme rights 195.8 209.0 6.7%
Programme operations 50.4 46.9 (6.9%)
Subscriber management 60.2 65.9 9.5%
Sales and marketing 39.2 40.9 4.3%
Advertising 16.9 19.4 14.8%
Broadcasting and infrastructure 74.5 72.7 (2.4%)
Depreciation and amortisation 112.5 124.9 11.0%
Other administrative 17.3 20.6 19.1%
Total Operating Expenses 566.8 600.3 5.9%
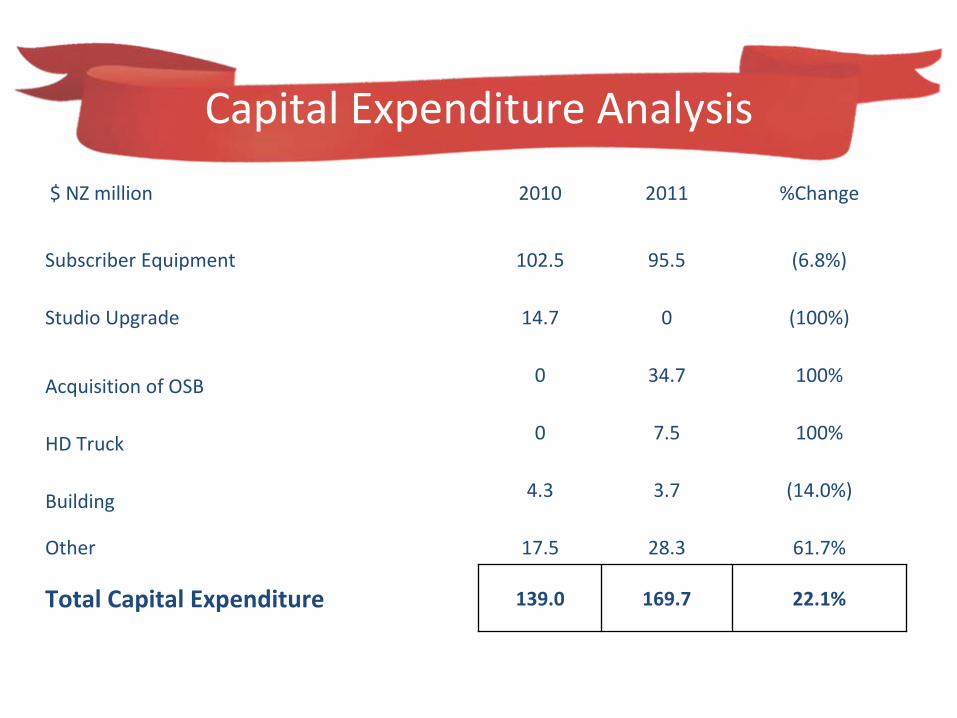
Capital Expenditure Analysis
$ NZ million 2010 2011 %Change
Subscriber Equipment 102.5 95.5 (6.8%)
Studio Upgrade 14.7 0 (100%)
Acquisition of OSB 0 34.7 100%
HD Truck 0 7.5 100%
Building 4.3 3.7 (14.0%)
Other 17.5 28.3 61.7%
Total Capital Expenditure 139.0 169.7 22.1%
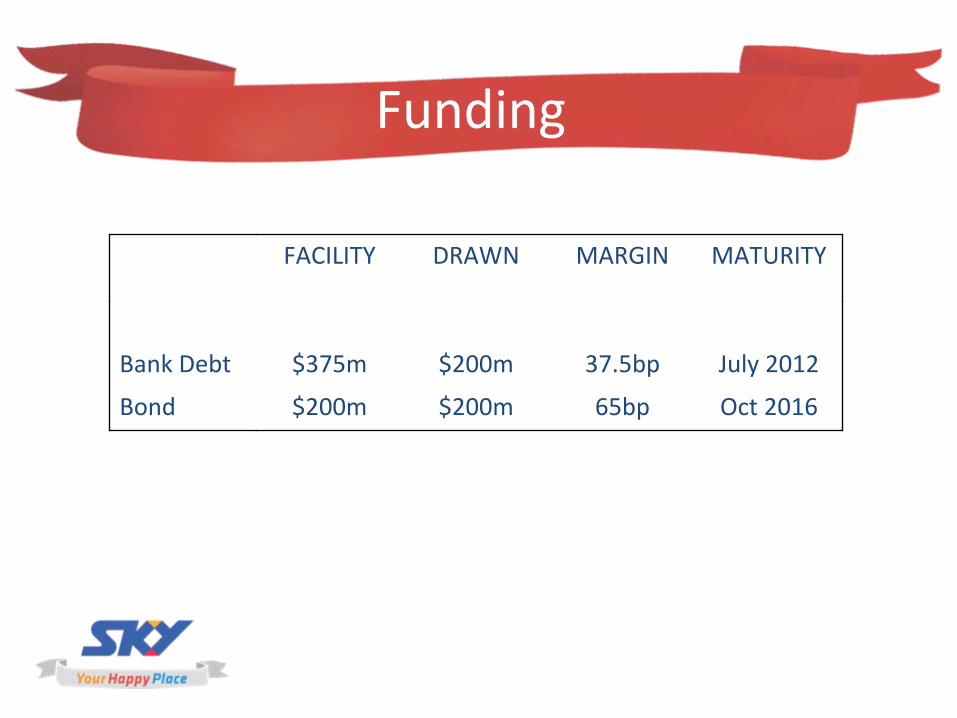
Funding
FACILITY DRAWN MARGIN MATURITY
Bank Debt $375m $200m 37.5bp July 2012
Bond $200m $200m 65bp Oct 2016
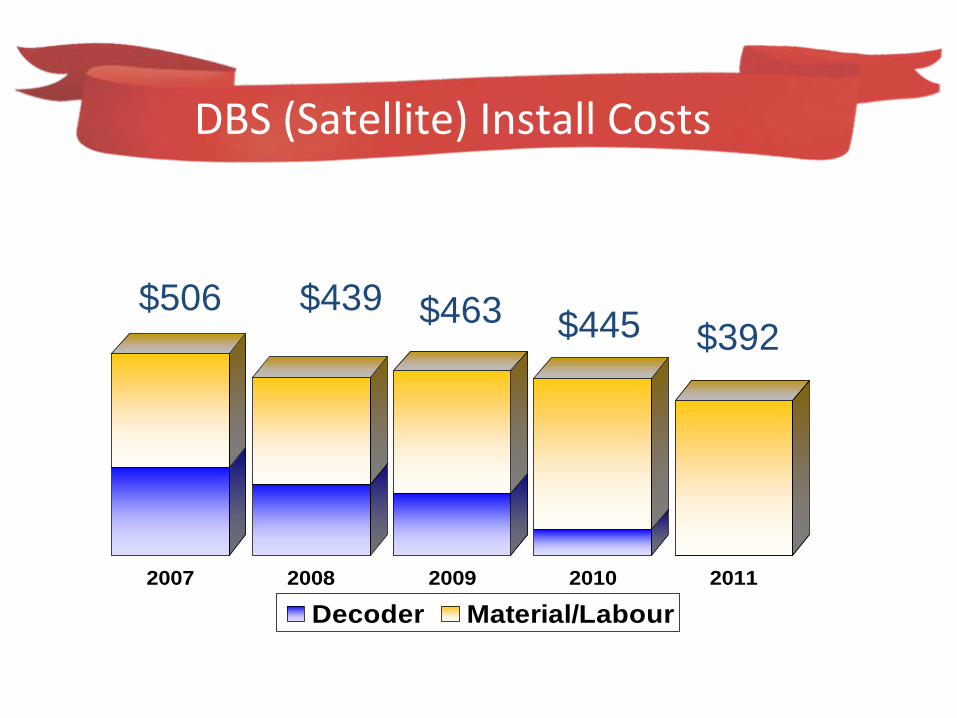
2007 2008 2009 2010 2011
Decoder Material/Labour
DBS (Satellite) Install Costs
$506 $439$445$463
$392
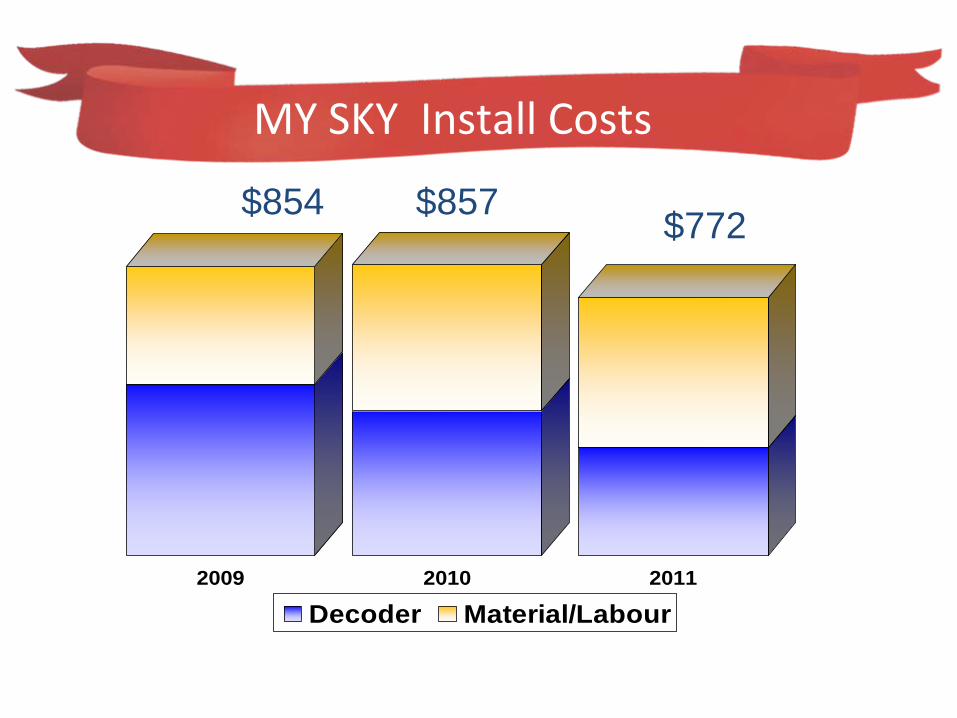
2009 2010 2011
Decoder Material/Labour
MY SKY Install Costs
$854 $857 $772
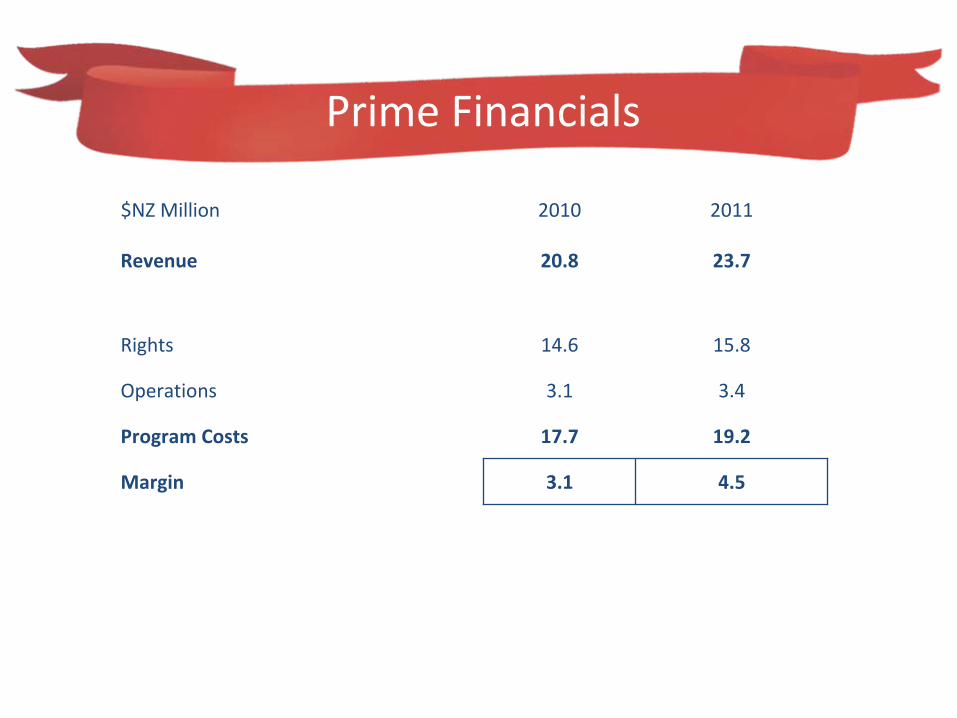
Prime Financials
$NZ Million 2010 2011
Revenue 20.8 23.7
Rights 14.6 15.8
Operations 3.1 3.4
Program Costs 17.7 19.2
Margin 3.1 4.5
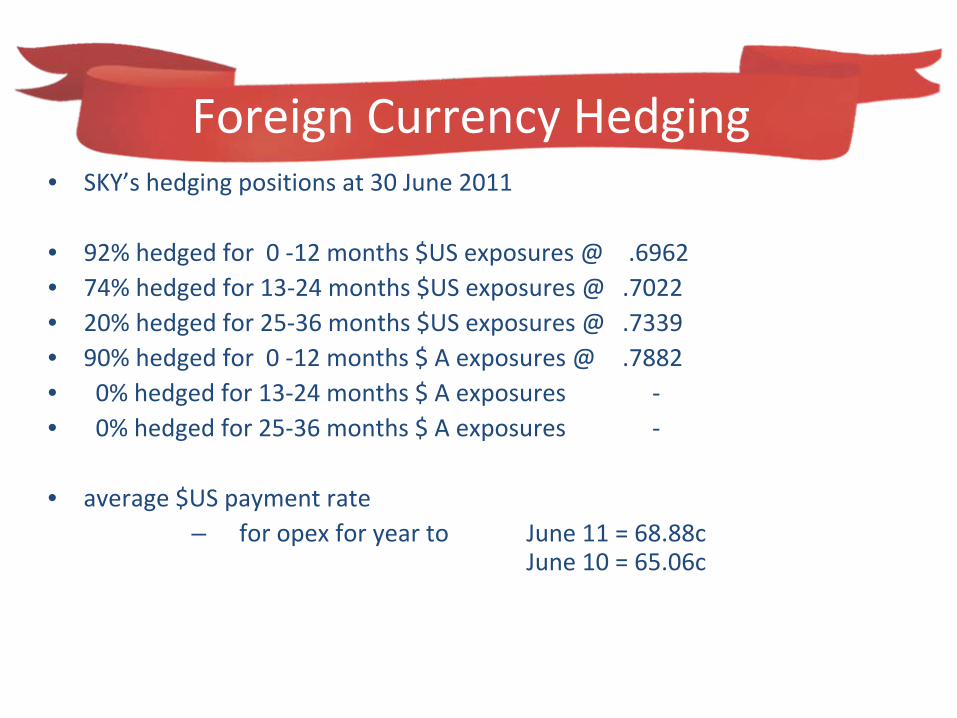
Foreign Currency Hedging• SKY’s
hedging positions at 30 June 2011
• 92% hedged for 0 ‐12 months $US exposures @
.6962• 74% hedged for 13‐24 months $US exposures @
.7022
• 20% hedged for 25‐36 months $US exposures @
.7339• 90% hedged for 0 ‐12 months $ A exposures @
.7882
• 0% hedged for 13‐24 months $ A exposures ‐
• 0% hedged for 25‐36 months $ A exposures ‐
• average $US payment rate – for opex for year to
June 11 = 68.88c
June 10 = 65.06c
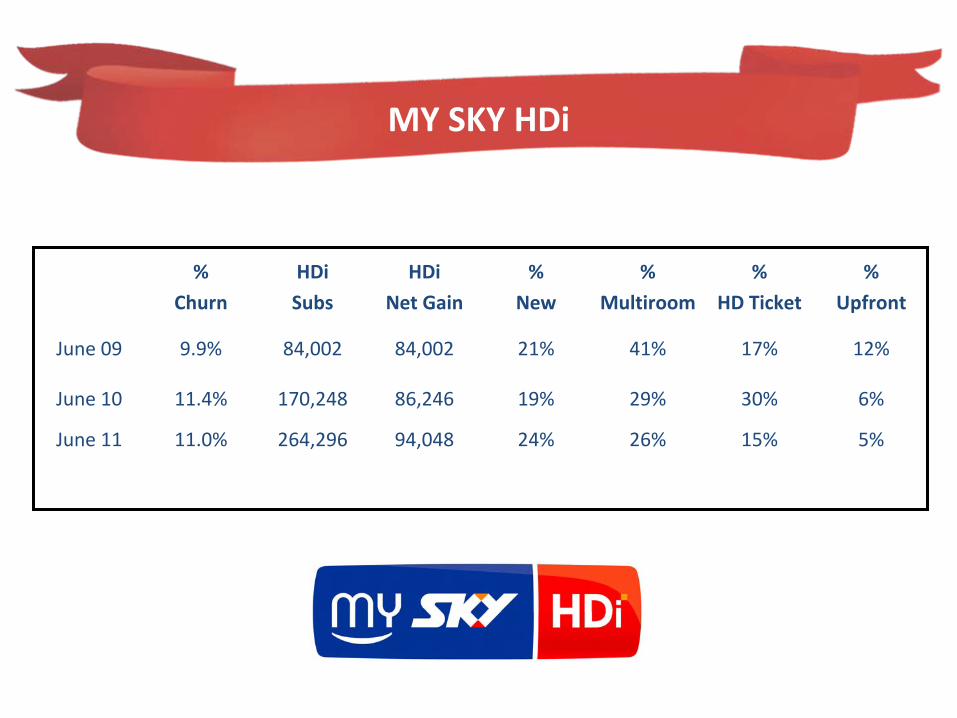
MY SKY HDi
%
Churn
HDi
Subs
HDi
Net Gain
%
New
%
Multiroom
%
HD Ticket
%
Upfront
June 09 9.9% 84,002 84,002 21% 41% 17% 12%
June 10 11.4% 170,248 86,246 19% 29% 30% 6%
June 11 11.0% 264,296 94,048 24% 26% 15% 5%

CEO
JOHN FELLET
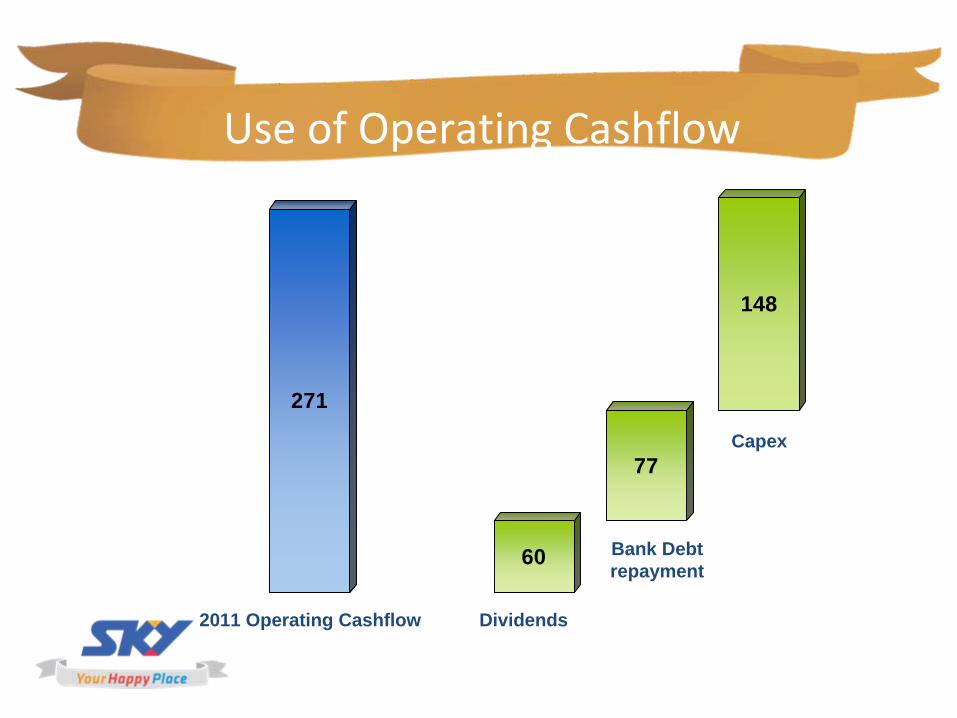
271
60
77
14820
11 O
pera
ting
Cas
hflo
w
Dep
reci
atio
nst
udio
Ban
k D
ebt
OSB
Van
s H
DU
pgra
de
HD
Lin
king
cont
ract
s
Tran
spon
der
Use of Operating Cashflow
2011 Operating Cashflow
Bank Debt repayment
Dividends
Capex
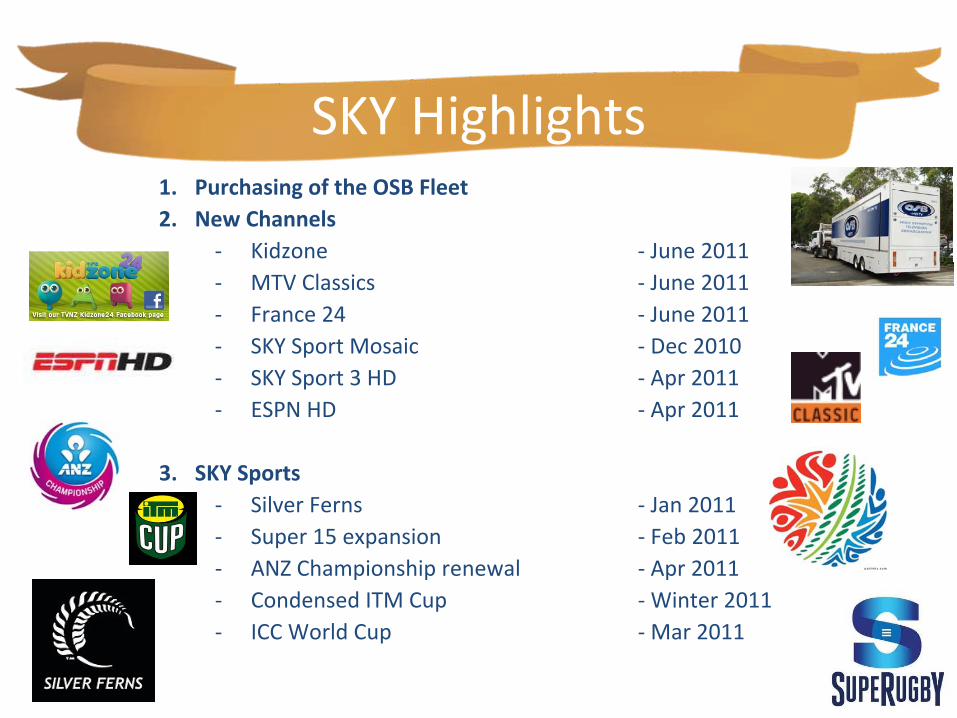
SKY Highlights1.
Purchasing of the OSB Fleet
2.
New Channels‐
Kidzone
‐
June 2011
‐
MTV Classics
‐
June 2011
‐
France 24
‐
June 2011
‐
SKY Sport Mosaic
‐
Dec 2010
‐
SKY Sport 3 HD
‐
Apr 2011
‐
ESPN HD
‐
Apr 2011
3.
SKY Sports‐
Silver Ferns
‐
Jan 2011
‐
Super 15 expansion
‐
Feb 2011
‐
ANZ Championship renewal
‐
Apr 2011
‐
Condensed ITM Cup
‐
Winter 2011
‐
ICC World Cup
‐
Mar 2011
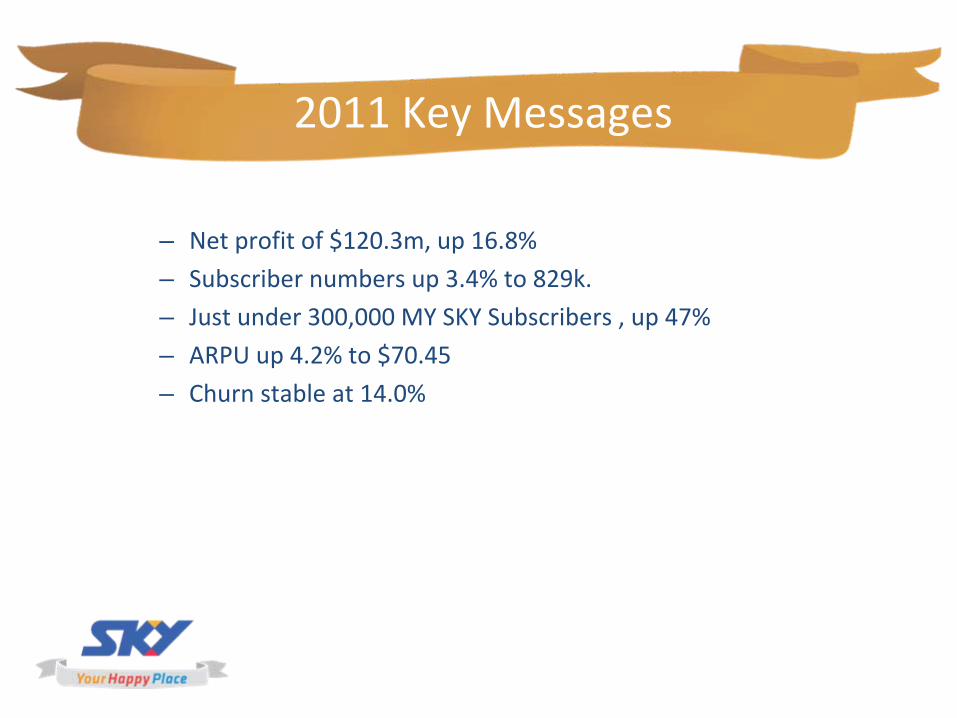
– Net profit of $120.3m, up 16.8%
– Subscriber numbers up 3.4% to 829k.
– Just under 300,000 MY SKY Subscribers , up 47%
– ARPU up 4.2% to $70.45– Churn stable at 14.0%
2011 Key Messages
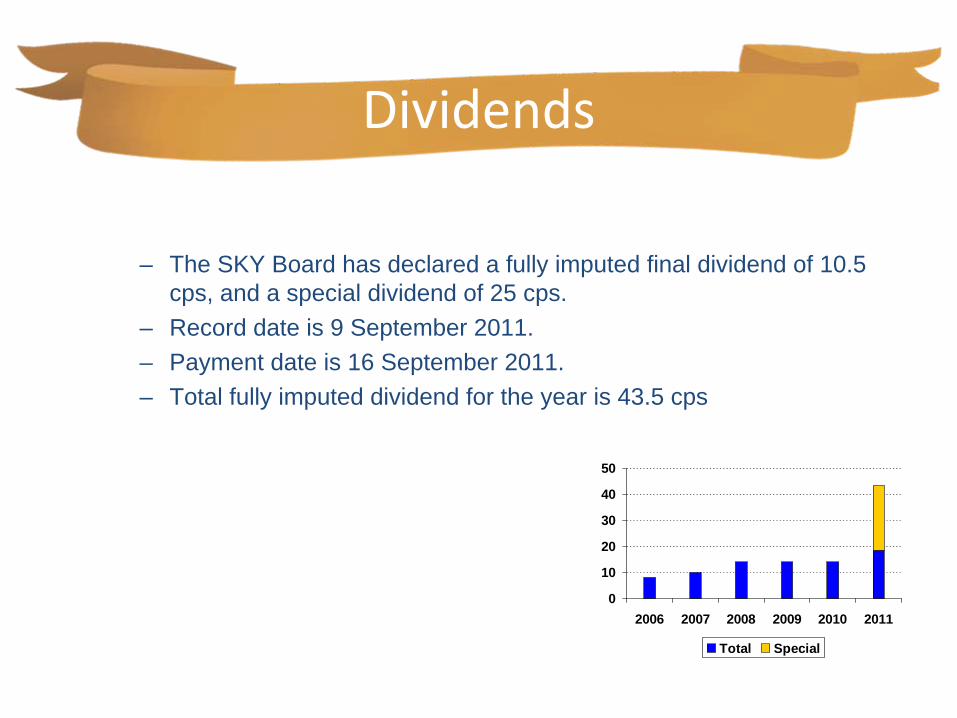
Dividends
– The SKY Board has declared a fully imputed final dividend of 10.5 cps, and a special dividend of 25 cps.
– Record date is 9 September 2011.– Payment date is 16 September 2011.– Total fully imputed dividend for the year is 43.5 cps
0
10
20
30
40
50
2006 2007 2008 2009 2010 2011
Total Special

SKY NETWORK TELEVISION ANNUAL RESULTS 2011


![Night sky photometry and spectroscopy performed … · arXiv:1304.7716v1 [astro-ph.IM] 29 Apr 2013 Night sky photometry and spectroscopy performed at the Vienna University Observatory](https://img.pdfslide.us/doc/110x75/5b9f1e6209d3f26e288c575d/night-sky-photometry-and-spectroscopy-performed-arxiv13047716v1-astro-phim.jpg)