Embed Size (px)
DESCRIPTION
S.Klimenko, LSC meeting, March 2002 Line Monitoring l line interference signal I(t) – sum of line harmonics l given a data set with time stride T and sampling rate f 0, use approximation of line interference signal I(t) in the form we assume that the harmonic’s amplitudes a n and linear functions n (t) do not change much during time T (line width
Citation preview

S.Klimenko, LSC meeting, March 2002
LineMonitorSergey Klimenko
University of Florida
Other contributors: E.Daw (LSU), A.Sazonov(UF), J.Zweizig (Caltech) Outline
IntroductionLine Monitor
BasicsDesign & ImplementationInput & OutputUsage & Performance
ConclusionExamples
LIGO-G020109-00-Z

S.Klimenko, LSC meeting, March 2002
E4 L1:LSC-AS_Q Lines
Introduction Narrow lines in the LIGO detector output:
mechanical (violin modes, mirror modes, stacks&suspensions) environmental (power (60Hz and harmonics), generators&equipment)
Line Monitor is a tool to monitor parameters of selected line
frequencyamplitude phase
to study narrow lines (LM is a main tool for LNI group)

S.Klimenko, LSC meeting, March 2002
Line Monitoring
line interference signal I(t) – sum of line harmonics given a data set with time stride T and sampling rate
f0 , use approximation of line interference signal I(t) in the form
we assume that the harmonic’s amplitudes an and linear functions n(t) do not change much during time T (line width << 1/T)
to monitor lines we estimate the I(t) signal (or an, f andn) for sequence of data strides
The I(t) signal is estimated using the QMLR algorithm
n
nnn
nn nftatatI )2cos())(cos()(

S.Klimenko, LSC meeting, March 2002
The QMLR Algorithm
basis of orthogonal Fourier functions: Fk(n)=e-2n k/N, k,n = 0,..,N-1; ij=n Fi(n) Fj(n)
for sampled harmonic signal L(n)=a e-i2n f/fo, f - harmonic signal frequencyfo - sampling rate
L(n) ~Fk(n) - one of the basis Fourier functions, if f /fo=k/N estimating of I(t) {Lk(n)} .
resample data with new sampling rate fs: fs /f = int(fo /f)+1
select data sample length: N = k fs /f , k-integer estimated interference signal in F domain: IF = k Lk= k akFk
S.Klimenko, LSC meeting, March 2002
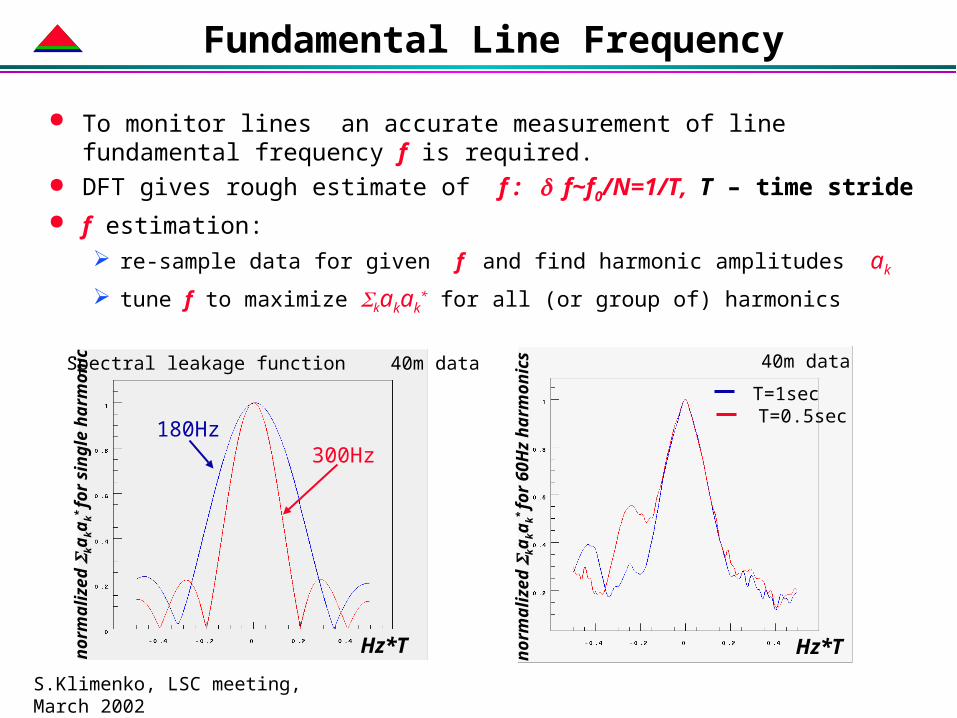
Fundamental Line Frequency
To monitor lines an accurate measurement of line fundamental frequency f is required.
DFT gives rough estimate of f : f~f0/N=1/T, T – time stride f estimation:
re-sample data for given f and find harmonic amplitudes ak
tune f to maximize kakak* for all (or group of) harmonics
Spectral leakage function 40m data
Hz*T
norm
aliz
ed
kaka
k* fo
r si
ngle
har
mon
ic
180Hz300Hz
norm
aliz
ed
kaka
k* fo
r 60
Hz
harm
onic
s
40m data
Hz*T
T=1sec T=0.5sec
S.Klimenko, LSC meeting, March 2002
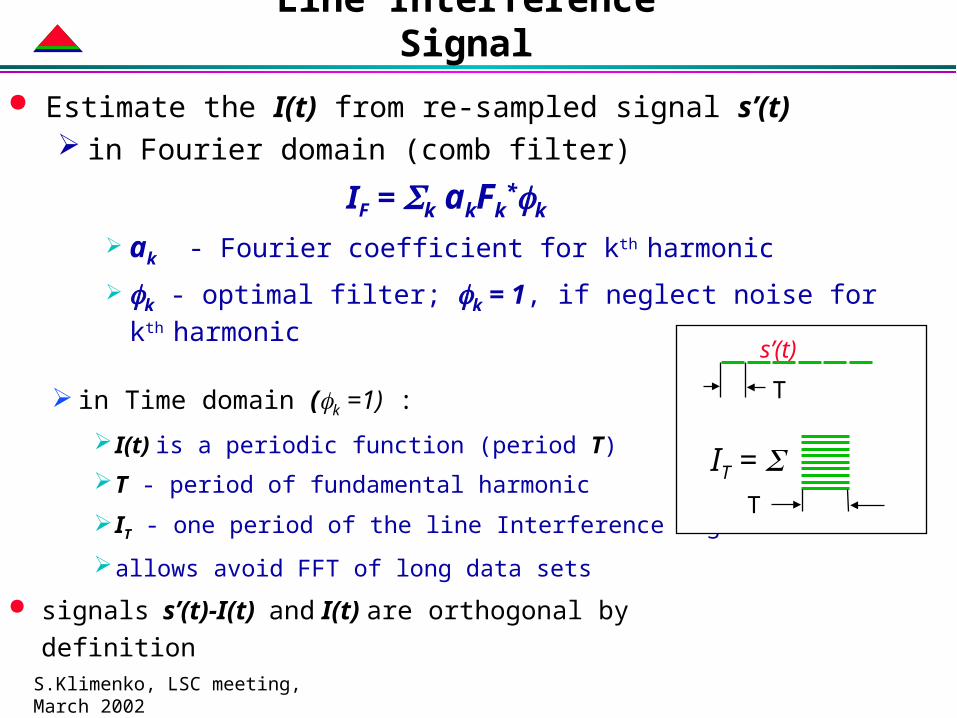
Line Interference Signal
in Time domain (k =1) : I(t) is a periodic function (period T)T - period of fundamental harmonic IT - one period of the line Interference signal allows avoid FFT of long data sets
signals s’(t)-I(t) and I(t) are orthogonal by definition
s’(t)T
IT = T
Estimate the I(t) from re-sampled signal s’(t) in Fourier domain (comb filter)
IF = k akFk*k
ak - Fourier coefficient for kth harmonic k - optimal filter; k = 1, if neglect noise for kth
harmonic

S.Klimenko, LSC meeting, March 2002
Design & Implementation LineFilter - distributed with DMT shared library
(ROOT) apply(s) – process time series s and store trend data
fScan(s) – estimate fundamental frequency Interference(s) - estimate the Line Interference Signal
data access functions DumpTrend(file) – dump trend data into file LoadTrend(file) - load data from trend file to LineFilter
object getTrend(data) - access specified data in the LineFilter
database
LineMonitor – a DMT monitorinput
parametersLM constructor:
list of LineFilter objects
Process Data Loopinput dataonline or offline output

S.Klimenko, LSC meeting, March 2002
Input & Output
LineMonitor Input configuration parameters
command line (for single line) configuration file (for many lines or if run by DMT process manager)
data for ONE selected channel from online buffer OR frame files to monitor several channels, several monitors should be
lunched LineMonitor Output
trend data (one file/line): a(t), (t), f(t), SNR(t), …. can be red and processed in ROOT using LineFilter access functions
data to the DMT viewer html summary

S.Klimenko, LSC meeting, March 2002
html summary
monitored by LM-specified in conf. file-trend data produced-serve to DMT viewer
detected by LM- no monitoring- no trend data- no DMT viewer
Legend in the end of the page is
available

S.Klimenko, LSC meeting, March 2002
LineMonitor Parameters useage: LineMonitor [list of parameters]
-c <channel name> [required] -H <output html file name> [synthesized] -l <lock condition> (*:Both_arms_locked for IFO chan.) -f <seed frequency (Hz)> [60.] -t <time stride (s)> [1.] -I <filter ID (-1/0/1)> [1] -n <number of stride subdivisions> [1] -s <no frequency scan> -F <first harmonic> [1] -L <last harmonic> [1] -S <skip harmonics> [0] -R <limit on signal to noise ratio> [2.] -d <dump trend data every n strides> n=[1] -b <length of the DMTVIEWER buffer> length=[1024] -W <select number of decimation by 2 steps> -i <input config file> [optional] (required to monitor
many lines)
S.Klimenko, LSC meeting, March 2002
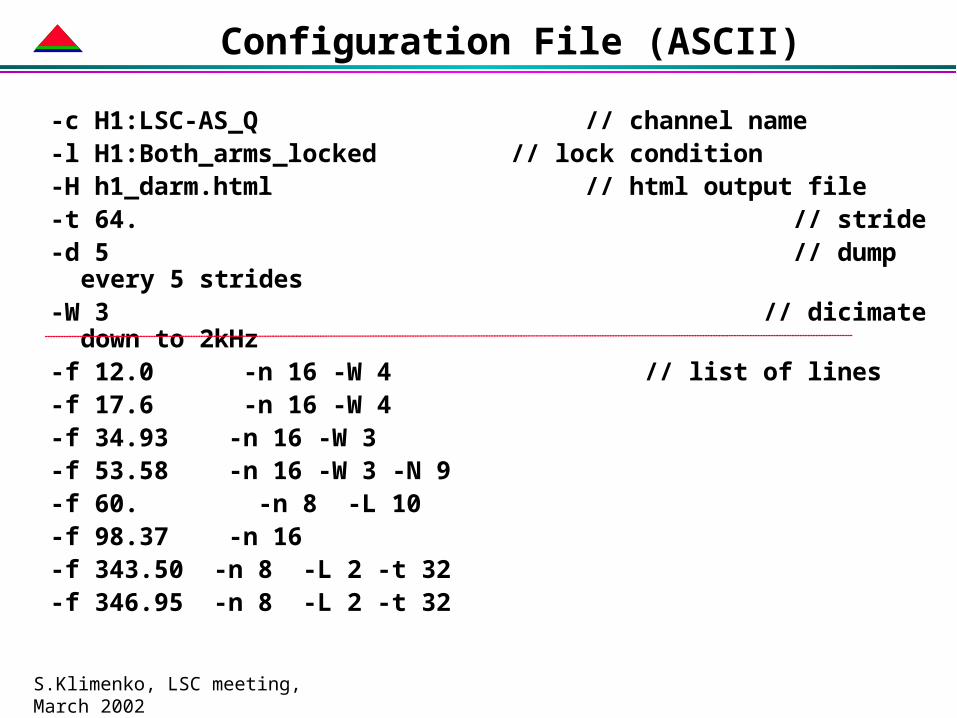
Configuration File (ASCII)
-c H1:LSC-AS_Q // channel name-l H1:Both_arms_locked // lock condition-H h1_darm.html // html output file-t 64. // stride-d 5 // dump every 5 strides-W 3 // dicimate down to 2kHz-f 12.0 -n 16 -W 4 // list of lines-f 17.6 -n 16 -W 4-f 34.93 -n 16 -W 3-f 53.58 -n 16 -W 3 -N 9 -f 60. -n 8 -L 10-f 98.37 -n 16-f 343.50 -n 8 -L 2 -t 32 -f 346.95 -n 8 -L 2 -t 32

S.Klimenko, LSC meeting, March 2002
Usage & Performance LineMonitors run by process manager
predefined list of channels, lines & parametersmax 3 LM/interferometer, total 9 monitorschannels: X:LSC-AS_Q, X:LSC-CARM_CTRL, X:IOO-MC_F
still working to define the “standard” configuration LineMonitors for expert use
executable is distributed with the DMT customized set of lines & parameters user defined input&output
Help If to call LineMonitor without parameters, help is printed
out. Performance:
one monitor consumes 2%+0.5%/line of one CPU on sand or delaronde.

S.Klimenko, LSC meeting, March 2002
Conclusion monitoring tool
stationarity of line noise monitoring of violin modes & power lines run standard configurations for E & S runs
investigation tool characterization of line noise (including
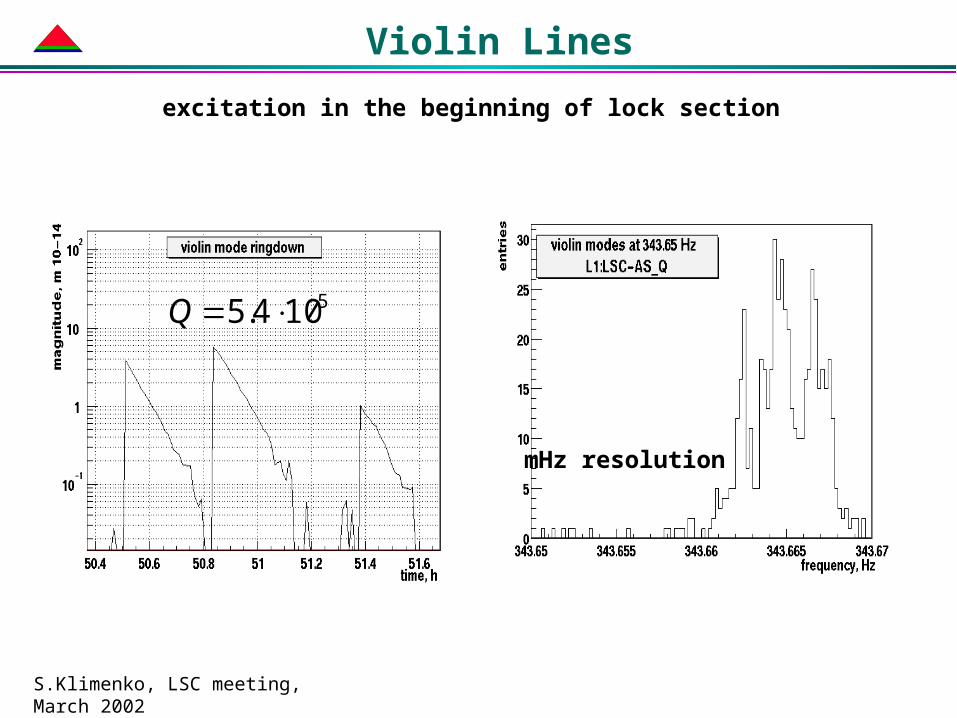
classification of lines) accurate measurement of line frequencies (~mHz) measurement of Q of violin modes
development in first approximation completed add option to write some trend data to database no plans for GUI development
documentation publish LIGO note
S.Klimenko, LSC meeting, March 2002
Violin Lines
5104.5 Q
mHz resolution
excitation in the beginning of lock section
S.Klimenko, LSC meeting, March 2002
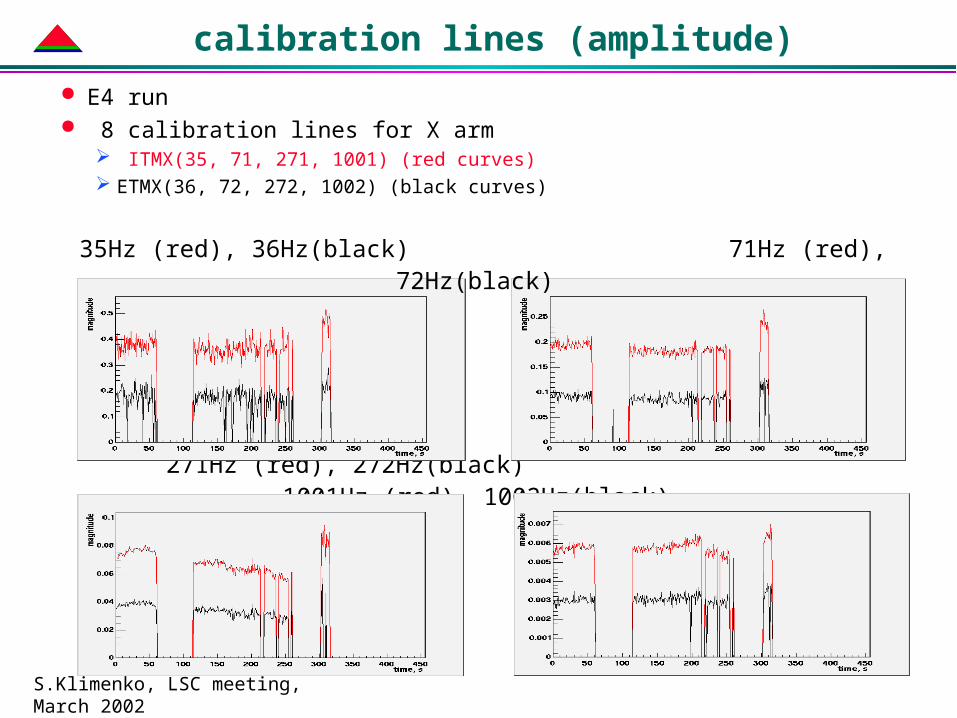
calibration lines (amplitude) E4 run 8 calibration lines for X arm
ITMX(35, 71, 271, 1001) (red curves) ETMX(36, 72, 272, 1002) (black curves)
271Hz (red), 272Hz(black) 1001Hz (red), 1002Hz(black)
35Hz (red), 36Hz(black) 71Hz (red), 72Hz(black)
S.Klimenko, LSC meeting, March 2002
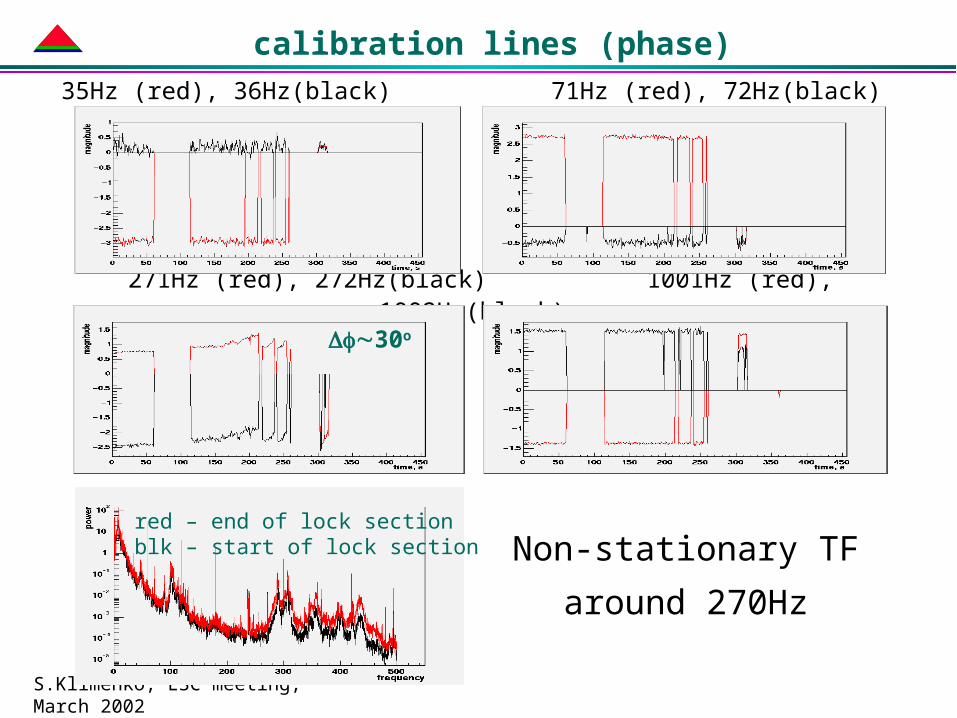
calibration lines (phase)
Non-stationary TFaround 270Hz
271Hz (red), 272Hz(black) 1001Hz (red), 1002Hz(black)
35Hz (red), 36Hz(black) 71Hz (red), 72Hz(black)
red – end of lock sectionblk – start of lock section
30o
S.Klimenko, LSC meeting, March 2002
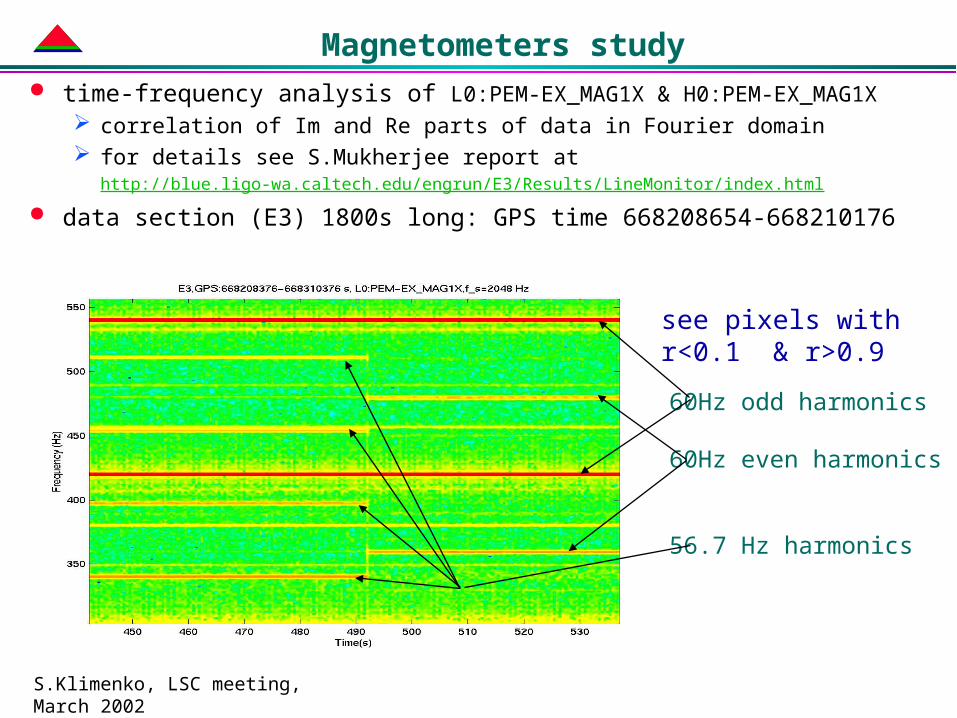
Magnetometers study time-frequency analysis of L0:PEM-EX_MAG1X & H0:PEM-EX_MAG1X
correlation of Im and Re parts of data in Fourier domain for details see S.Mukherjee report at
http://blue.ligo-wa.caltech.edu/engrun/E3/Results/LineMonitor/index.html data section (E3) 1800s long: GPS time 668208654-668210176
see pixels with r<0.1 & r>0.9
60Hz odd harmonics
60Hz even harmonics
56.7 Hz harmonics

S.Klimenko, LSC meeting, March 2002
LineMonitor results close look at L0:PEM-EX_MAG1X with the Line Monitor
60Hz even harmonics
2
468
60Hz odd harmonics
1
537
56.757Hz harmonics1
2345
0.0504Hz modulation
119.98Hz
119.88Hz

S.Klimenko, LSC meeting, March 2002
LineMonitor results (continue)
What happened? 2 sets of power lines – power mains & compressor at 212sec motor was switched off - 56.76Hz lines shifted to
59.94Hz amplitudes of 56.76Hz & 59.94Hz harmonics are exactly the same
does it affect the interferometer channel?
T<212sT>212s 2x56.76
4x56.76
2x59.94
4x59.94