Embed Size (px)
DESCRIPTION
For eFolio
Citation preview
Skittles Data Analysis and Probability
Skittles candy makers say a bag contains the following candies: Green: 19.7%, Yellow: 19.5%, Orange: 20.2%, Red: 20%, and Purple: 20.6% Learning Goals: Collect data through observations Represent data using tables and graphs Use data for a variety of purposes Determine probability Enter data into a spreadsheet Use ratios and proportions to represent relationships among quantities Explain and justify their thinking Questions to be answered: Did your bag of Skittles come close to the candy maker prediction? Did all the bags of Skittles come close to the candy maker prediction?
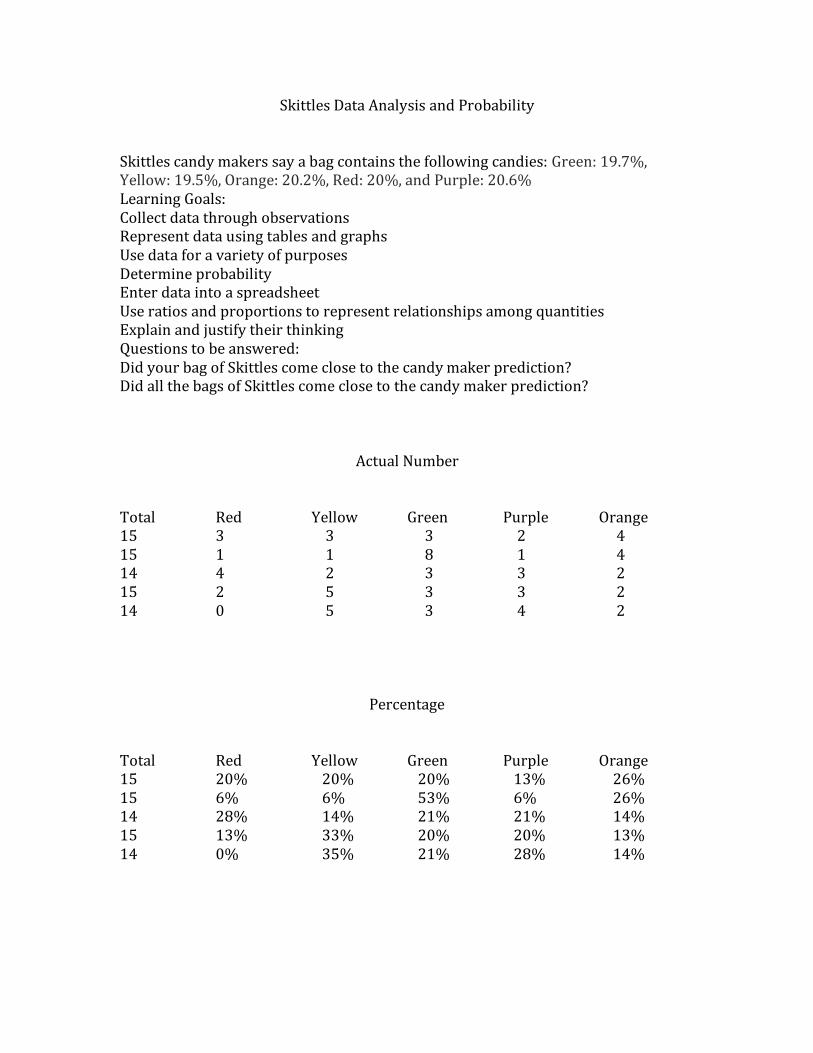
Actual Number
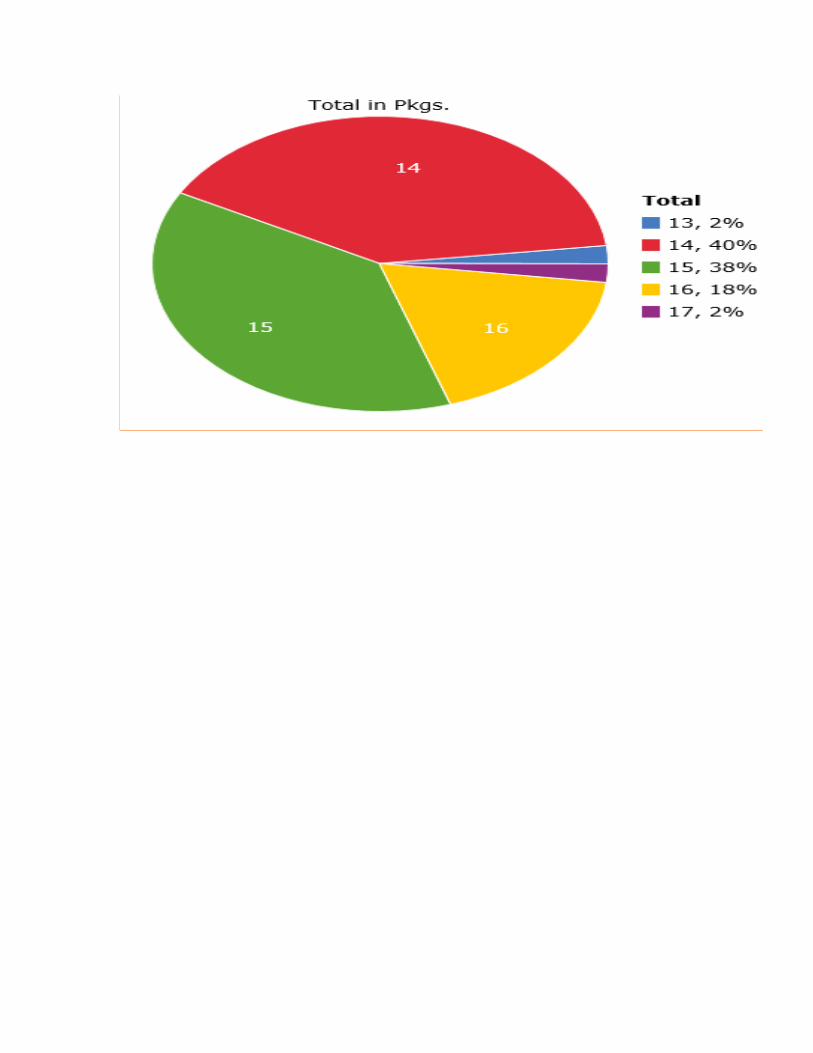
Total Red Yellow Green Purple Orange 15 3 3 3 2 4 15 1 1 8 1 4 14 4 2 3 3 2 15 2 5 3 3 2 14 0 5 3 4 2
Percentage Total Red Yellow Green Purple Orange 15 20% 20% 20% 13% 26% 15 6% 6% 53% 6% 26% 14 28% 14% 21% 21% 14% 15 13% 33% 20% 20% 13% 14 0% 35% 21% 28% 14%


![Analysis, Probability, ' }u Çv o] }v NONLOCAL OPERATORSNonlocalOperators Analysis, Probability, Geometry and Applications CenterforInterdisciplinaryResearch(ZiF),Bielefeld July9–14,2012](https://img.pdfslide.us/doc/110x75/5ee058ebad6a402d666b8c35/analysis-probability-u-v-o-v-nonlocal-operators-nonlocaloperators-analysis.jpg)