Embed Size (px)
Citation preview
SkillVis: A Visualization Tool for Boxing Skill Assessment
Hubert P. H. Shum∗
Northumbria UniversityHe Wang†
University of LeedsEdmond S. L. Ho‡
Hong Kong Baptist UniversityTaku Komura§
Edinburgh University
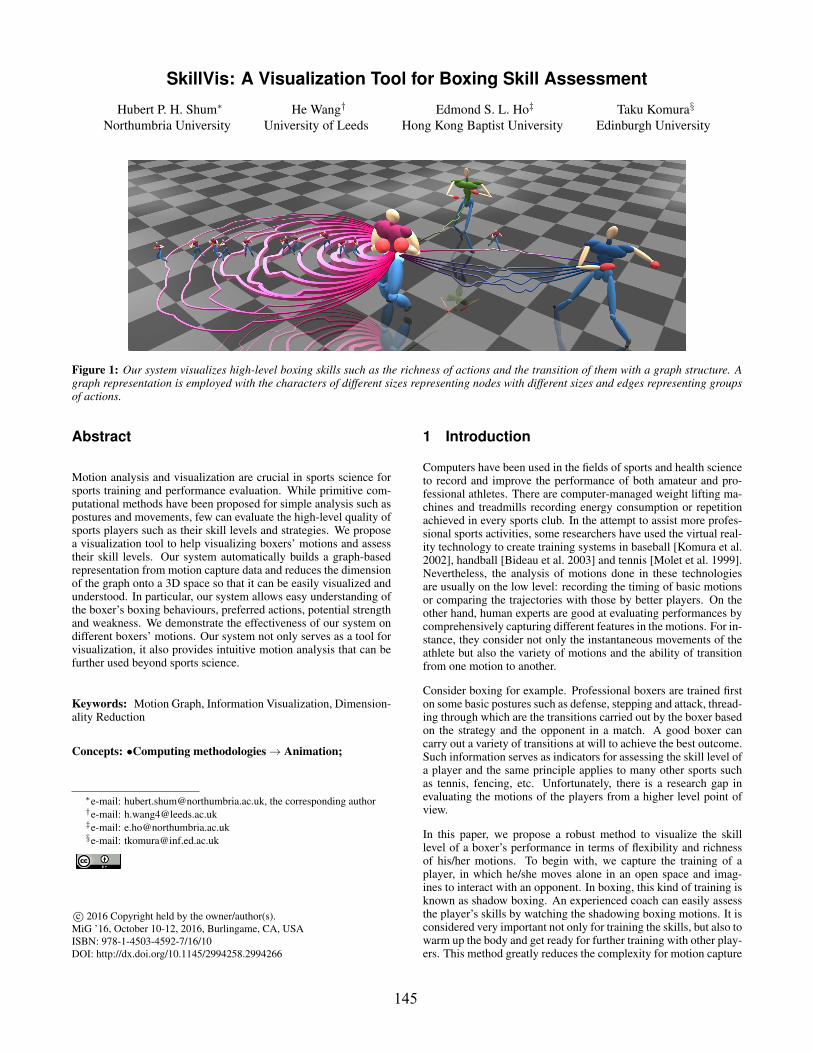
Figure 1: Our system visualizes high-level boxing skills such as the richness of actions and the transition of them with a graph structure. Agraph representation is employed with the characters of different sizes representing nodes with different sizes and edges representing groupsof actions.
Abstract
Motion analysis and visualization are crucial in sports science forsports training and performance evaluation. While primitive com-putational methods have been proposed for simple analysis such aspostures and movements, few can evaluate the high-level quality ofsports players such as their skill levels and strategies. We proposea visualization tool to help visualizing boxers’ motions and assesstheir skill levels. Our system automatically builds a graph-basedrepresentation from motion capture data and reduces the dimensionof the graph onto a 3D space so that it can be easily visualized andunderstood. In particular, our system allows easy understanding ofthe boxer’s boxing behaviours, preferred actions, potential strengthand weakness. We demonstrate the effectiveness of our system ondifferent boxers’ motions. Our system not only serves as a tool forvisualization, it also provides intuitive motion analysis that can befurther used beyond sports science.
Keywords: Motion Graph, Information Visualization, Dimension-ality Reduction
Concepts: •Computing methodologies→ Animation;
∗e-mail: [email protected], the corresponding author†e-mail: [email protected]‡e-mail: [email protected]§e-mail: [email protected]
c© 2016 Copyright held by the owner/author(s).MiG ’16, October 10-12, 2016, Burlingame, CA, USAISBN: 978-1-4503-4592-7/16/10DOI: http://dx.doi.org/10.1145/2994258.2994266
1 Introduction
Computers have been used in the fields of sports and health scienceto record and improve the performance of both amateur and pro-fessional athletes. There are computer-managed weight lifting ma-chines and treadmills recording energy consumption or repetitionachieved in every sports club. In the attempt to assist more profes-sional sports activities, some researchers have used the virtual real-ity technology to create training systems in baseball [Komura et al.2002], handball [Bideau et al. 2003] and tennis [Molet et al. 1999].Nevertheless, the analysis of motions done in these technologiesare usually on the low level: recording the timing of basic motionsor comparing the trajectories with those by better players. On theother hand, human experts are good at evaluating performances bycomprehensively capturing different features in the motions. For in-stance, they consider not only the instantaneous movements of theathlete but also the variety of motions and the ability of transitionfrom one motion to another.
Consider boxing for example. Professional boxers are trained firston some basic postures such as defense, stepping and attack, thread-ing through which are the transitions carried out by the boxer basedon the strategy and the opponent in a match. A good boxer cancarry out a variety of transitions at will to achieve the best outcome.Such information serves as indicators for assessing the skill level ofa player and the same principle applies to many other sports suchas tennis, fencing, etc. Unfortunately, there is a research gap inevaluating the motions of the players from a higher level point ofview.
In this paper, we propose a robust method to visualize the skilllevel of a boxer’s performance in terms of flexibility and richnessof his/her motions. To begin with, we capture the training of aplayer, in which he/she moves alone in an open space and imag-ines to interact with an opponent. In boxing, this kind of training isknown as shadow boxing. An experienced coach can easily assessthe player’s skills by watching the shadowing boxing motions. It isconsidered very important not only for training the skills, but also towarm up the body and get ready for further training with other play-ers. This method greatly reduces the complexity for motion capture
145
due to occlusion and collision, and has shown to be effective in oursystem for detailed player’s skill evaluation.
We use the techniques and data structures in computer animationto process the motion data. The captured motion data are first au-tomatically segmented into shorter clips with meaningful contextsand categorized into groups. Next, our system automatically gen-erates a hierarchical motion graph structure known as Fat Graph,which uses nodes representing the postures of the body and edgesrepresenting the motion groups. With dimensionality reductiontechniques, this Fat Graph can be visualized on a 3D space to eval-uate the performance of the player. The transition capability of theplayer are visualized by the connectivity of the nodes, where therichness and preference of the motions is visualized by the edgesin the graph. With the proposed algorithm, it is easy to identify theperformance quality and potential problems of a player.
We demonstrate how we can easily evaluate the skills of differentboxers with our visualization system, as shown in Figure 1. Whilewe use boxing as our target sport in this paper due to its complexmoves and strategic nature, our system can be applied to most activ-ities that require swiftness, flexibility and creativity, such as tennis,fencing and basketball.
The rest of this paper is organized as follows. Section 2 discussesother related works about motion analysis and dimensionality re-duction. Section 3 provides an overview of our system. In Section 4and 5, we explain the algorithms to organize captured motion witha graph structure, and visualize generated graph. Related experi-ments can be found in Section 6. We conclude and provide somediscussion for our proposed method in Section 7.
2 Related Work
Visualization of the skills of athletes, and hence helping them toimprove, is a field that has not been fullly explored in the field ofsports science. Existing research [Yeadon 1990; Yeadon ] mainlyfocuses on how a motion will appear when parameters of the mo-tion or the body are changed. For example, Yeadon [Yeadon 1990;Yeadon ] has done research on how the diving and somersaults mo-tions change when the motions are launched at different timings byusing physical simulation. Although such tools are useful for theplayers to interactively visualize possible results under different pa-rameters, they can only evaluate the performance of the sports thatdo not require complex maneuvers and strategies, such as jumping,high jumping, sky jumping, or somersaults.
In many sports games, the performance depends not only on phys-ical factors such as velocity, power and strength, but also on flex-ibility to switch from one motion to another and richness of theplayer’s motions. This high-level information has not been used tovisualize the skills of the player in previous research. In this re-search, we combine the approaches of motion graph [Arikan andForsyth 2002; Lee et al. 2002; Kovar et al. 2002; Lau and Kuffner2005; Kwon and Shin 2005] and dimensionality reduction [Gro-chow et al. 2004; Shin and Lee 2006] to visualize high-level skillsinformation of the athletes for the skill assessments.
Statistical approaches for analyzing the connectivity of differentmovements have been developed in the area of computer anima-tion and pattern recognition. The Motion Graph approach [Arikanand Forsyth 2002; Lee et al. 2002; Kovar et al. 2002; Min and Chai2012; Beaudoin et al. 2008; Arikan et al. 2003; Li et al. 2002] isa method to interactively reproduce continuous motions based ona graph generated from captured motion data. Reitsma and Pol-lard [2007] compared different motion graph techniques compre-hensively. Heck et al. [2007] further parametrized the motion spaceto control how the motions are being generated by blending samples
in the motion graph. Such an approach can be used for interactivecharacter control such as those in computer games. When it comesto graph construction, [Min and Chai 2012; Beaudoin et al. 2008]are the most similar ones to our method. Min et al. [2012] groupedsimilar postures and transitions into nodes and edges. Their focusis the motion variety of synthesized motions so they used genera-tive models to fit the posture and motion data. Our focus is aboutskill visualization through the analysis of postures and motions sowe can afford simpler and faster methods for analysis. Beaudoinet al. [2008] cluster postures first then find motion motifs by con-verting the motion matching task into a string matching problem.Their priority is to find motifs that are representative while our fo-cus is to visualize motion details and statistics to help people toassess the skills. Xia et al.[2015] constructed a series of local mix-tures of autoregressive models (MAR) for modeling the style vari-ations among different motions for real-time style transfer. Theydemonstrated style-rich motions can be generated by combiningtheir method and motion graph.
Since the Motion Graph produces a lot of edges and nodes with-out any context, it becomes difficult to control generated motion asthe user wishes. Safonova and Hodgins [2007] optimized the graphstructure by combining motion graph and interpolation techniquesto improve the performance. On the other hand, works to resolvethis problem by introducing a hierarchical structure have been pro-posed in [Lau and Kuffner 2005; Kwon and Shin 2005; Shin and Oh2006]. These approaches add topological structures into the contin-uous unstructured data so that the motion synthesis can be done ata higher level. In a sport like boxing, it is possible to create a mo-tion graph of semantic actions such as attack and defence, which isknown as the action-level motion graph [Shum et al. 2008; Shumet al. 2012]. A recent work by Hyun et al. [2016] proposed Mo-tion Grammars to specify how character animations are generatedby high-level symbolic description. Such an approach can be usedwith existing animation systems which are built based on motiongraphs. Ho and Komura [2011] built a finite state machine (FSM)based on Topology Coordinates [Ho and Komura 2009] for synthe-sizing two-character close interactions. The sparse graph structurecan be used for controlling the movement of virtual wrestlers incomputer games. The purpose of these approaches, however, ismotion generation rather than the visualization of the player’s skill.
In our research, we adapted a hierarchical motion graph structurecalled the Fat Graph [Shin and Oh 2006] on the action level to an-alyze the connectivity and the variety of a captured motion set. Ina fat graph, similar nodes are grouped together as fat nodes, andsimilar edges are grouped as fat edges, allowing better organiza-tion of motion data. The filtered motion graph is a variation ofthe Fat Graph, in which temporal relationship between poses areconsidered [Plantard et al. 2016b]. Such a structure, however, istargeted for motion reconstruction and analysis instead of visual-ization [Plantard et al. 2016a].
Dimensionality reduction methods have been proposed to visualizethe overall structure of captured motions. For example, Grochow etal [Grochow et al. 2004] proposed a method to project the 3D mo-tions of the human onto a 2D plane, and further reconstruct 3D mo-tions by mapping arbitrary points from the 2D plane back onto 3Djoint space. PCA [Shin and Lee 2006] and ISOMAP [Tenenbaumet al. ; Shum et al. 2010] are proposed to map the motions onto2D planes. Due to the high variation of human motion, local PCAthat considers only a relevant subset of the whole motion databasein order to generate a locally linear space is proposed [Shum et al.2013; Ho et al. 2013]. One can generate motions from arbitrarypoints on the plane by interpolating the postures of the original mo-tion. Meanwhile, non-linear methods [Lawrence 2004; Wang et al.2006] and Deep Learning [Holden et al. 2016] have also been usedto reduce the dimensionality of motions. The Gaussian Process [Liu
146
et al. 2016] and the mixture of Gaussian Processes [Liu et al. 2016]can be used to represent a set of human postures with a small num-ber of Gaussian parameters. However, such methodologies did nottake into the account the connectivity structure of the motions. Weapply dimensionality reduction to our graph structure to visualizethe connectivity structure of captured motions on a 2D plane.
3 System Overview
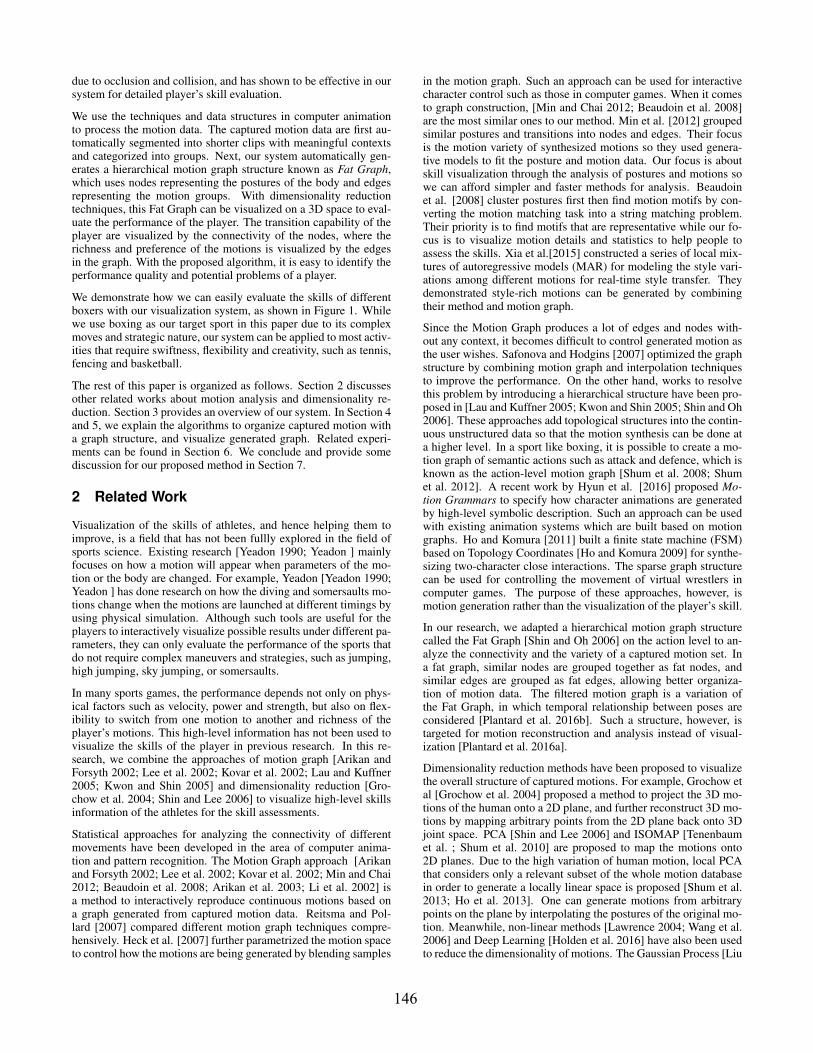
The system can be divided into two parts as shown in Figure 2:the motion organization system and the visualization system. Themotion organization system captures, analyze and organizes themotion of a player using motion segmentation and motion graphtechniques. The visualization system prepares graph layout by pro-jecting entities to appropriate 2D position using dimensionality re-duction techniques, and renders the resultant graph with interactivefunctionalities.
Figure 2: The system is divided into the motion organization sys-tem and the visualization system.
4 Motion Organization System
The motion organization system first captures the motion requiredfor analysis using motion capture systems. Then, it segments thelong sequence of motion into meaningful parts, which are used asbuilding blocks of a motion graph. The system analyzes the simi-larity of these motion segments and constructs a Fat Graph structurethat can be used to evaluate the skill level of the subject.
4.1 Motion Capture
The proposed algorithm can be applied to most activities that re-quire swiftness, flexibility and creativity. For interactive gameswith multiple players, it would be the best to capture the motionof all players and evaluate them individually. However, even withthe state-of-the-art technology, capture motions of multiple play-ers remains difficult due to occlusion and collision among players.Therefore, we proposed to capture the training motion of the play-ers, in which the player moves alone in an open area, imagining tointeract with an opponent.
In boxing or any other martial arts, there is a practice called“shadow boxing”. The boxer imagines another boxer standing infront of him/her and repeats the techniques that he/she has beenpracticing. The boxer launches not only motions such as punch-ing, but also defence, stepping, and the consecutive combination ofall such motions. There are similar practice methods in basketballand soccer as well. The players can use the ball to conduct varioustechniques in the court imagining that their opponents are trying totake away the ball from him/her. The players thus perform variousmotions to keep the ball and trick the imaginary opponent.
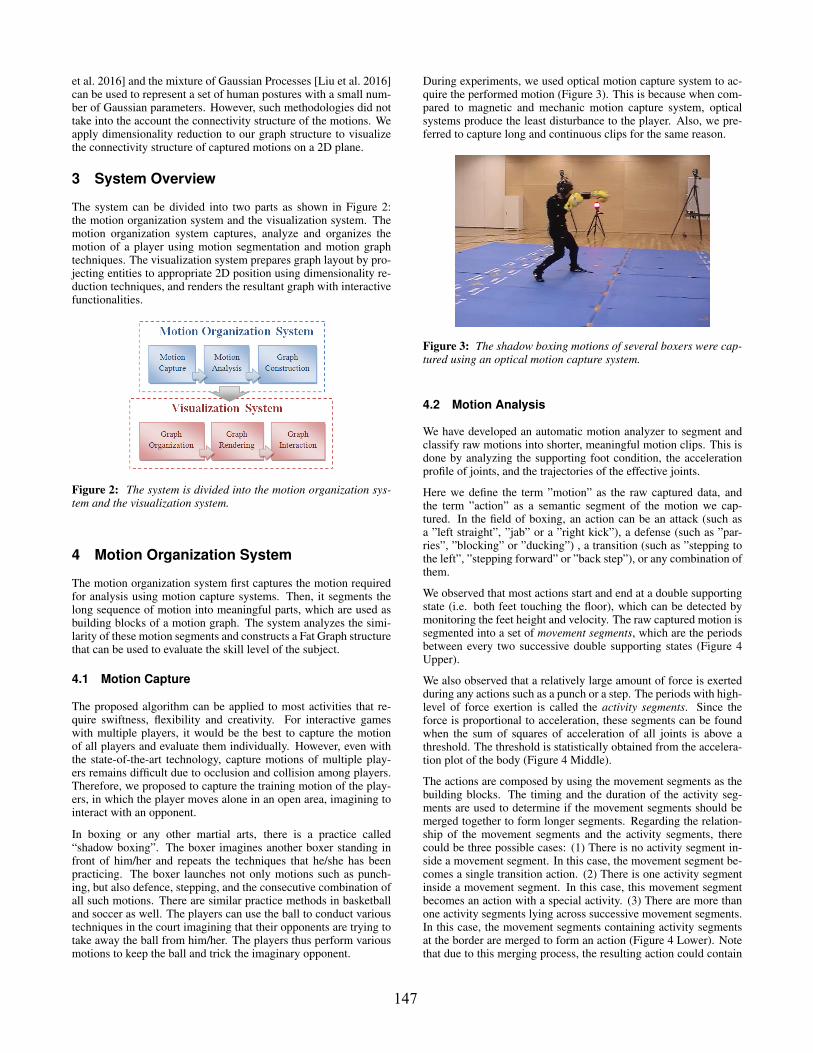
During experiments, we used optical motion capture system to ac-quire the performed motion (Figure 3). This is because when com-pared to magnetic and mechanic motion capture system, opticalsystems produce the least disturbance to the player. Also, we pre-ferred to capture long and continuous clips for the same reason.
Figure 3: The shadow boxing motions of several boxers were cap-tured using an optical motion capture system.
4.2 Motion Analysis
We have developed an automatic motion analyzer to segment andclassify raw motions into shorter, meaningful motion clips. This isdone by analyzing the supporting foot condition, the accelerationprofile of joints, and the trajectories of the effective joints.
Here we define the term ”motion” as the raw captured data, andthe term ”action” as a semantic segment of the motion we cap-tured. In the field of boxing, an action can be an attack (such asa ”left straight”, ”jab” or a ”right kick”), a defense (such as ”par-ries”, ”blocking” or ”ducking”) , a transition (such as ”stepping tothe left”, ”stepping forward” or ”back step”), or any combination ofthem.
We observed that most actions start and end at a double supportingstate (i.e. both feet touching the floor), which can be detected bymonitoring the feet height and velocity. The raw captured motion issegmented into a set of movement segments, which are the periodsbetween every two successive double supporting states (Figure 4Upper).
We also observed that a relatively large amount of force is exertedduring any actions such as a punch or a step. The periods with high-level of force exertion is called the activity segments. Since theforce is proportional to acceleration, these segments can be foundwhen the sum of squares of acceleration of all joints is above athreshold. The threshold is statistically obtained from the accelera-tion plot of the body (Figure 4 Middle).
The actions are composed by using the movement segments as thebuilding blocks. The timing and the duration of the activity seg-ments are used to determine if the movement segments should bemerged together to form longer segments. Regarding the relation-ship of the movement segments and the activity segments, therecould be three possible cases: (1) There is no activity segment in-side a movement segment. In this case, the movement segment be-comes a single transition action. (2) There is one activity segmentinside a movement segment. In this case, this movement segmentbecomes an action with a special activity. (3) There are more thanone activity segments lying across successive movement segments.In this case, the movement segments containing activity segmentsat the border are merged to form an action (Figure 4 Lower). Notethat due to this merging process, the resulting action could contain
147
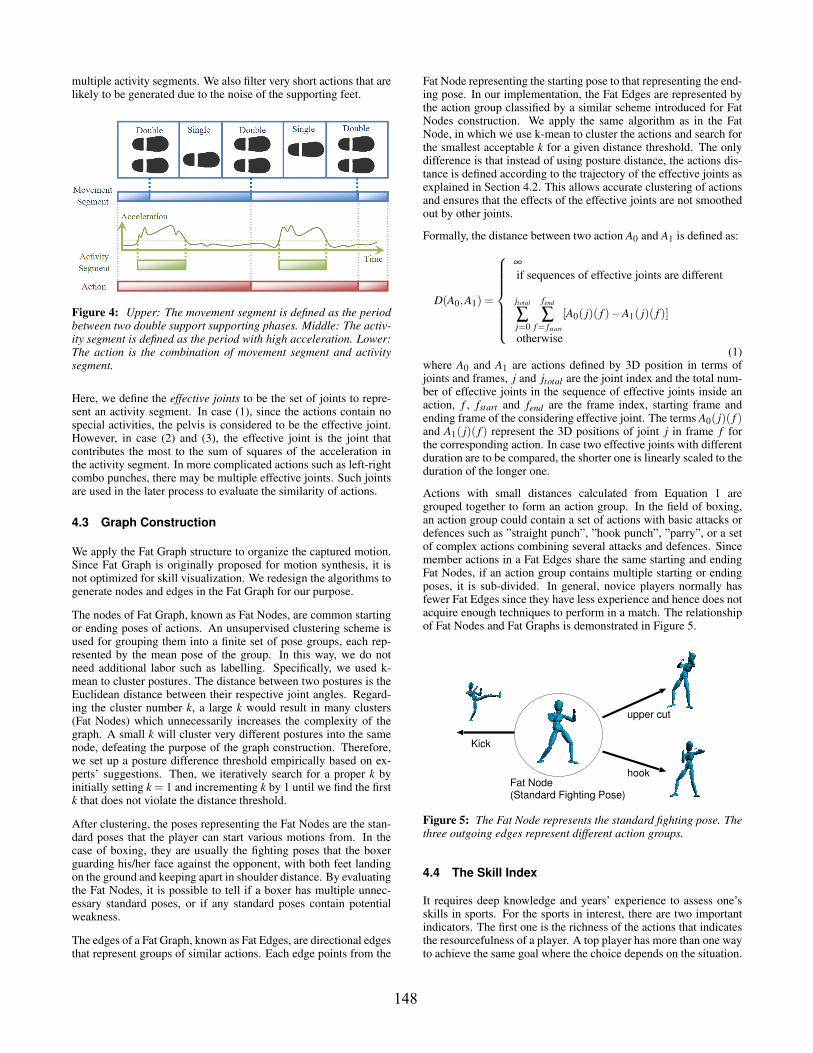
multiple activity segments. We also filter very short actions that arelikely to be generated due to the noise of the supporting feet.
Figure 4: Upper: The movement segment is defined as the periodbetween two double support supporting phases. Middle: The activ-ity segment is defined as the period with high acceleration. Lower:The action is the combination of movement segment and activitysegment.
Here, we define the effective joints to be the set of joints to repre-sent an activity segment. In case (1), since the actions contain nospecial activities, the pelvis is considered to be the effective joint.However, in case (2) and (3), the effective joint is the joint thatcontributes the most to the sum of squares of the acceleration inthe activity segment. In more complicated actions such as left-rightcombo punches, there may be multiple effective joints. Such jointsare used in the later process to evaluate the similarity of actions.
4.3 Graph Construction
We apply the Fat Graph structure to organize the captured motion.Since Fat Graph is originally proposed for motion synthesis, it isnot optimized for skill visualization. We redesign the algorithms togenerate nodes and edges in the Fat Graph for our purpose.
The nodes of Fat Graph, known as Fat Nodes, are common startingor ending poses of actions. An unsupervised clustering scheme isused for grouping them into a finite set of pose groups, each rep-resented by the mean pose of the group. In this way, we do notneed additional labor such as labelling. Specifically, we used k-mean to cluster postures. The distance between two postures is theEuclidean distance between their respective joint angles. Regard-ing the cluster number k, a large k would result in many clusters(Fat Nodes) which unnecessarily increases the complexity of thegraph. A small k will cluster very different postures into the samenode, defeating the purpose of the graph construction. Therefore,we set up a posture difference threshold empirically based on ex-perts’ suggestions. Then, we iteratively search for a proper k byinitially setting k = 1 and incrementing k by 1 until we find the firstk that does not violate the distance threshold.
After clustering, the poses representing the Fat Nodes are the stan-dard poses that the player can start various motions from. In thecase of boxing, they are usually the fighting poses that the boxerguarding his/her face against the opponent, with both feet landingon the ground and keeping apart in shoulder distance. By evaluatingthe Fat Nodes, it is possible to tell if a boxer has multiple unnec-essary standard poses, or if any standard poses contain potentialweakness.
The edges of a Fat Graph, known as Fat Edges, are directional edgesthat represent groups of similar actions. Each edge points from the
Fat Node representing the starting pose to that representing the end-ing pose. In our implementation, the Fat Edges are represented bythe action group classified by a similar scheme introduced for FatNodes construction. We apply the same algorithm as in the FatNode, in which we use k-mean to cluster the actions and search forthe smallest acceptable k for a given distance threshold. The onlydifference is that instead of using posture distance, the actions dis-tance is defined according to the trajectory of the effective joints asexplained in Section 4.2. This allows accurate clustering of actionsand ensures that the effects of the effective joints are not smoothedout by other joints.
Formally, the distance between two action A0 and A1 is defined as:
D(A0,A1) =
∞
if sequences of effective joints are different
jtotal
∑j=0
fend
∑f= fstart
[A0( j)( f )−A1( j)( f )]
otherwise(1)
where A0 and A1 are actions defined by 3D position in terms ofjoints and frames, j and jtotal are the joint index and the total num-ber of effective joints in the sequence of effective joints inside anaction, f , fstart and fend are the frame index, starting frame andending frame of the considering effective joint. The terms A0( j)( f )and A1( j)( f ) represent the 3D positions of joint j in frame f forthe corresponding action. In case two effective joints with differentduration are to be compared, the shorter one is linearly scaled to theduration of the longer one.
Actions with small distances calculated from Equation 1 aregrouped together to form an action group. In the field of boxing,an action group could contain a set of actions with basic attacks ordefences such as ”straight punch”, ”hook punch”, ”parry”, or a setof complex actions combining several attacks and defences. Sincemember actions in a Fat Edges share the same starting and endingFat Nodes, if an action group contains multiple starting or endingposes, it is sub-divided. In general, novice players normally hasfewer Fat Edges since they have less experience and hence does notacquire enough techniques to perform in a match. The relationshipof Fat Nodes and Fat Graphs is demonstrated in Figure 5.
Fat Node (Standard Fighting Pose)
Kick
upper cut
hook
Figure 5: The Fat Node represents the standard fighting pose. Thethree outgoing edges represent different action groups.
4.4 The Skill Index
It requires deep knowledge and years’ experience to assess one’sskills in sports. For the sports in interest, there are two importantindicators. The first one is the richness of the actions that indicatesthe resourcefulness of a player. A top player has more than one wayto achieve the same goal where the choice depends on the situation.
148
The other is the flexibility of transitions between states so that theplayer can switch between different states at will. Our graph repre-sentation captures both of the indicators. The richness can be rep-resented by the number of Fat Edges between any two Fat Nodesindicating how many kinds of maneuvers, each with variations, theplayer has for transitions from one state to another. The flexibil-ity is indicated by the connectivity of the graph. A fully connectedgraph shows great flexibility because there are transitions betweenany two nodes.
However, these two factors are somehow contradicting. In general,the richer the actions are, the greater the number of different startingand ending poses is hence the poorer the connectivity of actions is.Independently considering either of them would not suffice. There-fore we define a Skill Index, S, that evaluates the skill level of theplayer.
The richness of action is represented by the number of Fat Edgesin the Fat Graph, while the connectivity is inversely proportional tothe number of Fat Nodes. The Skill Index is defined by:
S =Number of Fat EdgesNumber of Fat Nodes
(2)
In our implementation, we do not consider the Fat Nodes that arenot intentionally created. For example, one of our boxers trippedover during a session. While it is good that our system can ob-jectively pick up the posture generated by the accident, we do notinclude the corresponding Fat Nodes when calculating the Skill In-dex. Also, we do not consider Fat Edges that contain only one ac-tion to make sure this edge is not some randomly performed action.
As an example, experienced boxers could perform a large varietyor actions while maintaining the connectivity of actions by limitingthe number of starting and ending poses of actions. In this case, theSkill Index of the player will be very large.
5 Visualization System
The graph representation explained above consists of high dimen-sional Fat Nodes (groups of similar postures of many degrees offreedom) and Fat Edges (groups of similar actions), which presentsa challenge for visualization. To decrease the dimensionality forbetter visualization, we propose two different algorithms for nodesand edges because of their different nature in this graph. Specifi-cally, we project the nodes on a 2D space and represent the edgeswith curves. For Fat Nodes, we apply Principal Component Anal-ysis (PCA) as it creates a more consistent low dimensional spacecomparing with other methods. For Fat Edges, we apply PCA onhigh energy postures of the actions, and use a combination of geo-metric primitives to visualize the action features.
5.1 Visualizing Fat Nodes
Although the degree of freedom (DOF) of human poses are nor-mally in high dimensionality (45 DOF in our system), they are in-trinsically dependent on each other. In fact, the Fat Nodes can berepresented effectively in a 2D space where nodes of similar posesare located together while that of different poses are located farapart. By this representation, viewers can easily understand the re-lationship among postures. In this section, we briefly describe theprogress of projecting high dimensionality poses in Fat Nodes tolow dimensionality viewing plane.
We define a posture as a vector of 3D positions of joints, each ofwhich is computed as its 3D position with respect to the position ofthe pelvis. Suppose iTotal is the total number of joints, a pose spaceP can be defined as P = {Ji} where i ∈ [0, iTotal ]. Each dimension
in the pose space P represents a DOF, and the jth dimension in thepose space is denoted as Pj, where j ∈ [0,3iTotal ] and 3iTotal is thetotal number of DOF.
Given a set of zero-meaned poses p ∈ P, it is possible to calcu-late the covariance matrix C of size 3iTotal ×3iTotal to evaluate theintrinsic dependency of the dimensions in the pose space. The ele-ment at mth column and nth row of matrix C is defined as:
Cm,n = cov(Pm,Pn) (3)
where cov(Pm,Pn) denotes the covariance between the mth and nth
dimension in the pose space.
We calculate the eigenvectors from C. The eigenvectors representorthogonal dimensions that form a projected space, and each ofthem comes with an eigenvalue. Since we wish to project the humanpose onto a 2D space, we select the two eigenvectors with largesteigenvalues, which indicate the variance of data in the correspond-ing eigenvector dimension, to form a feature vector.
F = [eig1,eig2] (4)
where eig1 and eig2 are the two eigenvectors with largest eigenval-ues. Once the feature vector is calculated, an arbitrary pose p canbe projected onto the 2D plane by:
p′ = F× p (5)
where p′ is the projected 2D coordinate.
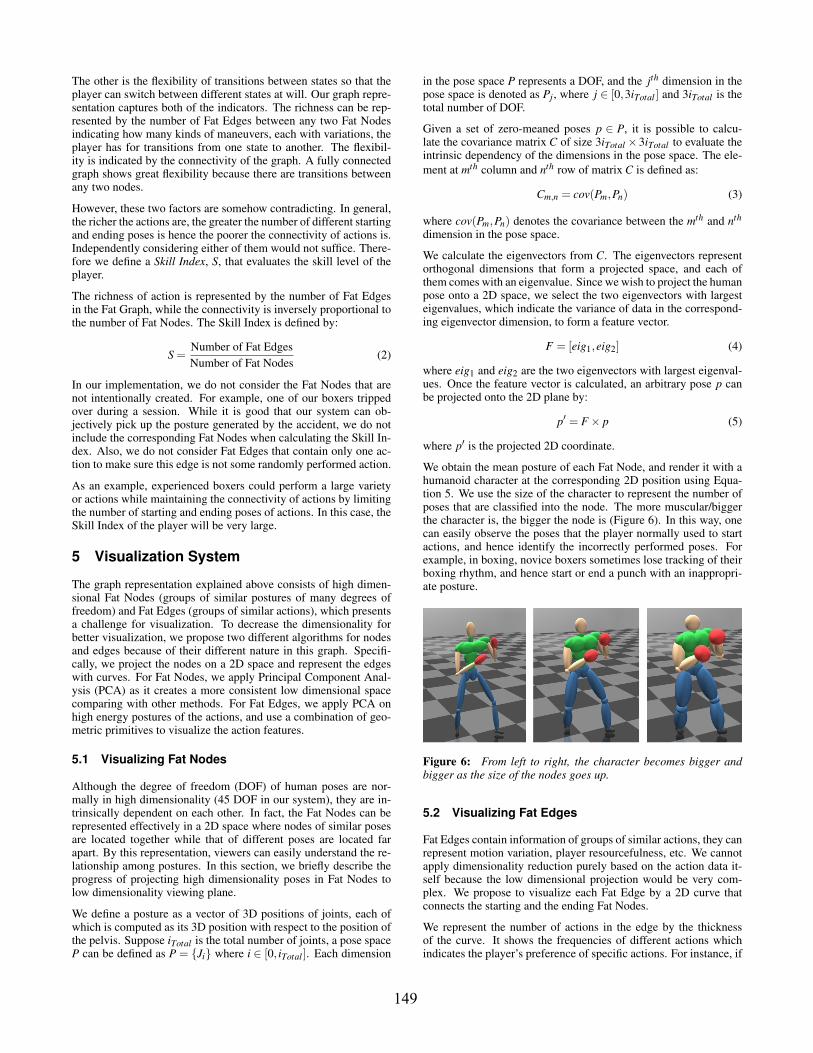
We obtain the mean posture of each Fat Node, and render it with ahumanoid character at the corresponding 2D position using Equa-tion 5. We use the size of the character to represent the number ofposes that are classified into the node. The more muscular/biggerthe character is, the bigger the node is (Figure 6). In this way, onecan easily observe the poses that the player normally used to startactions, and hence identify the incorrectly performed poses. Forexample, in boxing, novice boxers sometimes lose tracking of theirboxing rhythm, and hence start or end a punch with an inappropri-ate posture.
Figure 6: From left to right, the character becomes bigger andbigger as the size of the nodes goes up.
5.2 Visualizing Fat Edges
Fat Edges contain information of groups of similar actions, they canrepresent motion variation, player resourcefulness, etc. We cannotapply dimensionality reduction purely based on the action data it-self because the low dimensional projection would be very com-plex. We propose to visualize each Fat Edge by a 2D curve thatconnects the starting and the ending Fat Nodes.
We represent the number of actions in the edge by the thicknessof the curve. It shows the frequencies of different actions whichindicates the player’s preference of specific actions. For instance, if
149
a boxer heavily relies on single straight punch, the Fat Edge for suchaction will be unreasonably thick, while edges for other attacks suchas hook punches will be relatively thin, which shows the potentialproblem of the lack of diversity of attacking strategies.
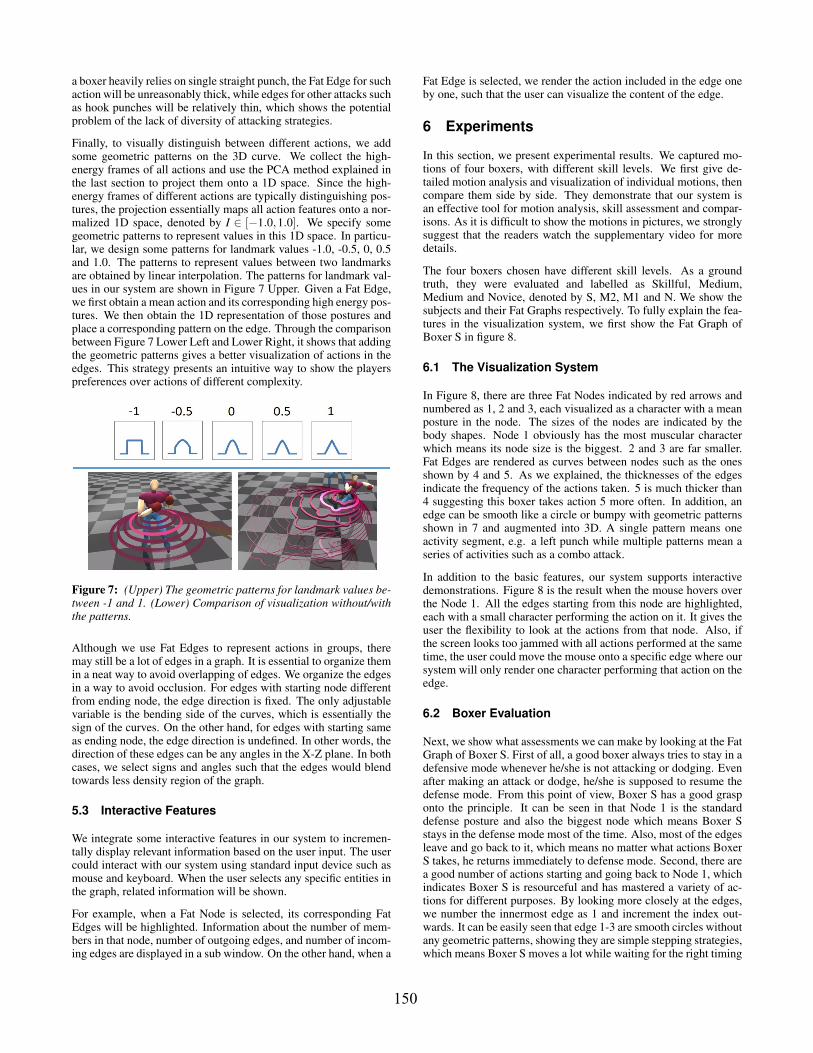
Finally, to visually distinguish between different actions, we addsome geometric patterns on the 3D curve. We collect the high-energy frames of all actions and use the PCA method explained inthe last section to project them onto a 1D space. Since the high-energy frames of different actions are typically distinguishing pos-tures, the projection essentially maps all action features onto a nor-malized 1D space, denoted by I ∈ [−1.0,1.0]. We specify somegeometric patterns to represent values in this 1D space. In particu-lar, we design some patterns for landmark values -1.0, -0.5, 0, 0.5and 1.0. The patterns to represent values between two landmarksare obtained by linear interpolation. The patterns for landmark val-ues in our system are shown in Figure 7 Upper. Given a Fat Edge,we first obtain a mean action and its corresponding high energy pos-tures. We then obtain the 1D representation of those postures andplace a corresponding pattern on the edge. Through the comparisonbetween Figure 7 Lower Left and Lower Right, it shows that addingthe geometric patterns gives a better visualization of actions in theedges. This strategy presents an intuitive way to show the playerspreferences over actions of different complexity.
Figure 7: (Upper) The geometric patterns for landmark values be-tween -1 and 1. (Lower) Comparison of visualization without/withthe patterns.
Although we use Fat Edges to represent actions in groups, theremay still be a lot of edges in a graph. It is essential to organize themin a neat way to avoid overlapping of edges. We organize the edgesin a way to avoid occlusion. For edges with starting node differentfrom ending node, the edge direction is fixed. The only adjustablevariable is the bending side of the curves, which is essentially thesign of the curves. On the other hand, for edges with starting sameas ending node, the edge direction is undefined. In other words, thedirection of these edges can be any angles in the X-Z plane. In bothcases, we select signs and angles such that the edges would blendtowards less density region of the graph.
5.3 Interactive Features
We integrate some interactive features in our system to incremen-tally display relevant information based on the user input. The usercould interact with our system using standard input device such asmouse and keyboard. When the user selects any specific entities inthe graph, related information will be shown.
For example, when a Fat Node is selected, its corresponding FatEdges will be highlighted. Information about the number of mem-bers in that node, number of outgoing edges, and number of incom-ing edges are displayed in a sub window. On the other hand, when a
Fat Edge is selected, we render the action included in the edge oneby one, such that the user can visualize the content of the edge.
6 Experiments
In this section, we present experimental results. We captured mo-tions of four boxers, with different skill levels. We first give de-tailed motion analysis and visualization of individual motions, thencompare them side by side. They demonstrate that our system isan effective tool for motion analysis, skill assessment and compar-isons. As it is difficult to show the motions in pictures, we stronglysuggest that the readers watch the supplementary video for moredetails.
The four boxers chosen have different skill levels. As a groundtruth, they were evaluated and labelled as Skillful, Medium,Medium and Novice, denoted by S, M2, M1 and N. We show thesubjects and their Fat Graphs respectively. To fully explain the fea-tures in the visualization system, we first show the Fat Graph ofBoxer S in figure 8.
6.1 The Visualization System
In Figure 8, there are three Fat Nodes indicated by red arrows andnumbered as 1, 2 and 3, each visualized as a character with a meanposture in the node. The sizes of the nodes are indicated by thebody shapes. Node 1 obviously has the most muscular characterwhich means its node size is the biggest. 2 and 3 are far smaller.Fat Edges are rendered as curves between nodes such as the onesshown by 4 and 5. As we explained, the thicknesses of the edgesindicate the frequency of the actions taken. 5 is much thicker than4 suggesting this boxer takes action 5 more often. In addition, anedge can be smooth like a circle or bumpy with geometric patternsshown in 7 and augmented into 3D. A single pattern means oneactivity segment, e.g. a left punch while multiple patterns mean aseries of activities such as a combo attack.
In addition to the basic features, our system supports interactivedemonstrations. Figure 8 is the result when the mouse hovers overthe Node 1. All the edges starting from this node are highlighted,each with a small character performing the action on it. It gives theuser the flexibility to look at the actions from that node. Also, ifthe screen looks too jammed with all actions performed at the sametime, the user could move the mouse onto a specific edge where oursystem will only render one character performing that action on theedge.
6.2 Boxer Evaluation
Next, we show what assessments we can make by looking at the FatGraph of Boxer S. First of all, a good boxer always tries to stay in adefensive mode whenever he/she is not attacking or dodging. Evenafter making an attack or dodge, he/she is supposed to resume thedefense mode. From this point of view, Boxer S has a good grasponto the principle. It can be seen in that Node 1 is the standarddefense posture and also the biggest node which means Boxer Sstays in the defense mode most of the time. Also, most of the edgesleave and go back to it, which means no matter what actions BoxerS takes, he returns immediately to defense mode. Second, there area good number of actions starting and going back to Node 1, whichindicates Boxer S is resourceful and has mastered a variety of ac-tions for different purposes. By looking more closely at the edges,we number the innermost edge as 1 and increment the index out-wards. It can be easily seen that edge 1-3 are smooth circles withoutany geometric patterns, showing they are simple stepping strategies,which means Boxer S moves a lot while waiting for the right timing
150
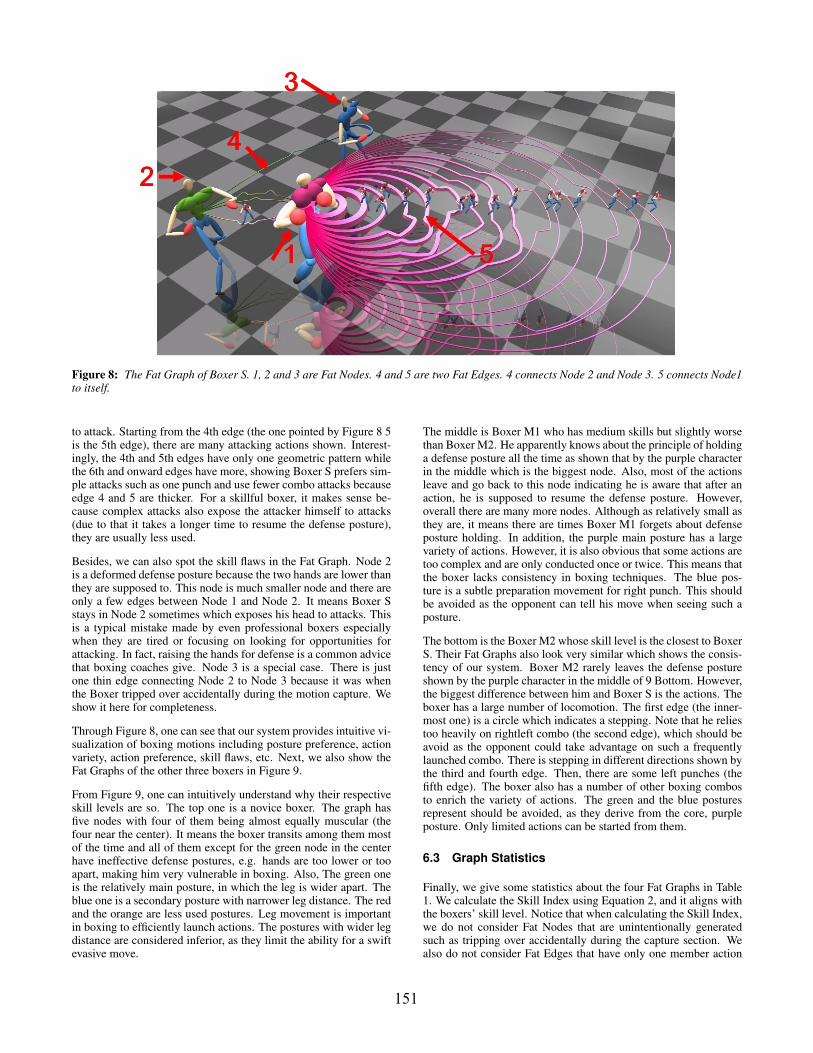
Figure 8: The Fat Graph of Boxer S. 1, 2 and 3 are Fat Nodes. 4 and 5 are two Fat Edges. 4 connects Node 2 and Node 3. 5 connects Node1to itself.
to attack. Starting from the 4th edge (the one pointed by Figure 8 5is the 5th edge), there are many attacking actions shown. Interest-ingly, the 4th and 5th edges have only one geometric pattern whilethe 6th and onward edges have more, showing Boxer S prefers sim-ple attacks such as one punch and use fewer combo attacks becauseedge 4 and 5 are thicker. For a skillful boxer, it makes sense be-cause complex attacks also expose the attacker himself to attacks(due to that it takes a longer time to resume the defense posture),they are usually less used.
Besides, we can also spot the skill flaws in the Fat Graph. Node 2is a deformed defense posture because the two hands are lower thanthey are supposed to. This node is much smaller node and there areonly a few edges between Node 1 and Node 2. It means Boxer Sstays in Node 2 sometimes which exposes his head to attacks. Thisis a typical mistake made by even professional boxers especiallywhen they are tired or focusing on looking for opportunities forattacking. In fact, raising the hands for defense is a common advicethat boxing coaches give. Node 3 is a special case. There is justone thin edge connecting Node 2 to Node 3 because it was whenthe Boxer tripped over accidentally during the motion capture. Weshow it here for completeness.
Through Figure 8, one can see that our system provides intuitive vi-sualization of boxing motions including posture preference, actionvariety, action preference, skill flaws, etc. Next, we also show theFat Graphs of the other three boxers in Figure 9.
From Figure 9, one can intuitively understand why their respectiveskill levels are so. The top one is a novice boxer. The graph hasfive nodes with four of them being almost equally muscular (thefour near the center). It means the boxer transits among them mostof the time and all of them except for the green node in the centerhave ineffective defense postures, e.g. hands are too lower or tooapart, making him very vulnerable in boxing. Also, The green oneis the relatively main posture, in which the leg is wider apart. Theblue one is a secondary posture with narrower leg distance. The redand the orange are less used postures. Leg movement is importantin boxing to efficiently launch actions. The postures with wider legdistance are considered inferior, as they limit the ability for a swiftevasive move.
The middle is Boxer M1 who has medium skills but slightly worsethan Boxer M2. He apparently knows about the principle of holdinga defense posture all the time as shown that by the purple characterin the middle which is the biggest node. Also, most of the actionsleave and go back to this node indicating he is aware that after anaction, he is supposed to resume the defense posture. However,overall there are many more nodes. Although as relatively small asthey are, it means there are times Boxer M1 forgets about defenseposture holding. In addition, the purple main posture has a largevariety of actions. However, it is also obvious that some actions aretoo complex and are only conducted once or twice. This means thatthe boxer lacks consistency in boxing techniques. The blue pos-ture is a subtle preparation movement for right punch. This shouldbe avoided as the opponent can tell his move when seeing such aposture.
The bottom is the Boxer M2 whose skill level is the closest to BoxerS. Their Fat Graphs also look very similar which shows the consis-tency of our system. Boxer M2 rarely leaves the defense postureshown by the purple character in the middle of 9 Bottom. However,the biggest difference between him and Boxer S is the actions. Theboxer has a large number of locomotion. The first edge (the inner-most one) is a circle which indicates a stepping. Note that he reliestoo heavily on rightleft combo (the second edge), which should beavoid as the opponent could take advantage on such a frequentlylaunched combo. There is stepping in different directions shown bythe third and fourth edge. Then, there are some left punches (thefifth edge). The boxer also has a number of other boxing combosto enrich the variety of actions. The green and the blue posturesrepresent should be avoided, as they derive from the core, purpleposture. Only limited actions can be started from them.
6.3 Graph Statistics
Finally, we give some statistics about the four Fat Graphs in Table1. We calculate the Skill Index using Equation 2, and it aligns withthe boxers’ skill level. Notice that when calculating the Skill Index,we do not consider Fat Nodes that are unintentionally generatedsuch as tripping over accidentally during the capture section. Wealso do not consider Fat Edges that have only one member action
151
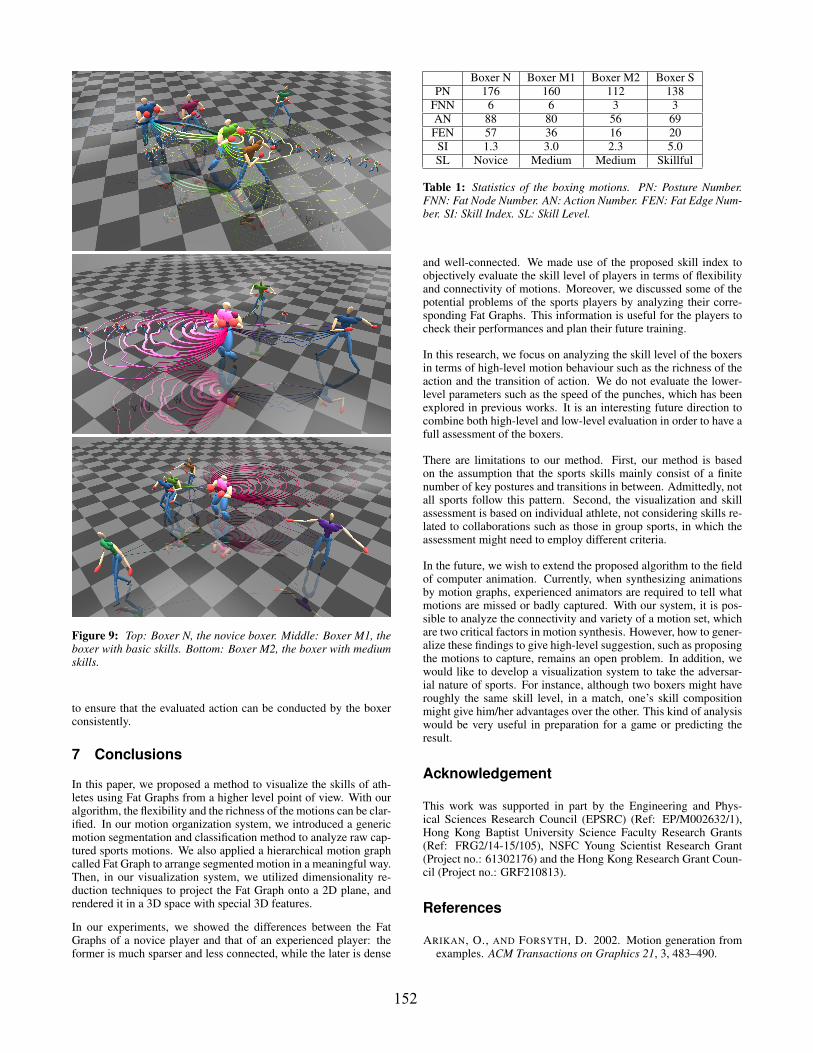
Figure 9: Top: Boxer N, the novice boxer. Middle: Boxer M1, theboxer with basic skills. Bottom: Boxer M2, the boxer with mediumskills.
to ensure that the evaluated action can be conducted by the boxerconsistently.
7 Conclusions
In this paper, we proposed a method to visualize the skills of ath-letes using Fat Graphs from a higher level point of view. With ouralgorithm, the flexibility and the richness of the motions can be clar-ified. In our motion organization system, we introduced a genericmotion segmentation and classification method to analyze raw cap-tured sports motions. We also applied a hierarchical motion graphcalled Fat Graph to arrange segmented motion in a meaningful way.Then, in our visualization system, we utilized dimensionality re-duction techniques to project the Fat Graph onto a 2D plane, andrendered it in a 3D space with special 3D features.
In our experiments, we showed the differences between the FatGraphs of a novice player and that of an experienced player: theformer is much sparser and less connected, while the later is dense
Boxer N Boxer M1 Boxer M2 Boxer SPN 176 160 112 138
FNN 6 6 3 3AN 88 80 56 69FEN 57 36 16 20
SI 1.3 3.0 2.3 5.0SL Novice Medium Medium Skillful
Table 1: Statistics of the boxing motions. PN: Posture Number.FNN: Fat Node Number. AN: Action Number. FEN: Fat Edge Num-ber. SI: Skill Index. SL: Skill Level.
and well-connected. We made use of the proposed skill index toobjectively evaluate the skill level of players in terms of flexibilityand connectivity of motions. Moreover, we discussed some of thepotential problems of the sports players by analyzing their corre-sponding Fat Graphs. This information is useful for the players tocheck their performances and plan their future training.
In this research, we focus on analyzing the skill level of the boxersin terms of high-level motion behaviour such as the richness of theaction and the transition of action. We do not evaluate the lower-level parameters such as the speed of the punches, which has beenexplored in previous works. It is an interesting future direction tocombine both high-level and low-level evaluation in order to have afull assessment of the boxers.
There are limitations to our method. First, our method is basedon the assumption that the sports skills mainly consist of a finitenumber of key postures and transitions in between. Admittedly, notall sports follow this pattern. Second, the visualization and skillassessment is based on individual athlete, not considering skills re-lated to collaborations such as those in group sports, in which theassessment might need to employ different criteria.
In the future, we wish to extend the proposed algorithm to the fieldof computer animation. Currently, when synthesizing animationsby motion graphs, experienced animators are required to tell whatmotions are missed or badly captured. With our system, it is pos-sible to analyze the connectivity and variety of a motion set, whichare two critical factors in motion synthesis. However, how to gener-alize these findings to give high-level suggestion, such as proposingthe motions to capture, remains an open problem. In addition, wewould like to develop a visualization system to take the adversar-ial nature of sports. For instance, although two boxers might haveroughly the same skill level, in a match, one’s skill compositionmight give him/her advantages over the other. This kind of analysiswould be very useful in preparation for a game or predicting theresult.
Acknowledgement
This work was supported in part by the Engineering and Phys-ical Sciences Research Council (EPSRC) (Ref: EP/M002632/1),Hong Kong Baptist University Science Faculty Research Grants(Ref: FRG2/14-15/105), NSFC Young Scientist Research Grant(Project no.: 61302176) and the Hong Kong Research Grant Coun-cil (Project no.: GRF210813).
References
ARIKAN, O., AND FORSYTH, D. 2002. Motion generation fromexamples. ACM Transactions on Graphics 21, 3, 483–490.
152
ARIKAN, O., FORSYTH, D. A., AND O’BRIEN, J. F. 2003. Mo-tion synthesis from annotations. ACM Trans. Graph. 22, 3 (July),402–408.
BEAUDOIN, P., COROS, S., DE PANNE, M. V., AND POULIN, P.2008. Motion-motif graphs.
BIDEAU, B., KULPA, R., MENARDAIS, S., FRADET, L., MUL-TON, F., DELAMARCHE, P., AND ARNALDI, B. 2003. Realhandball goalkeeper vs. virtual handball thrower. Presence:Teleoper. Virtual Environ. 12, 4, 411–421.
GROCHOW, K., MARTIN, S. L., HERTZMANN, A., ANDPOPOVIC’, Z. 2004. Style-based inverse kinematics. ACMTransactions on Graphics (TOG) 22, 3 (August).
HECK, R., AND GLEICHER, M. 2007. Parametric motion graphs.In Proceedings of the 2007 Symposium on Interactive 3D Graph-ics and Games, ACM, New York, NY, USA, I3D ’07, 129–136.
HO, E. S., AND KOMURA, T. 2009. Character Motion Synthesisby Topology Coordinates. Computer Graphics Forum.
HO, E. S. L., AND KOMURA, T. 2011. A finite state machinebased on topology coordinates for wrestling games. ComputerAnimation and Virtual Worlds 22, 5, 435–443.
HO, E. S. L., SHUM, H. P. H., CHEUNG, Y.-M., AND YUEN,P. C. 2013. Topology aware data-driven inverse kinematics.Comp. Graph. Forum 32, 7 (Oct), 61–70.
HOLDEN, D., SAITO, J., AND KOMURA, T. 2016. A deep learn-ing framework for character motion synthesis and editing. ACMTrans. Graph. 35, 4 (July), 138:1–138:11.
HYUN, K., LEE, K., AND LEE, J. 2016. Motion grammars forcharacter animation. Computer Graphics Forum 35, 2, 103–113.
KOMURA, T., KURODA, A., AND SHINAGAWA, Y. 2002. Nice-meetvr: Facing professional baseball pitchers in the virtual bat-ting cage. In Proceedings of the 2002 ACM Symposium on Ap-plied Computing, ACM, New York, NY, USA, SAC ’02, 1060–1065.
KOVAR, L., GLEICHER, M., AND PIGHIN, F. 2002. Motiongraphs. ACM Transactions on Graphics 21, 3, 473–482.
KWON, T., AND SHIN, S. Y. 2005. Motion modeling for on-linelocomotion synthesis. In SCA ’05: Proceedings of the 2005 ACMSIGGRAPH/Eurographics symposium on Computer animation,29–38.
LAU, M., AND KUFFNER, J. J. 2005. Behavior planning for char-acter animation. In SCA ’05: Proceedings of the 2005 ACMSIGGRAPH/Eurographics symposium on Computer animation,ACM Press, 271–280.
LAWRENCE, N. D. 2004. Gaussian process latent variable modelsfor visualisation of high dimensional data.
LEE, J., CHAI, J., REITSMA, P. S. A., HODGINS, J. K., ANDPOLLARD, N. S. 2002. Interactive control of avatars animatedwith human motion data. ACM Transactions on Graphics 21, 3,491–500.
LI, Y., WANG, T., AND SHUM, H.-Y. 2002. Motion texture: Atwo-level statistical model for character motion synthesis. ACMTrans. Graph. 21, 3 (July), 465–472.
LIU, Z., ZHOU, L., LEUNG, H., AND SHUM, H. P. H. 2016.Kinect posture reconstruction based on a local mixture of gaus-sian process models. IEEE Transactions on Visualization andComputer Graphics.
MIN, J., AND CHAI, J. 2012. Motion graphs++: a compact gen-erative model for semantic motion analysis and synthesis. ACMTransactions on Graphics 31, 6, 153.
MOLET, T., AUBEL, A., NOSER, H., CAPIN, T., LEE, E.,PANDZIC, I., THALMANN, D., AND THALMANN, N. 1999.Anyone for tennis.
PLANTARD, P., SHUM, H. P. H., AND MULTON, F. 2016. Er-gonomics measurements using kinect with a pose correctionframework. In Proceedings of the 2016 International DigitalHuman Modeling Symposium, DHM ’16.
PLANTARD, P., SHUM, H. P. H., AND MULTON, F. 2016. Filteredpose graph for efficient kinect pose reconstruction. Journal ofMultimedia Tools and Applications.
REITSMA, P. S. A., AND POLLARD, N. S. 2007. Evaluatingmotion graphs for character animation. ACM Trans. Graph. 26,4 (Oct.).
SAFONOVA, A., AND HODGINS, J. K. 2007. Construction and op-timal search of interpolated motion graphs. ACM Trans. Graph.26, 3 (July).
SHIN, H. J., AND LEE, J. 2006. Motion synthesis and editingin low-dimensional spaces. Computer Animation and VirtualWorlds (Special Issue: CASA 2006) 17, 3-4, 219 – 227.
SHIN, H. J., AND OH, H. S. 2006. Fat graphs: Constructing aninteractive character with continuous controls. ACM SIGGRAPH/ Eurographics Symposium on Computer Animation, 291–298.
SHUM, H. P. H., KOMURA, T., SHIRAISHI, M., AND YAMAZAKI,S. 2008. Interaction patches for multi-character animation. ACMTrans. Graph. 27, 5 (Dec), 114:1–114:8.
SHUM, H. P. H., KOMURA, T., SHIRATORI, T., AND TAKAGI,S. 2010. Physically-based character control in low dimensionalspace. In Proceedings of the Third International Conference onMotion in Games, Springer-Verlag, Berlin, Heidelberg, vol. 6459of MIG ’10, 23–34.
SHUM, H. P. H., KOMURA, T., AND YAMAZAKI, S. 2012. Simu-lating multiple character interactions with collaborative and ad-versarial goals. IEEE Transactions on Visualization and Com-puter Graphics 18, 5 (May), 741–752.
SHUM, H. P. H., HO, E. S. L., JIANG, Y., AND TAKAGI, S. 2013.Real-time posture reconstruction for microsoft kinect. IEEETransactions on Cybernetics 43, 5, 1357–1369.
TENENBAUM, J. B., DE SILVA, V., AND LANGFORD, J. C. Aglobal geometric framework for nonlinear dimensionality reduc-tion. Science 290, 5500, 2319–2323.
WANG, J., HERTZMANN, A., AND BLEI, D. M. 2006. Gaussianprocess dynamical models.
XIA, S., WANG, C., CHAI, J., AND HODGINS, J. 2015. Realtimestyle transfer for unlabeled heterogeneous human motion. ACMTrans. Graph. 34, 4 (July), 119:1–119:10.
YEADON, M. The biomechanics of the human in flight. The Amer-ican Journal of Sports Medicine 25, 4, 575–580.
YEADON, M. 1990. The simulation of aerial movement- iv. acomputer simulation model. Journal of Biomechanics 23, 1, 85–89.
153