Embed Size (px)
Citation preview
Skills in New Zealand and around the world
Survey of Adult Skills (PIAAC)
Skills in New Zealand and around the world / Survey of Adult Skills Page 2 of 30
Published by: Ministry of Education and Ministry of Business Innovation and Employment ©Crown Copyright This work is licensed under the Creative Commons Attribution 3.0 New Zealand Licence. In essence, you are free to copy, distribute and adapt the work, as long as you attribute the work to the copyright holder and abide by the licence terms. To view a copy of this licence, visit: www.creativecommons.org/licenses/by/3.0/nz June 2016 ISBN: 978-0-478-16824-2
Skills in New Zealand and around the world / Survey of Adult Skills Page 3 of 30
Table of Contents Introduction .................................................................................................................................................4
Comparing skills in New Zealand to other countries ...................................................................................6
High and low skills ........................................................................................................................................8
Skills and age ..............................................................................................................................................12
Skills and education ...................................................................................................................................17
Skills and ethnicity .....................................................................................................................................19
Skills and migration ....................................................................................................................................21
Skills and gender ........................................................................................................................................24
Appendix ....................................................................................................................................................27
Skills in New Zealand and around the world / Survey of Adult Skills Page 4 of 30
Introduction
Key findings
» New Zealand adults’ literacy and problem solving skills are on average among the highest in the OECD
» New Zealand adults’ numeracy skills are on average higher than the OECD average
» Although there are significant differences in skills between ethnic groups, average literacy and numeracy skills have been rising faster among Māori and Pasifika than in the total New Zealand population
» Overseas-born New Zealanders have on average higher literacy and numeracy scores than overseas-born people in any other country
» While there are no differences in average literacy and problem solving skills between men and women, men have higher numeracy skills on average than women
What is the Survey of Adult Skills? The Survey of Adult Skills measures the skills of New Zealand adults in literacy, numeracy and problem solving in technology rich environments. It is part of the OECD’s Programme for the International Assessment of Adult Competencies (PIAAC). The Survey of Adult Skills provides the first picture of skills for those aged 16 to 65 in New Zealand since 2006. The survey has been run across 32 other countries, making it possible to compare the skills of adults in New Zealand internationally.
Skills are becoming more important in the modern workplace and in everyday life. Higher skills are associated with better jobs, higher income and greater well-being. The Survey of Adult Skills can help answer key questions related to skills in New Zealand, such as:
» what are the characteristics of the most skilled and least skilled people in New Zealand in terms of education, employment, income, well-being and other characteristics?
» how do New Zealanders use their skills at work and at home?
» what areas should we focus on to improve the skills of New Zealand adults?
The survey was undertaken in 2014 with a representative sample of New Zealand households. In total, 6,177 people were surveyed. It was conducted in English and included an extensive background questionnaire covering education, employment, and the use of skills at work and in everyday life. The respondents were then tested on their skills.
The survey measures skills on continuous scales which show the range of abilities from being able to deal with simpler through to more complex tasks. The survey does not measure whether people ‘pass’ or ‘fail’ certain standards, nor whether people are ‘literate’, ‘illiterate’, ‘numerate’ or ‘innumerate’.
The scales can be divided into levels to group people within similar ranges of ability. These levels help describe the kinds of tasks these groups of people can do. However, the levels, on their own, do not describe benchmarks or thresholds for participation in society and the economy.
This is one of three summary reports from the Survey of Adult Skills. This report covers key findings on how New Zealand adults’ skills compare internationally and on the skill levels of different groups of New Zealanders.
Skills in New Zealand and around the world / Survey of Adult Skills Page 5 of 30
Literacy
Literacy is the ability to understand, evaluate, use and engage with written texts to get everyday things done. The Survey of Adult Skills only measures reading literacy; there is no writing component. Some skills required are:
» understanding of written words and sentences
» comprehension of text in charts and diagrams
» comprehension, interpretation and evaluation of complex texts.
Numeracy
Numeracy is the ability to use, interpret and communicate mathematical information and ideas in order to engage in and manage the mathematical demands of a range of situations. Some aspects that people are required to understand are:
» quantity
» dimension and shapes
» patterns
» data and chance
» visual displays.
Problem solving in technology rich environments
Problem solving in technology rich environments is the ability to use computers to acquire and evaluate information, communicate with others and perform practical tasks. All tasks are completed on a computer that simulates real-world tasks with standard applications. Some skills required are:
» completing tasks using different everyday computer applications
» finding specific information in everyday computer applications
» using common functions to complete tasks in everyday computer applications.
Measuring skills over time
Previous surveys allow adult literacy skills in 2014 to be compared to those in 1996 and 2006. Adult numeracy skills in 2014 can be compared to numeracy skills in 2006. Problem solving in technology rich environments has been measured for the first time in the Survey of Adult Skills.
Previous measures of adult skills come from the 2006 Adult Literacy and Life Skills Survey (ALL) and 1996 International Adult Literacy Survey (IALS). The ALL and IALS surveys previously reported literacy as two separate measures: ‘document literacy’ and ‘prose literacy’. These two separate scores have been remodelled into a single score that can be compared to the Survey of Adult Skills. The measures are not strictly the same, so some caution is needed when making comparisons between the 2014 Survey of Adult Skills and previous surveys.
Numeracy scores from the 2006 ALL Survey have been re-calculated to match the measure used in the Survey of Adult Skills. The numeracy scores from 2006 used in this report will therefore differ from those in the Ministry of Education’s New Zealand reports from New Zealand ALL data.
Statistical significance
Differences over time, between groups or between countries are statistically significant if the 95% confidence intervals do not overlap. This means we are at least 95% sure that the ranges within which the true population values lie do not overlap.
Skills in New Zealand and around the world / Survey of Adult Skills Page 6 of 30
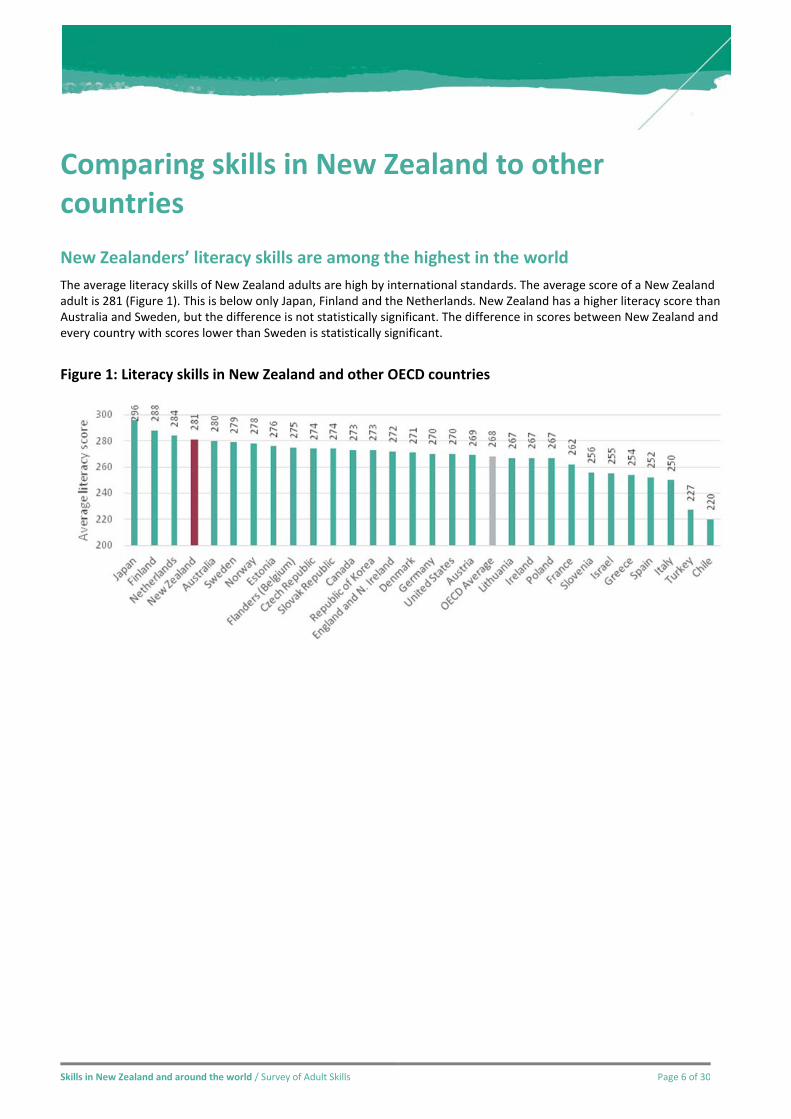
Comparing skills in New Zealand to other countries New Zealanders’ literacy skills are among the highest in the world The average literacy skills of New Zealand adults are high by international standards. The average score of a New Zealand adult is 281 (Figure 1). This is below only Japan, Finland and the Netherlands. New Zealand has a higher literacy score than Australia and Sweden, but the difference is not statistically significant. The difference in scores between New Zealand and every country with scores lower than Sweden is statistically significant.
Figure 1: Literacy skills in New Zealand and other OECD countries
Skills in New Zealand and around the world / Survey of Adult Skills Page 7 of 30
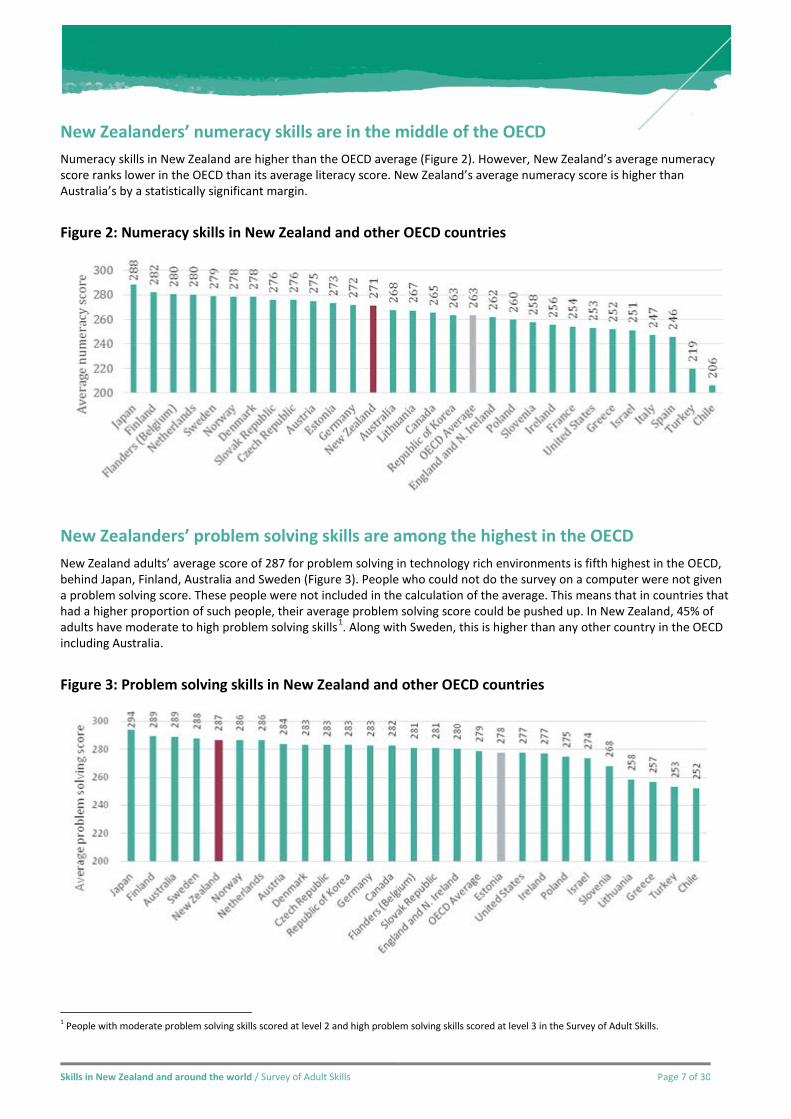
New Zealanders’ numeracy skills are in the middle of the OECD Numeracy skills in New Zealand are higher than the OECD average (Figure 2). However, New Zealand’s average numeracy score ranks lower in the OECD than its average literacy score. New Zealand’s average numeracy score is higher than Australia’s by a statistically significant margin.
Figure 2: Numeracy skills in New Zealand and other OECD countries
New Zealanders’ problem solving skills are among the highest in the OECD New Zealand adults’ average score of 287 for problem solving in technology rich environments is fifth highest in the OECD, behind Japan, Finland, Australia and Sweden (Figure 3). People who could not do the survey on a computer were not given a problem solving score. These people were not included in the calculation of the average. This means that in countries that had a higher proportion of such people, their average problem solving score could be pushed up. In New Zealand, 45% of adults have moderate to high problem solving skills1. Along with Sweden, this is higher than any other country in the OECD including Australia.
Figure 3: Problem solving skills in New Zealand and other OECD countries
1 People with moderate problem solving skills scored at level 2 and high problem solving skills scored at level 3 in the Survey of Adult Skills.
Skills in New Zealand and around the world / Survey of Adult Skills Page 8 of 30
High and low skills The meaning of high literacy skills and low literacy skills While the average literacy score across New Zealand provides a headline indicator, it is also important to understand the number of people with high and low skills.
Literacy scores in the Survey of Adult Skills are divided into six levels, ranging from below level 1 to level 5. People with high literacy scores are those who score 326, or level 4, or above. People at this level can:
» combine and synthesise information from multiple complex texts
» understand different competing ideas to form a conclusion about a specific piece of text.
People with low literacy skills are those who score below 226, or level 1 or below. People at this level:
» have basic vocabulary skills and understand the meaning of sentences
» can find short pieces of text within larger pieces of text when it is identical to what they are looking for
» may have difficulty deciphering competing information from the same text.
A full list of skill levels and what they mean is in the Appendix.
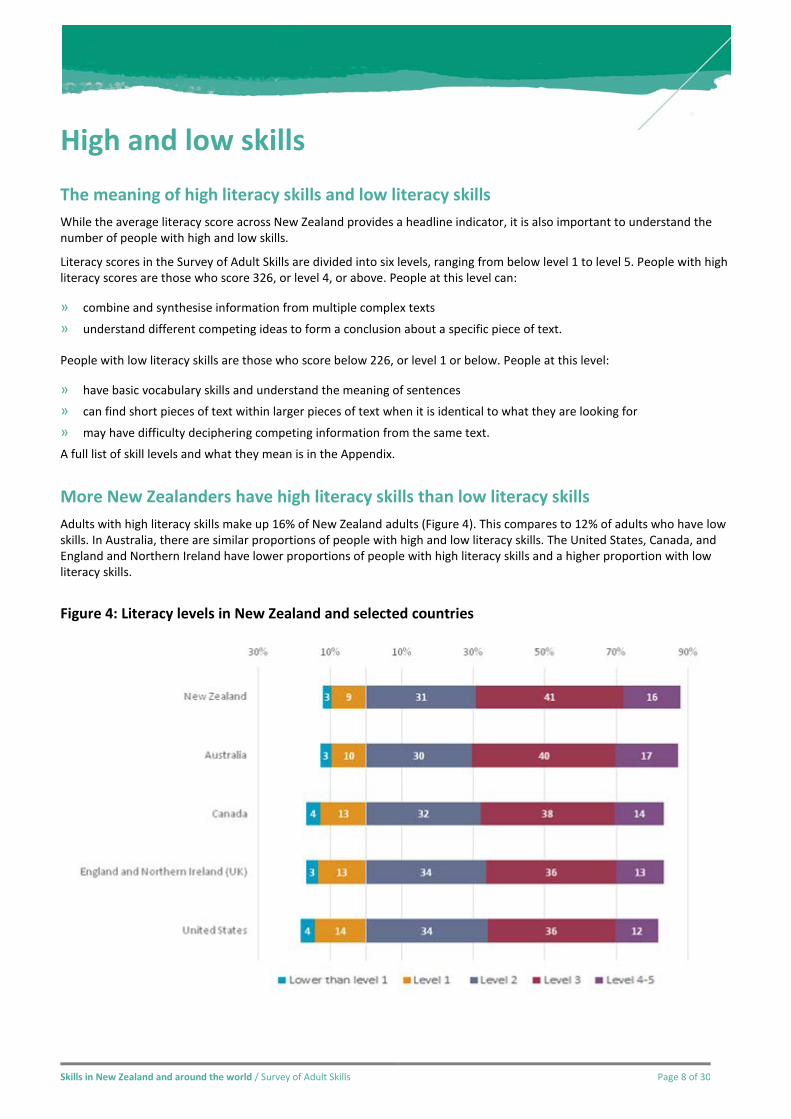
More New Zealanders have high literacy skills than low literacy skills Adults with high literacy skills make up 16% of New Zealand adults (Figure 4). This compares to 12% of adults who have low skills. In Australia, there are similar proportions of people with high and low literacy skills. The United States, Canada, and England and Northern Ireland have lower proportions of people with high literacy skills and a higher proportion with low literacy skills.
Figure 4: Literacy levels in New Zealand and selected countries
Skills in New Zealand and around the world / Survey of Adult Skills Page 9 of 30
The meaning of high numeracy skills and low numeracy skills Numeracy scores, like literacy scores in the Survey of Adult Skills are divided into six different levels, ranging from below level 1 to level 5. People with high numeracy scores are those who score 326, or level 4, or above. People at this level can:
» understand a broad range of complex mathematical information in unfamiliar contexts
» undertake tasks that have multiple steps
» understand quantities, statistics, chance, spatial relationships, proportions and formulas.
People with low numeracy skills are those who score below 226, or level 1 or below. People at this level can:
» carry out basic mathematical tasks in concrete situations
» undertake one-step processes
» understand situations where mathematical content is explicit with minimal text
» understand simple percentages such as 50%.
A full list of skill levels and what they mean is in the Appendix.
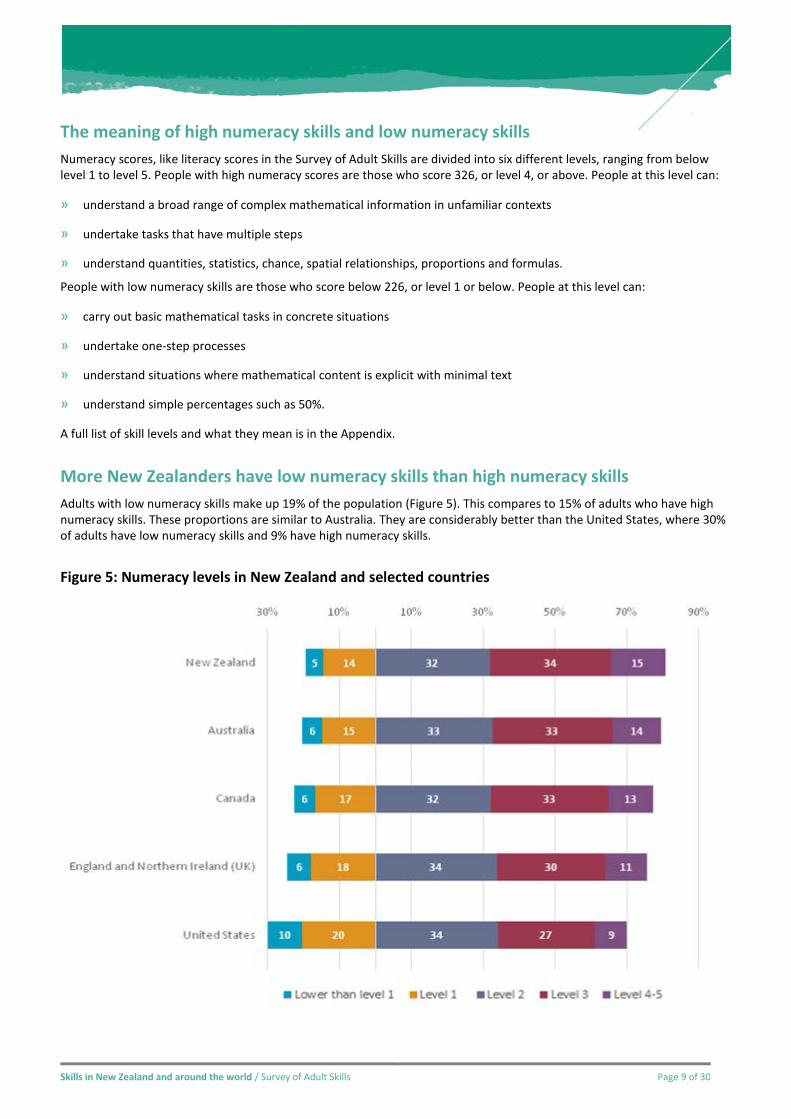
More New Zealanders have low numeracy skills than high numeracy skills Adults with low numeracy skills make up 19% of the population (Figure 5). This compares to 15% of adults who have high numeracy skills. These proportions are similar to Australia. They are considerably better than the United States, where 30% of adults have low numeracy skills and 9% have high numeracy skills.
Figure 5: Numeracy levels in New Zealand and selected countries

Skills in New Zealand and around the world / Survey of Adult Skills Page 10 of 30
The meaning of high problem solving skills and low problem solving skills Problem solving skills in the Survey of Adult Skills are divided differently from literacy and numeracy scores. The four skill levels begin at ‘below level 1’ and go to ‘level 3’. In addition to this, there are a number of people who are unable to complete basic computer tasks and were not tested on their problem solving skills.
People with moderate to high skills at problem solving in technology rich environments score 291, or ‘level 2’ or ’level 3’. People at this level can:
» use multiple applications to solve problems
» find relevant information in complex environments such as a large spreadsheet
» overcome unexpected impasses.
People with low skills at problem solving in technology rich environments score below ‘level 2’ and include those who:
» could not adequately use a computer to complete the survey or chose not to
» can do basic tasks using single functions
» can do simple tasks on standard applications such as filing emails.
New Zealand has the largest proportion of people with high problem solving skills In New Zealand, 55% of adults have low problem solving skills in technology rich environments (Figure 6). However, this is less than any other country selected in Figure 6. New Zealand also has 10% of adults in the highest category of level 3. This compares to 6% of Australians and 7% of Canadians.
Figure 6: Problem solving levels in New Zealand and selected countries
Skills in New Zealand and around the world / Survey of Adult Skills Page 11 of 30
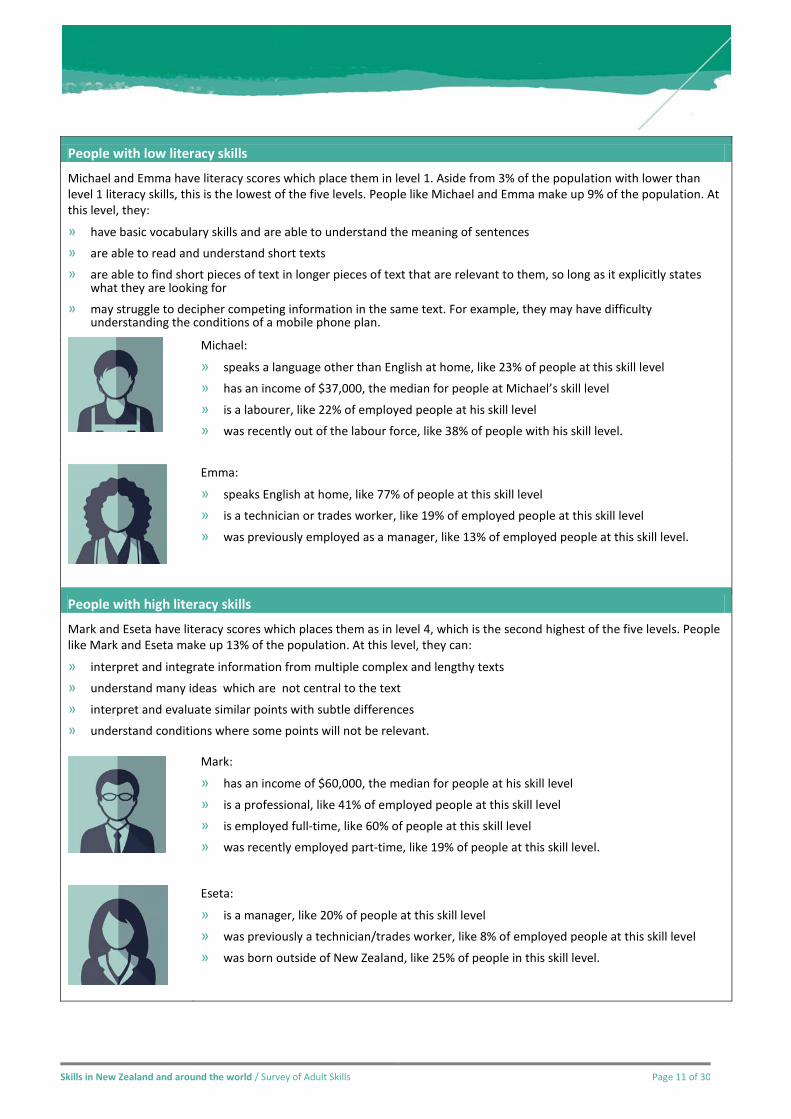
People with low literacy skills
Michael and Emma have literacy scores which place them in level 1. Aside from 3% of the population with lower than level 1 literacy skills, this is the lowest of the five levels. People like Michael and Emma make up 9% of the population. At this level, they:
» have basic vocabulary skills and are able to understand the meaning of sentences
» are able to read and understand short texts
» are able to find short pieces of text in longer pieces of text that are relevant to them, so long as it explicitly states what they are looking for
» may struggle to decipher competing information in the same text. For example, they may have difficulty understanding the conditions of a mobile phone plan.
Michael:
» speaks a language other than English at home, like 23% of people at this skill level
» has an income of $37,000, the median for people at Michael’s skill level
» is a labourer, like 22% of employed people at his skill level
» was recently out of the labour force, like 38% of people with his skill level.
Emma:
» speaks English at home, like 77% of people at this skill level
» is a technician or trades worker, like 19% of employed people at this skill level
» was previously employed as a manager, like 13% of employed people at this skill level.
People with high literacy skills
Mark and Eseta have literacy scores which places them as in level 4, which is the second highest of the five levels. People like Mark and Eseta make up 13% of the population. At this level, they can:
» interpret and integrate information from multiple complex and lengthy texts
» understand many ideas which are not central to the text
» interpret and evaluate similar points with subtle differences
» understand conditions where some points will not be relevant.
Mark:
» has an income of $60,000, the median for people at his skill level
» is a professional, like 41% of employed people at this skill level
» is employed full-time, like 60% of people at this skill level
» was recently employed part-time, like 19% of people at this skill level.
Eseta:
» is a manager, like 20% of people at this skill level
» was previously a technician/trades worker, like 8% of employed people at this skill level
» was born outside of New Zealand, like 25% of people in this skill level.
Skills in New Zealand and around the world / Survey of Adult Skills Page 12 of 30
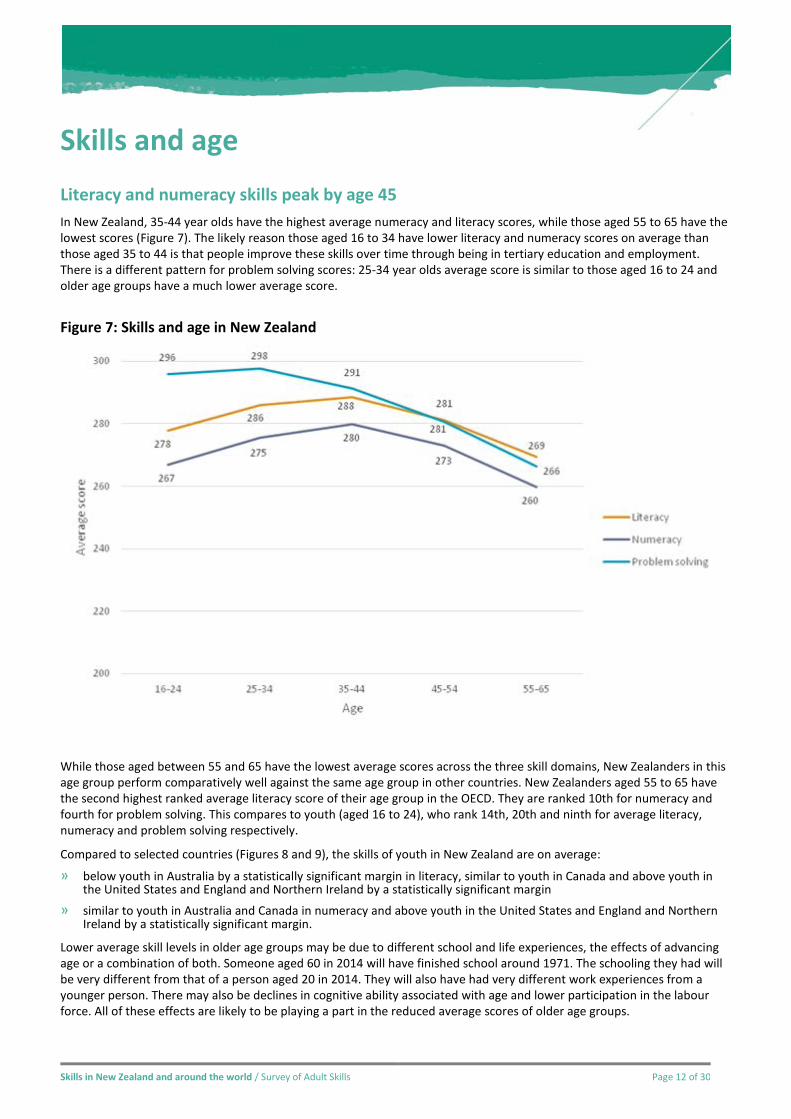
Skills and age Literacy and numeracy skills peak by age 45 In New Zealand, 35-44 year olds have the highest average numeracy and literacy scores, while those aged 55 to 65 have the lowest scores (Figure 7). The likely reason those aged 16 to 34 have lower literacy and numeracy scores on average than those aged 35 to 44 is that people improve these skills over time through being in tertiary education and employment. There is a different pattern for problem solving scores: 25-34 year olds average score is similar to those aged 16 to 24 and older age groups have a much lower average score.
Figure 7: Skills and age in New Zealand
While those aged between 55 and 65 have the lowest average scores across the three skill domains, New Zealanders in this age group perform comparatively well against the same age group in other countries. New Zealanders aged 55 to 65 have the second highest ranked average literacy score of their age group in the OECD. They are ranked 10th for numeracy and fourth for problem solving. This compares to youth (aged 16 to 24), who rank 14th, 20th and ninth for average literacy, numeracy and problem solving respectively.
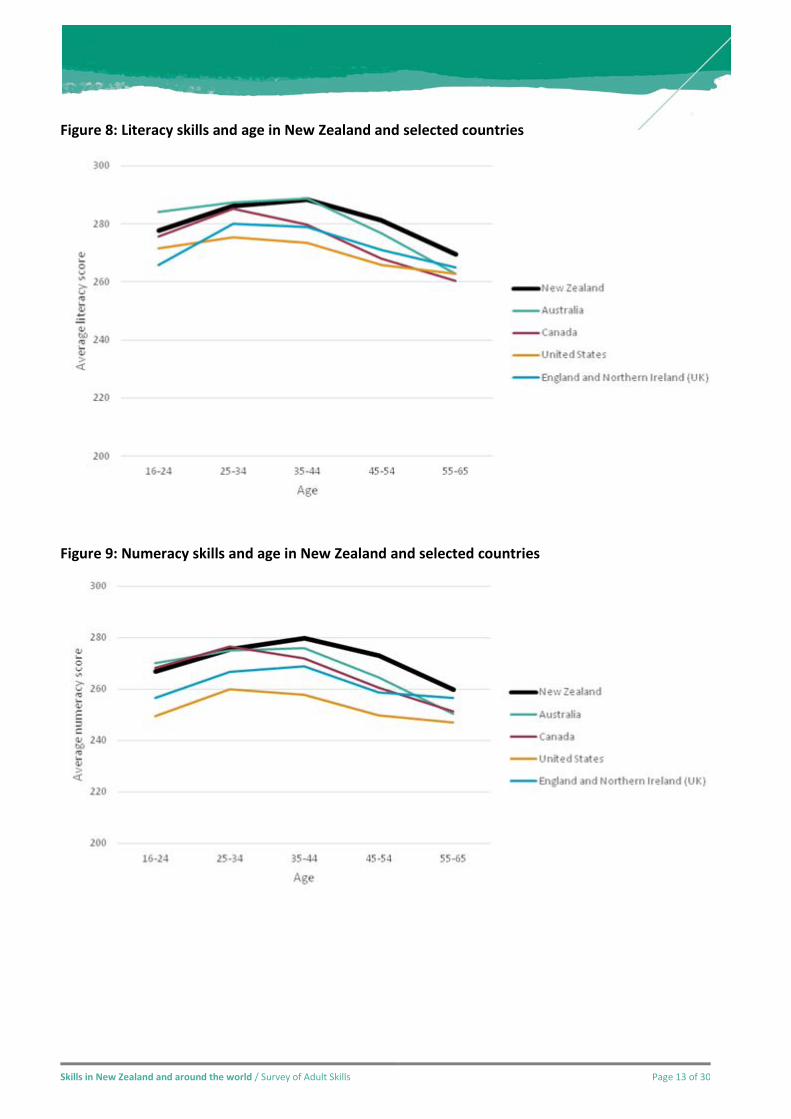
Compared to selected countries (Figures 8 and 9), the skills of youth in New Zealand are on average:
» below youth in Australia by a statistically significant margin in literacy, similar to youth in Canada and above youth in the United States and England and Northern Ireland by a statistically significant margin
» similar to youth in Australia and Canada in numeracy and above youth in the United States and England and Northern Ireland by a statistically significant margin.
Lower average skill levels in older age groups may be due to different school and life experiences, the effects of advancing age or a combination of both. Someone aged 60 in 2014 will have finished school around 1971. The schooling they had will be very different from that of a person aged 20 in 2014. They will also have had very different work experiences from a younger person. There may also be declines in cognitive ability associated with age and lower participation in the labour force. All of these effects are likely to be playing a part in the reduced average scores of older age groups.
Skills in New Zealand and around the world / Survey of Adult Skills Page 13 of 30
Figure 8: Literacy skills and age in New Zealand and selected countries
Figure 9: Numeracy skills and age in New Zealand and selected countries
Skills in New Zealand and around the world / Survey of Adult Skills Page 14 of 30
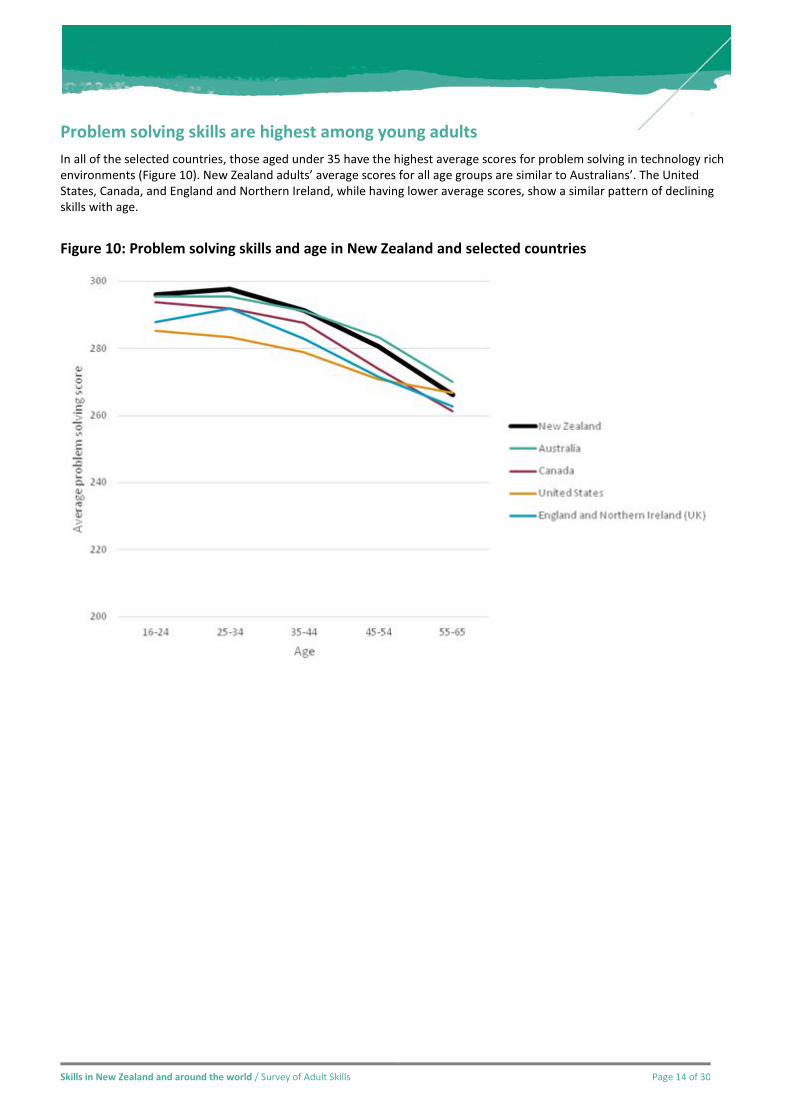
Problem solving skills are highest among young adults In all of the selected countries, those aged under 35 have the highest average scores for problem solving in technology rich environments (Figure 10). New Zealand adults’ average scores for all age groups are similar to Australians’. The United States, Canada, and England and Northern Ireland, while having lower average scores, show a similar pattern of declining skills with age.
Figure 10: Problem solving skills and age in New Zealand and selected countries
Skills in New Zealand and around the world / Survey of Adult Skills Page 15 of 30
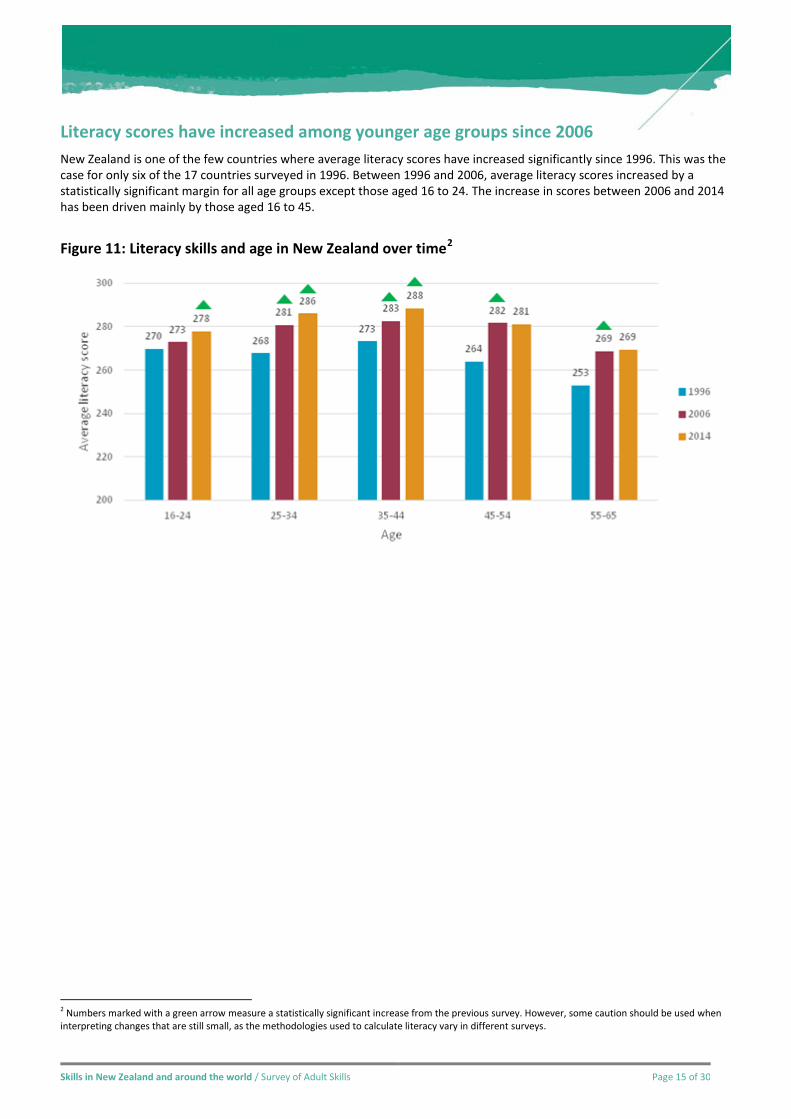
Literacy scores have increased among younger age groups since 2006 New Zealand is one of the few countries where average literacy scores have increased significantly since 1996. This was the case for only six of the 17 countries surveyed in 1996. Between 1996 and 2006, average literacy scores increased by a statistically significant margin for all age groups except those aged 16 to 24. The increase in scores between 2006 and 2014 has been driven mainly by those aged 16 to 45.
Figure 11: Literacy skills and age in New Zealand over time2
2 Numbers marked with a green arrow measure a statistically significant increase from the previous survey. However, some caution should be used when interpreting changes that are still small, as the methodologies used to calculate literacy vary in different surveys.
Skills in New Zealand and around the world / Survey of Adult Skills Page 16 of 30
People with low numeracy skills
Yang and Kirstin have numeracy scores at level 1. Aside from 5% of the population with lower than level 1 numeracy skills, this is the lowest of five levels. People like Yang and Kirstin make up 14% of the population. At this level they can:
» carry out tasks that involve counting, sorting and basic arithmetic, understand simple percentages (such as 50%) and understand simple graphs and spatial representations
» undertake tasks that have one or two steps where the mathematical content is obvious.
Yang:
» has an income of $36,400, the median for people at this skill level
» is employed as a labourer, like 21% of employed people at this skill level
» speaks English as a second language, like 27% of people at this skill level
» is employed full-time, like 43% of people at this skill level.
Kirstin:
» is a technical and trades worker, like 14% of employed people at this skill level
» was previously fulfilling domestic tasks, like 12% of people at this skill level
» is now working part-time, like 17% of people at this skill level
» was born in New Zealand, like 70% of people at this skill level.
People with high numeracy skills
Claire and Kevin have numeracy scores at level 4, which is the second highest of the five levels. People like Claire and Kevin make up 13% of the population. At this level they can:
» understand a broad range of complex mathematical information
» choose relevant problem solving strategies that are needed in unfamiliar contexts
» understand complex reasoning about quantities, statistics, chance, spatial relationships, formulas and proportions.
Claire:
» speaks a language other than English at home, like 8% of people at this skill level
» has an income of $67,000, the median for this skill level
» is a professional, like 40% of employed people at this skill level
» is employed full-time, like 40% of people at this skill level.
Kevin:
» is a manager, like 24% of employed people at this skill level
» was previously fulfilling domestic tasks, like 5% of people at this skill level
» was born overseas, like 30% of people at this skill level.
Skills in New Zealand and around the world / Survey of Adult Skills Page 17 of 30
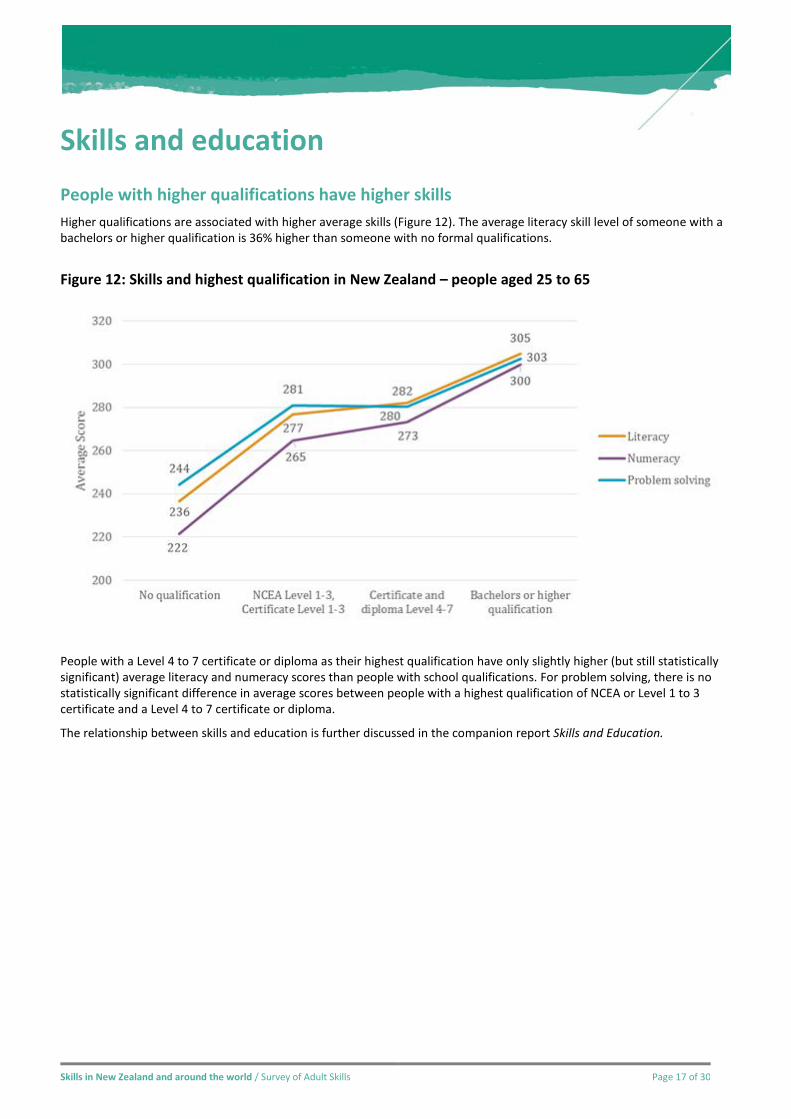
Skills and education People with higher qualifications have higher skills Higher qualifications are associated with higher average skills (Figure 12). The average literacy skill level of someone with a bachelors or higher qualification is 36% higher than someone with no formal qualifications.
Figure 12: Skills and highest qualification in New Zealand – people aged 25 to 65
People with a Level 4 to 7 certificate or diploma as their highest qualification have only slightly higher (but still statistically significant) average literacy and numeracy scores than people with school qualifications. For problem solving, there is no statistically significant difference in average scores between people with a highest qualification of NCEA or Level 1 to 3 certificate and a Level 4 to 7 certificate or diploma.
The relationship between skills and education is further discussed in the companion report Skills and Education.
Skills in New Zealand and around the world / Survey of Adult Skills Page 18 of 30
People with low problem solving skills
Stephen and Roshni have problem solving in technology rich environments at level 1. There are people who have lower skills in problem solving than this and people who were unable or chose not to do a test on a computer. People like Stephen and Roshni make up 31% of the population. Stephen and Roshni:
» can solve tasks that require a few steps on a computer
» can use simple reasoning to assign items to categories
» can use widely available and familiar computer applications, such as email and web browsers
» can solve problems where the goal is obvious
» may not be able to use functions that speed up a task, such as the sort function.
Stephen:
» is a technician or trades worker, like 14% of employed people at this skill level
» has an income of $45,000, the median at this skill level
» was born overseas, like 28% of people in this skill level.
Roshni:
» is retired, like 2% of people at this skill level
» was previously working as a clerical/administrative worker, like 14% of employed people at this skill level
» speaks English at home, like 87% of people at this skill level.
People with high problem solving skills
Hine and Jason have problem solving in technology rich environments at level 3. This is the highest level possible in problem solving. People like Hine and Jason make up 10% of the population. Hine and Jason can:
» use generic and more specific computer programs
» use different computer programs to solve a single problem
» ignore irrelevant information to reach a solution
» undertake tasks that require multiple steps without needing direction on what each step requires.
Hine:
» is a manager, like 19% of employed people at this skill level
» has an income of $56,000, the median for this skill level
» was born in New Zealand, like 73% of people at this skill level
» speaks English at home, like 93% of the population at this skill level.
Jason:
» was recently a student, like 16% of people at this skill level
» is now a professional, like 38% of employed people at this skill level
» works in the education and training industry, like 13% of people at this level.
Skills in New Zealand and around the world / Survey of Adult Skills Page 19 of 30
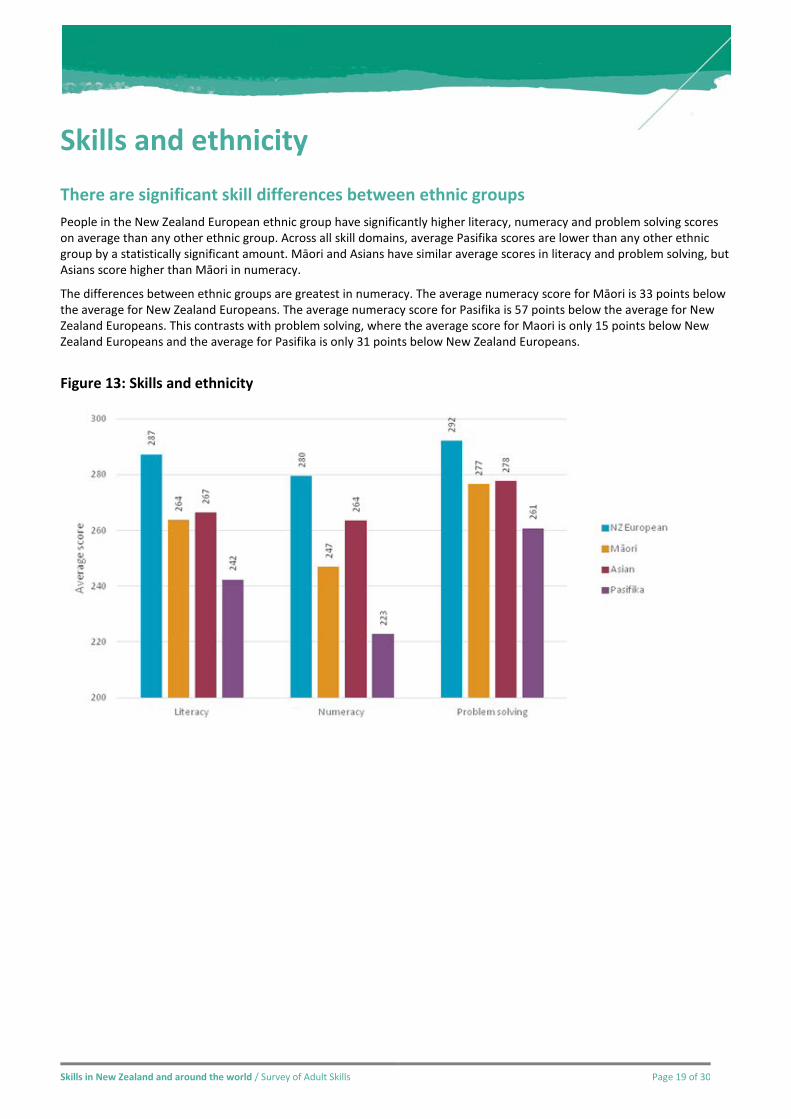
Skills and ethnicity There are significant skill differences between ethnic groups People in the New Zealand European ethnic group have significantly higher literacy, numeracy and problem solving scores on average than any other ethnic group. Across all skill domains, average Pasifika scores are lower than any other ethnic group by a statistically significant amount. Māori and Asians have similar average scores in literacy and problem solving, but Asians score higher than Māori in numeracy.
The differences between ethnic groups are greatest in numeracy. The average numeracy score for Māori is 33 points below the average for New Zealand Europeans. The average numeracy score for Pasifika is 57 points below the average for New Zealand Europeans. This contrasts with problem solving, where the average score for Maori is only 15 points below New Zealand Europeans and the average for Pasifika is only 31 points below New Zealand Europeans.
Figure 13: Skills and ethnicity
Skills in New Zealand and around the world / Survey of Adult Skills Page 20 of 30
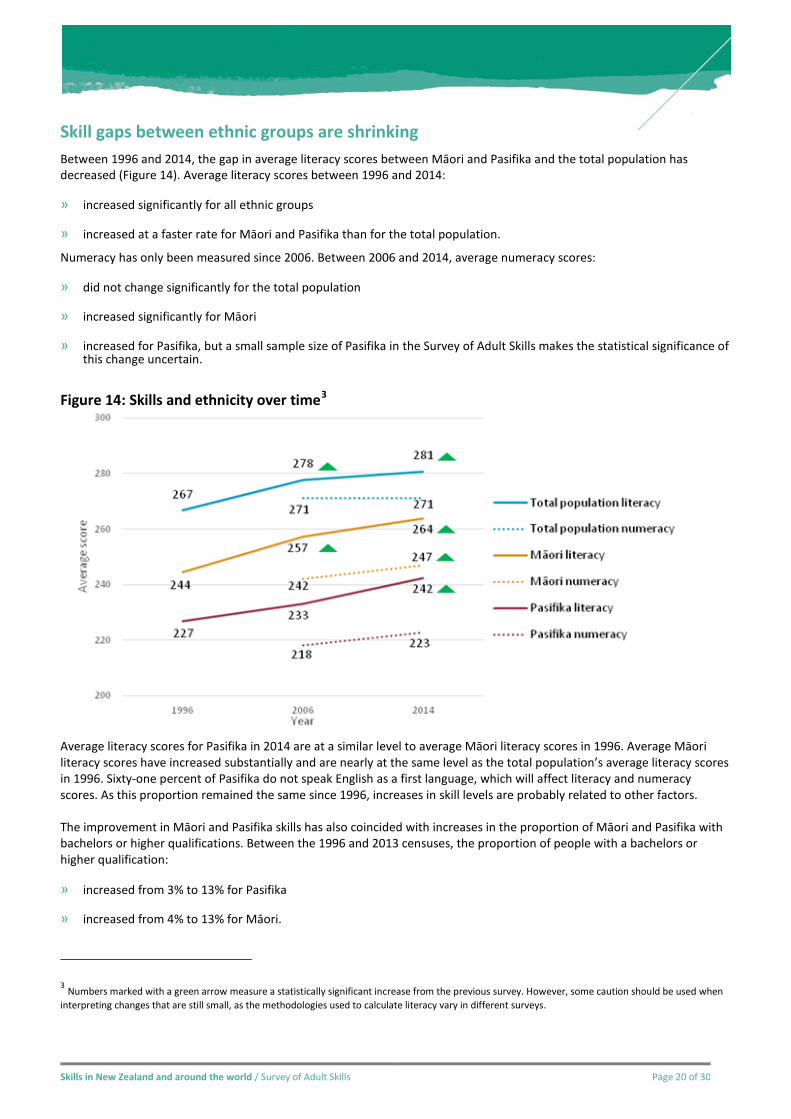
Skill gaps between ethnic groups are shrinking Between 1996 and 2014, the gap in average literacy scores between Māori and Pasifika and the total population has decreased (Figure 14). Average literacy scores between 1996 and 2014:
» increased significantly for all ethnic groups
» increased at a faster rate for Māori and Pasifika than for the total population.
Numeracy has only been measured since 2006. Between 2006 and 2014, average numeracy scores:
» did not change significantly for the total population
» increased significantly for Māori
» increased for Pasifika, but a small sample size of Pasifika in the Survey of Adult Skills makes the statistical significance of this change uncertain.
Figure 14: Skills and ethnicity over time3
Average literacy scores for Pasifika in 2014 are at a similar level to average Māori literacy scores in 1996. Average Māori literacy scores have increased substantially and are nearly at the same level as the total population’s average literacy scores in 1996. Sixty-one percent of Pasifika do not speak English as a first language, which will affect literacy and numeracy scores. As this proportion remained the same since 1996, increases in skill levels are probably related to other factors.
The improvement in Māori and Pasifika skills has also coincided with increases in the proportion of Māori and Pasifika with bachelors or higher qualifications. Between the 1996 and 2013 censuses, the proportion of people with a bachelors or higher qualification:
» increased from 3% to 13% for Pasifika
» increased from 4% to 13% for Māori.
3 Numbers marked with a green arrow measure a statistically significant increase from the previous survey. However, some caution should be used when interpreting changes that are still small, as the methodologies used to calculate literacy vary in different surveys.
Skills in New Zealand and around the world / Survey of Adult Skills Page 21 of 30
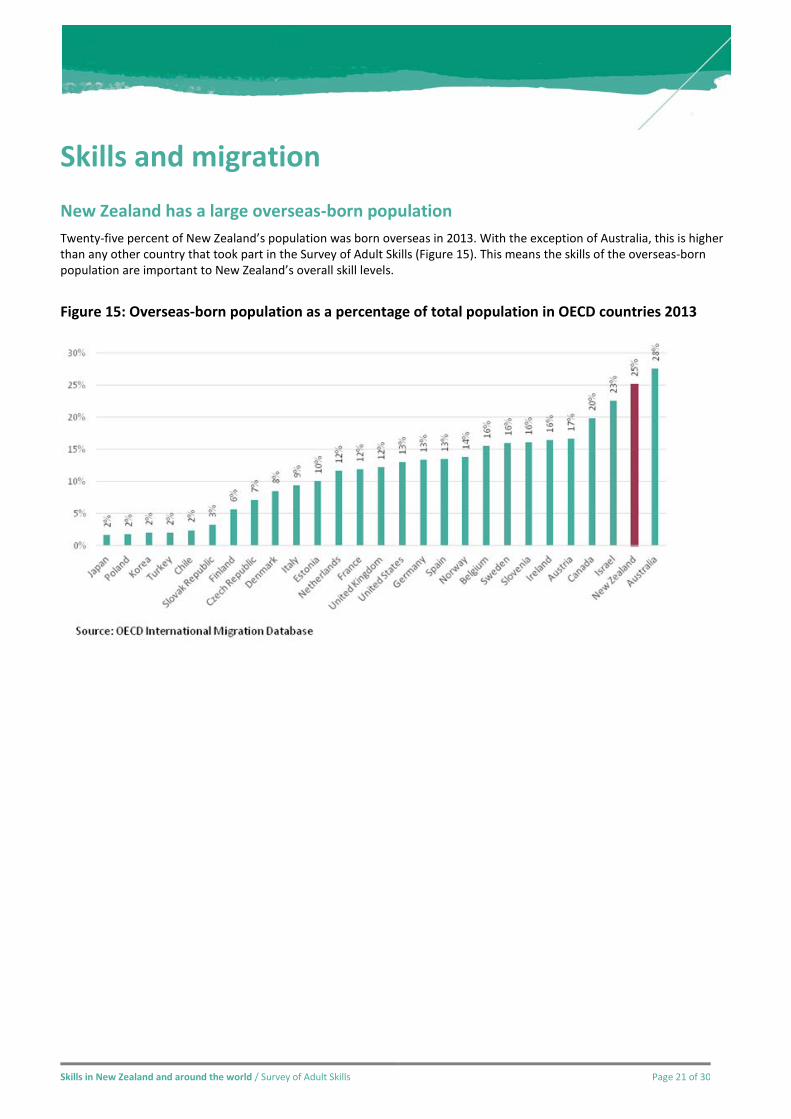
Skills and migration New Zealand has a large overseas-born population Twenty-five percent of New Zealand’s population was born overseas in 2013. With the exception of Australia, this is higher than any other country that took part in the Survey of Adult Skills (Figure 15). This means the skills of the overseas-born population are important to New Zealand’s overall skill levels.
Figure 15: Overseas-born population as a percentage of total population in OECD countries 2013

Skills in New Zealand and around the world / Survey of Adult Skills Page 22 of 30
Overseas-born people with English as a first language have higher skills than New Zealand-born Overseas-born New Zealanders who speak English as a first language have higher average skills in literacy, numeracy and problem solving than people born in New Zealand (Figure 16). However, the overseas-born population as a whole has lower average scores in all three skill domains. This is because overseas-born New Zealanders who speak English as a second language have lower average skills in literacy, numeracy and problem solving than people born in New Zealand. It is important to note that in New Zealand the Survey of Adult Skills is conducted in English. People who speak English as a second language may have been able to score higher if they took the test in their own language.
The difference in average scores between people born in New Zealand and people born overseas who speak English as a second language is greatest in literacy. The difference is also large in numeracy. The likely reason for the large difference in numeracy is that the questions include significant amounts of English text.
Figure 16: Skills of New Zealand-born and overseas-born population
Skills in New Zealand and around the world / Survey of Adult Skills Page 23 of 30
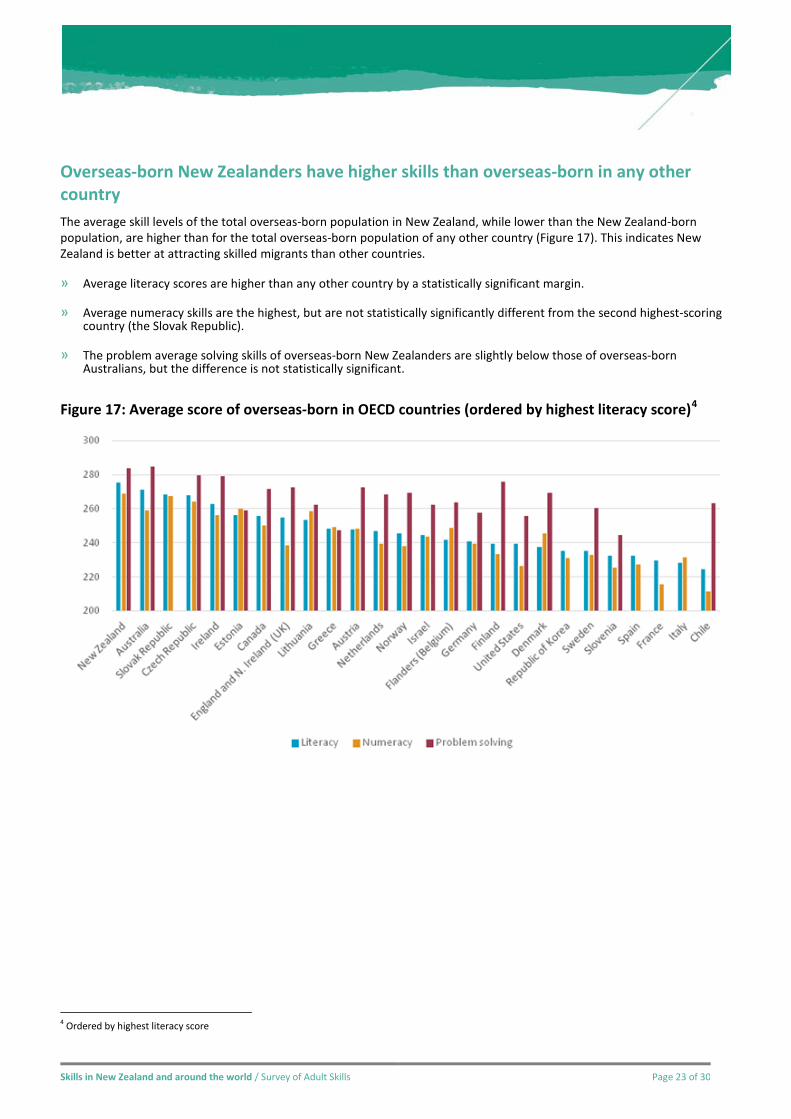
Overseas-born New Zealanders have higher skills than overseas-born in any other country The average skill levels of the total overseas-born population in New Zealand, while lower than the New Zealand-born population, are higher than for the total overseas-born population of any other country (Figure 17). This indicates New Zealand is better at attracting skilled migrants than other countries.
» Average literacy scores are higher than any other country by a statistically significant margin.
» Average numeracy skills are the highest, but are not statistically significantly different from the second highest-scoring country (the Slovak Republic).
» The problem average solving skills of overseas-born New Zealanders are slightly below those of overseas-born Australians, but the difference is not statistically significant.
Figure 17: Average score of overseas-born in OECD countries (ordered by highest literacy score)4
4 Ordered by highest literacy score
Skills in New Zealand and around the world / Survey of Adult Skills Page 24 of 30
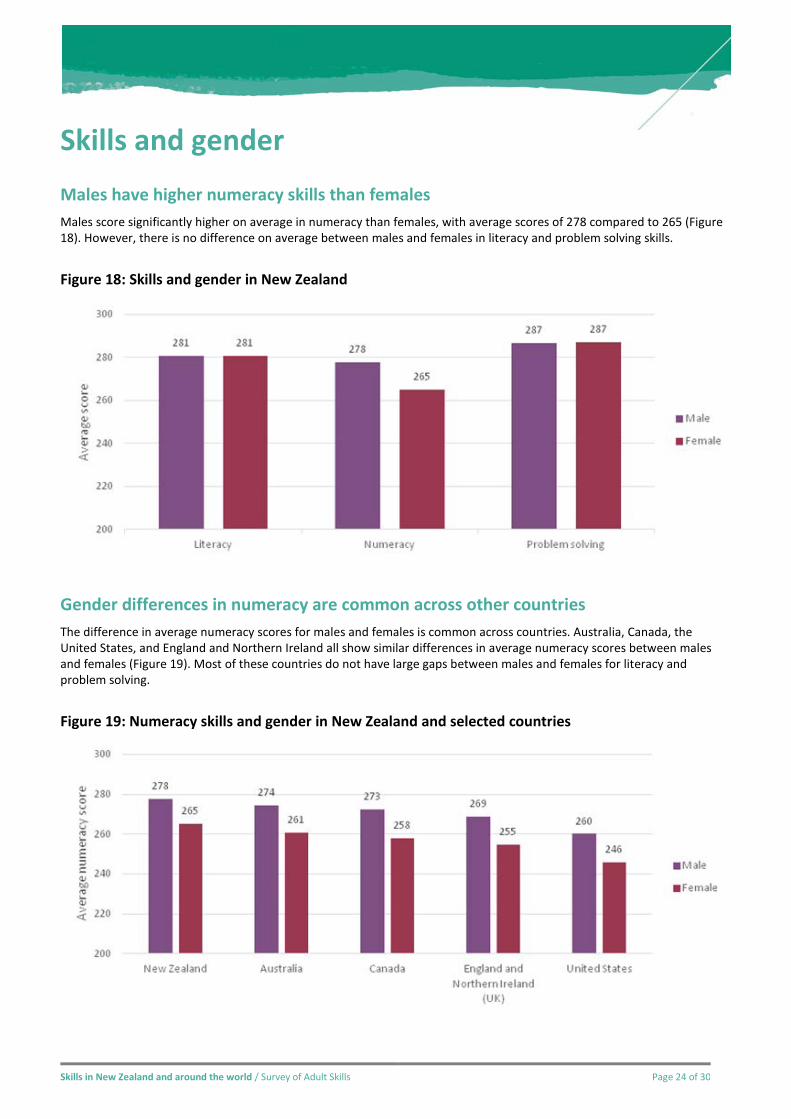
Skills and gender Males have higher numeracy skills than females Males score significantly higher on average in numeracy than females, with average scores of 278 compared to 265 (Figure 18). However, there is no difference on average between males and females in literacy and problem solving skills.
Figure 18: Skills and gender in New Zealand
Gender differences in numeracy are common across other countries The difference in average numeracy scores for males and females is common across countries. Australia, Canada, the United States, and England and Northern Ireland all show similar differences in average numeracy scores between males and females (Figure 19). Most of these countries do not have large gaps between males and females for literacy and problem solving.
Figure 19: Numeracy skills and gender in New Zealand and selected countries
Skills in New Zealand and around the world / Survey of Adult Skills Page 25 of 30
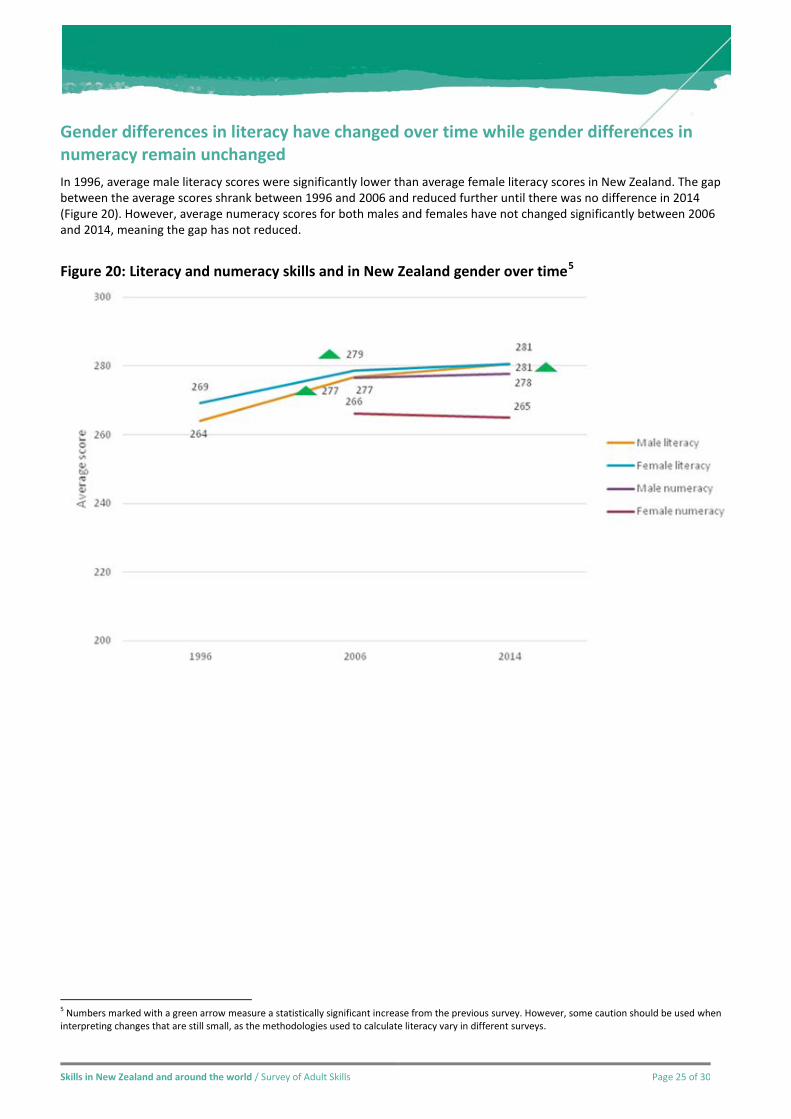
Gender differences in literacy have changed over time while gender differences in numeracy remain unchanged In 1996, average male literacy scores were significantly lower than average female literacy scores in New Zealand. The gap between the average scores shrank between 1996 and 2006 and reduced further until there was no difference in 2014 (Figure 20). However, average numeracy scores for both males and females have not changed significantly between 2006 and 2014, meaning the gap has not reduced.
Figure 20: Literacy and numeracy skills and in New Zealand gender over time5
5 Numbers marked with a green arrow measure a statistically significant increase from the previous survey. However, some caution should be used when interpreting changes that are still small, as the methodologies used to calculate literacy vary in different surveys.
Skills in New Zealand and around the world / Survey of Adult Skills Page 26 of 30
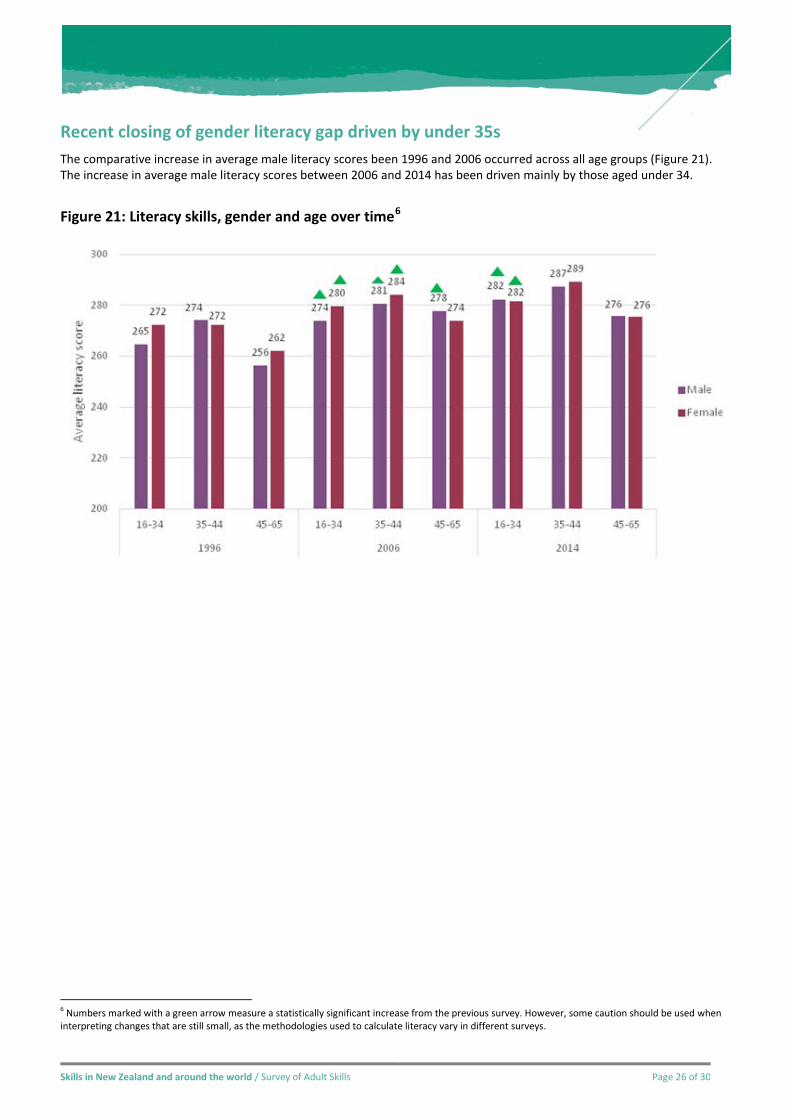
Recent closing of gender literacy gap driven by under 35s The comparative increase in average male literacy scores been 1996 and 2006 occurred across all age groups (Figure 21). The increase in average male literacy scores between 2006 and 2014 has been driven mainly by those aged under 34.
Figure 21: Literacy skills, gender and age over time6
6 Numbers marked with a green arrow measure a statistically significant increase from the previous survey. However, some caution should be used when interpreting changes that are still small, as the methodologies used to calculate literacy vary in different surveys.
Skills in New Zealand and around the world / Survey of Adult Skills Page 27 of 30
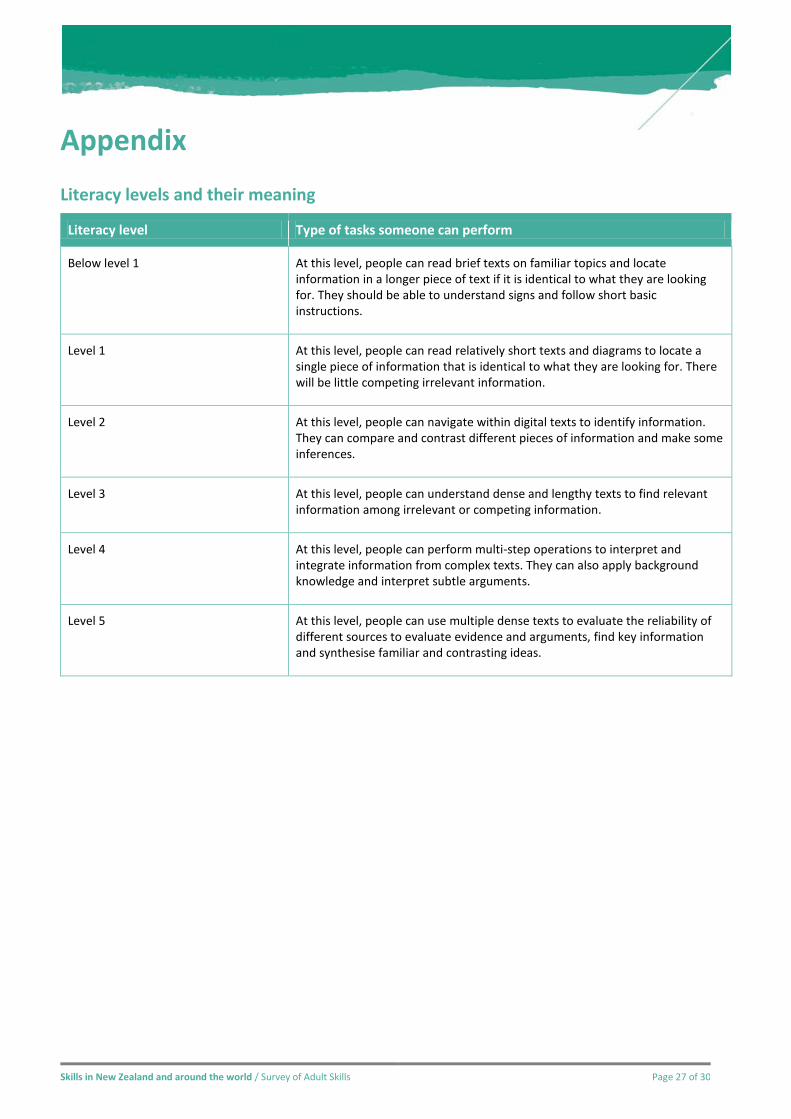
Appendix Literacy levels and their meaning
Literacy level Type of tasks someone can perform
Below level 1 At this level, people can read brief texts on familiar topics and locate information in a longer piece of text if it is identical to what they are looking for. They should be able to understand signs and follow short basic instructions.
Level 1 At this level, people can read relatively short texts and diagrams to locate a single piece of information that is identical to what they are looking for. There will be little competing irrelevant information.
Level 2 At this level, people can navigate within digital texts to identify information. They can compare and contrast different pieces of information and make some inferences.
Level 3 At this level, people can understand dense and lengthy texts to find relevant information among irrelevant or competing information.
Level 4 At this level, people can perform multi-step operations to interpret and integrate information from complex texts. They can also apply background knowledge and interpret subtle arguments.
Level 5 At this level, people can use multiple dense texts to evaluate the reliability of different sources to evaluate evidence and arguments, find key information and synthesise familiar and contrasting ideas.
Skills in New Zealand and around the world / Survey of Adult Skills Page 28 of 30
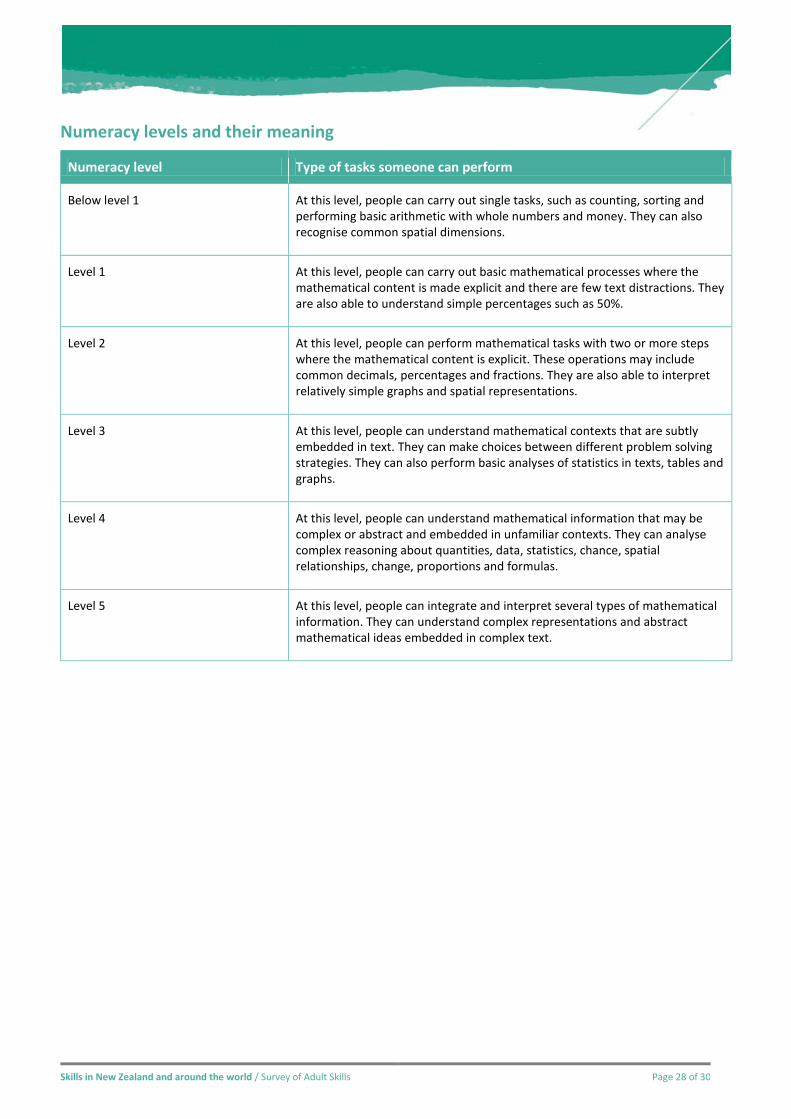
Numeracy levels and their meaning
Numeracy level Type of tasks someone can perform
Below level 1 At this level, people can carry out single tasks, such as counting, sorting and performing basic arithmetic with whole numbers and money. They can also recognise common spatial dimensions.
Level 1 At this level, people can carry out basic mathematical processes where the mathematical content is made explicit and there are few text distractions. They are also able to understand simple percentages such as 50%.
Level 2 At this level, people can perform mathematical tasks with two or more steps where the mathematical content is explicit. These operations may include common decimals, percentages and fractions. They are also able to interpret relatively simple graphs and spatial representations.
Level 3 At this level, people can understand mathematical contexts that are subtly embedded in text. They can make choices between different problem solving strategies. They can also perform basic analyses of statistics in texts, tables and graphs.
Level 4 At this level, people can understand mathematical information that may be complex or abstract and embedded in unfamiliar contexts. They can analyse complex reasoning about quantities, data, statistics, chance, spatial relationships, change, proportions and formulas.
Level 5 At this level, people can integrate and interpret several types of mathematical information. They can understand complex representations and abstract mathematical ideas embedded in complex text.
Skills in New Zealand and around the world / Survey of Adult Skills Page 29 of 30
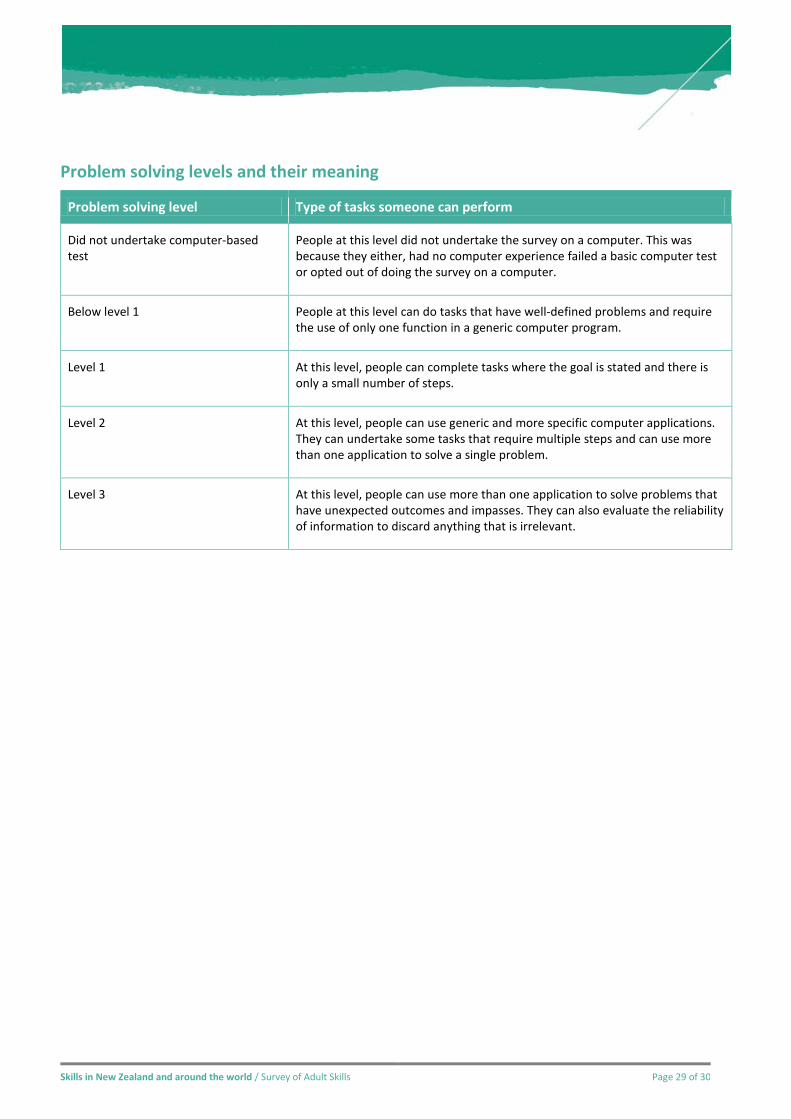
Problem solving levels and their meaning
Problem solving level Type of tasks someone can perform
Did not undertake computer-based test
People at this level did not undertake the survey on a computer. This was because they either, had no computer experience failed a basic computer test or opted out of doing the survey on a computer.
Below level 1 People at this level can do tasks that have well-defined problems and require the use of only one function in a generic computer program.
Level 1 At this level, people can complete tasks where the goal is stated and there is only a small number of steps.
Level 2 At this level, people can use generic and more specific computer applications. They can undertake some tasks that require multiple steps and can use more than one application to solve a single problem.
Level 3 At this level, people can use more than one application to solve problems that have unexpected outcomes and impasses. They can also evaluate the reliability of information to discard anything that is irrelevant.