Embed Size (px)
Citation preview

Skills, Education, and the Rise of Earnings Inequality Among the
“Other 99 Percent”
David AutorMIT Department of Economics and NBER
SNS Seminar, Stockholm 28 August 2015

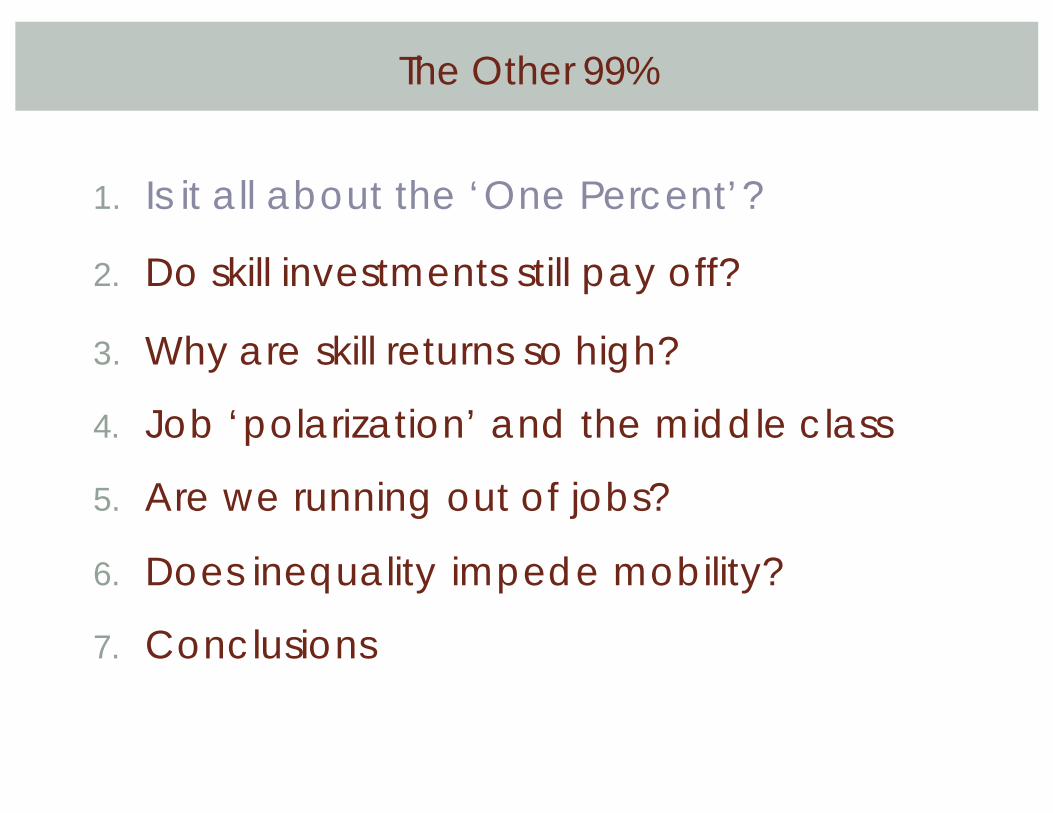
The Other 99%
1. Is it all about the ‘One Percent’?
2. Do skill investments still pay off?
3. Why are skill returns so high?
4. Job ‘polarization’ and the middle class
5. Are we running out of jobs?
6. Does inequality impede mobility?
7. Conclusions

0%
5%
10%
15%
20%
25%19
13
1918
1923
1928
1933
1938
1943
1948
1953
1958
1963
1968
1973
1978
1983
1988
1993
1998
2003
Shar
e of
tota
l inc
ome
accr
uing
to e
ach
grou
p
Figure 2. Decomposing the Top Decile US Income Share into three Groups, 1913–2007Atkinson, Piketty, Saez 2011
Concentration of U.S. Incomes has Risen Dramatically Since the Late 1970s
Top 1% (incomes above $398,900 in 2007)
Top 5–1% (incomes between $155,400 and $398,900)
Top 10–5% (incomes between $109,600 and $155,400)

Comparison of U.S., Canada, Spain, Sweden and Finland
Figure 7. Effect of Capital Gains on Share of Top Percentile, 1949–2006Atkinson, Piketty, Saez 2011
0
5
10
15
20
2519
49
1953
1957
1961
1965
1969
1973
1977
1981
1985
1989
1993
1997
2001
2005
Shar
e in
tota
l inc
ome
ofto
p pe
rcen
tile
(in p
erce
nt)
U.S.
Canada
Spain
Sweden
Finland
U.S. with CGs
Canada with CGs
Spain with CGs
Sweden with CGs
Finland with CGs

Median Earnings Gap b/w College & High School Roughly Doubles between 1979and 2012
College/high school median annual earnings gap, 1979–2012In constant 2012 dollars
0
10,000
30,000
20,000
40,000
50,000
60,000
70,000 dollars
1979 1982 1985 1988 1991 1994 1997 2000 2003 2006 2009 2012
Household gap$30,298 to $58,249
Male gap$17,411 to $34,969
Female gap$12,887 to $23,280
Autor, 2014
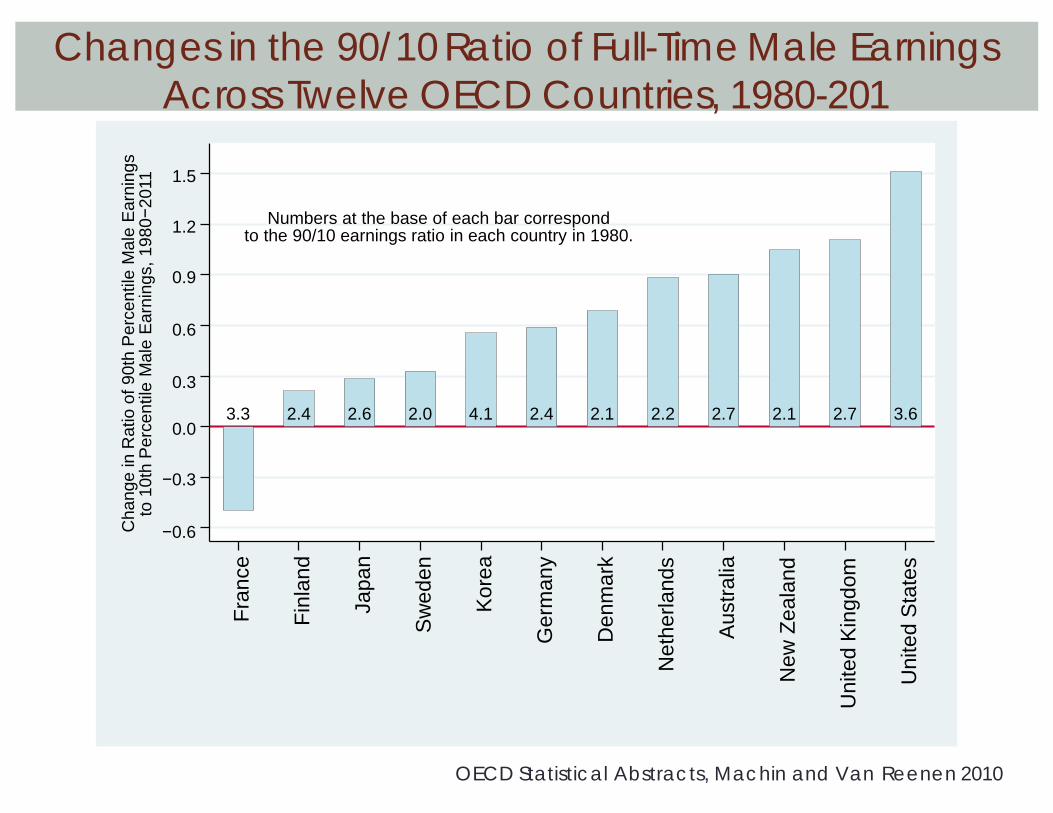
Changes in the 90/10Ratio of Full-Time Male Earnings Across Twelve OECD Countries, 1980-201
3.3 2.4 2.6 2.0 4.1 2.4 2.1 2.2 2.7 2.1 2.7 3.6
Numbers at the base of each bar correspondto the 90/10 earnings ratio in each country in 1980.
−0.3
−0.6
0.0
0.9
0.6
0.3
1.2
1.5
Cha
nge
in R
atio
of 9
0th
Per
cent
ile M
ale
Ear
ning
s to
10t
h P
erce
ntile
Mal
e E
arni
ngs,
198
0−20
11
Fran
ce
Finl
and
Japa
n
Sw
eden
Kor
ea
Ger
man
y
Den
mar
k
Net
herla
nds
Aus
tralia
New
Zeal
and
Uni
ted
Kin
gdom
Uni
ted
Sta
tes
OECD Statistical Abstracts, Machin and Van Reenen 2010
The Other 99%
1. Is it all about the ‘One Percent’?
2. Do skill investments still pay off?
3. Why are skill returns so high?
4. Job ‘polarization’ and the middle class
5. Are we running out of jobs?
6. Does inequality impede mobility?
7. Conclusions

U.S. Has Very High Returns to Skill Relative to Other Industrialized Countries
C ro s s -n a t io n a l d if fe re n c e s in wa g e re t u r n st o s k il ls , 2 0 11– 2 0 13P e rc e n t a g e in c re a s e fo r a o n e s t a n d a rd d e v ia t io ni n c re a s e i n s k i l l
0 5 1 0 15 2 0 2 5 3 0 p e rc e n t
S w e d e nC z e c h R .
N o r w a yI t a l y
D e n m a r kC y p r u s
F i n l a n dB e l g i u m
F r a n c eE s t o n i a
S l o v a k R .A u s t r i aN e t h e r l a n d s
J a p a nP o l a n d
C a n a d aK o r e a U . K .
S p a i n G e r m a n y
I r e l a n dU . S .
E a r n i n g sg a i n
9 5 % c o n f id e n c ein t e r v a l
Autor, 2014

Inclusive of Tuition, College in the U.S. is a Better Investment Now Than it Was 50 Years Ago
Avery and Turner, 2012
213K
368K
261K
385K
439K
582K 590K
129K
198K
138K
225K
284K
387K 370K
Present discounted value of college relative to high school degreenet of tuition, 1965–2008College/high school difference, 2009 dollars
100,000
0
200,000
300,000
400,000
500,000
600,000 dollars
1965 1970 1975 1980 1985 1990 1995 2000 2005 2010
Men
Women

The Other 99%
1. Is it all about the ‘One Percent’?
2. Do skill investments still pay off?
3. Why are skill returns so high?
4. Job ‘polarization’ and the middle class
5. Are we running out of jobs?
6. Does inequality impede mobility?
7. Conclusions

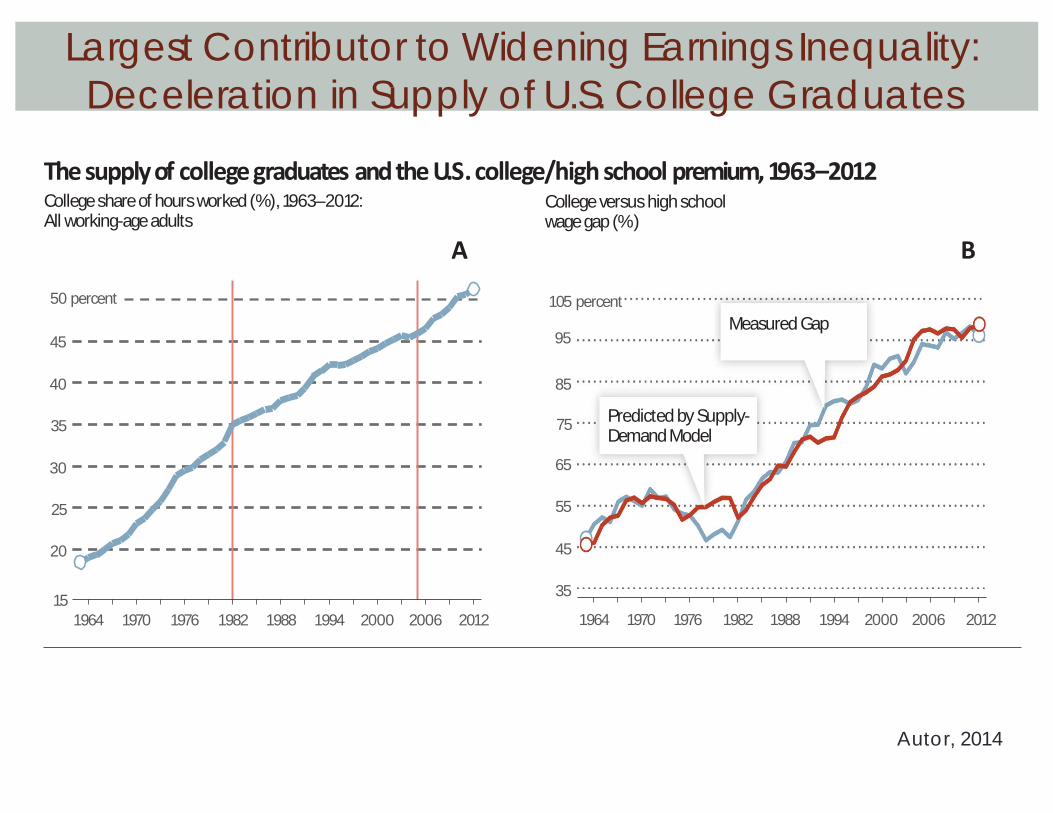
Largest Contributor to Widening Earnings Inequality: Deceleration in Supply of U.S. College Graduates
1520
2530
3540
4550
5560
65Co
llege
shar
eofh
ours
worke
d(%
)
1964 1967 1970 1973 1976 1979 1982 1985 1988 1991 1994 1997 2000 2003 2006 2009 2012
Males: 0-9 Yrs Experience Females: 0-9 Yrs Experience
Autor, 2014
1982 2005
Males
Females
Largest Contributor to Widening Earnings Inequality: Deceleration in Supply of U.S. College Graduates
Autor, 2014
15
20
25
30
35
40
45
50 percent
1964 1970 1976 1982 1988 1994 2000 2006 2012
35
45
55
65
75
85
95
105 percent
1964 1970 1976 1982 1988 1994 2000 2006 2012
The supplyof collegegraduates andthe U.S.college/high school premium,1963–2012Collegeshareofhoursworked(%),1963–2012:All working-ageadults
Collegeversus highschoolwagegap(%)
BA
PredictedbySupply-DemandModel
MeasuredGap

The Other 99%
1. Is it all about the ‘One Percent’?
2. Do skill investments still pay off?
3. Why are skill returns so high?
4. Job ‘polarization’ and the middle class
5. Are we running out of jobs?
6. Does inequality impede mobility?
7. Conclusions

Tacit versus Explicit Knowledge
Michael Polanyi, The Tacit Dimension, 1966“We can know more than we can tell... The skill of a driver cannot be replacedby a thorough schooling in the theoryof the motorcar; the knowledge I have of my own body differs altogether from the knowledge of its physiology.”
Two implications of Polanyi’s Paradox – One technical, one economic1. (Technical)Cannot automate what we don’t explicitly
understand2. (Economic)Tasks that are not substituted by machinesare
typically complemented by machines

EmploymentPolarization inthe U.S: Changes in Employmentby MajorOccupationalCategory,1979–2012
Auto
r,2015
40
30
20
10
0
−10
−20
100
×lo
gC
han
gein
Em
ploy
men
t1979–1989 1989–1999 1999–2007 2007–2012

−.1
0
.1
100
×C
hang
e in
Em
ploy
men
t Sh
are
0 20 40 60 80 100
SmoothedChanges in U.S. Employment by OccupationalSkil Percentile,1979–2012
Auto
r,2015
1979–1989 1989–1999 1999–2007 2007–2012

EmploymentPolarization inSixteen EuropeanUnionCountries,1993 - 2010
Go
os,M
anning
and
Salo
mo
ns,2014
-14.9%
-12.1% -12.0%-10.9% -10.8% -10.7% -10.6% -10.6% -10.4% -10.3% -9.6%
-8.6% -8.5%-7.6%
-6.7%
-4.9%
-18%
-15%
-12%
-9%
-6%
15%
12%
9%
6%
3%
0%
-3%
18%Low Paying MiddlePaying HighPaying

Factors that Shape Impact ofAutomation on Workers’ Earnings
1. Substitution versus complementarity• Workersbenefit if their job tasks are complemented, but not
if tasks are substituted. Greattime to be a CADD operator, bad time to be a paper and pencildraftsperson.
2. Elasticity of final demand• Can either dampen or amplify the gains from automation.
Thinkof agriculture versus health care.
3. Labor supply elasticity• Can mitigate wage gains. Why wages don’t rise rapidly in food
service and hair cutting…
4. Relevance:• Abstracttask-intensiveversus Manual task-intensive jobs

20
15
10
5
0
−5
100
×Lo
gC
hang
ein
Mea
nFT
FYW
age
0 20 40 60 80Skillpercentile (rankedbyoccupation’s1979meanlogwage)
100
SmoothedChanges in U.S. MeanWages by OccupationalSkil Percentile,1979–2012
Auto
r,2015
1979–1989 1989–1999 1999–2007 2007–2012

ATM Deployment and Bank Teller Employment, 1970– 2010
Dispensing jobsAs more ATMs were installed in the United States, the numberof tellers employed did not drop.(thousands) 700
Sources: Ruggles and others, Integrated Public Use Microdata Series: Version 5.0; Bureau ofLabor Statistics, Occupational Employment Survey; and Bank for International Settlements,Committee on Payment and Settlement Systems, various publications.
Bessen, 2015
200
100
01970
80 90 200010
Tellers employedATMs installed
600
500
400
300

The Other 99%
1. Is it all about the ‘One Percent’?
2. Do skill investments still pay off?
3. Why are skill returns so high?
4. Job ‘polarization’ and the middle class
5. Are we running out of jobs?
6. Does inequality impede mobility?
7. Conclusions

The ‘ProductivityProblem’ of 1964
1964: PresidentJohnson establishes“Blue-RibbonNational Commission on Technology, Automation, and Economic Progress”
The Milwaukee-Matic industrial machining tool, 1963

The Future of Polanyi’s Paradox
• Computerization has progressed…• Driving vehicles• Parsing legal documents• Performing agricultural field labor.
• Polanyi’s paradox remains relevant central…• Explain what has not yet been accomplished
• Illuminates the contours of the technological frontier
• Overcoming Polanyi’s Paradox1. Environmental Control:
• Bows to Polanyi’s paradox2. Machine Learning
• Attempts an end-run around it

EnvironmentalControl --Kiva SystemsOrderFulfilment: RoboticDrive Units Move Shelves to Workers for Picking

Kiva-Worker Interaction:GuidedbyLaser Pointer,Worker Picks Items from Shelvesfor Shipping

Machine Learning
• Machine learning• Inductive reasoning versus procedural programming
• Problem• Cannot program a machine to “simulate” a non-routine
task by following a scripted procedure
• Solution• Program a machine to master the task autonomously by
studying successful examples of the task being carried out by others

Imagesof CatsSuccessfulyRecognizedbyGoogle X Labs Team, Using a NeuralNetworkof 16,000 Processors
Le, Ranzato, Moga, Devin, Chen, Corrado, Dean and Ng, 2012

The Other 99%
1. Is it all about the ‘One Percent’?
2. Do skill investments still pay off?
3. Why are skill returns so high?
4. Job ‘polarization’ and the middle class
5. Are we running out of jobs?
6. Does inequality impede mobility?
7. Conclusions

1.0
1.2
1.4
1.6
1.8
2.0
1964 1968 1972 1976 1980 1984 1988 1992 1996 200020042008 2012
Some college
>Bachelor's degree
Bachelor's degree
High schoolgraduate
High schooldropout
)BA
Changes in real wage levels of full-time U.S. workers by sex and education, 1963–2012Real weekly earnings relative to 1963 (men) Real weekly earnings relative to1963 (women
1964 1968 1972 1976 1980 1984 1988 1992 1996 200020042008 2012
1.0
1.2
1.4
1.6
1.8
2.0
College Grads are Faring Relatively Wellb/c Non-College Workers are Faring Absolutely Worse
Autor, 2014
MEN WOMEN

Countries with High Inequality and High Skill Returns Have Low Intergenerational Mobility
Source: Miles Corak
CanadaAustralia
NewZealand
GermanyGermany
Japan
KingdomItaly
FranceUnitedKingdom
Spain France
United
0.1
0.2
0.3
0.4
0.5
0.1
0.2
0.3
0.4
0.5
20 25 30
Incomeinequality(moreinequality )35
NorwayDenmark
Finland
AustraliaCanada
NewZealand
Italy
100 120 140 160
Collegeearningspremium(men25to34)180
Earnings inequalityandeconomic mobility:cross-national relationshipsGenerationalearningselasticity(highervalues implylowermobility)
Generationalearningselasticity(highervalues implylowermobility)
BA
Sweden
FinlandNorwayDenmark
UnitedStates UnitedStates
Sweden

No Decline in Intergenerational Income Mobility for U.S. Children Born 1971– 1974vs. 1979– 1982
Mean percentile income rank of children at ages 29-30 vs. percentilerank of their parents for three groups of birth cohorts: 1971-1974, 1975-
1978, and 1979-1982Chetty, Hendren, Kline, Saez and Turner 2014
3040
5060
70M
ean
Chi
ld In
com
e R
ank
0 20 40 60Parent Income Rank
80 100
1971−1974 1975−1978 1979−1982

No Decline in Intergenerational ‘Educational Mobility’ for U.S. Children Born 1984– 1987vs. 1991– 1993
Mean percentile income rank of children at ages 29-30 vs. percentile rank of their parents for three groups of birth cohorts:
1984-1987, 1988-1990, and 1991-1993Chetty, Hendren, Kline, Saez and Turner 2014
20%
40%
60%
80%
100%
Per
cent
in C
olle
ge a
t Age
19
0 20 40 60Parent Income Rank
80 100
1984−1987 1988−1990 1991−1993

Changes in U.S. Male Emp/Pop and Real Wage Levels 1979– 2008(Ages 25-39)
WSMCBSMC
WCLGWGTC
OCLG
BHSD
BHSG
BCLG
BGTC
OHSD
O
HSG
OSMC
OGTC
10
5
0
−5
−10
−15
−20
−25
−30
Perc
enta
gePo
intC
hang
ein
Mal
eEm
ploy
men
tto
Popu
latio
nR
ates
Fitted Values
WHSD
W
HSG
−25 −20 −15 −10 −5 0 5 10 15 20
Percentage Change in Male HourlyWages
Other Non−White Black
25 30 35 40
White
Autor and Wasserman 2013

Changes in Female Marriage Rates vs. Changes in Male Earnings 1979 – 2008,Ages 25 – 39
BHSG
WHSD
WHSG
WSMC
BSMC
WCLG
WGTC
BHSD
OSMCBCLG
BGTC
OHSD
OHSG
OCLG
OGTC
−25
−30
−15
−20
−10
0
−5
10
5
Perc
enta
gePo
intC
hang
ein
Fe
mal
eM
arria
geR
ates
−25 −20 −15 −10 −5 0 5 10 15 20
Percentage Change in Male Hourly Wages
Other Non−White Black
25 30 35 40
Fitted ValuesWhite
Autor and Wasserman 2013

Per Capita Enrichment Expenditures on Children ($2008) Top versus Bottom Quartileof Households
1994-5 2005-6
Source: Duncan and Murnane, 2011
3,536
5,650
6,975
8,872
8351,264 1,173 1,315
$0
$2,500
$5,000
$7,500
$10,000
1972-3 1983-4
Top income quintile
Bottomincome quintile

Gapin yearsof Completed Schooling: Studentswithfamily Incomein the Top vs. Bottomquintiles(by Year of Birth-14)
0
Source: Duncan and Murnane, 2011
1
2
3
419
68
1972
1976
1980
1984
1988
1992
1996
Gap
inye
ars
ofco
mpl
eted
scho
olin
g

Fractionof Twelfth-GradersExpectingto Obtaina B.A. by Sex andParents’Education,1979-2007
Source: Brian L. Jacob and Tamara Linkow Wilder, Using data from the Monitoring the Future survey.
Source: Jacob, Linkow and Wilder, 2011
95
90
85
80
75
70
65
60
55
50
45
401976 1981 1986 1991
Males, parents with less than B.A.
Females, parents with less than B.A.
1996 2001 2006
Males, parents with B.A. or higher
Females, parents with B.A. or higher
Perc
entE
xpec
ting
toEa
rna
B.A.

Fractionof Twelfth-GradersExpectingto Obtaina B.A. by Sex andParents’Education,1979-2007
Source: OECD
0.0
0.5
1.0
1.5
Japa
n Tu
rkey
C
hile
Lu
xem
bour
gM
exic
o K
orea
Sw
itzer
land
Uni
ted
Ger
man
y Be
lgiu
m
Fran
ce
Net
herl
ands
U
nite
dSt
ates
Aus
tria
C
zech
New
Zeal
and
Irel
and
Aus
tral
ia
Can
ada
Nor
way
G
reec
e Sl
ovak
Po
rtug
alSp
ain
Isra
el
Pola
nd
Swed
en
Hun
gary
Fi
nlan
dIt
aly
Icel
and
Den
mar
k Es
toni
a Sl
oven
ia
Female/Male Ratio in College Graduation Rates, OECDCountries 2011
2.0

.1 .2 .3 .4CENSUS 2000: Share Families w/ Kids Single Mom
.5
Fraction of Kids w/Single Mom and Income ImmobilityCommuting Zone Level Correlation
Source: Chetty, Hendren, Kline, and Hendren, 2013
Commuting Zones with Higher Fraction of Mother-Headed HH’s Have Lower Mobility
slope
010
2030
4050

The Other 99%
1. Is it all about the ‘One Percent’?
2. Do skill investments still pay off?
3. Why are skill returns so high?
4. Job ‘polarization’ and the middle class
5. Are we running out of jobs?
6. Does inequality impede mobility?
7. Conclusions

The Other 99%1. Encouraging news
• Rising inequality is mostly (not entirely) about skills – Still a meritocracy rather than a pure plutocracy
2. Rising skill returns largely due to two forces• Slowing supply of new college grads after 1980• Secularly rising demand for human expertise, creativity,
adaptability
3. Recent technological leads to job polarization• But does not necessarily raise wages for ‘service’ workers
4. Intergenerational mobility has not (yet) declined• But reason for worry: Labor market→Marriage market→
Adverse impact on children

Types of Jobs that Will Surely Exist in 50 Years
I. Technicaland creative experts and leadersII. Medical professionalsIII. Developers and testers of new ideasIV. Teachers, especially K-12V. Entertainers: Athletes, Musicians, Actors, Chefs,
Comedians
VI. Building and installation workersVII. Skilled repair workersVIII.Personal helpers, coaches,assistants and consultantsIX. Sex workers