Embed Size (px)
Citation preview
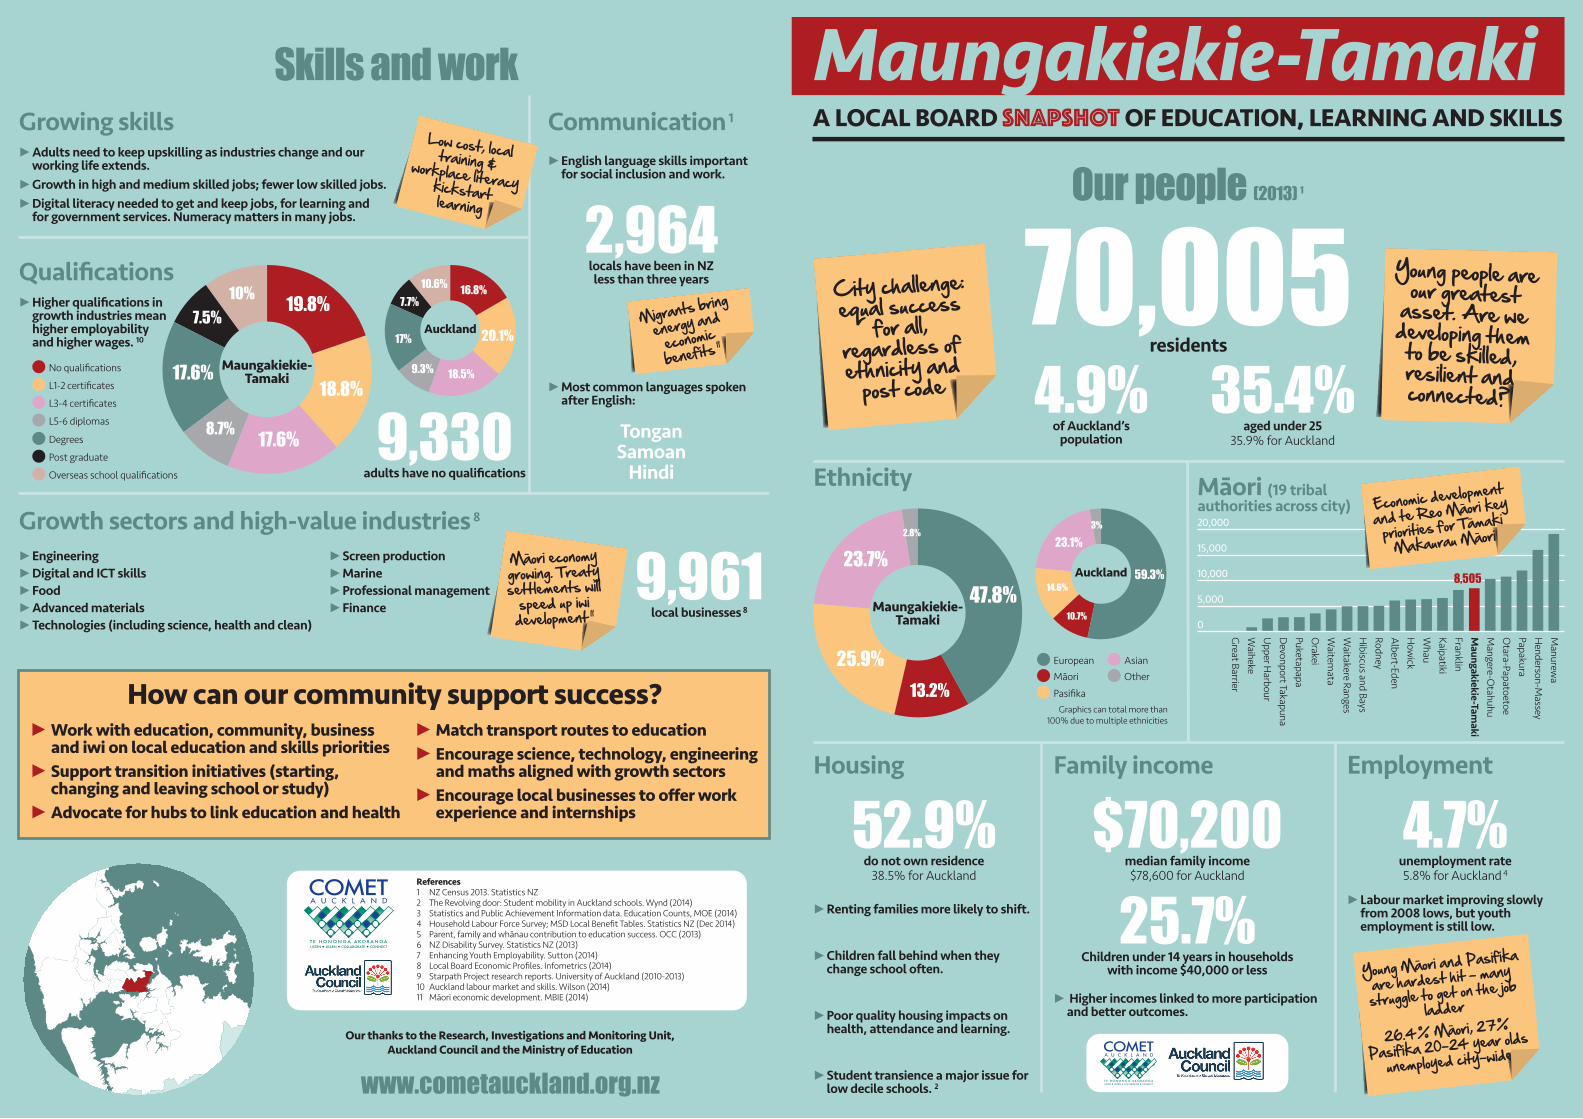
A LOCAL BOARD SNAPSHOT OF EDUCATION, LEARNING AND SKILLS
Skills and work
Our people (2013) 1
Ethnicity
Housing Family income Employment
Māori (19 tribalauthorities across city)
European
Māori
Asian
Other
PasifikaGraphics can total more than
100% due to multiple ethnicities
20,000
15,000
10,000
5,000
0
Auckland
3%
10.7%
14.6%
23.1%
59.3%
No qualifications
L1-2 certificates
L3-4 certificates
L5-6 diplomas
Degrees
Post graduate
Overseas school qualifications
Auckland
� Labour market improving slowly from 2008 lows, but youth employment is still low.
� Higher incomes linked to more participation and better outcomes.
� Renting families more likely to shift.
� Children fall behind when they change school often.
� Poor quality housing impacts on health, attendance and learning.
� Student transience a major issue for low decile schools. 2
Growing skills� Adults need to keep upskilling as industries change and our
working life extends.� Growth in high and medium skilled jobs; fewer low skilled jobs. � Digital literacy needed to get and keep jobs, for learning and
for government services. Numeracy matters in many jobs.
Qualifications� Higher qualifications in
growth industries mean higher employabilityand higher wages. 10
� English language skills important for social inclusion and work.
� Most common languages spoken after English:
Growth sectors and high-value industries 8
� Engineering� Digital and ICT skills� Food� Advanced materials� Technologies (including science, health and clean)
� Screen production� Marine� Professional management� Finance
Communication 1
How can our community support success?
Our thanks to the Research, Investigations and Monitoring Unit,Auckland Council and the Ministry of Education
References1 NZ Census 2013. Statistics NZ2 The Revolving door: Student mobility in Auckland schools. Wynd (2014)3 Statistics and Public Achievement Information data. Education Counts, MOE (2014)4 Household Labour Force Survey; MSD Local Benefit Tables. Statistics NZ (Dec 2014)5 Parent, family and whānau contribution to education success. OCC (2013)6 NZ Disability Survey. Statistics NZ (2013)7 Enhancing Youth Employability. Sutton (2014)8 Local Board Economic Profiles. Infometrics (2014)9 Starpath Project research reports. University of Auckland (2010-2013)10 Auckland labour market and skills. Wilson (2014)11 Māori economic development. MBIE (2014)
Māori economy growing. Treaty settlements will
speed up iwi development 11
Low cost, local training & workplace literacy kickstartlearning
Economic development
and te Reo Māori key
priorities for Tāmaki Makaurau Māori
Young Māori and Pasifika
are hardest hit – many
struggle to get on the job ladder
26.4% Māori, 27%
Pasifika 20-24 year olds
unemployed city-wide
� Work with education, community, business and iwi on local education and skills priorities
� Support transition initiatives (starting, changing and leaving school or study)
� Advocate for hubs to link education and health
� Match transport routes to education� Encourage science, technology, engineering
and maths aligned with growth sectors� Encourage local businesses to offer work
experience and internships
Migrants bring
energy and economicbenefits 11
Young people are our greatest asset. Are we developing them to be skilled, resilient and connected?
City challenge: equal success
for all, regardless of ethnicity and
post code
20.1%
18.5%
17%
16.8%10.6%
9.3%
7.7%
Maungakiekie-TamakiM
anurewa
Henderson-M
asseyPapakura
Mangere-O
tahuhuO
tara-Papatoetoe
Maungakiekie-Tam
akiFranklinKaipatiki W
hauH
owick
Albert-Eden
Hibiscus and Bays
Rodney
Waitakere Ranges
Waitem
ataO
rakei PuketapapaD
evonport Takapuna U
pper Harbour
Waiheke
Great Barrier
Maungakiekie-Tamaki
2.8%
13.2%
23.7%
25.9%
47.8%
Maungakiekie-Tamaki
19.8%
18.8%
17.6%8.7%
17.6%
10%7.5% 70,005
residents
TonganSamoan
Hindi
www.cometauckland.org.nz
52.9%do not own residence
38.5% for Auckland
$70,200median family income$78,600 for Auckland
25.7%Children under 14 years in households
with income $40,000 or less
35.4%aged under 25
35.9% for Auckland
4.9%of Auckland’s
population
4.7%unemployment rate5.8% for Auckland 4
9,961local businesses 8
2,964locals have been in NZless than three years
9,330adults have no qualifications
8,505
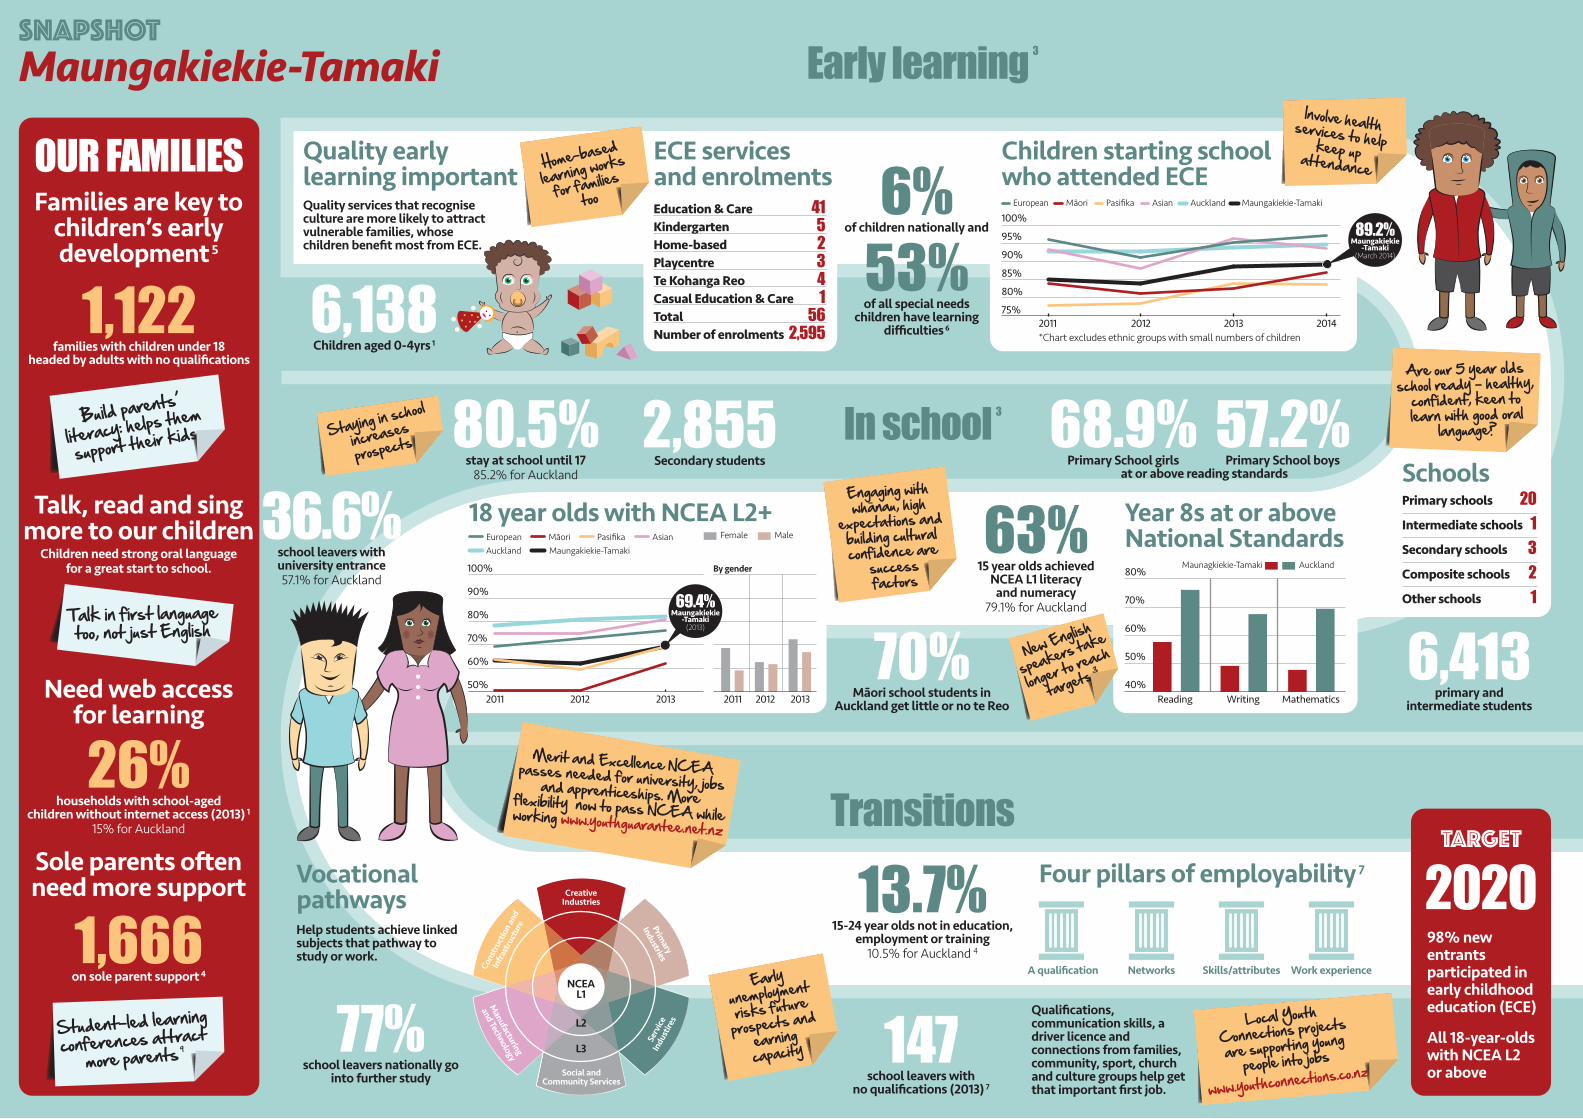
Early learning 3
In school 3
Transitions
OUR FAMILIESFamilies are key to
children’s earlydevelopment 5
Talk, read and singmore to our children
Children need strong oral languagefor a great start to school.
Need web accessfor learning
Sole parents oftenneed more support
Quality earlylearning importantQuality services that recognise culture are more likely to attract vulnerable families, whose children benefit most from ECE.
Vocationalpathways
Qualifications, communication skills, a driver licence and connections from families, community, sport, church and culture groups help get that important first job.
Year 8s at or aboveNational Standards
Auckland80%
70%
60%
40%
50%
Reading Writing Mathematics
18 year olds with NCEA L2+Asian Female Male
Maungakiekie-TamakiAucklandEuropean Māori Pasifika
90%
80%
70%
60%
50%2011 20112012 20122013 2013
100% By gender
Build parents’
literacy: helps them
support their kids
Student-led learning conferences attract
more parents 9
Talk in first language too, not just English
Home-based
learning works
for familiestoo
Earlyunemploymentrisks future prospects and
earning capacity
Staying in school
increases prospects
Are our 5 year oldsschool ready – healthy,
confident, keen to learn with good oral
language?
Engaging with whānau, high
expectations and building cultural confidence are
successfactors
Merit and Excellence NCEA passes needed for university, jobs and apprenticeships. More flexibility now to pass NCEA while working www.youthguarantee.net.nz
Local YouthConnections projectsare supporting young
people into jobs
www.youthconnections.co.nz
CreativeIndustries
NCEAL1
L2
L3
Cons
truc
tion
and
Infra
stru
ctur
e
Manufacturing
and TechnologySocial and
Community Services
Serv
iceIn
dust
ires
Primary
IndustriesHelp students achieve linked subjects that pathway to study or work.
Involve health services to help keep up attendance
98% new entrants participated in early childhood education (ECE)
All 18-year-olds with NCEA L2or above
2020TARGET
Four pillars of employability 7
A qualification Networks Skills/attributes Work experience
New English
speakers take
longer to reach
targets 3
SNAPSHOTMaungakiekie-Tamaki
63%15 year olds achieved
NCEA L1 literacyand numeracy
79.1% for Auckland
147school leavers with
no qualifications (2013) 7
77%school leavers nationally go
into further study
80.5%stay at school until 17
85.2% for Auckland
26%households with school-aged
children without internet access (2013) 1
15% for Auckland
6,138Children aged 0-4yrs 1
6,413primary and
intermediate students
70%Māori school students in
Auckland get little or no te Reo
2,855Secondary students
13.7%15-24 year olds not in education,
employment or training10.5% for Auckland 4
6%of children nationally and
53%of all special needs
children have learningdifficulties 6
36.6%school leavers withuniversity entrance57.1% for Auckland
68.9%Primary School girls
57.2%Primary School boys
1,666on sole parent support 4
Education & Care 41Kindergarten 5Home-based 2Playcentre 3Te Kohanga Reo 4Casual Education & Care 1Total 56Number of enrolments 2,595
ECE servicesand enrolments
Schools
Children starting schoolwho attended ECE100%
95%
85%
90%
80%
75%2011 2012 2013 2014
European Māori Pasifika Asian Auckland Maungakiekie-Tamaki
Primary schools 20Intermediate schools 1Secondary schools 3Composite schools 2Other schools 1
Maunagkiekie-Tamaki
at or above reading standards
1,122families with children under 18
headed by adults with no qualifications
*Chart excludes ethnic groups with small numbers of children
69.4%Maungakiekie
-Tamaki(2013)
89.2%Maungakiekie
-Tamaki(March 2014)