Embed Size (px)
Citation preview

Skilled nursing facility services
C H A P T E R8
R E C O M M E N D A T I O N
8 The Congress should eliminate the market basket updates for 2018 and 2019 and direct the Secretary to revise the prospective payment system (PPS) for skilled nursing facilities. In 2020, the Secretary should report to the Congress on the impacts of the reformed PPS and make any additional adjustments to payments needed to more closely align payments with costs.
COMMISSIONER VOTES: YES 17 • NO 0 • NOT VOTING 0 • ABSENT 0
197 Repo r t t o t h e Cong r e s s : Med i ca r e Paymen t P o l i c y | Ma r ch 2017
Skilled nursing facility services
Chapter summary
Skilled nursing facilities (SNFs) provide short-term skilled nursing and
rehabilitation services to beneficiaries after a stay in an acute care hospital. In
2015, about 15,000 SNFs furnished 2.4 million Medicare-covered stays to 1.7
million fee-for-service (FFS) beneficiaries. Medicare FFS spending on SNF
services was $29.8 billion in 2015.
Assessment of payment adequacy
To examine the adequacy of Medicare’s payments, we analyze beneficiaries’
access to care (including the supply of providers and volume of services),
quality of care, provider access to capital, and Medicare payments in relation
to providers’ costs to treat Medicare beneficiaries. Key measures indicate
Medicare payments to SNFs are adequate. We also find that relatively
efficient SNFs—facilities identified as providing relatively high-quality care
at relatively low costs—had very high Medicare margins, suggesting that
opportunities remain for other SNFs to achieve greater efficiencies.
Beneficiaries’ access to care—Access to SNF services remains adequate for
most beneficiaries.
• Capacity and supply of providers—The number of SNFs participating
in the Medicare program is stable. The vast majority (88 percent) of
beneficiaries live in a county with three or more SNFs or swing bed
facilities (rural hospitals with beds that can serve as either SNF beds or
In this chapter
• Are Medicare payments adequate in 2017?
• How should Medicare payments change in 2018?
• Medicaid trends
C H A P T E R 8
198 Sk i l l e d n u r s i ng f a c i l i t y s e r v i c e s : A s s e s s i ng paymen t adequacy and upda t i ng paymen t s
acute care beds), and less than 1 percent live in a county without one. Between
2014 and 2015, the median occupancy declined slightly but remained high (86
percent), with one-quarter of SNFs having rates at or below 75 percent.
• Volume of services—Covered admissions per FFS beneficiary increased
between 2014 and 2015, consistent with increases in inpatient hospital
admissions (a three-day inpatient stay is required for Medicare coverage of SNF
services). At the same time, length of stay declined, resulting in a net reduction
in covered days.
Quality of care—Between 2014 and 2015, the community discharge rate and the
rates of hospital readmissions (during SNF stay and within 30 days after discharge)
improved. The functional change measures were essentially unchanged.
Providers’ access to capital—Because most SNFs are part of nursing homes,
we examine nursing homes’ access to capital. Access to capital was adequate in
2016 but getting tighter and is expected to remain so in 2017. Lending wariness
reflects broad changes in post-acute care, not the adequacy of Medicare’s payments.
Medicare is regarded as a preferred payer of SNF services.
Medicare payments and providers’ costs—In 2015, the average Medicare margin
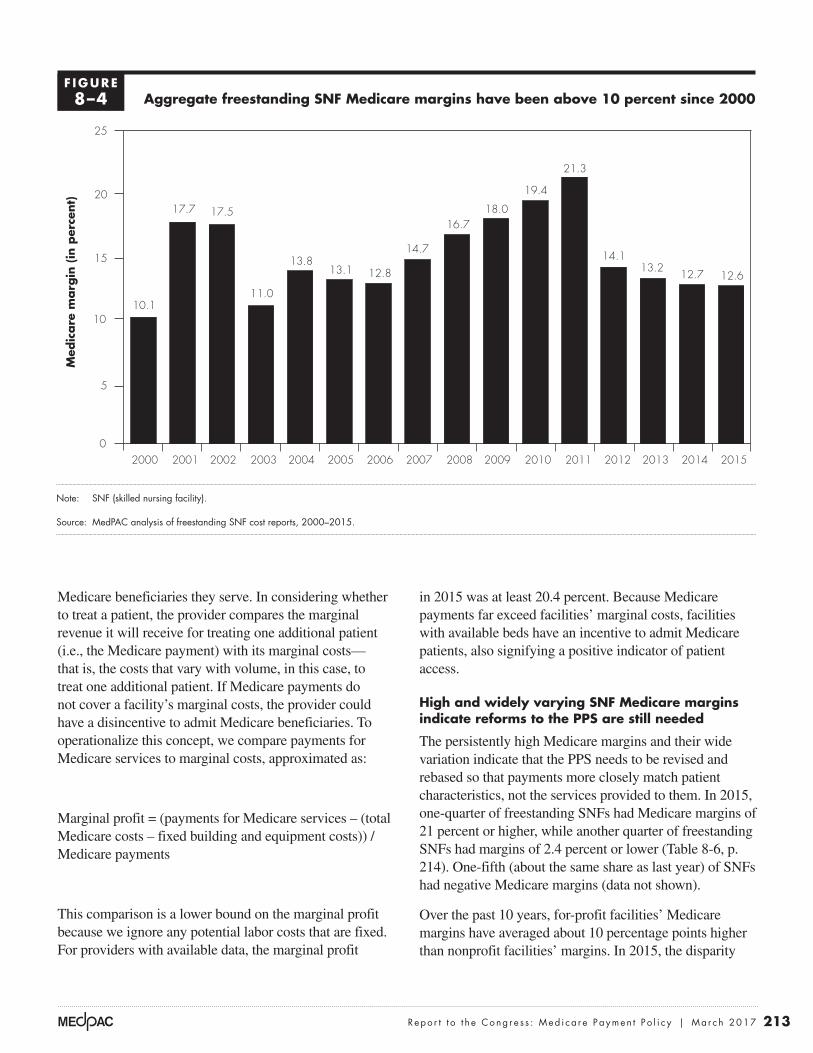
was 12.6 percent—the 16th year in a row that the average was above 10 percent.
Margins continued to vary greatly across facilities, reflecting differences in costs
and shortcomings in the SNF prospective payment system (PPS) that favor treating
rehabilitation patients over medically complex patients. The marginal profit, a
measure of the relative attractiveness of treating Medicare beneficiaries, was at least
20.4 percent. The projected Medicare margin for 2017 is 10.6 percent.
Last year, the Commission recommended that payment rates remain the same for
two years while the Secretary undertakes revising the payment system. Then, in
year 3, the Secretary should evaluate the need to make additional adjustments to
payments to align them with providers’ costs. The circumstances of the SNF PPS
remain unchanged. Medicare still needs to revise the PPS. Medicare’s overpayments
for therapy services have gotten larger (so providers still have an incentive to
furnish therapy services of questionable value), and payments for nontherapy
ancillary services (most notably drugs) are even more poorly targeted than in prior
years.
Regarding the need to rebase payments, several factors indicate that the level of
payments remains too high. First, Medicare margins have been above 10 percent
for 16 years; the marginal profit in 2016 was high, suggesting that facilities with
available beds have an incentive to admit Medicare patients. Costs vary widely for
199 Repo r t t o t h e Cong r e s s : Med i ca r e Paymen t P o l i c y | Ma r ch 2017
reasons unrelated to case mix and wages, and, since 2003, cost growth has been at
or above the market basket for all years but one. Over 1,000 SNFs (9 percent of the
facilities included in the analysis) have been able to keep costs consistently well
below Medicare payment rates while maintaining relatively high quality. Finally,
where possible to examine, Medicare Advantage (managed care) payment rates to
SNFs are considerably lower than the program’s FFS payments.
Based on these factors, the Commission recommends that no update to SNF
payment rates be made for two years (2018 and 2019) while the SNF PPS is
revised. Then, in 2020, the Secretary should evaluate the need to make further
adjustments to payments to align them with costs. The chapter on post-acute care
(Chapter 7) conveys the Commission’s increasing frustration with the lack of
statutory or regulatory action to lower the level of payments and revise the SNF
payment system.
Medicaid trends
As required by the Patient Protection and Affordable Care Act of 2010, we report
on Medicaid use, spending, and non-Medicare (private-payer and Medicaid)
margins. Medicaid finances mostly long-term care services provided in nursing
homes but also covers copayments for low-income Medicare beneficiaries (known
as dual-eligible beneficiaries) who stay more than 20 days in a SNF. The number
of Medicaid-certified facilities declined slightly (–0.5 percent) between 2015
and 2016. CMS estimates that total spending on nursing home services increased
between 2014 and 2015 and again in 2016. In 2015, the average total margin,
reflecting all payers (including managed care, Medicaid, Medicare, and private
insurers) and all lines of business (such as hospice, ancillary services, home health
care, and investment income) was 1.6 percent, down slightly from 2014. The
average non-Medicare margin (that includes all payers and all lines of business
except Medicare FFS SNF services) was –2.0 percent, also lower than in 2014
(–1.5 percent). ■

201 Repo r t t o t h e Cong r e s s : Med i ca r e Paymen t P o l i c y | Ma r ch 2017
Background
Skilled nursing facilities (SNFs) provide short-term skilled nursing care and rehabilitation services, such as physical and occupational therapy and speech–language pathology services. Examples of SNF patients include those recovering from surgical procedures such as hip and knee replacements or from medical conditions such as stroke and pneumonia. In 2015, almost 1.7 million fee-for-service (FFS) beneficiaries (4.4 percent of all Part A FFS users) used SNF services at least once; program spending on SNF services was $29.8 billion, or about 8 percent of FFS spending (Boards of Trustees 2016, Office of the Actuary 2016b). Medicare’s median payment per day was $463 and its median payment per stay was $18,361.1 About 20 percent of hospitalized beneficiaries were discharged to SNFs.
Medicare covers up to 100 days of SNF care per spell of illness after a medically necessary inpatient hospital stay of at least 3 days.2 For beneficiaries who qualify for a covered stay, Medicare pays 100 percent of the payment for the first 20 days of care. Beginning with day 21, beneficiaries are responsible for copayments. For 2017, the copayment is $164.50 per day.
The term skilled nursing facility refers to a provider that meets Medicare requirements for Part A coverage.3
Most SNFs (more than 90 percent) are dually certified as SNFs and nursing homes (which typically provide less intensive, long-term care services). Thus, a facility that provides skilled care often also provides long-term care services that Medicare does not cover. Medicaid pays for the majority of nursing facility days. In 2016, CMS finalized rules overhauling the requirements nursing homes must meet to participate in the Medicare and Medicaid programs (Centers for Medicare & Medicaid Services 2016b). The rule included changes to infection control, patient’s rights, staff training and competencies, care planning, arbitration agreements, and order writing by dieticians and therapists. CMS estimated that the regulations will raise the average provider’s costs by $62,900 in the first year and by $55,000 in subsequent years. The required changes will be phased in over three years, with the first phase implemented on November 28, 2016. Although the law banned facilities’ pre-dispute arbitration clauses, there is a temporary injunction against the ban taking effect.
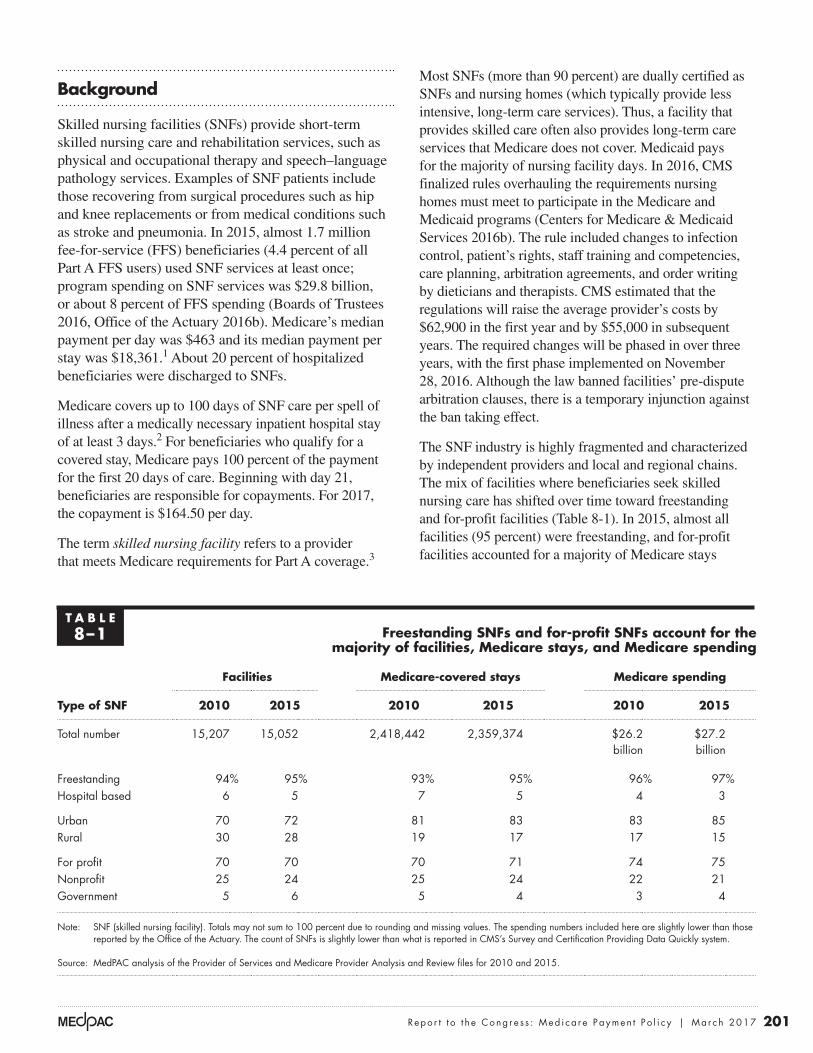
The SNF industry is highly fragmented and characterized by independent providers and local and regional chains. The mix of facilities where beneficiaries seek skilled nursing care has shifted over time toward freestanding and for-profit facilities (Table 8-1). In 2015, almost all facilities (95 percent) were freestanding, and for-profit facilities accounted for a majority of Medicare stays
T A B L E8–1 Freestanding SNFs and for-profit SNFs account for the
majority of facilities, Medicare stays, and Medicare spending
Facilities Medicare-covered stays Medicare spending
Type of SNF 2010 2015 2010 2015 2010 2015
Total number 15,207 15,052 2,418,442 2,359,374 $26.2 billion
$27.2 billion
Freestanding 94% 95% 93% 95% 96% 97%Hospital based 6 5 7 5 4 3
Urban 70 72 81 83 83 85Rural 30 28 19 17 17 15
For profit 70 70 70 71 74 75Nonprofit 25 24 25 24 22 21Government 5 6 5 4 3 4
Note: SNF (skilled nursing facility). Totals may not sum to 100 percent due to rounding and missing values. The spending numbers included here are slightly lower than those reported by the Office of the Actuary. The count of SNFs is slightly lower than what is reported in CMS’s Survey and Certification Providing Data Quickly system.
Source: MedPAC analysis of the Provider of Services and Medicare Provider Analysis and Review files for 2010 and 2015.
202 Sk i l l e d n u r s i ng f a c i l i t y s e r v i c e s : A s s e s s i ng paymen t adequacy and upda t i ng paymen t s
and spending. Hospital-based facilities made up a small share of facilities, stays, and spending (5 percent or less). In 2015, 70 percent of SNFs were for profit, but they accounted for a slightly higher share of stays and Medicare payments (71 percent and 75 percent, respectively).
Medicare-covered FFS SNF days typically comprise a small share of a facility’s total patient days but a disproportionately larger share of the facility’s revenues. In freestanding facilities in 2015, the median Medicare share of total facility days was 11 percent, but Medicare accounted for 21 percent of facility revenue, a decline from 2010 when FFS Medicare comprised 23 percent of facility revenue (data not shown).
The most common hospital conditions of patients referred to SNFs for post-acute care are joint replacement, septicemia, kidney and urinary tract infections, hip and femur procedures (except major joint replacement), pneumonia, and heart failure and shock. Compared with other beneficiaries, SNF users are older, frailer, and disproportionately female, disabled, living in an institution, and dually eligible for Medicare and Medicaid (Medicare Payment Advisory Commission 2013).
SNF prospective payment system and its shortcomingsMedicare uses a prospective payment system (PPS) to pay SNFs for each day of service.4 Information gathered from a standardized patient assessment instrument—the Minimum Data Set—is used to classify patients into case-mix categories, called resource utilization groups (RUGs). RUGs differ depending on the services SNFs provide to a patient (such as the amount and type of rehabilitation therapy and the use of respiratory therapy and specialized feeding), the patient’s clinical condition (such as whether the patient has pneumonia), and the patient’s need for assistance in performing activities of daily living (ADLs). Medicare’s payment system for SNF services is described in the Commission’s Payment Basics, available on the Commission’s website.5 Although the payment system is referred to as “prospective,” two features undermine how prospective it is: The system makes payments for each day of care (rather than set a payment for the entire stay), and it bases payments partly on the minutes of rehabilitation therapy furnished to a patient. Both features result in providers having some control over how much Medicare will pay them for their services.
Almost since its inception, the SNF PPS has been criticized for encouraging the provision of excessive
rehabilitation therapy services and not accurately targeting payments for nontherapy ancillary (NTA) services such as drugs (Government Accountability Office 2002, Government Accountability Office 1999, White et al. 2002). Under current policy, therapy payments are not proportional to costs but, instead, rise faster than providers’ therapy costs increase (Medicare Payment Advisory Commission and The Urban Institute 2015). The Office of Inspector General (OIG) of the Department of Health and Human Services also found that the difference between the payments for and the costs of therapy services increased as the amount of therapy provided per day increased (Office of Inspector General 2015). Further, payments for NTA services are included in the nursing component, even though NTA costs vary much more than nursing care costs and are not correlated with them.
In 2008, the Commission recommended revising the PPS to base therapy payments on patient characteristics (not service provision), remove payments for NTA services from the nursing component, establish a separate component within the PPS that adjusts payments for NTA services, and implement an outlier payment policy (Medicare Payment Advisory Commission 2008). An outlier policy would offer some financial protection by partly compensating providers that treat exceptionally costly patients. An outlier case would be defined on a stay basis, not on a day basis, because the financial risk to a facility is determined by its losses over the stay, not for any given day. In 2012, the Commission recommended revising and rebasing the SNF PPS to address both the distribution and level of payments (Medicare Payment Advisory Commission 2012).
The Commission’s recommended revisions to the PPS would more closely align payments with patient characteristics and target payments for NTA services (Medicare Payment Advisory Commission and The Urban Institute 2015). Assuming no other changes in patient mix or care delivery, payments in aggregate would not change but would result in considerable redistribution of payments. In 2014, payments under a revised SNF PPS would have increased 32 percent for facilities with relatively low shares of intensive therapy and 12 percent for facilities with relatively high NTA costs per day; payments would have decreased 7 percent for facilities with high shares of intensive therapy and 2 percent for facilities with low NTA costs per day.6 Payments would also increase for facilities with high shares of clinically complex and special care days (we refer to these days collectively as “medically complex”).7 Based on the mix
203 Repo r t t o t h e Cong r e s s : Med i ca r e Paymen t P o l i c y | Ma r ch 2017
of patients and therapy practices, payments would have increased 21 percent for hospital-based facilities, 4 percent for nonprofit facilities, and 4 percent for rural facilities and would have decreased only 1 percent for for-profit facilities. The effects on individual facilities could have varied substantially depending on their mix of patients and current therapy practices.
The American Health Care Association (AHCA), an organization representing long-term care and post-acute care (PAC) providers, has also developed a proposal to revise the SNF PPS, basing payments on a SNF stay (Moran Company 2015). The proposal’s design uses broadly defined clinical groups based on the patient’s condition and reason for SNF care, but not the amount of therapy furnished to a patient. This proposal would also lower payments to for-profit facilities (because they furnish more intensive therapy and their stays are longer) and would raise payments to nonprofit facilities (because they furnish less intensive therapy and their stays are shorter). CMS does not, however, have the authority to implement a stay-based PPS.
Based on its work examining SNFs’ billing practices and analysis of therapy costs and payments, OIG recommended that CMS evaluate the extent to which therapy payments should be reduced, change the method for paying for therapy, adjust Medicare payments to eliminate any increase unrelated to patient characteristics, and strengthen the oversight of SNF billing (Office of Inspector General 2015). CMS concurred with these recommendations and stated it was working on an alternative to the current PPS design. This year, OIG will examine the documentation at selected SNFs to see whether, for each day, patients are assigned to the appropriate case-mix group (Office of Inspector General 2016).
CMS’s revisions of the SNF PPSCMS’s work on alternative designs for the SNF PPS began 13 years ago in response to a legislative requirement (the Medicare, Medicaid, and SCHIP Benefits Improvement and Protection Act of 2000) to conduct research on potential refinements of the SNF PPS (Liu et al. 2007, Maxwell et al. 2003, Urban Institute 2004). Although CMS has taken several steps to enhance payments for medically complex care, it has not revised the PPS’s basic design to target payments for NTAs or to base payments for rehabilitation therapy services on patient characteristics rather than the amount of service furnished.8 Changes were made to the case-mix groups and the counting of therapy minutes, yet the overall accuracy of Medicare’s
payments has steadily eroded. Payments for NTA services are unrelated to the cost of this care, and therapy payments are increasingly not proportional to the costs of therapy services. As a result, the PPS continues to advantage providers that furnish therapy services unrelated to a patient’s condition and avoid patients with high NTA costs (Medicare Payment Advisory Commission and The Urban Institute 2015).
In 2014, CMS began work to revise the SNF PPS. First, it reviewed alternative ways to pay for therapy and later that year announced it was expanding the scope of its research to consider revisions of the entire PPS. Since 2015, it has gathered four expert panels to receive input on aspects of possible design features before it proposes a revised PPS.9 The designs under consideration are consistent with those recommended by the Commission. The panels have discussed basing payments on patient characteristics (not the amount of therapy provided), creating separate components to establish payments for NTA services and speech–language pathology services, recalculating the nursing indexes, and front-loading the daily payments to reflect the higher costs incurred early on in a stay (Acumen LLC 2016). Because payments would no longer be driven by the amount of rehabilitation therapy provided to patients, an alternative design is likely to move money from rehabilitation patients to medically complex patients and from for-profit and freestanding SNFs to hospital-based and nonprofit providers.
Are Medicare payments adequate in 2017?
To examine the adequacy of Medicare’s FFS payments, we analyze beneficiaries’ access to care (including the supply of providers and volume of services), quality of care, providers’ access to capital, Medicare FFS payments in relation to costs to treat Medicare beneficiaries, and changes in payments and costs. We also compare the performance of SNFs that have relatively high and low Medicare margins and compare relatively efficient SNFs with other SNFs.
Beneficiaries’ access to care: Access is stable for most beneficiaries We do not have direct measures of access, in part because the need for SNF care, as opposed to needing a different PAC service or none at all, is not well defined. Instead, we consider the supply and capacity of providers and evaluate changes in service volume.
204 Sk i l l e d n u r s i ng f a c i l i t y s e r v i c e s : A s s e s s i ng paymen t adequacy and upda t i ng paymen t s
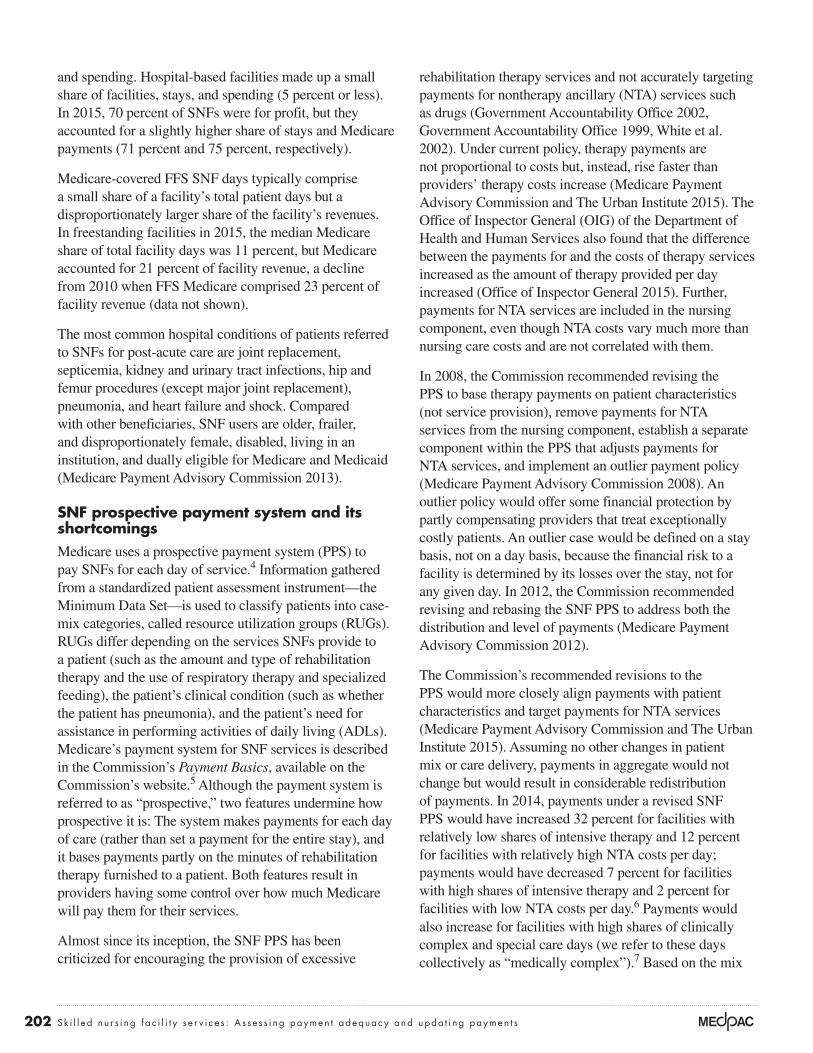
3 percent (Table 8-2) (Centers for Medicare & Medicaid Services 2016c). We examine service use for FFS beneficiaries because the CMS data on users, days, and admissions do not include service use by beneficiaries enrolled in Medicare Advantage (MA) plans. Covered days per 1,000 FFS enrollees declined slightly. The combination of more admissions but fewer days resulted in a 4 percent decline in covered length of stay. Increases in hospital admissions are a key driver of the increase in SNF stays.
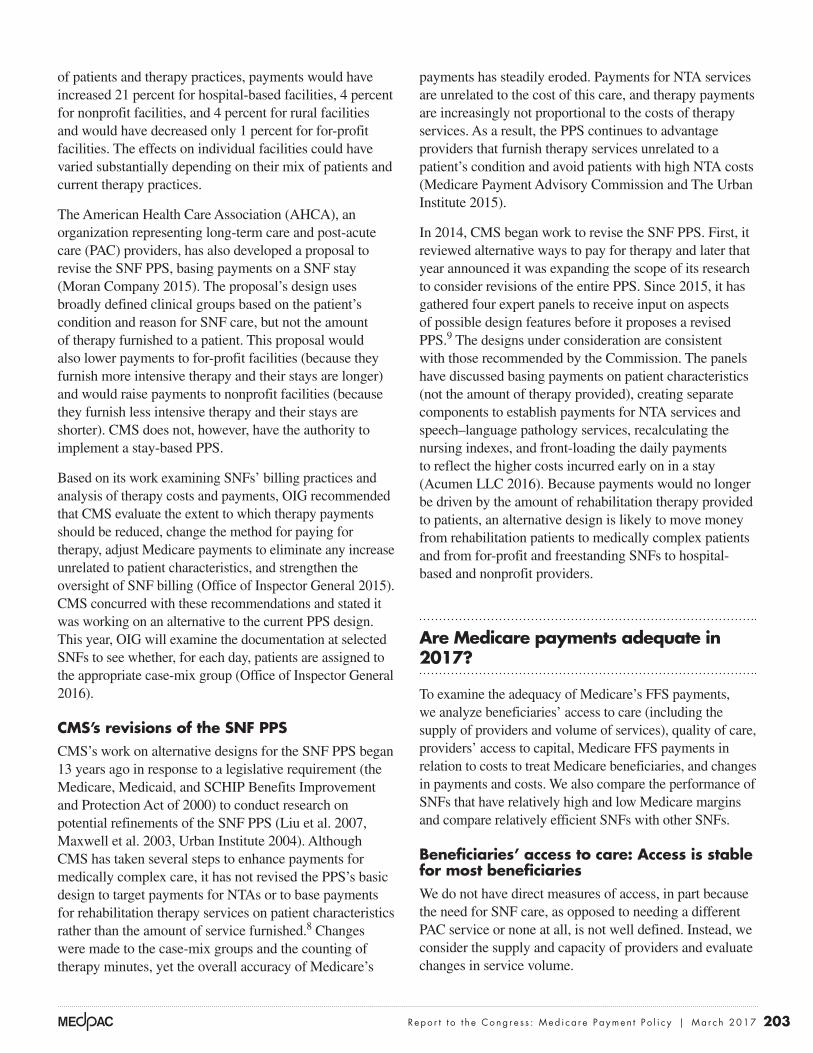
Service mix reflects biases in PPS design
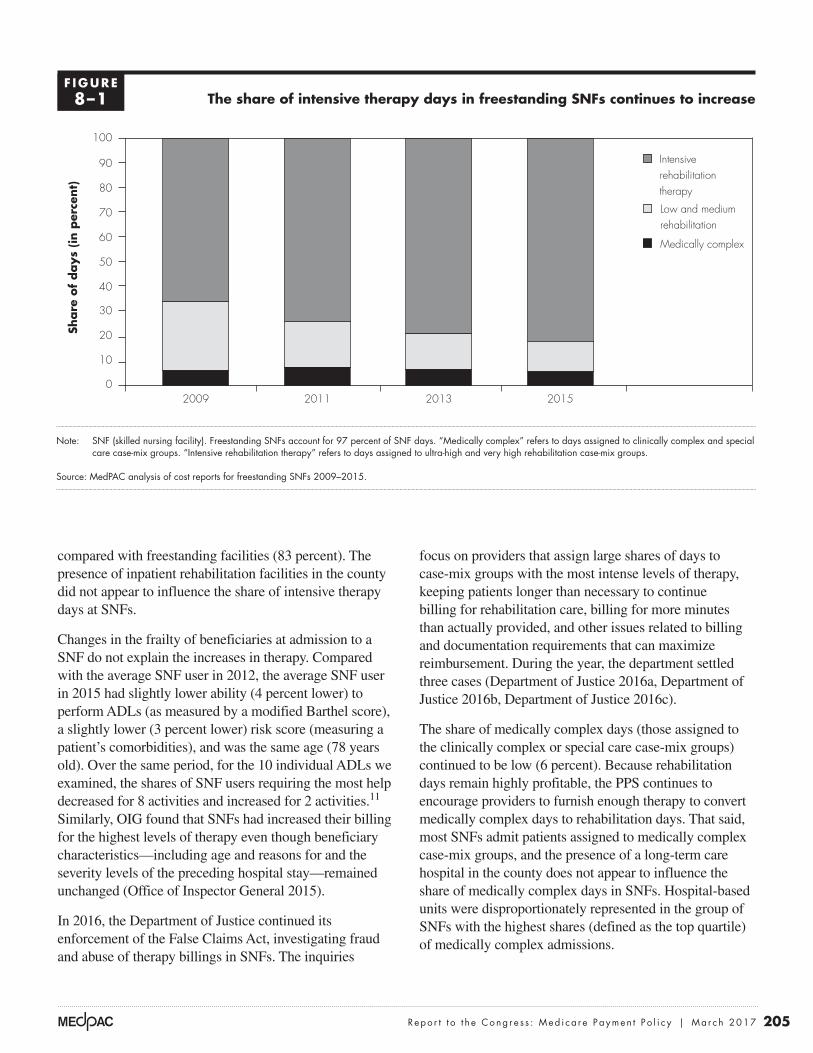
Between 2002 and 2015, the share of days classified into rehabilitation case-mix groups in freestanding facilities increased from 78 percent to 94 percent.10 During the same period, the share of intensive therapy days as a share of total days rose from 29 percent to 82 percent. The most recent changes indicate the continued intensification of therapy provision (Figure 8-1). Between 2011 and 2015, the share of intensive therapy days increased from 74 percent to 82 percent. The share of days assigned to the highest rehabilitation case-mix groups (the ultra-high groups) increased from 47 percent to 57 percent (data not shown).
Facilities differed in the amount of intensive therapy they provided, though the differences by ownership have gotten smaller over time. In 2015, for-profit facilities and facilities located in urban areas had higher shares of intensive therapy (83 percent for each group) compared with nonprofit facilities (80 percent) and facilities in rural and frontier areas (76 percent and 54 percent, respectively). Though their levels of intensive therapy are lower, rural SNFs, frontier SNFs, and nonprofit SNFs expanded their days of intensive therapy much more than urban SNFs and for-profit SNFs. Hospital-based facilities had lower shares of intensive therapy days (61 percent)
Capacity and supply of providers: Supply remains stable
The number of SNFs participating in the Medicare program in 2016 is stable at 15,307. In 2016, there were a handful of new facilities (79), the majority of which were for profit, and an even smaller number of terminations, most of which were voluntary (Centers for Medicare & Medicaid Services 2016a). The industry is fragmented, with few large national chains and many more local or regional systems. Of the 50 largest nursing facility companies, most are privately held.
In 2015, over 88 percent of beneficiaries lived in counties with three or more SNFs or swing bed facilities (rural hospitals with beds that can serve as either SNF beds or acute care beds). Less than 1 percent of beneficiaries lived in a county without a SNF or swing bed facility, and another 11 percent lived in counties with one or two SNFs or swing bed facilities.
Between 2014 and 2015, median occupancy rates for freestanding SNFs declined slightly (from 87 percent to 86 percent) but remained high for freestanding facilities. Occupancy rates at hospital-based facilities remained at 81 percent. Although these median rates are high, one-quarter of freestanding facilities had occupancy rates at or below 75 percent, indicating capacity for more admissions. The median occupancy rate for freestanding SNFs in rural areas was lower than average (82 percent), and facilities located in areas with small populations (fewer than 2,500 people) had even lower median occupancy rates (78 percent).
Between 2014 and 2015, SNF admissions increased while stays shortened
In 2015, 4.4 percent of FFS beneficiaries used SNF services, the same share as in 2014. Between 2014 and 2015, SNF admissions per FFS enrollee increased over
T A B L E8–2 SNF admissions increased but stays were shorter in 2015 compared with 2014
Volume measure 2010 2012 2013 2014 2015Percent change
2014–2015
Covered admissions per 1,000 FFS enrollees 71.5 68.0 66.5 65.6 67.7 3.2%Covered days per 1,000 FFS enrollees 1,938 1,861 1,835 1,808 1,792 –0.9 Covered length of stay (in days) 27.1 27.4 27.6 27.6 26.5 –4.0
Note: SNF (skilled nursing facility), FFS (fee-for-service). FFS beneficiaries include users and nonusers of SNF services. Data include 50 states and the District of Columbia.
Source: Centers for Medicare & Medicaid Services 2016c.
205 Repo r t t o t h e Cong r e s s : Med i ca r e Paymen t P o l i c y | Ma r ch 2017
compared with freestanding facilities (83 percent). The presence of inpatient rehabilitation facilities in the county did not appear to influence the share of intensive therapy days at SNFs.
Changes in the frailty of beneficiaries at admission to a SNF do not explain the increases in therapy. Compared with the average SNF user in 2012, the average SNF user in 2015 had slightly lower ability (4 percent lower) to perform ADLs (as measured by a modified Barthel score), a slightly lower (3 percent lower) risk score (measuring a patient’s comorbidities), and was the same age (78 years old). Over the same period, for the 10 individual ADLs we examined, the shares of SNF users requiring the most help decreased for 8 activities and increased for 2 activities.11 Similarly, OIG found that SNFs had increased their billing for the highest levels of therapy even though beneficiary characteristics—including age and reasons for and the severity levels of the preceding hospital stay—remained unchanged (Office of Inspector General 2015).
In 2016, the Department of Justice continued its enforcement of the False Claims Act, investigating fraud and abuse of therapy billings in SNFs. The inquiries
focus on providers that assign large shares of days to case-mix groups with the most intense levels of therapy, keeping patients longer than necessary to continue billing for rehabilitation care, billing for more minutes than actually provided, and other issues related to billing and documentation requirements that can maximize reimbursement. During the year, the department settled three cases (Department of Justice 2016a, Department of Justice 2016b, Department of Justice 2016c).
The share of medically complex days (those assigned to the clinically complex or special care case-mix groups) continued to be low (6 percent). Because rehabilitation days remain highly profitable, the PPS continues to encourage providers to furnish enough therapy to convert medically complex days to rehabilitation days. That said, most SNFs admit patients assigned to medically complex case-mix groups, and the presence of a long-term care hospital in the county does not appear to influence the share of medically complex days in SNFs. Hospital-based units were disproportionately represented in the group of SNFs with the highest shares (defined as the top quartile) of medically complex admissions.
The share of intensive therapy days in freestanding SNFs continues to increase
Note: SNF (skilled nursing facility). Freestanding SNFs account for 97 percent of SNF days. “Medically complex” refers to days assigned to clinically complex and special care case-mix groups. “Intensive rehabilitation therapy” refers to days assigned to ultra-high and very high rehabilitation case-mix groups.
Source: MedPAC analysis of cost reports for freestanding SNFs 2009–2015.
Title hereFIGUREX-X
Note: Note and Source are in InDesign.
Source:
Share
of
days
(in p
erce
nt)
0
10
20
30
40
50
60
70
80
90
100
2015201320112009
Intensive rehabilitation therapy
Low and medium rehabilitation
Medically complex
F IGURE8–1
206 Sk i l l e d n u r s i ng f a c i l i t y s e r v i c e s : A s s e s s i ng paymen t adequacy and upda t i ng paymen t s
patient becomes eligible for Medicaid or if the stay results in bad debt.
Quality of care: Some measures improved while others were unchangedThe Commission tracks three broad categories of SNF quality indicators: risk-adjusted rates of readmission, discharge back to the community, and change in functional status during the SNF stay. We use these measures because they reflect the goals of most beneficiaries: to return home, avoid a rehospitalization, and improve or maintain function. Between 2013 and 2015, the rates of readmissions and discharge to the community improved while the two measures of functional change were essentially unchanged.
Though access does not appear to be an issue in general, industry representatives and patient advocates report that some providers are reluctant to admit patients with high NTA costs (such as those requiring expensive antibiotics). The Commission’s recommended design would increase payments for medically complex patients and improve the targeting of payments to patients who require high-cost NTA services. Likewise, the designs under consideration by CMS could increase payments for these patients by basing therapy payments on patient characteristics (rather than therapy minutes) and by adding a separate component to establish payments for NTA services (Acumen LLC 2016). Providers may also avoid patients who are likely to require long stays and exhaust their Medicare benefits because a facility’s daily payments may decline if the
Measures of skilled nursing facility quality
Regarding skilled nursing facility (SNF) quality, the Commission examines risk-adjusted rates of readmission to the hospital, discharge back to
the community, and change in functional status during the SNF stay.
The community discharge measure includes beneficiaries discharged to a community setting (including assisted living) and excludes those discharged to an inpatient setting (e.g., an acute care hospital or nursing home) within one day of the SNF discharge. The measure also excludes beneficiaries who die within 1 day of the SNF discharge and beneficiaries who are readmitted to an acute care hospital within 30 days of admission to the SNF (Kramer et al. 2015). Beneficiaries who are discharged to a nursing home are not counted as community discharges, although the risk adjustment method (and the comorbidities) captures some of the differences in patient health status between beneficiaries discharged home and those discharged to a nursing home.12
The readmission measures count patients whose primary diagnosis for rehospitalization was considered potentially avoidable; that is, the condition typically can be managed in the SNF setting. The potentially avoidable conditions include congestive heart failure,
electrolyte imbalance/dehydration, respiratory infection, septicemia, urinary tract or kidney infection, hypoglycemia and diabetic complications, anticoagulant complications, fractures and musculoskeletal injuries, acute delirium, adverse drug reactions, cellulitis/wound infection, pressure ulcers, and blood pressure management. The count excludes readmissions that were likely to have been planned (e.g., inpatient chemotherapy or radiation therapy) and readmissions that signal a premature discharge from the hospital. We separately measure readmissions that occur during the SNF stay and those that occur within 30 days of discharge from the SNF.
The observed readmission and community discharge rates were risk adjusted for medical comorbidity, cognitive comorbidity, mental health comorbidity, function, and clinical conditions (e.g., surgical wounds and shortness of breath). The rates reported are the average risk-adjusted readmission rates for all facilities with 25 or more stays (20 stays for the postdischarge readmission measure). Demographics (including race, gender, and age categories except younger than age 65 years) were not important in explaining differences in readmission and community discharge rates after controlling for beneficiaries’ comorbidities, mental illness, and functional status (Kramer et al. 2014).13
(continued next page)
207 Repo r t t o t h e Cong r e s s : Med i ca r e Paymen t P o l i c y | Ma r ch 2017
The lower readmission rates during the SNF stay in part reflect the increased attention from hospitals to avoid readmission penalties by partnering with SNFs with low readmission rates. Hospitals are increasingly establishing preferred provider networks with higher quality SNFs, hoping to lower their own readmission rates in exchange for increased referrals to SNFs (Evans 2015). In addition, many SNFs want to secure volume from MA plans and accountable care organizations by demonstrating improvements in their readmission rates. The AHCA has a goal for its members to lower their 30-day all-cause, all-patient readmission rate. The association claims that as of December 2015, 19 percent of members had achieved a 30 percent reduction in readmissions or achieved a rehospitalization rate below 10 percent (across all patients, not just Medicare) (American Health Care Association 2016). Despite these improvements, their members’ average readmission rate in the fourth quarter of 2015 remained higher than the nonmember rate (17.5 percent for its members compared with 17.0 for nonmembers nationally) and had smaller reductions over four years
Rates of readmissions and the community discharge rate improved
Over the past five years, the rates of risk-adjusted potentially avoidable readmissions and the rate of discharge to the community improved (see text box on measures of SNF quality). The readmission rate during the SNF stay measures how well the SNF avoids potentially avoidable readmissions by detecting, monitoring, and furnishing adequate care to prevent hospitalizations. The postperiod measure indicates how well facilities prepare beneficiaries and their caregivers for safe and appropriate transitions to the next health care setting (or home).
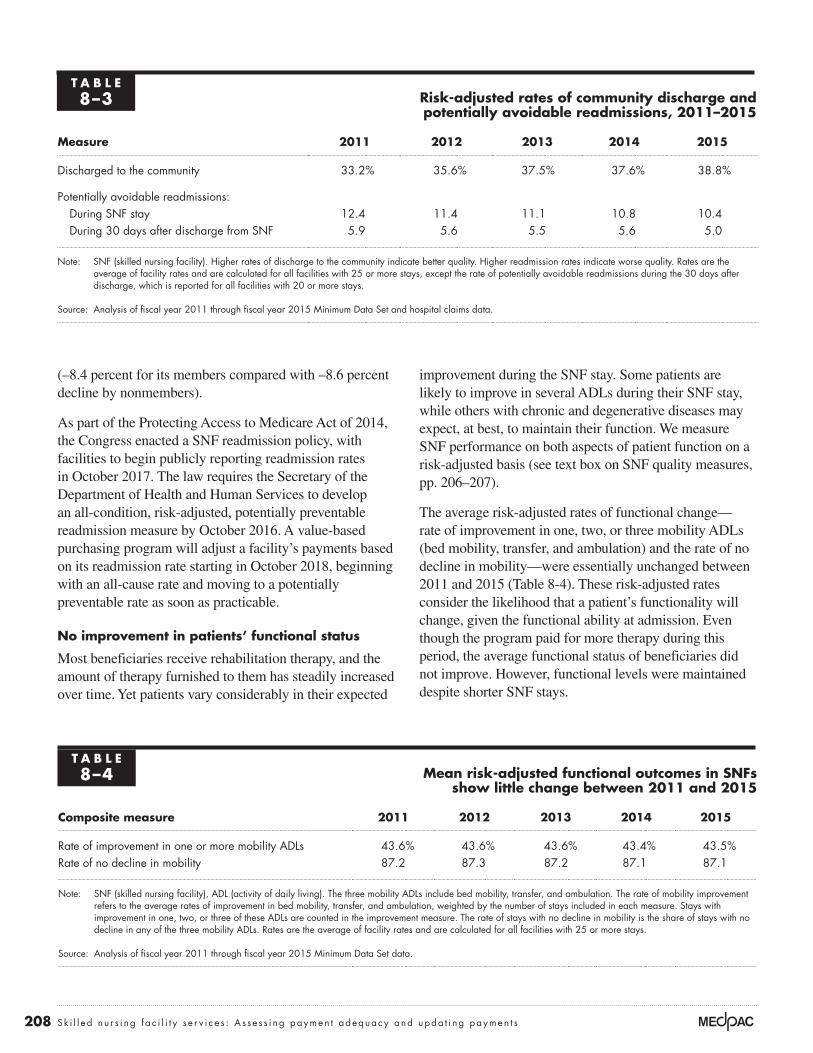
Between 2011 and 2015, average readmission rates during the SNF stay declined 2 percentage points to 10.4 percent in 2015. Over the same period, the readmission rate for the 30 days after discharge from the SNF declined almost a percentage point (to 5.0 percent in 2015) and the community discharge rates increased to 38.8 percent (Table 8-3, p. 208).14
Measures of skilled nursing facility quality (cont.)
Two risk-adjusted measures of functional change gauge the share of a facility’s stays during which patients’ function improves (the rate of improvement in one, two, or three mobility measures—bed mobility, transfer, and ambulation) and the share of stays during which patients’ functioning does not decline (including stays with improvement and stays with no change), given the prognosis of the facility’s patients. Change is measured by comparing initial and discharge assessments. For patients who go on to use long-term nursing home care, the assessment closest to the end of Medicare coverage is used, as long as it is within 30 days of the end of the SNF stay. Although the initial assessment often occurs toward the end of the first week of the stay, the Minimum Data Set information pertains to the number of times over the past week that assistance was provided, rather than the recorded functional status at a single point in time. Therefore, any measurement error due to the reliance on an assessment conducted at the end of the first week of the stay is unlikely and would not affect our ability
to examine quality trends over time, unless changes occur from year to year when initial assessments are conducted.
The initial assessment conducted during each stay is used to assign the patient to 1 of 22 case-mix groups using 3 measures of mobility—bed mobility, transfer, and ambulation (Kramer et al. 2014). This classification system acts as a form of risk adjustment, differentiating patients based on their expected ability to perform the three mobility-related activities of daily living (ADLs). A patient’s prognosis is measured using the patient’s ability to eat and dress because these two ADLs encompass cognitive functioning and other dimensions of physical functioning that facilitate rehabilitation.
Risk-adjusted rates compare a facility’s observed rates with its expected rates ((actual rate / expected rate) × the national average rate) based on the mix of patients across functional outcome groups. Each facility-level measure combines the functional-status information for the three mobility measures. ■
208 Sk i l l e d n u r s i ng f a c i l i t y s e r v i c e s : A s s e s s i ng paymen t adequacy and upda t i ng paymen t s
(–8.4 percent for its members compared with –8.6 percent decline by nonmembers).
As part of the Protecting Access to Medicare Act of 2014, the Congress enacted a SNF readmission policy, with facilities to begin publicly reporting readmission rates in October 2017. The law requires the Secretary of the Department of Health and Human Services to develop an all-condition, risk-adjusted, potentially preventable readmission measure by October 2016. A value-based purchasing program will adjust a facility’s payments based on its readmission rate starting in October 2018, beginning with an all-cause rate and moving to a potentially preventable rate as soon as practicable.
No improvement in patients’ functional status
Most beneficiaries receive rehabilitation therapy, and the amount of therapy furnished to them has steadily increased over time. Yet patients vary considerably in their expected
improvement during the SNF stay. Some patients are likely to improve in several ADLs during their SNF stay, while others with chronic and degenerative diseases may expect, at best, to maintain their function. We measure SNF performance on both aspects of patient function on a risk-adjusted basis (see text box on SNF quality measures, pp. 206–207).
The average risk-adjusted rates of functional change—rate of improvement in one, two, or three mobility ADLs (bed mobility, transfer, and ambulation) and the rate of no decline in mobility—were essentially unchanged between 2011 and 2015 (Table 8-4). These risk-adjusted rates consider the likelihood that a patient’s functionality will change, given the functional ability at admission. Even though the program paid for more therapy during this period, the average functional status of beneficiaries did not improve. However, functional levels were maintained despite shorter SNF stays.
T A B L E8–3 Risk-adjusted rates of community discharge and
potentially avoidable readmissions, 2011–2015
Measure 2011 2012 2013 2014 2015
Discharged to the community 33.2% 35.6% 37.5% 37.6% 38.8%
Potentially avoidable readmissions:During SNF stay 12.4 11.4 11.1 10.8 10.4During 30 days after discharge from SNF 5.9 5.6 5.5 5.6 5.0
Note: SNF (skilled nursing facility). Higher rates of discharge to the community indicate better quality. Higher readmission rates indicate worse quality. Rates are the average of facility rates and are calculated for all facilities with 25 or more stays, except the rate of potentially avoidable readmissions during the 30 days after discharge, which is reported for all facilities with 20 or more stays.
Source: Analysis of fiscal year 2011 through fiscal year 2015 Minimum Data Set and hospital claims data.
T A B L E8–4 Mean risk-adjusted functional outcomes in SNFs
show little change between 2011 and 2015
Composite measure 2011 2012 2013 2014 2015
Rate of improvement in one or more mobility ADLs 43.6% 43.6% 43.6% 43.4% 43.5%Rate of no decline in mobility 87.2 87.3 87.2 87.1 87.1
Note: SNF (skilled nursing facility), ADL (activity of daily living). The three mobility ADLs include bed mobility, transfer, and ambulation. The rate of mobility improvement refers to the average rates of improvement in bed mobility, transfer, and ambulation, weighted by the number of stays included in each measure. Stays with improvement in one, two, or three of these ADLs are counted in the improvement measure. The rate of stays with no decline in mobility is the share of stays with no decline in any of the three mobility ADLs. Rates are the average of facility rates and are calculated for all facilities with 25 or more stays.
Source: Analysis of fiscal year 2011 through fiscal year 2015 Minimum Data Set data.
209 Repo r t t o t h e Cong r e s s : Med i ca r e Paymen t P o l i c y | Ma r ch 2017
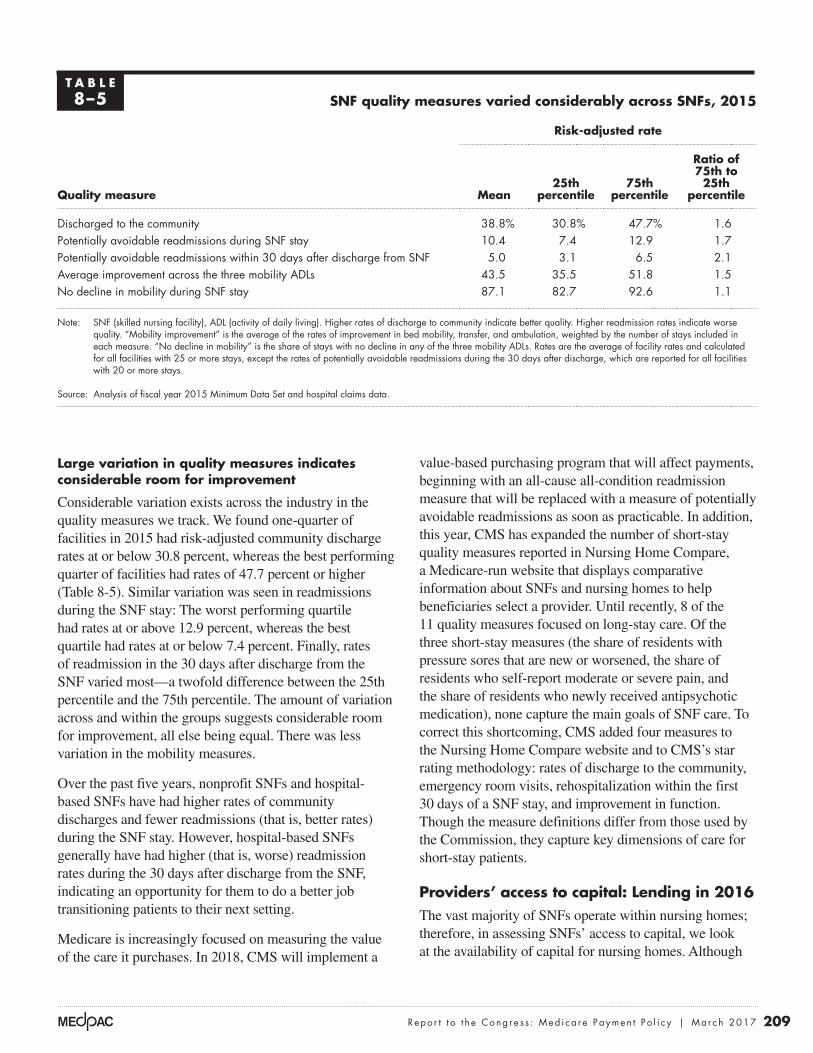
Large variation in quality measures indicates considerable room for improvement
Considerable variation exists across the industry in the quality measures we track. We found one-quarter of facilities in 2015 had risk-adjusted community discharge rates at or below 30.8 percent, whereas the best performing quarter of facilities had rates of 47.7 percent or higher (Table 8-5). Similar variation was seen in readmissions during the SNF stay: The worst performing quartile had rates at or above 12.9 percent, whereas the best quartile had rates at or below 7.4 percent. Finally, rates of readmission in the 30 days after discharge from the SNF varied most—a twofold difference between the 25th percentile and the 75th percentile. The amount of variation across and within the groups suggests considerable room for improvement, all else being equal. There was less variation in the mobility measures.
Over the past five years, nonprofit SNFs and hospital-based SNFs have had higher rates of community discharges and fewer readmissions (that is, better rates) during the SNF stay. However, hospital-based SNFs generally have had higher (that is, worse) readmission rates during the 30 days after discharge from the SNF, indicating an opportunity for them to do a better job transitioning patients to their next setting.
Medicare is increasingly focused on measuring the value of the care it purchases. In 2018, CMS will implement a
value-based purchasing program that will affect payments, beginning with an all-cause all-condition readmission measure that will be replaced with a measure of potentially avoidable readmissions as soon as practicable. In addition, this year, CMS has expanded the number of short-stay quality measures reported in Nursing Home Compare, a Medicare-run website that displays comparative information about SNFs and nursing homes to help beneficiaries select a provider. Until recently, 8 of the 11 quality measures focused on long-stay care. Of the three short-stay measures (the share of residents with pressure sores that are new or worsened, the share of residents who self-report moderate or severe pain, and the share of residents who newly received antipsychotic medication), none capture the main goals of SNF care. To correct this shortcoming, CMS added four measures to the Nursing Home Compare website and to CMS’s star rating methodology: rates of discharge to the community, emergency room visits, rehospitalization within the first 30 days of a SNF stay, and improvement in function. Though the measure definitions differ from those used by the Commission, they capture key dimensions of care for short-stay patients.
Providers’ access to capital: Lending in 2016The vast majority of SNFs operate within nursing homes; therefore, in assessing SNFs’ access to capital, we look at the availability of capital for nursing homes. Although
T A B L E8–5 SNF quality measures varied considerably across SNFs, 2015
Quality measure
Risk-adjusted rate
Mean25th
percentile75th
percentile
Ratio of 75th to 25th
percentile
Discharged to the community 38.8% 30.8% 47.7% 1.6Potentially avoidable readmissions during SNF stay 10.4 7.4 12.9 1.7Potentially avoidable readmissions within 30 days after discharge from SNF 5.0 3.1 6.5 2.1Average improvement across the three mobility ADLs 43.5 35.5 51.8 1.5No decline in mobility during SNF stay 87.1 82.7 92.6 1.1
Note: SNF (skilled nursing facility), ADL (activity of daily living). Higher rates of discharge to community indicate better quality. Higher readmission rates indicate worse quality. “Mobility improvement” is the average of the rates of improvement in bed mobility, transfer, and ambulation, weighted by the number of stays included in each measure. “No decline in mobility” is the share of stays with no decline in any of the three mobility ADLs. Rates are the average of facility rates and calculated for all facilities with 25 or more stays, except the rates of potentially avoidable readmissions during the 30 days after discharge, which are reported for all facilities with 20 or more stays.
Source: Analysis of fiscal year 2015 Minimum Data Set and hospital claims data.
210 Sk i l l e d n u r s i ng f a c i l i t y s e r v i c e s : A s s e s s i ng paymen t adequacy and upda t i ng paymen t s
Medicare makes up the minority share of almost all facilities’ revenues, many operators see Medicare as their best payer.
Access to capital was adequate in 2016 but getting tighter (and more expensive) and is expected to remain so in 2017. Lending wariness reflects broad changes in post-acute care, not the adequacy of Medicare’s payments. Medicare is regarded as a preferred payer of SNF services.
Many market analysts report that, during 2016, capital has been generally available, but some lenders are cautious for several reasons. First, analysts expect SNF volume to decline as bundled payments shorten stays or eliminate them entirely (with beneficiaries discharged home). Analysts note that the transition from FFS to alternative payment models (including accountable care organizations (ACOs), bundled payment, and value-based purchasing) will require many SNFs to change their practices and enhance their capabilities to achieve and report good outcomes. Another factor is the expanded enrollment of beneficiaries in MA and the accompanying lower SNF days and revenues. Finally, the Department of Justice’s investigations into therapy billing practices will require some providers to change their current therapy practices. One analyst commented that the industry is in the midst of sorting out the “right” level of SNF utilization. As evidence of the wariness of this sector by some, real estate investment trusts (REITs) with large SNF holdings have moved their SNF holdings into separate REITs or have sold a portion of their SNF assets. In November, Kindred Healthcare announced its exit from the SNF sector, noting it will partner with SNFs rather than operate its own facilities (Kindred 2016b).
On the other hand, some companies have added SNFs to their portfolios to position themselves for payment reforms spanning the PAC settings, knowing the aging demographics will continue to fuel demand for these services (Diversicare 2016b, Ensign Group 2016a, Irving Levin Associates Inc. 2016a). Analysts we spoke with also observed that while alternative payment models raise the uncertainty of this sector’s financial performance, the models will create opportunities for those providers that successfully partner with hospitals to secure admissions, achieve good quality outcomes, and effectively coordinate the care for their patients. One analyst expects to see continued consolidation as SNFs partner with health care systems or ready themselves for ACOs (Connole 2016). As evidence of the demand for SNF properties, the average price per bed increased 12 percent between 2014
and 2015, driven in part by the volume of relatively high-end sales (over $100,00 per bed) and buyers believing a facility in the right market with the right patient mix can be successful (Irving Levin Associates Inc. 2016b). One analyst noted that while capital is available for the real estate side of the business, there was less available for operators to make the investments in their capabilities to treat higher acuity patients (Kaufmann 2016).
As payment reforms shift risk from payer to provider, providers seek to lower their costs through consolidation and integration of services across the PAC continuum and to prove their value (Cain Brothers 2016). Strategies include expanding holdings to include multiple PAC service lines (such as home health and hospice), solidifying presence across the continuum within select markets, aligning with hospital referral sources, and developing the data and analytics to track outcome measures. Referring partners want to see SNF performance on multiple measures (such as the 5-star rating system, the facility’s state survey results, readmission rates, community discharge, patient satisfaction, and average length of stay (Kuebrich 2016)). Some providers have increased staff training and quality improvement activities to lower rehospitalizations and increase staff retention (a perennial problem).
To date, most SNFs offer both subacute and long-term care services. We continue to hear that the nursing home industry is increasingly bifurcated into providers with the capabilities to furnish skilled nursing care (also called subacute or transitional care) and meet the challenges posed by alternative payment models and another group of SNFs without those capabilities. For this latter group, long-term care will constitute a growing share of their facility volume. Some analysts we spoke with thought that operators will concentrate on one segment or the other and then match their service provision and cost structures accordingly.
Analysts noted that good operators will continue to have adequate access to capital but that lenders have gotten more selective and have increased their underwriting requirements. In conducting their due diligence on potential borrowers, lenders review the quality of the potential borrower’s management team, cash flow and amount of debt, operating trends (volume, occupancy, payer mix, and patient mix), quality of care, ability to carry out strategic plans to shift payer or service mix, and the specificity of the facility’s plans to meet performance goals. Lenders continue to focus on facilities with high
211 Repo r t t o t h e Cong r e s s : Med i ca r e Paymen t P o l i c y | Ma r ch 2017
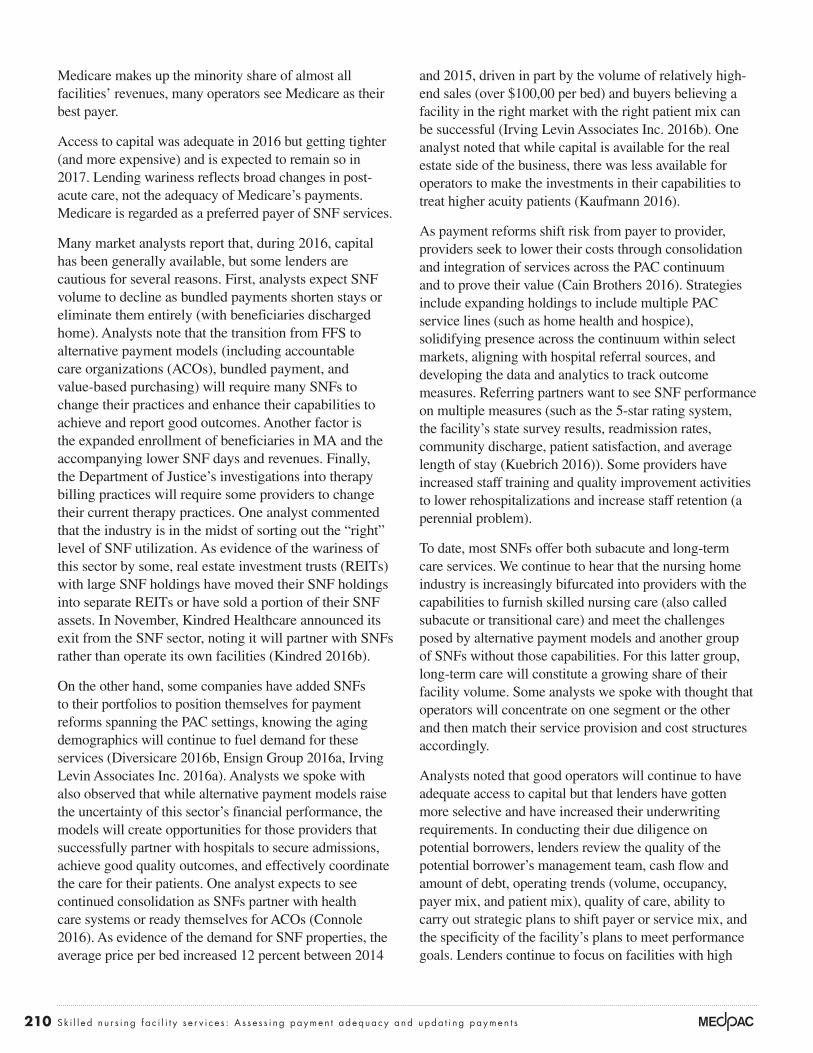
SNF services in fiscal year 2016 was $31.1 billion (Figure 8-2) (Office of the Actuary 2016b). In 2011, payments were unusually high because the rates for the new case-mix classification system included an adjustment that was too large for the mix of therapy modalities assumed in setting the rates. The industry took advantage of the new policies by quickly shifting its mix of modalities, and payments increased by over 14 percent in 2011. To correct for the excessive payment, CMS revised the adjustment downward in 2012, and total payments declined between 2012 and 2014. Since 2014, the growth in spending has averaged 5.7 percent a year. CMS projects spending in fiscal year 2017 to increase almost 7 percent to $33.2 billion. On a per FFS beneficiary basis, spending in 2015 ($796) was about 4 percent higher than in 2014.
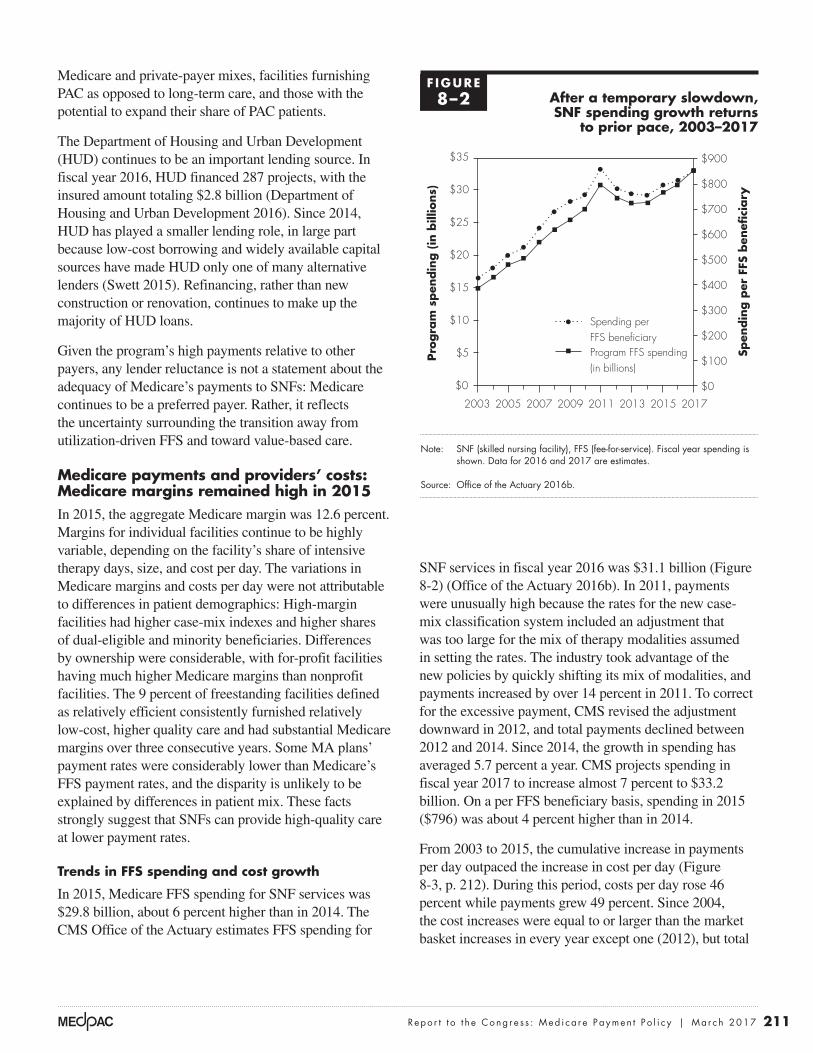
From 2003 to 2015, the cumulative increase in payments per day outpaced the increase in cost per day (Figure 8-3, p. 212). During this period, costs per day rose 46 percent while payments grew 49 percent. Since 2004, the cost increases were equal to or larger than the market basket increases in every year except one (2012), but total
Medicare and private-payer mixes, facilities furnishing PAC as opposed to long-term care, and those with the potential to expand their share of PAC patients.
The Department of Housing and Urban Development (HUD) continues to be an important lending source. In fiscal year 2016, HUD financed 287 projects, with the insured amount totaling $2.8 billion (Department of Housing and Urban Development 2016). Since 2014, HUD has played a smaller lending role, in large part because low-cost borrowing and widely available capital sources have made HUD only one of many alternative lenders (Swett 2015). Refinancing, rather than new construction or renovation, continues to make up the majority of HUD loans.
Given the program’s high payments relative to other payers, any lender reluctance is not a statement about the adequacy of Medicare’s payments to SNFs: Medicare continues to be a preferred payer. Rather, it reflects the uncertainty surrounding the transition away from utilization-driven FFS and toward value-based care.
Medicare payments and providers’ costs: Medicare margins remained high in 2015In 2015, the aggregate Medicare margin was 12.6 percent. Margins for individual facilities continue to be highly variable, depending on the facility’s share of intensive therapy days, size, and cost per day. The variations in Medicare margins and costs per day were not attributable to differences in patient demographics: High-margin facilities had higher case-mix indexes and higher shares of dual-eligible and minority beneficiaries. Differences by ownership were considerable, with for-profit facilities having much higher Medicare margins than nonprofit facilities. The 9 percent of freestanding facilities defined as relatively efficient consistently furnished relatively low-cost, higher quality care and had substantial Medicare margins over three consecutive years. Some MA plans’ payment rates were considerably lower than Medicare’s FFS payment rates, and the disparity is unlikely to be explained by differences in patient mix. These facts strongly suggest that SNFs can provide high-quality care at lower payment rates.
Trends in FFS spending and cost growth
In 2015, Medicare FFS spending for SNF services was $29.8 billion, about 6 percent higher than in 2014. The CMS Office of the Actuary estimates FFS spending for
F IGURE8–2 After a temporary slowdown,
SNF spending growth returns to prior pace, 2003–2017
Note: SNF (skilled nursing facility), FFS (fee-for-service). Fiscal year spending is shown. Data for 2016 and 2017 are estimates.
Source: Office of the Actuary 2016b.
Overpayments...FIGUREX-X
Notes about this graph:• I did this all manually, since it has two axes.
Note: Note and Source in InDesign.
Pro
gra
m s
pen
din
g (
in b
illio
ns)
Spen
din
g p
er F
FS b
enefi
ciary
$25
$35
$15
$10
$30
$20
$5
$900
$800
$700
$600
$400
$500
$300
$200
$100
$0$0
2003 2005 2015 20172007 2009 2011 2013
Spending perFFS beneficiaryProgram FFS spending(in billions)
0
5
10
15
20
25
30
35
0
100
200
300
400
500
600
700
800
900
212 Sk i l l e d n u r s i ng f a c i l i t y s e r v i c e s : A s s e s s i ng paymen t adequacy and upda t i ng paymen t s
all-payer total margin, in contrast, reflects the financial performance of the entire facility across all lines of business (such as ancillary and therapy services, hospice, and home health care) and all payers (including Medicaid, private insurers, and managed care) and is presented as context for the Commission’s update recommendation.
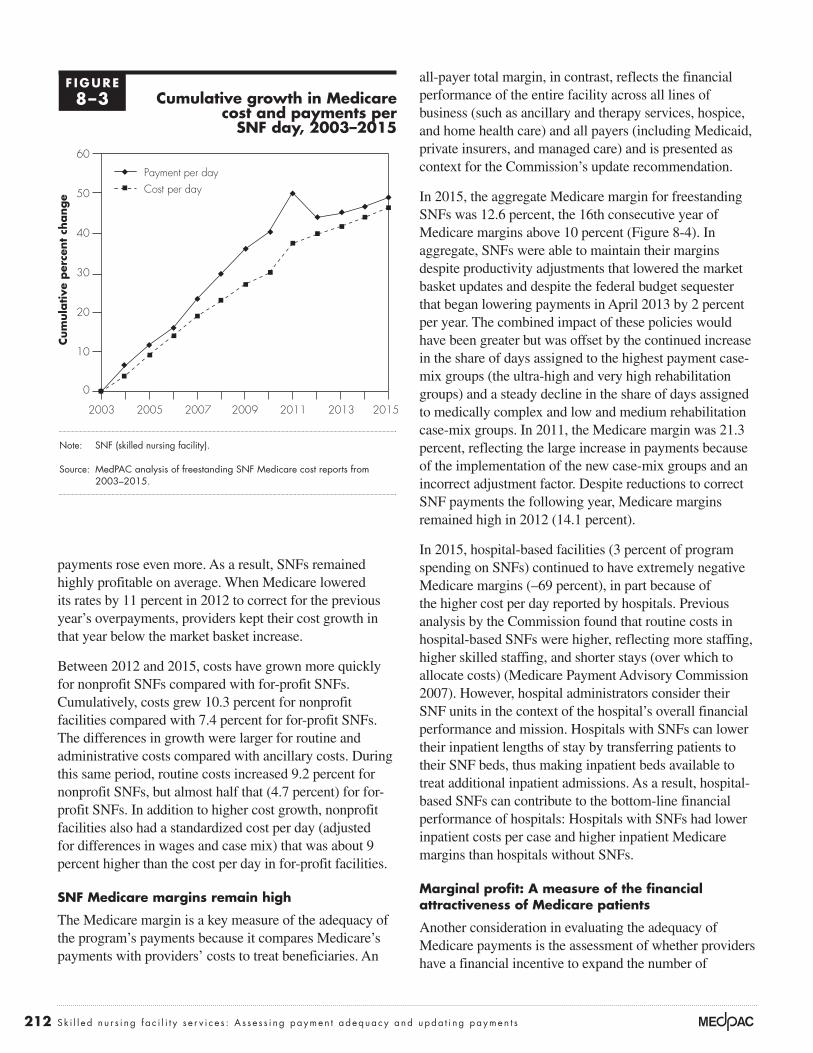
In 2015, the aggregate Medicare margin for freestanding SNFs was 12.6 percent, the 16th consecutive year of Medicare margins above 10 percent (Figure 8-4). In aggregate, SNFs were able to maintain their margins despite productivity adjustments that lowered the market basket updates and despite the federal budget sequester that began lowering payments in April 2013 by 2 percent per year. The combined impact of these policies would have been greater but was offset by the continued increase in the share of days assigned to the highest payment case-mix groups (the ultra-high and very high rehabilitation groups) and a steady decline in the share of days assigned to medically complex and low and medium rehabilitation case-mix groups. In 2011, the Medicare margin was 21.3 percent, reflecting the large increase in payments because of the implementation of the new case-mix groups and an incorrect adjustment factor. Despite reductions to correct SNF payments the following year, Medicare margins remained high in 2012 (14.1 percent).
In 2015, hospital-based facilities (3 percent of program spending on SNFs) continued to have extremely negative Medicare margins (–69 percent), in part because of the higher cost per day reported by hospitals. Previous analysis by the Commission found that routine costs in hospital-based SNFs were higher, reflecting more staffing, higher skilled staffing, and shorter stays (over which to allocate costs) (Medicare Payment Advisory Commission 2007). However, hospital administrators consider their SNF units in the context of the hospital’s overall financial performance and mission. Hospitals with SNFs can lower their inpatient lengths of stay by transferring patients to their SNF beds, thus making inpatient beds available to treat additional inpatient admissions. As a result, hospital-based SNFs can contribute to the bottom-line financial performance of hospitals: Hospitals with SNFs had lower inpatient costs per case and higher inpatient Medicare margins than hospitals without SNFs.
Marginal profit: A measure of the financial attractiveness of Medicare patients
Another consideration in evaluating the adequacy of Medicare payments is the assessment of whether providers have a financial incentive to expand the number of
payments rose even more. As a result, SNFs remained highly profitable on average. When Medicare lowered its rates by 11 percent in 2012 to correct for the previous year’s overpayments, providers kept their cost growth in that year below the market basket increase.
Between 2012 and 2015, costs have grown more quickly for nonprofit SNFs compared with for-profit SNFs. Cumulatively, costs grew 10.3 percent for nonprofit facilities compared with 7.4 percent for for-profit SNFs. The differences in growth were larger for routine and administrative costs compared with ancillary costs. During this same period, routine costs increased 9.2 percent for nonprofit SNFs, but almost half that (4.7 percent) for for-profit SNFs. In addition to higher cost growth, nonprofit facilities also had a standardized cost per day (adjusted for differences in wages and case mix) that was about 9 percent higher than the cost per day in for-profit facilities.
SNF Medicare margins remain high
The Medicare margin is a key measure of the adequacy of the program’s payments because it compares Medicare’s payments with providers’ costs to treat beneficiaries. An
F IGURE8–3 Cumulative growth in Medicare
cost and payments per SNF day, 2003–2015
Note: SNF (skilled nursing facility).
Source: MedPAC analysis of freestanding SNF Medicare cost reports from 2003–2015.
Cum
ula
tive
per
cent
change
Cumulative change...FIGUREX-X
0
10
20
30
40
50
60Cost per day
Payment per day
2015201320112009200720052003
Notes about this graph:• Data is in the datasheet. Make updates in the datasheet.• I had to force return the items on the x-axis. They will reflow if I update the data.• I had to manually draw tick marks and axis lines because they kept resetting when I changed any data.• Use direct selection tool to select items for modification. Otherwise if you use the black selection tool, they will reset to graph default when you change the data.• Use paragraph styles (and object styles) to format.
Note: Note and Source in InDesign.
Payment per dayCost per day
213 Repo r t t o t h e Cong r e s s : Med i ca r e Paymen t P o l i c y | Ma r ch 2017
in 2015 was at least 20.4 percent. Because Medicare payments far exceed facilities’ marginal costs, facilities with available beds have an incentive to admit Medicare patients, also signifying a positive indicator of patient access.
High and widely varying SNF Medicare margins indicate reforms to the PPS are still needed
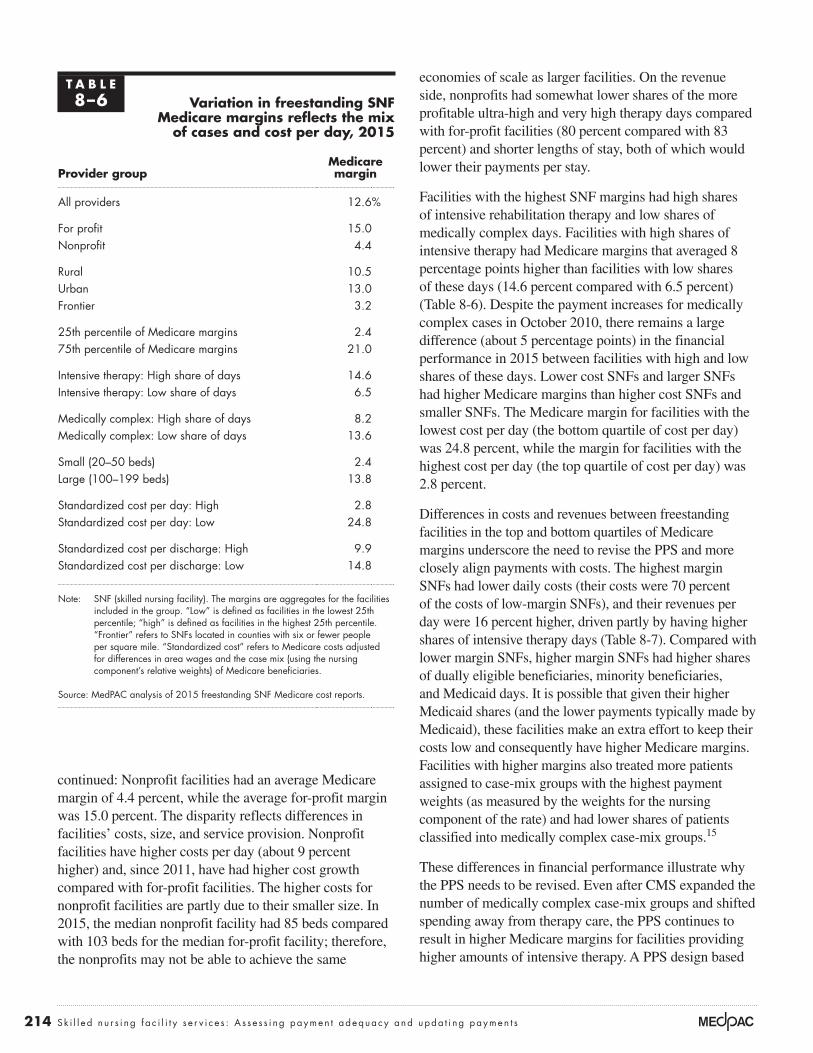
The persistently high Medicare margins and their wide variation indicate that the PPS needs to be revised and rebased so that payments more closely match patient characteristics, not the services provided to them. In 2015, one-quarter of freestanding SNFs had Medicare margins of 21 percent or higher, while another quarter of freestanding SNFs had margins of 2.4 percent or lower (Table 8-6, p. 214). One-fifth (about the same share as last year) of SNFs had negative Medicare margins (data not shown).
Over the past 10 years, for-profit facilities’ Medicare margins have averaged about 10 percentage points higher than nonprofit facilities’ margins. In 2015, the disparity
Medicare beneficiaries they serve. In considering whether to treat a patient, the provider compares the marginal revenue it will receive for treating one additional patient (i.e., the Medicare payment) with its marginal costs—that is, the costs that vary with volume, in this case, to treat one additional patient. If Medicare payments do not cover a facility’s marginal costs, the provider could have a disincentive to admit Medicare beneficiaries. To operationalize this concept, we compare payments for Medicare services to marginal costs, approximated as:
Marginal profit = (payments for Medicare services – (total Medicare costs – fixed building and equipment costs)) / Medicare payments
This comparison is a lower bound on the marginal profit because we ignore any potential labor costs that are fixed. For providers with available data, the marginal profit
Aggregate freestanding SNF Medicare margins have been above 10 percent since 2000
Note: SNF (skilled nursing facility).
Source: MedPAC analysis of freestanding SNF cost reports, 2000–2015.
Freestanding Medicare margins....M
edic
are
marg
in (
in p
erce
nt)
FIGUREX-X
Note: Note and Source are in InDesign.
Source:
Notes about this graph:• Data is in the datasheet. Make updates in the datasheet.• WATCH FOR GLITCHY RESETS WHEN YOU UPDATE DATA!!!!• The column totals were added manually.• I had to manually draw tick marks and axis lines because they kept resetting when I changed any data.• I can’t delete the legend, so I’ll just have to crop it out in InDesign.• Use direct selection tool to select items for modification. Otherwise if you use the black selection tool, they will reset to graph default when you change the data.• Use paragraph styles (and object styles) to format. • Data was from: R:\Groups\MGA\data book 2007\data book 2007 chp1
0
5
10
15
20
25
2015201420132012201120102009200820072006200520042003200220012000
11.010.1
17.7 17.5
13.813.1 12.8
14.7
16.718.0
19.4
21.3
14.113.2 12.7 12.6
F IGURE8–4
214 Sk i l l e d n u r s i ng f a c i l i t y s e r v i c e s : A s s e s s i ng paymen t adequacy and upda t i ng paymen t s
economies of scale as larger facilities. On the revenue side, nonprofits had somewhat lower shares of the more profitable ultra-high and very high therapy days compared with for-profit facilities (80 percent compared with 83 percent) and shorter lengths of stay, both of which would lower their payments per stay.
Facilities with the highest SNF margins had high shares of intensive rehabilitation therapy and low shares of medically complex days. Facilities with high shares of intensive therapy had Medicare margins that averaged 8 percentage points higher than facilities with low shares of these days (14.6 percent compared with 6.5 percent) (Table 8-6). Despite the payment increases for medically complex cases in October 2010, there remains a large difference (about 5 percentage points) in the financial performance in 2015 between facilities with high and low shares of these days. Lower cost SNFs and larger SNFs had higher Medicare margins than higher cost SNFs and smaller SNFs. The Medicare margin for facilities with the lowest cost per day (the bottom quartile of cost per day) was 24.8 percent, while the margin for facilities with the highest cost per day (the top quartile of cost per day) was 2.8 percent.
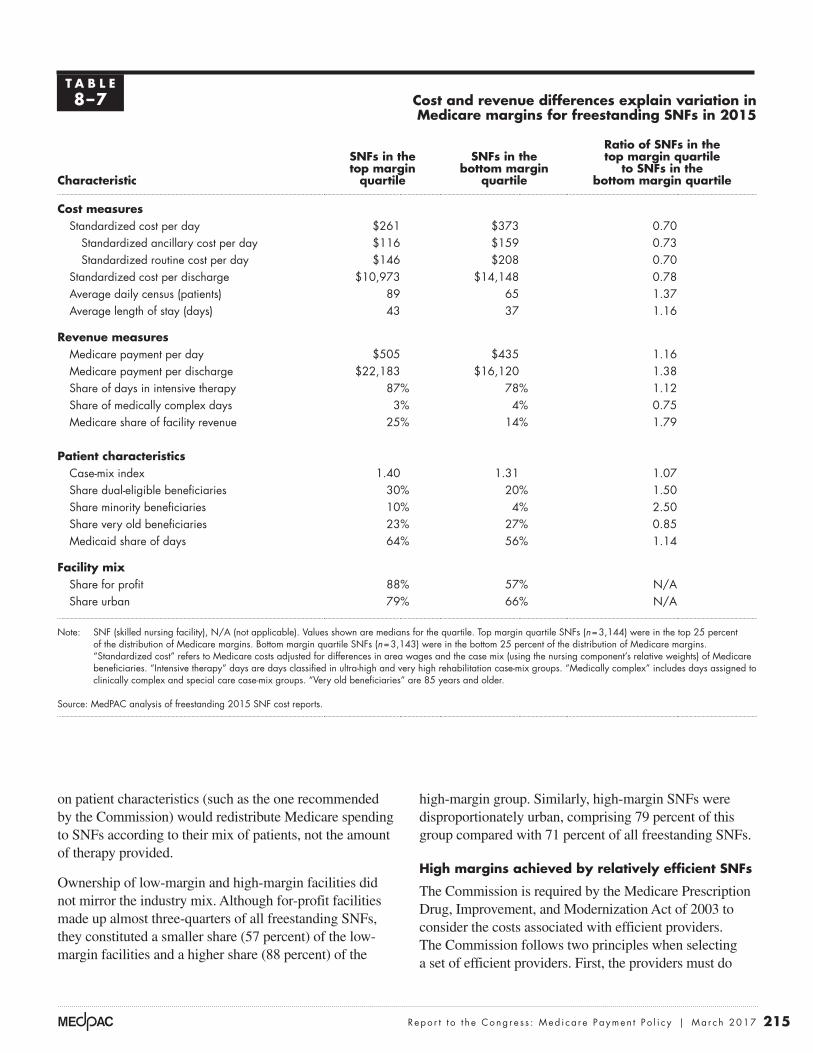
Differences in costs and revenues between freestanding facilities in the top and bottom quartiles of Medicare margins underscore the need to revise the PPS and more closely align payments with costs. The highest margin SNFs had lower daily costs (their costs were 70 percent of the costs of low-margin SNFs), and their revenues per day were 16 percent higher, driven partly by having higher shares of intensive therapy days (Table 8-7). Compared with lower margin SNFs, higher margin SNFs had higher shares of dually eligible beneficiaries, minority beneficiaries, and Medicaid days. It is possible that given their higher Medicaid shares (and the lower payments typically made by Medicaid), these facilities make an extra effort to keep their costs low and consequently have higher Medicare margins. Facilities with higher margins also treated more patients assigned to case-mix groups with the highest payment weights (as measured by the weights for the nursing component of the rate) and had lower shares of patients classified into medically complex case-mix groups.15
These differences in financial performance illustrate why the PPS needs to be revised. Even after CMS expanded the number of medically complex case-mix groups and shifted spending away from therapy care, the PPS continues to result in higher Medicare margins for facilities providing higher amounts of intensive therapy. A PPS design based
continued: Nonprofit facilities had an average Medicare margin of 4.4 percent, while the average for-profit margin was 15.0 percent. The disparity reflects differences in facilities’ costs, size, and service provision. Nonprofit facilities have higher costs per day (about 9 percent higher) and, since 2011, have had higher cost growth compared with for-profit facilities. The higher costs for nonprofit facilities are partly due to their smaller size. In 2015, the median nonprofit facility had 85 beds compared with 103 beds for the median for-profit facility; therefore, the nonprofits may not be able to achieve the same
T A B L E8–6 Variation in freestanding SNF
Medicare margins reflects the mix of cases and cost per day, 2015
Provider groupMedicare margin
All providers 12.6%
For profit 15.0Nonprofit 4.4
Rural 10.5Urban 13.0Frontier 3.2
25th percentile of Medicare margins 2.475th percentile of Medicare margins 21.0
Intensive therapy: High share of days 14.6Intensive therapy: Low share of days 6.5
Medically complex: High share of days 8.2Medically complex: Low share of days 13.6
Small (20–50 beds) 2.4Large (100–199 beds) 13.8
Standardized cost per day: High 2.8Standardized cost per day: Low 24.8
Standardized cost per discharge: High 9.9Standardized cost per discharge: Low 14.8
Note: SNF (skilled nursing facility). The margins are aggregates for the facilities included in the group. “Low” is defined as facilities in the lowest 25th percentile; “high” is defined as facilities in the highest 25th percentile. “Frontier” refers to SNFs located in counties with six or fewer people per square mile. “Standardized cost” refers to Medicare costs adjusted for differences in area wages and the case mix (using the nursing component’s relative weights) of Medicare beneficiaries.
Source: MedPAC analysis of 2015 freestanding SNF Medicare cost reports.
215 Repo r t t o t h e Cong r e s s : Med i ca r e Paymen t P o l i c y | Ma r ch 2017
high-margin group. Similarly, high-margin SNFs were disproportionately urban, comprising 79 percent of this group compared with 71 percent of all freestanding SNFs.
High margins achieved by relatively efficient SNFs
The Commission is required by the Medicare Prescription Drug, Improvement, and Modernization Act of 2003 to consider the costs associated with efficient providers. The Commission follows two principles when selecting a set of efficient providers. First, the providers must do
on patient characteristics (such as the one recommended by the Commission) would redistribute Medicare spending to SNFs according to their mix of patients, not the amount of therapy provided.
Ownership of low-margin and high-margin facilities did not mirror the industry mix. Although for-profit facilities made up almost three-quarters of all freestanding SNFs, they constituted a smaller share (57 percent) of the low-margin facilities and a higher share (88 percent) of the
T A B L E8–7 Cost and revenue differences explain variation in
Medicare margins for freestanding SNFs in 2015
Characteristic
SNFs in the top margin
quartile
SNFs in the bottom margin
quartile
Ratio of SNFs in the top margin quartile
to SNFs in the bottom margin quartile
Cost measures Standardized cost per day $261 $373 0.70
Standardized ancillary cost per day $116 $159 0.73Standardized routine cost per day $146 $208 0.70
Standardized cost per discharge $10,973 $14,148 0.78Average daily census (patients) 89 65 1.37Average length of stay (days) 43 37 1.16
Revenue measuresMedicare payment per day $505 $435 1.16Medicare payment per discharge $22,183 $16,120 1.38Share of days in intensive therapy 87% 78% 1.12Share of medically complex days 3% 4% 0.75Medicare share of facility revenue 25% 14% 1.79
Patient characteristicsCase-mix index 1.40 1.31 1.07Share dual-eligible beneficiaries 30% 20% 1.50Share minority beneficiaries 10% 4% 2.50Share very old beneficiaries 23% 27% 0.85Medicaid share of days 64% 56% 1.14
Facility mixShare for profit 88% 57% N/AShare urban 79% 66% N/A
Note: SNF (skilled nursing facility), N/A (not applicable). Values shown are medians for the quartile. Top margin quartile SNFs (n = 3,144) were in the top 25 percent of the distribution of Medicare margins. Bottom margin quartile SNFs (n = 3,143) were in the bottom 25 percent of the distribution of Medicare margins. “Standardized cost” refers to Medicare costs adjusted for differences in area wages and the case mix (using the nursing component’s relative weights) of Medicare beneficiaries. “Intensive therapy” days are days classified in ultra-high and very high rehabilitation case-mix groups. “Medically complex” includes days assigned to clinically complex and special care case-mix groups. “Very old beneficiaries” are 85 years and older.
Source: MedPAC analysis of freestanding 2015 SNF cost reports.
216 Sk i l l e d n u r s i ng f a c i l i t y s e r v i c e s : A s s e s s i ng paymen t adequacy and upda t i ng paymen t s
looked at costs per day that were adjusted for differences in area wages and case mix. To assess quality, we examined risk-adjusted rates of community discharge and potentially avoidable readmissions that occurred during the SNF stay. To be included in the relatively efficient group, a SNF had to be in the best third of the distribution of at least one measure and not in the bottom third on any measure for three consecutive years. This year, we also required that SNFs not be part of CMS’s Special Focus Facility Initiative for any portion of time covered by the definition (2012–2014).16 This criterion excluded four facilities from the pool of efficient providers. Having applied the cost, quality, and special-focus exclusions,
relatively well on both cost and quality metrics. Second, the performance has to be consistent, meaning that the provider cannot have poor performance on any metric over three years. The Commission’s approach is to develop a set of criteria and then examine how many providers meet them. It does not establish a set share (for example, 10 percent) of providers to be considered efficient and then define criteria to meet that pool size.
To identify efficient SNFs, we examined the financial performance of freestanding SNFs with consistent cost and quality performance on two measures (see text box on identifying efficient providers). To measure costs, we
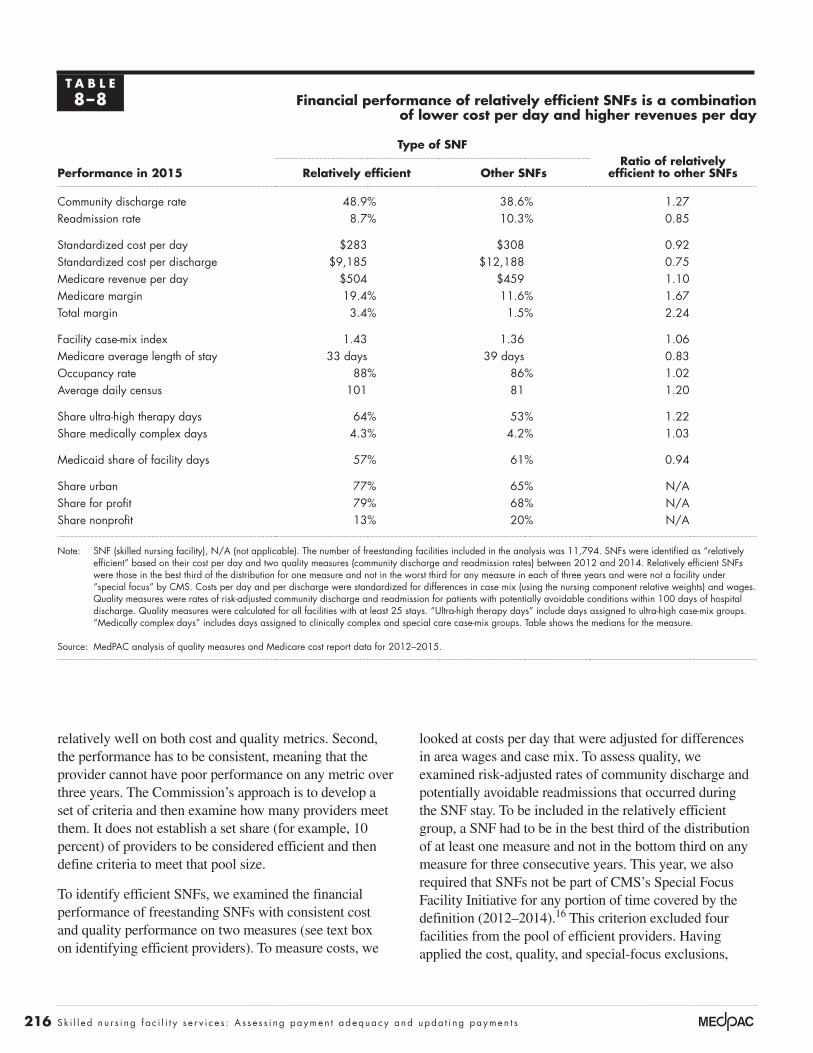
T A B L E8–8 Financial performance of relatively efficient SNFs is a combination
of lower cost per day and higher revenues per day
Type of SNFRatio of relatively
efficient to other SNFsPerformance in 2015 Relatively efficient Other SNFs
Community discharge rate 48.9% 38.6% 1.27Readmission rate 8.7% 10.3% 0.85
Standardized cost per day $283 $308 0.92Standardized cost per discharge $9,185 $12,188 0.75Medicare revenue per day $504 $459 1.10Medicare margin 19.4% 11.6% 1.67Total margin 3.4% 1.5% 2.24
Facility case-mix index 1.43 1.36 1.06Medicare average length of stay 33 days 39 days 0.83Occupancy rate 88% 86% 1.02Average daily census 101 81 1.20
Share ultra-high therapy days 64% 53% 1.22Share medically complex days 4.3% 4.2% 1.03
Medicaid share of facility days 57% 61% 0.94
Share urban 77% 65% N/AShare for profit 79% 68% N/AShare nonprofit 13% 20% N/A
Note: SNF (skilled nursing facility), N/A (not applicable). The number of freestanding facilities included in the analysis was 11,794. SNFs were identified as “relatively efficient” based on their cost per day and two quality measures (community discharge and readmission rates) between 2012 and 2014. Relatively efficient SNFs were those in the best third of the distribution for one measure and not in the worst third for any measure in each of three years and were not a facility under “special focus” by CMS. Costs per day and per discharge were standardized for differences in case mix (using the nursing component relative weights) and wages. Quality measures were rates of risk-adjusted community discharge and readmission for patients with potentially avoidable conditions within 100 days of hospital discharge. Quality measures were calculated for all facilities with at least 25 stays. “Ultra-high therapy days” include days assigned to ultra-high case-mix groups. “Medically complex days” includes days assigned to clinically complex and special care case-mix groups. Table shows the medians for the measure.
Source: MedPAC analysis of quality measures and Medicare cost report data for 2012–2015.
217 Repo r t t o t h e Cong r e s s : Med i ca r e Paymen t P o l i c y | Ma r ch 2017
revenue strategies to maximize their Medicare payments. The median Medicare margin for efficient SNFs was 19.4 percent, and their total margin (for all payers and all lines of business) was 3.4 percent. Relatively efficient facilities were more likely to be urban and for profit. Efficient SNFs were located in 44 states, including 3 in frontier locations.
We recognize that a SNF may appear to be efficient with respect to the care it provides but may not be when considering a patient’s entire episode of care. For example, SNFs that discharge patients to other post-acute care services may keep their own costs low but shift costs to other settings, thus increasing total Medicare program spending. In the future, we may compare providers’ costs for an episode of care.
FFS payments for SNF care are considerably higher than managed care/MA payments for four publicly traded nursing home companies
Another indicator that Medicare’s payments under the SNF PPS are too high is the comparison of FFS and managed care/MA payments. (We create a combined term because MA makes up the majority of the rates reported as “managed care payments.”) We compared Medicare FFS and managed care/MA payments at four nursing home
we found that 9 percent (1,007 of the 11,794 facilities included in the analysis) provided relatively low-cost, high-quality care, a small increase from the 8 percent reported last year. Of these, 60 percent were identified as efficient last year.
Our analyses found that SNFs can have relatively low costs and provide relatively good quality care while maintaining high margins (Table 8-8). Compared with other SNFs in 2015, relatively efficient SNFs had community discharge rates that were 27 percent higher and readmission rates that were 15 percent lower. Standardized costs per day were 8 percent lower than for other SNFs.
We did not find significant differences between relatively efficient and other SNFs in terms of occupancy rates, but efficient SNFs had higher daily censuses (101 compared with 81). Efficient facilities had more complex case mixes (driven in part by higher therapy intensity) but shorter stays. In terms of case-mix days, efficient providers had higher shares of the most intensive therapy days and comparable shares of medically complex days. The higher therapy intensity raised their daily Medicare payments relative to all SNFs, indicating that, in addition to controlling their costs, efficient providers pursued
Identifying relatively efficient skilled nursing facilities
We defined relatively efficient skilled nursing facilities (SNFs) as those with relatively low costs per day and good quality care
for three years in a row, 2012 through 2014. The cost per day was calculated using cost report data and was adjusted for differences in case mix (using the nursing component relative weights) and wages. Quality measures were risk-adjusted rates of community discharge and potentially avoidable readmissions during the SNF stay. Only facilities with at least 25 stays were included in the quality measures.
The method we used to assess performance attempts to limit drawing incorrect conclusions about performance based on poor data. Using three years to categorize SNFs as efficient (rather than just one year) avoids categorizing providers based on random variation or on one “unusual” year. In addition, by first assigning
a SNF to a group and then examining the group’s performance in the next year, we avoided having a facility’s poor data affect both its own categorization and the assessment of the group’s performance. Thus, a SNF’s erroneous data could result in its inaccurate assignment to a group, but because the group’s performance is assessed with data from later years, these “bad” data would not directly affect the assessment of the group’s performance.
Of the 1,007 facilities identified as efficient, only 5 percent of SNFs were in the best third on all three measures. Just over half were in the best third for at least one quality measure but were not in the best cost third, less than a quarter were in the lowest cost third but not in the best third on either quality measure, and less than one-quarter were in the best third for the cost and at least one quality measure. ■
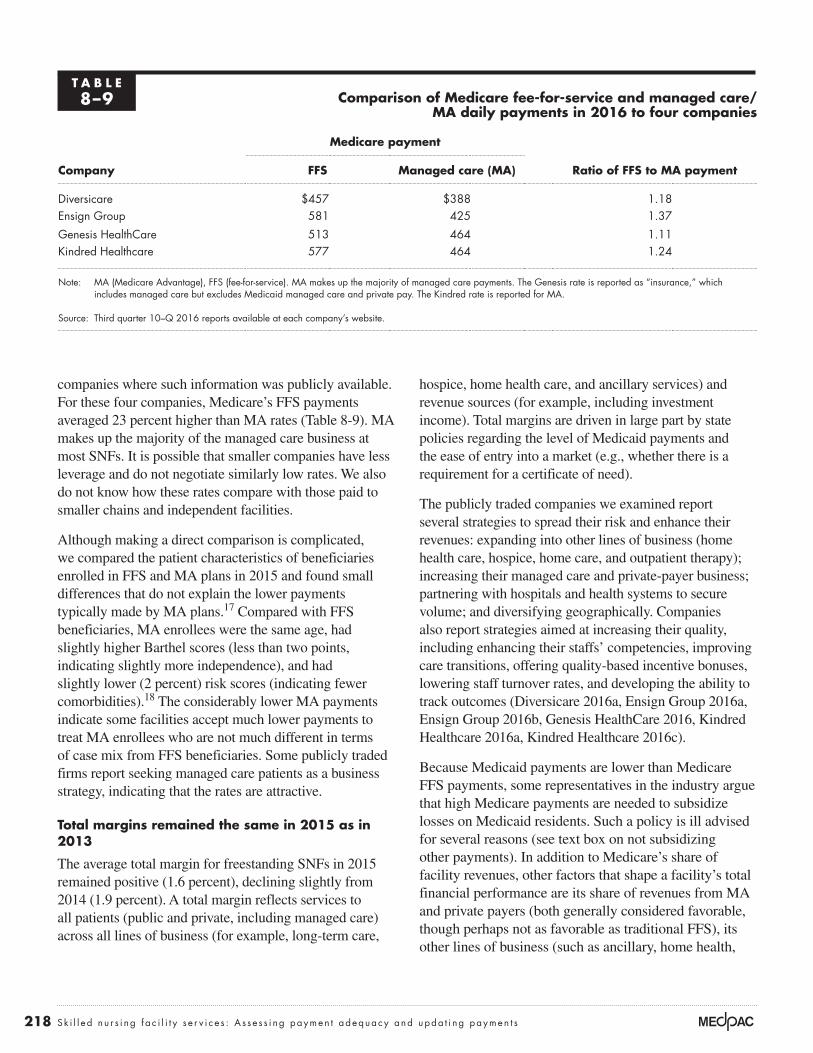
218 Sk i l l e d n u r s i ng f a c i l i t y s e r v i c e s : A s s e s s i ng paymen t adequacy and upda t i ng paymen t s
hospice, home health care, and ancillary services) and revenue sources (for example, including investment income). Total margins are driven in large part by state policies regarding the level of Medicaid payments and the ease of entry into a market (e.g., whether there is a requirement for a certificate of need).
The publicly traded companies we examined report several strategies to spread their risk and enhance their revenues: expanding into other lines of business (home health care, hospice, home care, and outpatient therapy); increasing their managed care and private-payer business; partnering with hospitals and health systems to secure volume; and diversifying geographically. Companies also report strategies aimed at increasing their quality, including enhancing their staffs’ competencies, improving care transitions, offering quality-based incentive bonuses, lowering staff turnover rates, and developing the ability to track outcomes (Diversicare 2016a, Ensign Group 2016a, Ensign Group 2016b, Genesis HealthCare 2016, Kindred Healthcare 2016a, Kindred Healthcare 2016c).
Because Medicaid payments are lower than Medicare FFS payments, some representatives in the industry argue that high Medicare payments are needed to subsidize losses on Medicaid residents. Such a policy is ill advised for several reasons (see text box on not subsidizing other payments). In addition to Medicare’s share of facility revenues, other factors that shape a facility’s total financial performance are its share of revenues from MA and private payers (both generally considered favorable, though perhaps not as favorable as traditional FFS), its other lines of business (such as ancillary, home health,
companies where such information was publicly available. For these four companies, Medicare’s FFS payments averaged 23 percent higher than MA rates (Table 8-9). MA makes up the majority of the managed care business at most SNFs. It is possible that smaller companies have less leverage and do not negotiate similarly low rates. We also do not know how these rates compare with those paid to smaller chains and independent facilities.
Although making a direct comparison is complicated, we compared the patient characteristics of beneficiaries enrolled in FFS and MA plans in 2015 and found small differences that do not explain the lower payments typically made by MA plans.17 Compared with FFS beneficiaries, MA enrollees were the same age, had slightly higher Barthel scores (less than two points, indicating slightly more independence), and had slightly lower (2 percent) risk scores (indicating fewer comorbidities).18 The considerably lower MA payments indicate some facilities accept much lower payments to treat MA enrollees who are not much different in terms of case mix from FFS beneficiaries. Some publicly traded firms report seeking managed care patients as a business strategy, indicating that the rates are attractive.
Total margins remained the same in 2015 as in 2013
The average total margin for freestanding SNFs in 2015 remained positive (1.6 percent), declining slightly from 2014 (1.9 percent). A total margin reflects services to all patients (public and private, including managed care) across all lines of business (for example, long-term care,
T A B L E8–9 Comparison of Medicare fee-for-service and managed care/
MA daily payments in 2016 to four companies
Company
Medicare payment
Ratio of FFS to MA paymentFFS Managed care (MA)
Diversicare $457 $388 1.18Ensign Group 581 425 1.37
Genesis HealthCare 513 464 1.11Kindred Healthcare 577 464 1.24
Note: MA (Medicare Advantage), FFS (fee-for-service). MA makes up the majority of managed care payments. The Genesis rate is reported as “insurance,” which includes managed care but excludes Medicaid managed care and private pay. The Kindred rate is reported for MA.
Source: Third quarter 10–Q 2016 reports available at each company’s website.
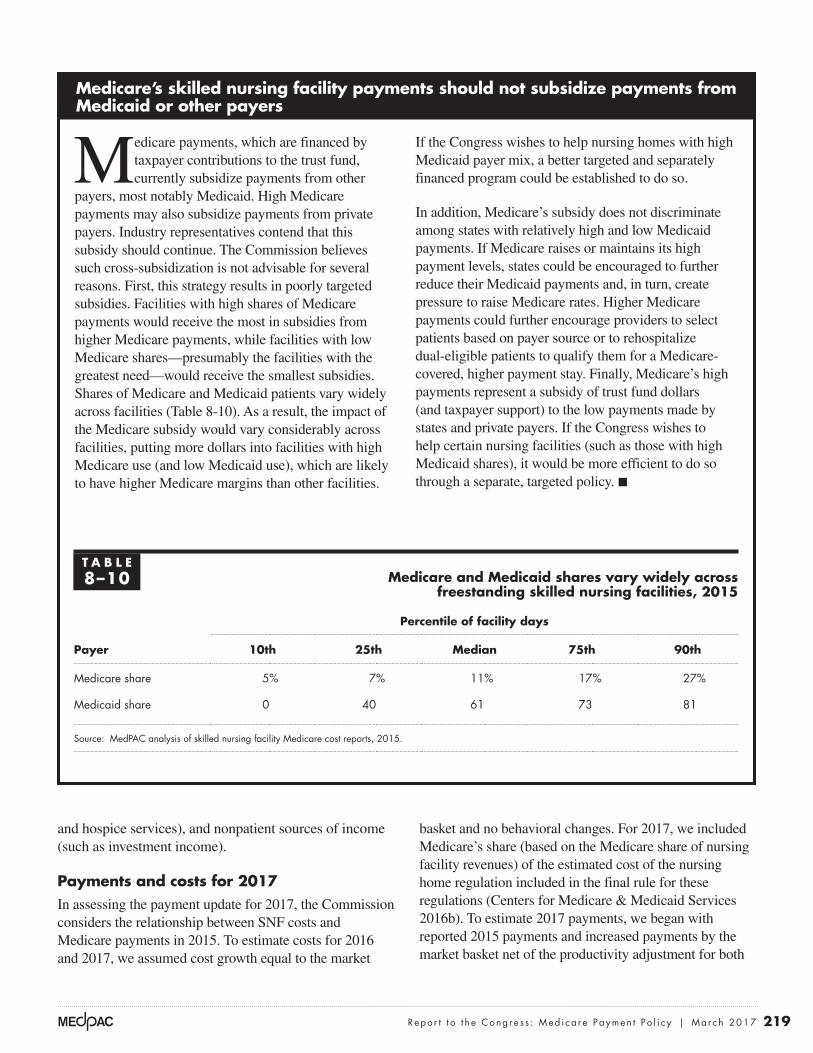
219 Repo r t t o t h e Cong r e s s : Med i ca r e Paymen t P o l i c y | Ma r ch 2017
basket and no behavioral changes. For 2017, we included Medicare’s share (based on the Medicare share of nursing facility revenues) of the estimated cost of the nursing home regulation included in the final rule for these regulations (Centers for Medicare & Medicaid Services 2016b). To estimate 2017 payments, we began with reported 2015 payments and increased payments by the market basket net of the productivity adjustment for both
and hospice services), and nonpatient sources of income (such as investment income).
Payments and costs for 2017In assessing the payment update for 2017, the Commission considers the relationship between SNF costs and Medicare payments in 2015. To estimate costs for 2016 and 2017, we assumed cost growth equal to the market
Medicare’s skilled nursing facility payments should not subsidize payments from Medicaid or other payers
Medicare payments, which are financed by taxpayer contributions to the trust fund, currently subsidize payments from other
payers, most notably Medicaid. High Medicare payments may also subsidize payments from private payers. Industry representatives contend that this subsidy should continue. The Commission believes such cross-subsidization is not advisable for several reasons. First, this strategy results in poorly targeted subsidies. Facilities with high shares of Medicare payments would receive the most in subsidies from higher Medicare payments, while facilities with low Medicare shares—presumably the facilities with the greatest need—would receive the smallest subsidies. Shares of Medicare and Medicaid patients vary widely across facilities (Table 8-10). As a result, the impact of the Medicare subsidy would vary considerably across facilities, putting more dollars into facilities with high Medicare use (and low Medicaid use), which are likely to have higher Medicare margins than other facilities.
If the Congress wishes to help nursing homes with high Medicaid payer mix, a better targeted and separately financed program could be established to do so.
In addition, Medicare’s subsidy does not discriminate among states with relatively high and low Medicaid payments. If Medicare raises or maintains its high payment levels, states could be encouraged to further reduce their Medicaid payments and, in turn, create pressure to raise Medicare rates. Higher Medicare payments could further encourage providers to select patients based on payer source or to rehospitalize dual-eligible patients to qualify them for a Medicare-covered, higher payment stay. Finally, Medicare’s high payments represent a subsidy of trust fund dollars (and taxpayer support) to the low payments made by states and private payers. If the Congress wishes to help certain nursing facilities (such as those with high Medicaid shares), it would be more efficient to do so through a separate, targeted policy. ■
T A B L E8–10 Medicare and Medicaid shares vary widely across
freestanding skilled nursing facilities, 2015
Payer
Percentile of facility days
10th 25th Median 75th 90th
Medicare share 5% 7% 11% 17% 27%
Medicaid share 0 40 61 73 81
Source: MedPAC analysis of skilled nursing facility Medicare cost reports, 2015.
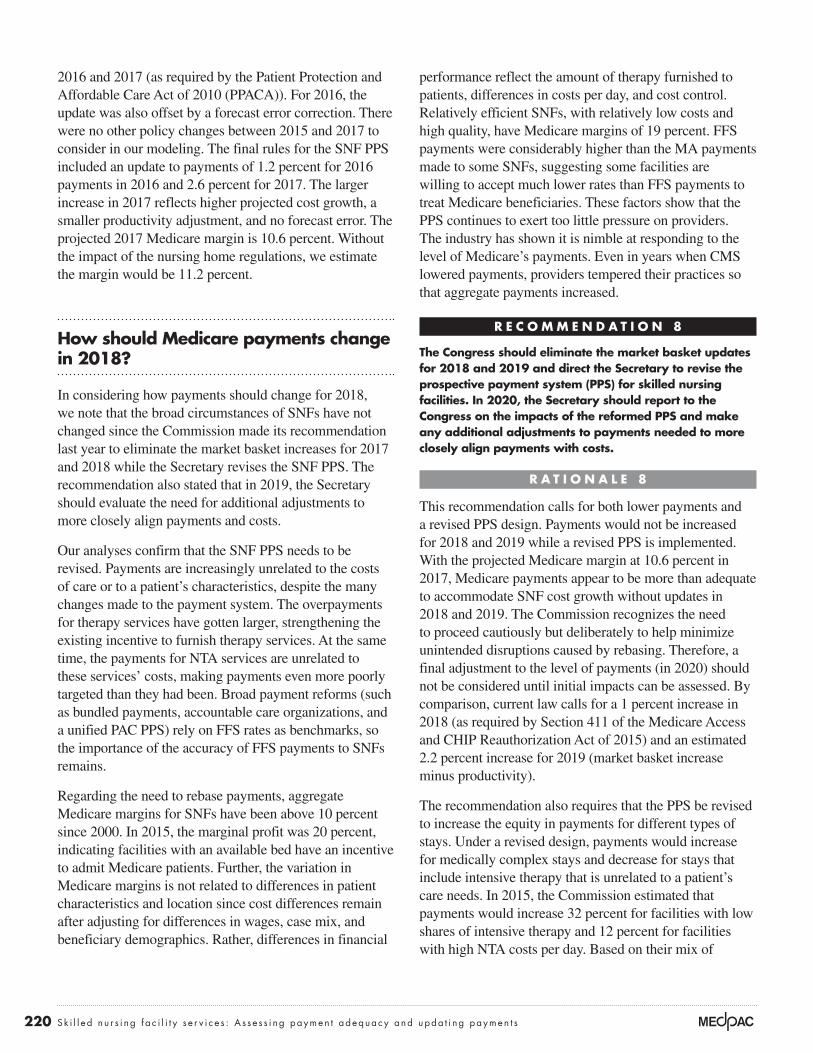
220 Sk i l l e d n u r s i ng f a c i l i t y s e r v i c e s : A s s e s s i ng paymen t adequacy and upda t i ng paymen t s
performance reflect the amount of therapy furnished to patients, differences in costs per day, and cost control. Relatively efficient SNFs, with relatively low costs and high quality, have Medicare margins of 19 percent. FFS payments were considerably higher than the MA payments made to some SNFs, suggesting some facilities are willing to accept much lower rates than FFS payments to treat Medicare beneficiaries. These factors show that the PPS continues to exert too little pressure on providers. The industry has shown it is nimble at responding to the level of Medicare’s payments. Even in years when CMS lowered payments, providers tempered their practices so that aggregate payments increased.
R E C O M M E N D A T I O N 8
The Congress should eliminate the market basket updates for 2018 and 2019 and direct the Secretary to revise the prospective payment system (PPS) for skilled nursing facilities. In 2020, the Secretary should report to the Congress on the impacts of the reformed PPS and make any additional adjustments to payments needed to more closely align payments with costs.
R A T I O N A L E 8
This recommendation calls for both lower payments and a revised PPS design. Payments would not be increased for 2018 and 2019 while a revised PPS is implemented. With the projected Medicare margin at 10.6 percent in 2017, Medicare payments appear to be more than adequate to accommodate SNF cost growth without updates in 2018 and 2019. The Commission recognizes the need to proceed cautiously but deliberately to help minimize unintended disruptions caused by rebasing. Therefore, a final adjustment to the level of payments (in 2020) should not be considered until initial impacts can be assessed. By comparison, current law calls for a 1 percent increase in 2018 (as required by Section 411 of the Medicare Access and CHIP Reauthorization Act of 2015) and an estimated 2.2 percent increase for 2019 (market basket increase minus productivity).
The recommendation also requires that the PPS be revised to increase the equity in payments for different types of stays. Under a revised design, payments would increase for medically complex stays and decrease for stays that include intensive therapy that is unrelated to a patient’s care needs. In 2015, the Commission estimated that payments would increase 32 percent for facilities with low shares of intensive therapy and 12 percent for facilities with high NTA costs per day. Based on their mix of
2016 and 2017 (as required by the Patient Protection and Affordable Care Act of 2010 (PPACA)). For 2016, the update was also offset by a forecast error correction. There were no other policy changes between 2015 and 2017 to consider in our modeling. The final rules for the SNF PPS included an update to payments of 1.2 percent for 2016 payments in 2016 and 2.6 percent for 2017. The larger increase in 2017 reflects higher projected cost growth, a smaller productivity adjustment, and no forecast error. The projected 2017 Medicare margin is 10.6 percent. Without the impact of the nursing home regulations, we estimate the margin would be 11.2 percent.
How should Medicare payments change in 2018?
In considering how payments should change for 2018, we note that the broad circumstances of SNFs have not changed since the Commission made its recommendation last year to eliminate the market basket increases for 2017 and 2018 while the Secretary revises the SNF PPS. The recommendation also stated that in 2019, the Secretary should evaluate the need for additional adjustments to more closely align payments and costs.
Our analyses confirm that the SNF PPS needs to be revised. Payments are increasingly unrelated to the costs of care or to a patient’s characteristics, despite the many changes made to the payment system. The overpayments for therapy services have gotten larger, strengthening the existing incentive to furnish therapy services. At the same time, the payments for NTA services are unrelated to these services’ costs, making payments even more poorly targeted than they had been. Broad payment reforms (such as bundled payments, accountable care organizations, and a unified PAC PPS) rely on FFS rates as benchmarks, so the importance of the accuracy of FFS payments to SNFs remains.
Regarding the need to rebase payments, aggregate Medicare margins for SNFs have been above 10 percent since 2000. In 2015, the marginal profit was 20 percent, indicating facilities with an available bed have an incentive to admit Medicare patients. Further, the variation in Medicare margins is not related to differences in patient characteristics and location since cost differences remain after adjusting for differences in wages, case mix, and beneficiary demographics. Rather, differences in financial
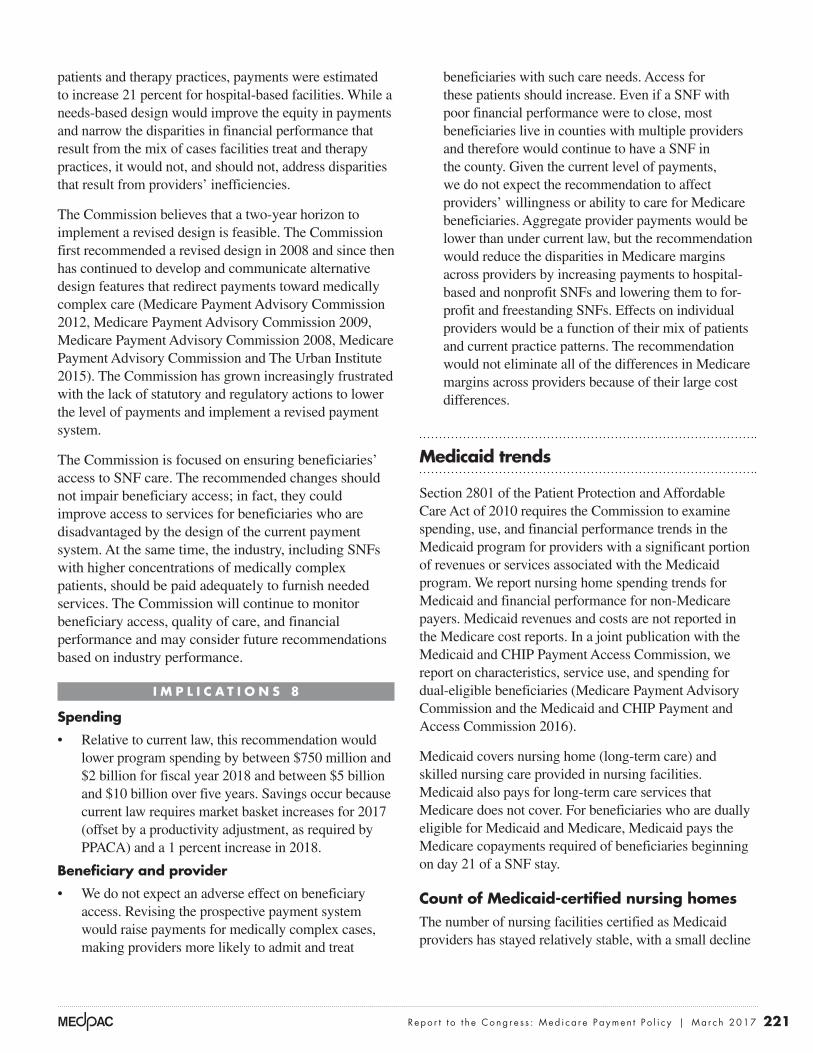
221 Repo r t t o t h e Cong r e s s : Med i ca r e Paymen t P o l i c y | Ma r ch 2017
beneficiaries with such care needs. Access for these patients should increase. Even if a SNF with poor financial performance were to close, most beneficiaries live in counties with multiple providers and therefore would continue to have a SNF in the county. Given the current level of payments, we do not expect the recommendation to affect providers’ willingness or ability to care for Medicare beneficiaries. Aggregate provider payments would be lower than under current law, but the recommendation would reduce the disparities in Medicare margins across providers by increasing payments to hospital-based and nonprofit SNFs and lowering them to for-profit and freestanding SNFs. Effects on individual providers would be a function of their mix of patients and current practice patterns. The recommendation would not eliminate all of the differences in Medicare margins across providers because of their large cost differences.
Medicaid trends
Section 2801 of the Patient Protection and Affordable Care Act of 2010 requires the Commission to examine spending, use, and financial performance trends in the Medicaid program for providers with a significant portion of revenues or services associated with the Medicaid program. We report nursing home spending trends for Medicaid and financial performance for non-Medicare payers. Medicaid revenues and costs are not reported in the Medicare cost reports. In a joint publication with the Medicaid and CHIP Payment Access Commission, we report on characteristics, service use, and spending for dual-eligible beneficiaries (Medicare Payment Advisory Commission and the Medicaid and CHIP Payment and Access Commission 2016).
Medicaid covers nursing home (long-term care) and skilled nursing care provided in nursing facilities. Medicaid also pays for long-term care services that Medicare does not cover. For beneficiaries who are dually eligible for Medicaid and Medicare, Medicaid pays the Medicare copayments required of beneficiaries beginning on day 21 of a SNF stay.
Count of Medicaid-certified nursing homesThe number of nursing facilities certified as Medicaid providers has stayed relatively stable, with a small decline
patients and therapy practices, payments were estimated to increase 21 percent for hospital-based facilities. While a needs-based design would improve the equity in payments and narrow the disparities in financial performance that result from the mix of cases facilities treat and therapy practices, it would not, and should not, address disparities that result from providers’ inefficiencies.
The Commission believes that a two-year horizon to implement a revised design is feasible. The Commission first recommended a revised design in 2008 and since then has continued to develop and communicate alternative design features that redirect payments toward medically complex care (Medicare Payment Advisory Commission 2012, Medicare Payment Advisory Commission 2009, Medicare Payment Advisory Commission 2008, Medicare Payment Advisory Commission and The Urban Institute 2015). The Commission has grown increasingly frustrated with the lack of statutory and regulatory actions to lower the level of payments and implement a revised payment system.
The Commission is focused on ensuring beneficiaries’ access to SNF care. The recommended changes should not impair beneficiary access; in fact, they could improve access to services for beneficiaries who are disadvantaged by the design of the current payment system. At the same time, the industry, including SNFs with higher concentrations of medically complex patients, should be paid adequately to furnish needed services. The Commission will continue to monitor beneficiary access, quality of care, and financial performance and may consider future recommendations based on industry performance.
I M P L I C A T I O N S 8
Spending
• Relative to current law, this recommendation would lower program spending by between $750 million and $2 billion for fiscal year 2018 and between $5 billion and $10 billion over five years. Savings occur because current law requires market basket increases for 2017 (offset by a productivity adjustment, as required by PPACA) and a 1 percent increase in 2018.
Beneficiary and provider
• We do not expect an adverse effect on beneficiary access. Revising the prospective payment system would raise payments for medically complex cases, making providers more likely to admit and treat
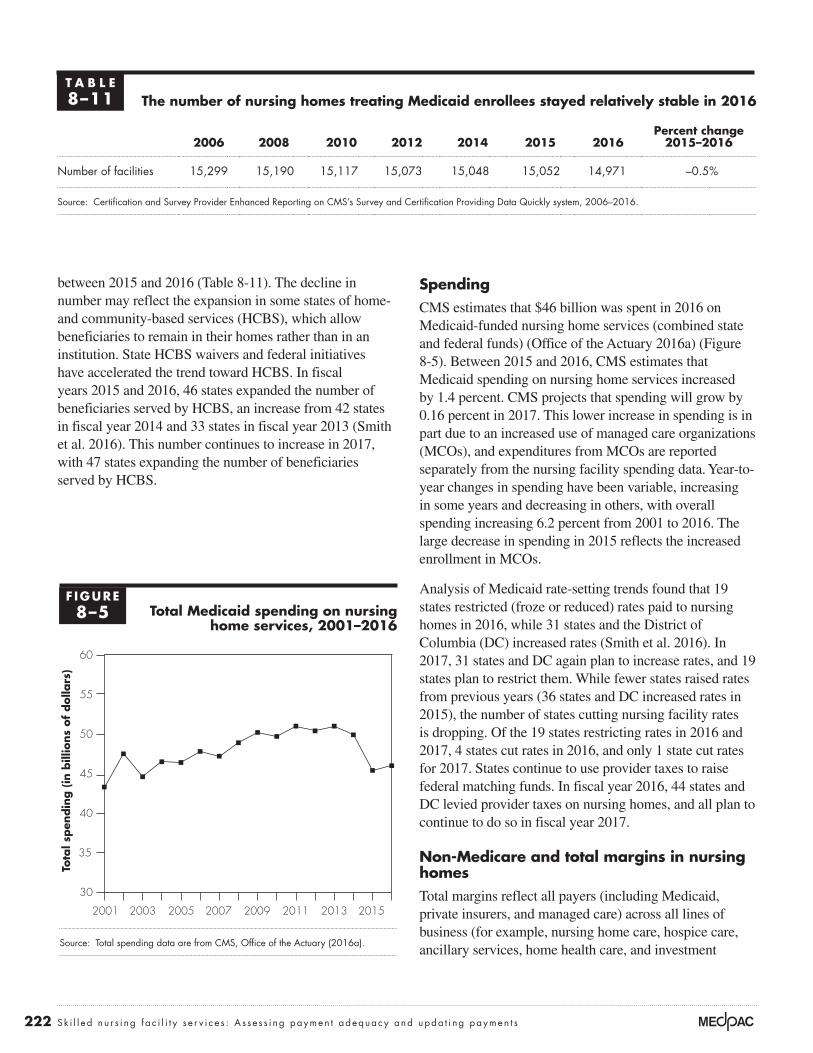
222 Sk i l l e d n u r s i ng f a c i l i t y s e r v i c e s : A s s e s s i ng paymen t adequacy and upda t i ng paymen t s
SpendingCMS estimates that $46 billion was spent in 2016 on Medicaid-funded nursing home services (combined state and federal funds) (Office of the Actuary 2016a) (Figure 8-5). Between 2015 and 2016, CMS estimates that Medicaid spending on nursing home services increased by 1.4 percent. CMS projects that spending will grow by 0.16 percent in 2017. This lower increase in spending is in part due to an increased use of managed care organizations (MCOs), and expenditures from MCOs are reported separately from the nursing facility spending data. Year-to-year changes in spending have been variable, increasing in some years and decreasing in others, with overall spending increasing 6.2 percent from 2001 to 2016. The large decrease in spending in 2015 reflects the increased enrollment in MCOs.
Analysis of Medicaid rate-setting trends found that 19 states restricted (froze or reduced) rates paid to nursing homes in 2016, while 31 states and the District of Columbia (DC) increased rates (Smith et al. 2016). In 2017, 31 states and DC again plan to increase rates, and 19 states plan to restrict them. While fewer states raised rates from previous years (36 states and DC increased rates in 2015), the number of states cutting nursing facility rates is dropping. Of the 19 states restricting rates in 2016 and 2017, 4 states cut rates in 2016, and only 1 state cut rates for 2017. States continue to use provider taxes to raise federal matching funds. In fiscal year 2016, 44 states and DC levied provider taxes on nursing homes, and all plan to continue to do so in fiscal year 2017.
Non-Medicare and total margins in nursing homes Total margins reflect all payers (including Medicaid, private insurers, and managed care) across all lines of business (for example, nursing home care, hospice care, ancillary services, home health care, and investment
between 2015 and 2016 (Table 8-11). The decline in number may reflect the expansion in some states of home- and community-based services (HCBS), which allow beneficiaries to remain in their homes rather than in an institution. State HCBS waivers and federal initiatives have accelerated the trend toward HCBS. In fiscal years 2015 and 2016, 46 states expanded the number of beneficiaries served by HCBS, an increase from 42 states in fiscal year 2014 and 33 states in fiscal year 2013 (Smith et al. 2016). This number continues to increase in 2017, with 47 states expanding the number of beneficiaries served by HCBS.
T A B L E8–11 The number of nursing homes treating Medicaid enrollees stayed relatively stable in 2016
2006 2008 2010 2012 2014 2015 2016Percent change
2015–2016
Number of facilities 15,299 15,190 15,117 15,073 15,048 15,052 14,971 –0.5%
Source: Certification and Survey Provider Enhanced Reporting on CMS’s Survey and Certification Providing Data Quickly system, 2006–2016.
F IGURE8–5 Total Medicaid spending on nursing
home services, 2001–2016
Source: Total spending data are from CMS, Office of the Actuary (2016a).
Tota
l spen
din
g (
in b
illio
ns
of
dolla
rs)
Cumulative change...FIGUREX-X
30
35
40
45
50
55
60
20152013201120092007200520032001
Notes about this graph:• Data is in the datasheet. Make updates in the datasheet.• I had to force return the items on the x-axis. They will reflow if I update the data.• I had to manually draw tick marks and axis lines because they kept resetting when I changed any data.• Use direct selection tool to select items for modification. Otherwise if you use the black selection tool, they will reset to graph default when you change the data.• Use paragraph styles (and object styles) to format.
Note: Note and Source in InDesign.
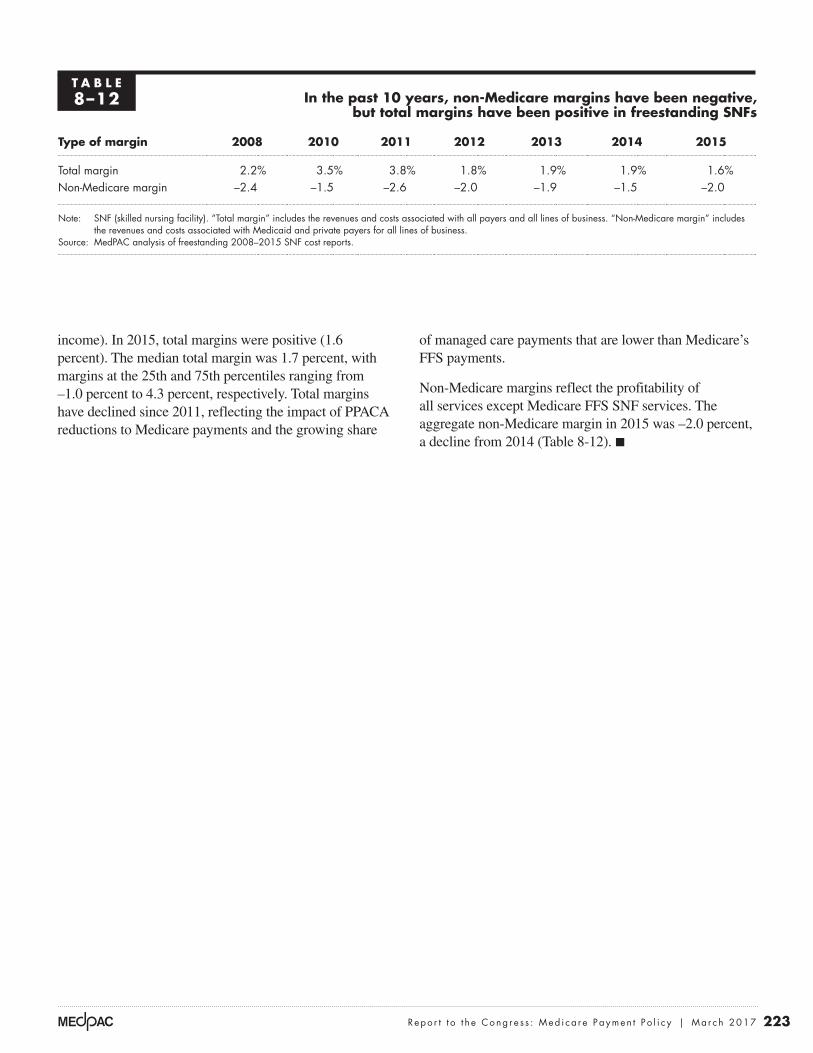
223 Repo r t t o t h e Cong r e s s : Med i ca r e Paymen t P o l i c y | Ma r ch 2017
of managed care payments that are lower than Medicare’s FFS payments.
Non-Medicare margins reflect the profitability of all services except Medicare FFS SNF services. The aggregate non-Medicare margin in 2015 was –2.0 percent, a decline from 2014 (Table 8-12). ■
income). In 2015, total margins were positive (1.6 percent). The median total margin was 1.7 percent, with margins at the 25th and 75th percentiles ranging from –1.0 percent to 4.3 percent, respectively. Total margins have declined since 2011, reflecting the impact of PPACA reductions to Medicare payments and the growing share
T A B L E8–12 In the past 10 years, non-Medicare margins have been negative,
but total margins have been positive in freestanding SNFs
Type of margin 2008 2010 2011 2012 2013 2014 2015
Total margin 2.2% 3.5% 3.8% 1.8% 1.9% 1.9% 1.6%Non-Medicare margin –2.4 –1.5 –2.6 –2.0 –1.9 –1.5 –2.0
Note: SNF (skilled nursing facility). “Total margin” includes the revenues and costs associated with all payers and all lines of business. “Non-Medicare margin” includes the revenues and costs associated with Medicaid and private payers for all lines of business.
Source: MedPAC analysis of freestanding 2008–2015 SNF cost reports.
224 Sk i l l e d n u r s i ng f a c i l i t y s e r v i c e s : A s s e s s i ng paymen t adequacy and upda t i ng paymen t s
1 Throughout this chapter, “beneficiary” refers to an individual whose SNF stay coverage (Part A) is paid for by Medicare. Some beneficiaries who no longer qualify for Medicare coverage remain in the facility to receive long-term care services, which are not covered by Medicare. During long-term care stays, beneficiaries may receive care such as physician services, outpatient therapy services, and prescription drugs that are paid for separately under the Part B and Part D benefits. Services furnished outside the Part A–covered stay are not paid under the SNF PPS and are not considered in this chapter. Except where specifically noted, the chapter examines FFS Medicare spending and service use and excludes services and spending for SNF services furnished to beneficiaries enrolled in Medicare Advantage plans. Some beneficiaries also qualify for Medicaid and are referred to as “dual-eligible beneficiaries.”
2 A spell of illness begins when a beneficiary has not had hospital care or skilled care in a SNF for 60 consecutive days. Observation days and emergency room stays do not count toward the three-day requirement.
3 For services to be covered, the SNF must meet Medicare’s requirements of participation and agree to accept Medicare’s payment rates. Medicare’s requirements relate to many aspects of staffing and care delivery, such as requiring a registered nurse in the facility for 8 consecutive hours per day and licensed nurse coverage 24 hours a day, providing physical and occupational therapy services and speech–language pathology services as delineated in each patient’s plan of care, and providing or arranging for physician services 24 hours a day in case of an emergency.
4 The program pays separately for some services, including certain chemotherapy drugs; certain customized prosthetics; certain ambulance services; Part B dialysis; emergency services; and certain outpatient services provided in a hospital (such as computed tomography, MRI, radiation therapy, and cardiac catheterizations).
5 The SNF Payment Basics is available at http://medpac.gov/docs/default-source/payment-basics/medpac_payment_basics_16_snf_final.pdf?sfvrsn=0.
6 Intensive therapy days are those classified in the ultra-high and very high rehabilitation case-mix groups. Rehabilitation groups are based on minutes of rehabilitation provided per week. “Ultra-high rehabilitation” includes patients who receive more than 720 minutes per week; “very high rehabilitation” includes patients who receive 500–719 minutes per week.
7 There are two broad categories of medically complex case-mix groups: clinically complex and special care. Clinically complex groups are used to classify patients who have burns, surgical wounds, hemiplegia, or pneumonia or who receive chemotherapy, oxygen therapy, intravenous medications, or transfusions while a SNF patient. Special care groups include patients who are comatose; have quadriplegia, chronic obstructive pulmonary disease, septicemia, diabetes requiring daily injections, fever with specific other conditions, cerebral palsy, multiple sclerosis, Parkinson’s disease, respiratory failure, a feeding tube, pressure ulcers of specific sizes, or foot infections; receive radiation therapy or dialysis while a resident; or require parenteral or intravenous feedings or respiratory therapy for seven days.
8 Over the past 7 years, CMS changed the definitions of the existing case-mix groups and added 13 case-mix groups for medically complex days. It also shifted program dollars from therapy care to medically complex care, lowered payments for therapy furnished to multiple beneficiaries at the same time rather than in one-on-one sessions, required providers to reassess patients when the provision of therapy changed or stopped (which would, in turn, change assignments in case-mix groups), and required end-of-therapy assessments to prevent paying for therapy services after they have been discontinued.
9 Summaries of the technical expert panels are available at https://www.cms.gov/Medicare/Medicare-Fee-for-Service-Payment/SNFPPS/therapyresearch.html.
10 Medically complex days make up the other 6 percent of days. See endnote 7 for the definition of medically complex.
11 The eight ADLs for which SNF users required less assistance included bladder control, transfer, walk in the facility corridor, self-feeding, toileting, dressing, performing personal hygiene, and bed mobility. The measures for two ADLs increased: the share of the most dependent for bathing and the share of beneficiaries who were always incontinent.
12 Separate models (with their own covariates) are used to estimate expected community discharge rates for different discharge destinations (e.g., discharged home with home health care, discharged home without home health care, and discharged to a nursing home).
13 With inclusion of the other covariates, age categories were not found to be significant in explaining variation in outcomes and were dropped from the models, except for the model explaining differences in readmission during the 30 days postdischarge for community-residing beneficiaries younger than 65.
Endnotes
225 Repo r t t o t h e Cong r e s s : Med i ca r e Paymen t P o l i c y | Ma r ch 2017
17 We compared the assessments conducted at the beginning of stays (the “day 5” assessment). MA plans are not required to submit these assessments, and we cannot determine what share of plans submit them or the possible bias of assessments that are submitted.
18 Other Commission work has examined the financial incentives for MA plans to code comorbidities. That work found that MA risk scores were about 4 percent higher than for similar patients in FFS after accounting for coding differences (Medicare Payment Advisory Commission 2016). If this level of upcoding is representative of Medicare beneficiaries who use SNF services, risk scores for MA enrollees were even lower (that is, they had fewer comorbidities) than reported compared with FFS beneficiaries who used SNF services.
14 The readmission rates of patients during their SNF stay and in the period after discharge cannot simply be added to get a combined rate because, in the combined measure, a stay is counted only once, even if the patient was readmitted during the SNF stay and in the post-stay period. In contrast, each relevant stay is counted separately in each measure.
15 We use the nursing component (as opposed to the payment weight of the case-mix group) to avoid distorting the measure of patient complexity by the amount of therapy furnished, which could be unrelated to patient care needs. We used the indexes adjusted for CMS’s policy decisions to shift payments toward certain case-mix groups and away from others (White 2012). Because the nursing weights for intensive therapy are relatively high, a facility can have both a high case-mix index and a moderate or low share of medically complex patients.
16 The Special Focus Facility Initiative is a program to stimulate improvements in the quality of care at nursing homes with a history of serious quality problems. The initiative targets homes with a pattern over three years of more frequent and more serious problems (including harm or injury to residents) detected in their annual facility surveys. Facilities that improve and maintain those improvements can “graduate” from the program. Providers that do not improve face civil monetary penalties (fines) and eventual termination from Medicare and Medicaid.
226 Sk i l l e d n u r s i ng f a c i l i t y s e r v i c e s : A s s e s s i ng paymen t adequacy and upda t i ng paymen t s
Acumen LLC. 2016. Skilled nursing facility payment models: Technical expert panel. June 15. https://www.cms.gov/Medicare/Medicare-Fee-for-Service-Payment/SNFPPS/Downloads/SNF_Third_TEP_Presentation.pdf.
American Health Care Association. 2016. AHCA Quality Initiative progress (as of August 11, 2016). https://www.ahcancal.org/quality_improvement/qualityinitiative/Documents/AHCA%20Quality%20Initiative%20A%20Snapshot%20of%20Progress%20As%20of%20June%2029%202016.pdf.
Boards of Trustees, Federal Hospital Insurance and Federal Supplementary Medical Insurance Trust Funds. 2016. 2016 annual report of the Boards of Trustees of the Federal Hospital Insurance and Federal Supplementary Insurance Trust Funds. Washington, DC: Boards of Trustees.
Cain Brothers. 2016. 2016 healthcare industry outlook: Strategies for healthcare leaders no. 79. January 7.
Centers for Medicare & Medicaid Services, Department of Health and Human Services. 2016a. Certification and Survey Provider Enhanced Reporting (CASPER) on CMS’s Survey and Certification Providing Data Quickly (PDQ) system.
Centers for Medicare & Medicaid Services, Department of Health and Human Services. 2016b. Medicare and Medicaid programs; reform of requirements for long-term care facilities. Final rule. Federal Register 81, no. 192 (October 4): 68688–68872.
Centers for Medicare & Medicaid Services, Department of Health and Human Services. 2016c. Personal communication with Maria Diacogiannis, Office of Information Products and Data Analytics.
Connole, P. 2016. Banks cater to long term care. Provider Long Term and Post-Acute Care, September.
Department of Housing and Urban Development. 2016. Personal communication with Jennifer Buhlman from the Office of Healthcare Programs, Section 232.
Department of Justice. 2016a. Life Care Centers of America Inc. agrees to pay $145 million to resolve False Claims Act allegations relating to the provision of medically unnecessary rehabilitation therapy services. News release. October 24. https://www.justice.gov/opa/pr/life-care-centers-america-inc-agrees-pay-145-million-resolve-false-claims-act-allegations.
Department of Justice. 2016b. North American Health Care Inc. to pay $28.5 million to settle claims for medically unnecessary rehabilitation therapy services. News release. September 19. https://www.justice.gov/opa/pr/north-american-health-care-inc-pay-285-million-settle-claims-medically-unnecessary.
Department of Justice. 2016c. Nursing home operator and director of long term care to pay $2.5 million to settle false claims for rehabilitation therapy. News release. October 13. https://www.justice.gov/usao-ma/pr/nursing-home-operator-and-director-long-term-care-pay-25-million-settle-false-claims.
Diversicare. 2016a. 10–K annual report 2015. http://investor.dvcr.com/common/download/download.cfm?companyid=ABEA-4N6H3A&fileid=844464&filekey=B64F6E65-E71E-4D3F-9832-47AAAA7BE04F&filename=DVCR-2014_AR_final.pdf.
Diversicare. 2016b. Diversicare announces 2016 third quarter results and completes acquisition of 22 facilities in Mississippi and Alabama. http://investor.dvcr.com/releasedetail.cfm?ReleaseID=997527.
Ensign Group. 2016a. 2015 annual report. http://investor.ensigngroup.net/annuals.cfm.
Ensign Group. 2016b. Investor presentation, September. http://investor.ensigngroup.net/index.cfm.
Evans, M. 2015. Hospitals select preferred SNFs to improve post-acute options. Modern Healthcare, May 11.
Genesis HealthCare. 2016. 2015 annual report. http://www.genesishcc.com/Portals/0/pdfs/Investors/AnnualReportAndProxy/2015%20Annual%20Report_FINAL.pdf.
Government Accountability Office. 2002. Skilled nursing facilities: Providers have responded to Medicare payment system by changing practices. GAO–02–841. Washington, DC: GAO.
Government Accountability Office. 1999. Skilled nursing facilities: Medicare payments need to better account for nontherapy ancillary cost variation. GAO/HEHS–99–185. Washington, DC: GAO.
Irving Levin Associates Inc. 2016a. LTACs vs. SNFs vs. IRFs: Mergers, acquisitions, and the battle for the post-acute patient. Webinar. September 22.
Irving Levin Associates Inc. 2016b. The senior care acquisition report: 21st edition. Norwalk, CT: Irving Levin Associates Inc.
Kaufmann, B. 2016. Investment capital needed for skilled nursing operations. Provider Long Term and Post-Acute Care, September.
Kindred Healthcare. 2016a. Kindred at home. http://www.kindredhealthcare.com/what-we-do/homecare-and-hospice/.
Kindred Healthcare. 2016b. Q3 2016 Kindred Healthcare Inc. earnings conference call. November 8.
References
227 Repo r t t o t h e Cong r e s s : Med i ca r e Paymen t P o l i c y | Ma r ch 2017
Medicare Payment Advisory Commission and The Urban Institute. 2015. The need to reform Medicare’s payments to SNFs is as strong as ever. Washington, DC: MedPAC/Urban Institute.
Moran Company. 2015. Evaluating the budgetary implications of implementing a bundled SNF stay prospective system. Arlington, VA: The Moran Company.
Office of Inspector General, Department of Health and Human Services. 2016. OIG work plan FY 2017. Washington, DC: OIG.
Office of Inspector General, Department of Health and Human Services. 2015. The Medicare payment system for skilled nursing facilities needs to be reevaluated. Report no. OEI–02–13–00610. Washington, DC: OIG.
Office of the Actuary, Centers for Medicare & Medicaid Services, Department of Health and Human Services. 2016a. Personal communication of author with John Klemm, September 28.
Office of the Actuary, Centers for Medicare & Medicaid Services, Department of Health and Human Services. 2016b. Personal communication with James Hardesty, September 26.
Smith, V. K., K. Gifford, E. Ellis, et al. 2016. Implementing coverage and payment initiatives: Results from a 50-state Medicaid budget survey for state fiscal years 2016 and 2017. Washington, DC: Kaiser Commission on Medicaid and the Uninsured. http://kff.org/medicaid/report/implementing-coverage-and-payment-initiatives-results-from-a-50-state-medicaid-budget-survey-for-state-fiscal-years-2016-and-2017/.
Swett, B. 2015. HUD rankings for the 2015 fiscal year. Senior Care Investor, November.
Urban Institute. 2004. Classifying Medicare SNF patients: Initial findings from three approaches. Report to the Centers for Medicare & Medicaid Services. Contract no. 500–00–0025. Baltimore, MD: CMS.
White, A. 2012. Differences in resident case-mix between Medicare and non-Medicare nursing home residents. Report prepared by staff from Abt Associates for the Medicare Payment Advisory Commission. Washington, DC: MedPAC.
White, C., S. D. Pizer, and A. J. White. 2002. Assessing the RUG–III resident classification system for skilled nursing facilities. Health Care Financing Review 24, no. 2 (Winter): 7–15.
Kindred Healthcare. 2016c. Shaping the future of care for an aging America. Presentation at the UBS Global Healthcare Conference. May 24. http://investors.kindredhealthcare.com/phoenix.zhtml?c=129959&p=irol-presentations.
Kramer, A., R. Fish, and M. Lin. 2014. Potentially avoidable readmission and functional outcome quality measure development and 2012 rates for SNFs. Report prepared for the Medicare Payment Advisory Commission. Washington, DC: MedPAC.
Kramer, A., M. Lin, R. Fish, et al. 2015. Refinement of community discharge, potentially avoidable readmission, and functional outcome SNF quality measures, for fiscal years 2011, 2012, and 2013. Report prepared for the Medicare Payment Advisory Commission. Washington, DC: MedPAC.
Kuebrich, E. 2016. SNF-hospital partnering. Long-term Care News webinar, September 20.
Liu, K., B. Garrett, D. A. Wissoker, et al. 2007. Final report to CMS: Options for improving Medicare payment for skilled nursing facilities. Report submitted by The Urban Institute to the Centers for Medicare & Medicaid Services. Washington, DC: The Urban Institute.
Maxwell, S., J. Wiener, and K. Liu. 2003. A review of issues in the development and implementation of the skilled nursing facility prospective payment system. Report to the Centers for Medicare & Medicaid Services. Contract no. 500–00–0025/TO#2. Baltimore, MD: CMS.
Medicare Payment Advisory Commission. 2016. Report to the Congress: Medicare payment policy. Washington, DC: MedPAC.
Medicare Payment Advisory Commission. 2013. Report to the Congress: Medicare payment policy. Washington, DC: MedPAC.
Medicare Payment Advisory Commission. 2012. Report to the Congress: Medicare payment policy. Washington, DC: MedPAC.
Medicare Payment Advisory Commission. 2009. Report to the Congress: Medicare payment policy. Washington, DC: MedPAC.
Medicare Payment Advisory Commission. 2008. Report to the Congress: Reforming the delivery system. Washington, DC: MedPAC.
Medicare Payment Advisory Commission. 2007. Report to the Congress: Promoting greater efficiency in Medicare. Washington, DC: MedPAC.
Medicare Payment Advisory Commission and the Medicaid and CHIP Payment and Access Commission. 2016. Data book: Beneficiaries dually eligible for Medicare and Medicaid. Washington, DC: MedPAC/MACPAC.