Embed Size (px)
Citation preview
Skilled Nursing Facility Economic Outcomes
A Comparison of Two Non-Physician Practitioner Service Models
Prepared By:
Christine J. Gerace Johnson, MPA, NHA, PA-C Dennis L. Stone, MD, MBA, CMD
Kevin T. Bell, MBA, NHA
1
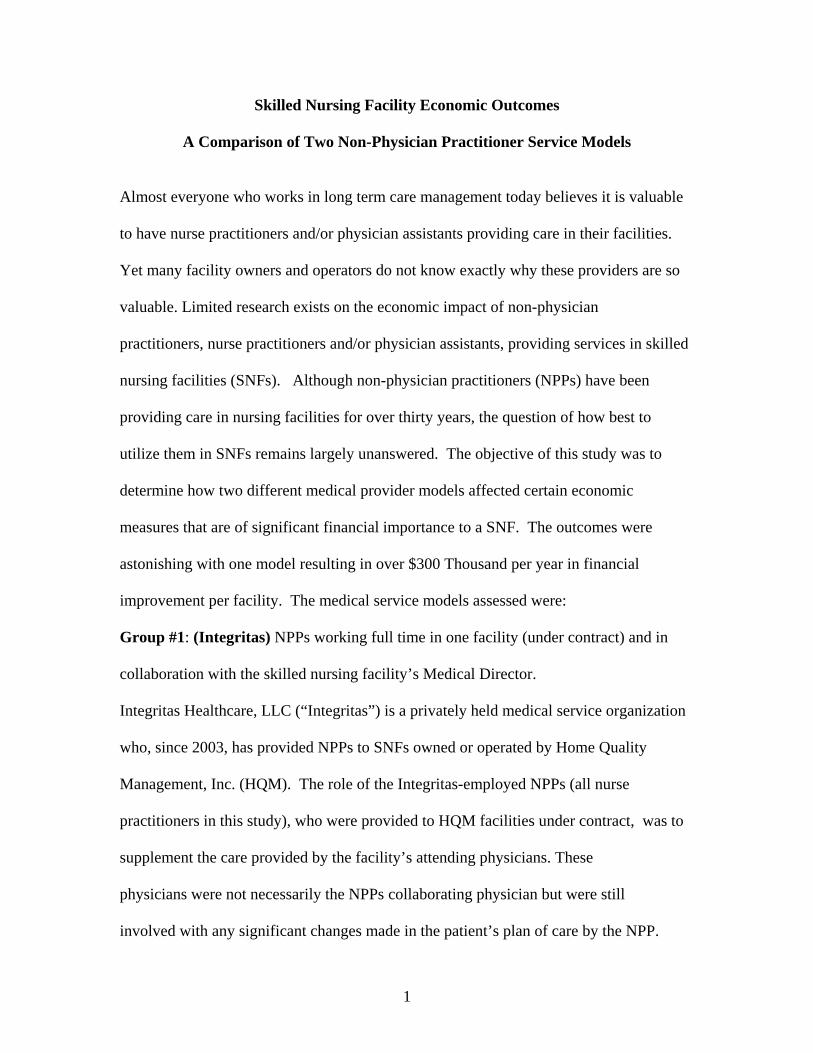
Skilled Nursing Facility Economic Outcomes
A Comparison of Two Non-Physician Practitioner Service Models Almost everyone who works in long term care management today believes it is valuable to have nurse practitioners and/or physician assistants providing care in their facilities. Yet many facility owners and operators do not know exactly why these providers are so valuable. Limited research exists on the economic impact of non-physician practitioners, nurse practitioners and/or physician assistants, providing services in skilled nursing facilities (SNFs). Although non-physician practitioners (NPPs) have been providing care in nursing facilities for over thirty years, the question of how best to utilize them in SNFs remains largely unanswered. The objective of this study was to determine how two different medical provider models affected certain economic measures that are of significant financial importance to a SNF. The outcomes were astonishing with one model resulting in over $300 Thousand per year in financial improvement per facility. The medical service models assessed were: Group #1: (Integritas) NPPs working full time in one facility (under contract) and in collaboration with the skilled nursing facility’s Medical Director. Integritas Healthcare, LLC (“Integritas”) is a privately held medical service organization who, since 2003, has provided NPPs to SNFs owned or operated by Home Quality Management, Inc. (HQM). The role of the Integritas-employed NPPs (all nurse practitioners in this study), who were provided to HQM facilities under contract, was to supplement the care provided by the facility’s attending physicians. These physicians were not necessarily the NPPs collaborating physician but were still involved with any significant changes made in the patient’s plan of care by the NPP.
2
Formal collaborative supervision was provided by the facility Medical Director. The Integritas medical services model provides client nursing facilities with on-site, full time (weekday) presence of an NPP. Integritas medical practitioners provide comprehensive medical care including:
• examining the patient upon admission to assure the patient is stable and that appropriate information is available to initiate care,
• assessing acute changes of condition,
• ordering appropriate laboratory and diagnostic tests,
• prescribing medications according to facility formulary guidelines,
• establishing treatment plans aligned with nursing plans of care, and
• complying with nationally defined clinical practice guidelines (CPGs) regarding
disease management. Each nurse practitioner (NP) had an individual provider number through which third party billing was managed by Integritas. Medically necessary services are reimbursed through Medicare Part B or fee-for-service. Additionally, the nursing facility reimbursed Integritas for quality management support. By providing disease management systems, clinical practice guidelines, geriatric procedures and protocols, disease specific assessment tools and on-going training Integritas facilitates the means to a positive clinical and economic end. Their on-going training includes the:
• current geriatric medicine body of knowledge,
• formatted communication with the attending physician and the rest of the health care team,
• collaboration with quality improvement minded physician medical directors,
3
• regulatory and economic realities of nursing facility care,
• benchmarking of quality and economic outcomes, and
• establishment of strong, direct communication with facility administrators. Group #2: (NPP w/MD) practitioners were retained by community physicians, following a large number of residents on the service of their individual collaborating physician(s). The NPPs in Group #2 were either employed directly by a community physician or they had their own independent practice and collaborated with the attending physician. They did not receive any specific on-going training regarding providing medical services in a skilled nursing facility. To determine if there were quantifiable differences in the economic impact of the two medical models, HQM conducted a review of data from eight of their facilities covering a twelve-month period from October 1, 2005 through September 30, 2006. Group #1 consisted of four skilled nursing facilities contracted with Integritas to provide full time nurse practitioner services. Group #2 consisted of four skilled nursing facilities with services provided by NPPs utilized by local attending physicians. Three facility economic outcomes were measured and compared between the groups: 1. Pharmacy Management
(a) Medicare Part A Pharmacy Cost – Each SNF’s actual Medicare Part A Prescription (Rx) drug cost was measured and facilities from both practitioner groups were compared.
(b) Poly-Pharmacy (9 or More Medications) – The SNF’s population on 9 or more
medications was measured as a percentage of the total facility census and compared with the current national average poly-pharmacy percentage of 62.7%.
2. Discharge Management The cost of potentially unnecessary discharges was calculated with unnecessary
4
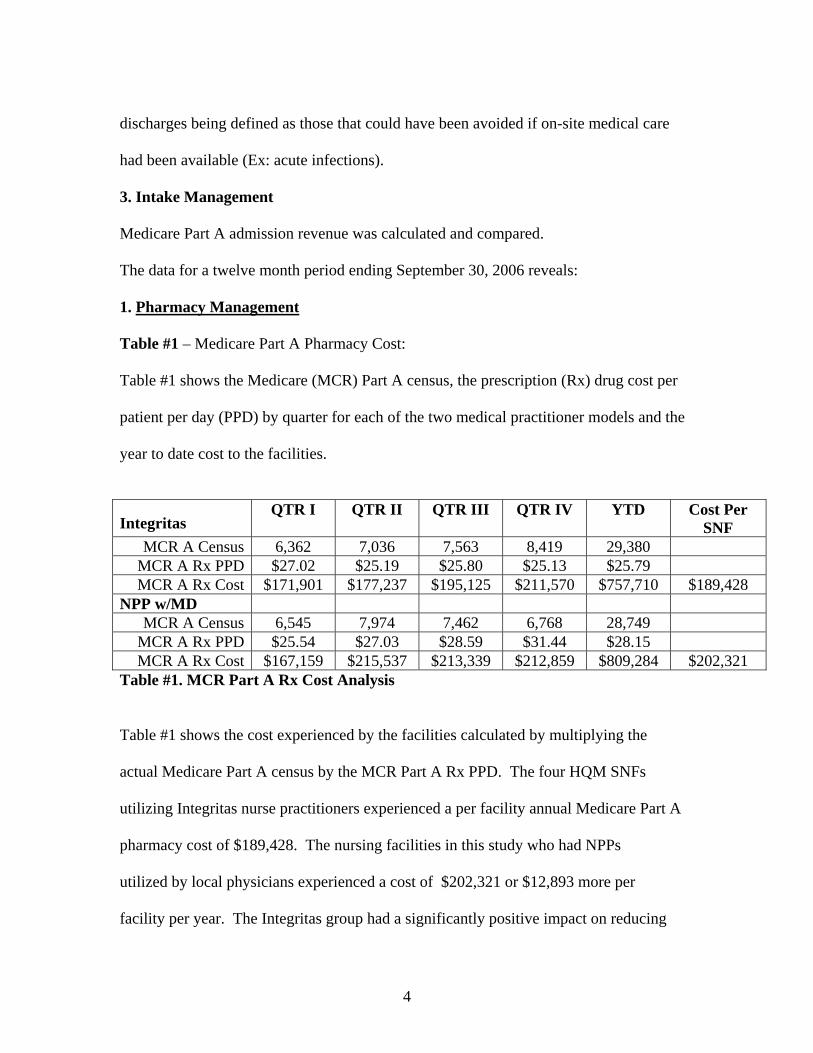
discharges being defined as those that could have been avoided if on-site medical care had been available (Ex: acute infections). 3. Intake Management Medicare Part A admission revenue was calculated and compared. The data for a twelve month period ending September 30, 2006 reveals: 1. Pharmacy Management Table #1 – Medicare Part A Pharmacy Cost: Table #1 shows the Medicare (MCR) Part A census, the prescription (Rx) drug cost per patient per day (PPD) by quarter for each of the two medical practitioner models and the year to date cost to the facilities. Integritas
QTR I QTR II QTR III QTR IV YTD Cost Per SNF
MCR A Census 6,362 7,036 7,563 8,419 29,380 MCR A Rx PPD $27.02 $25.19 $25.80 $25.13 $25.79 MCR A Rx Cost $171,901 $177,237 $195,125 $211,570 $757,710 $189,428
NPP w/MD MCR A Census 6,545 7,974 7,462 6,768 28,749
MCR A Rx PPD $25.54 $27.03 $28.59 $31.44 $28.15 MCR A Rx Cost $167,159 $215,537 $213,339 $212,859 $809,284 $202,321
Table #1. MCR Part A Rx Cost Analysis Table #1 shows the cost experienced by the facilities calculated by multiplying the actual Medicare Part A census by the MCR Part A Rx PPD. The four HQM SNFs utilizing Integritas nurse practitioners experienced a per facility annual Medicare Part A pharmacy cost of $189,428. The nursing facilities in this study who had NPPs utilized by local physicians experienced a cost of $202,321 or $12,893 more per facility per year. The Integritas group had a significantly positive impact on reducing
5
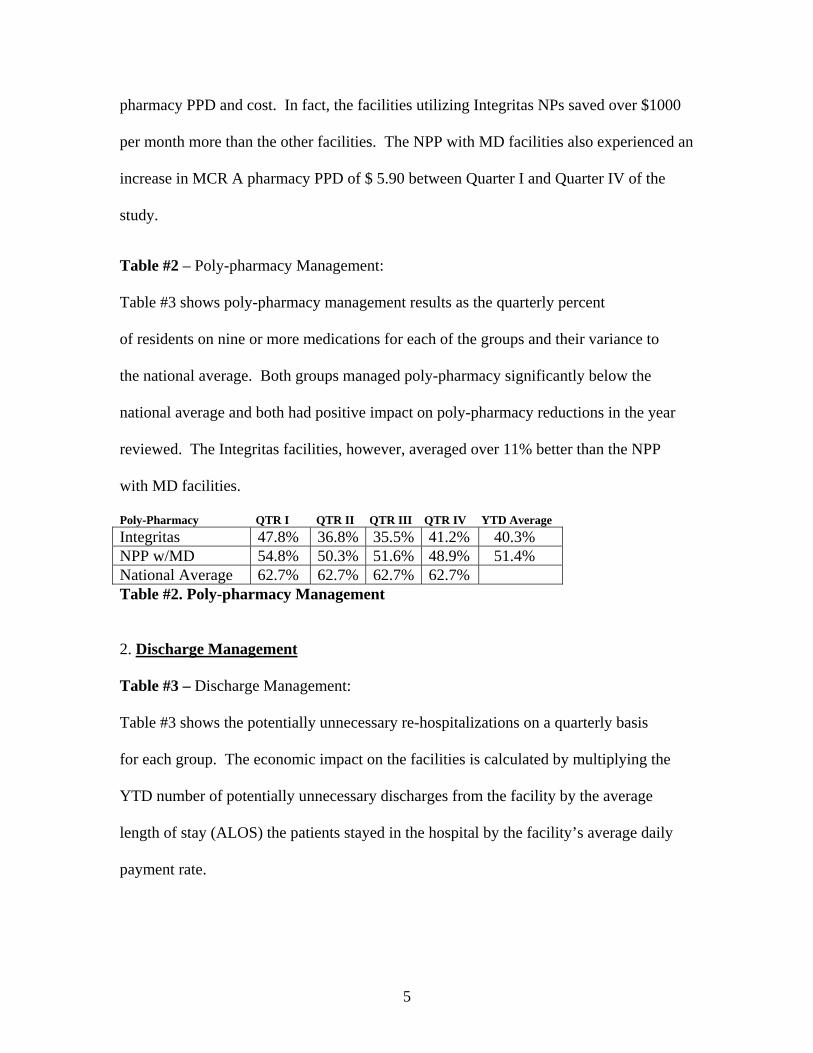
pharmacy PPD and cost. In fact, the facilities utilizing Integritas NPs saved over $1000 per month more than the other facilities. The NPP with MD facilities also experienced an increase in MCR A pharmacy PPD of $ 5.90 between Quarter I and Quarter IV of the study. Table #2 – Poly-pharmacy Management: Table #3 shows poly-pharmacy management results as the quarterly percent of residents on nine or more medications for each of the groups and their variance to the national average. Both groups managed poly-pharmacy significantly below the national average and both had positive impact on poly-pharmacy reductions in the year reviewed. The Integritas facilities, however, averaged over 11% better than the NPP with MD facilities. Poly-Pharmacy QTR I QTR II QTR III QTR IV YTD Average Integritas 47.8% 36.8% 35.5% 41.2% 40.3% NPP w/MD 54.8% 50.3% 51.6% 48.9% 51.4% National Average 62.7% 62.7% 62.7% 62.7% Table #2. Poly-pharmacy Management 2. Discharge Management Table #3 – Discharge Management: Table #3 shows the potentially unnecessary re-hospitalizations on a quarterly basis for each group. The economic impact on the facilities is calculated by multiplying the YTD number of potentially unnecessary discharges from the facility by the average length of stay (ALOS) the patients stayed in the hospital by the facility’s average daily payment rate.
6
Integritas
QTR I QTR II QTR III QTR IV YTD Cost Per SNF
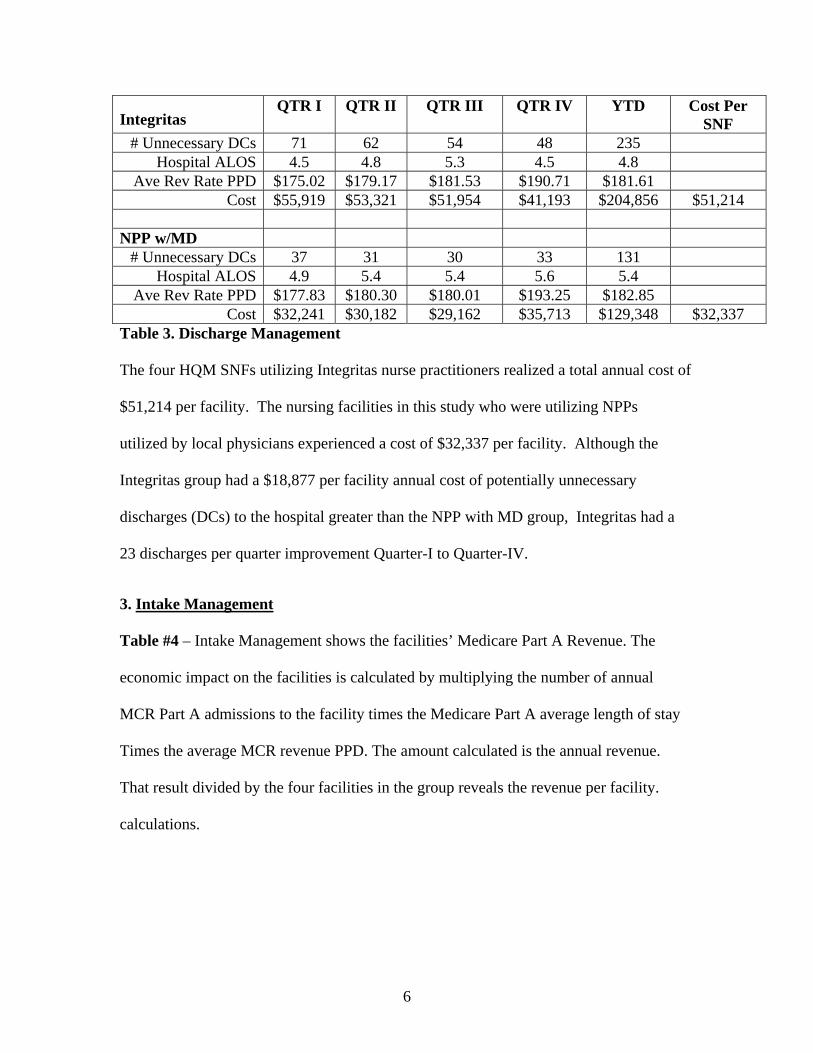
# Unnecessary DCs 71 62 54 48 235 Hospital ALOS 4.5 4.8 5.3 4.5 4.8
Ave Rev Rate PPD $175.02 $179.17 $181.53 $190.71 $181.61 Cost $55,919 $53,321 $51,954 $41,193 $204,856 $51,214
NPP w/MD
# Unnecessary DCs 37 31 30 33 131 Hospital ALOS 4.9 5.4 5.4 5.6 5.4
Ave Rev Rate PPD $177.83 $180.30 $180.01 $193.25 $182.85 Cost $32,241 $30,182 $29,162 $35,713 $129,348 $32,337
Table 3. Discharge Management The four HQM SNFs utilizing Integritas nurse practitioners realized a total annual cost of $51,214 per facility. The nursing facilities in this study who were utilizing NPPs utilized by local physicians experienced a cost of $32,337 per facility. Although the Integritas group had a $18,877 per facility annual cost of potentially unnecessary discharges (DCs) to the hospital greater than the NPP with MD group, Integritas had a 23 discharges per quarter improvement Quarter-I to Quarter-IV. 3. Intake Management Table #4 – Intake Management shows the facilities’ Medicare Part A Revenue. The economic impact on the facilities is calculated by multiplying the number of annual MCR Part A admissions to the facility times the Medicare Part A average length of stay Times the average MCR revenue PPD. The amount calculated is the annual revenue. That result divided by the four facilities in the group reveals the revenue per facility. calculations.
7
Integritas
QTR I QTR II QTR III QTR IV YTD Revenue Per SNF
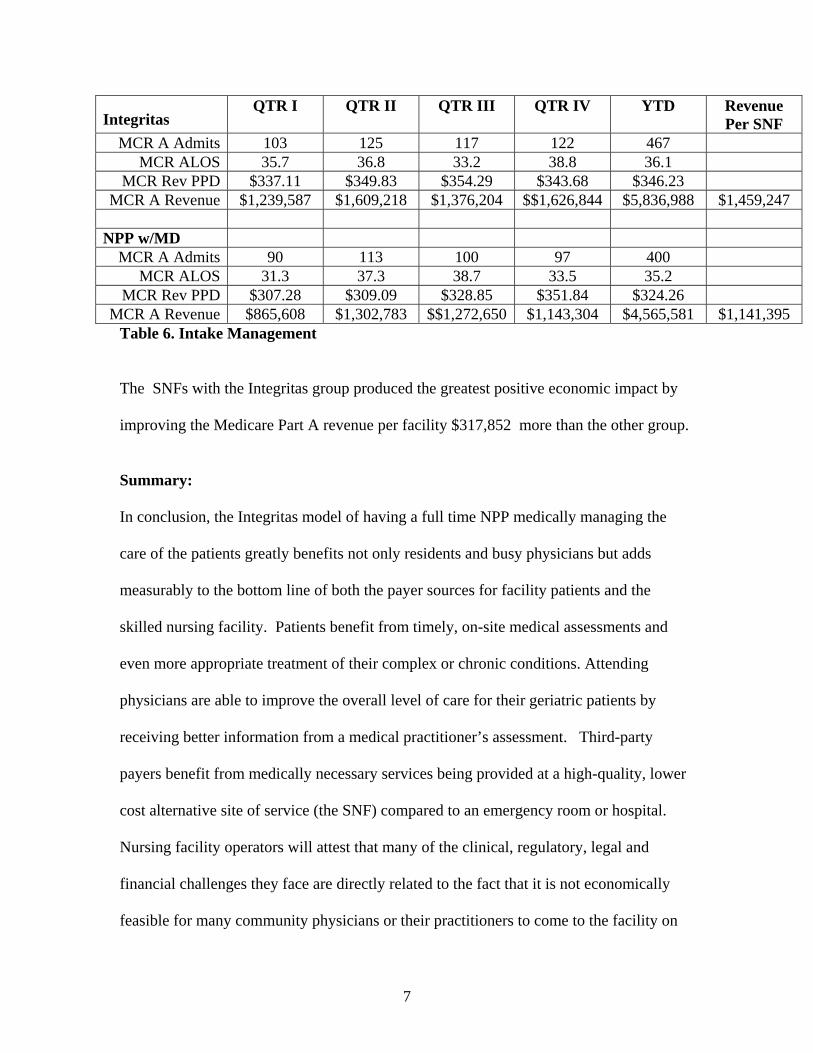
MCR A Admits 103 125 117 122 467 MCR ALOS 35.7 36.8 33.2 38.8 36.1
MCR Rev PPD $337.11 $349.83 $354.29 $343.68 $346.23 MCR A Revenue $1,239,587 $1,609,218 $1,376,204 $$1,626,844 $5,836,988 $1,459,247
NPP w/MD
MCR A Admits 90 113 100 97 400 MCR ALOS 31.3 37.3 38.7 33.5 35.2
MCR Rev PPD $307.28 $309.09 $328.85 $351.84 $324.26 MCR A Revenue $865,608 $1,302,783 $$1,272,650 $1,143,304 $4,565,581 $1,141,395
Table 6. Intake Management The SNFs with the Integritas group produced the greatest positive economic impact by improving the Medicare Part A revenue per facility $317,852 more than the other group. Summary: In conclusion, the Integritas model of having a full time NPP medically managing the care of the patients greatly benefits not only residents and busy physicians but adds measurably to the bottom line of both the payer sources for facility patients and the skilled nursing facility. Patients benefit from timely, on-site medical assessments and even more appropriate treatment of their complex or chronic conditions. Attending physicians are able to improve the overall level of care for their geriatric patients by receiving better information from a medical practitioner’s assessment. Third-party payers benefit from medically necessary services being provided at a high-quality, lower cost alternative site of service (the SNF) compared to an emergency room or hospital. Nursing facility operators will attest that many of the clinical, regulatory, legal and financial challenges they face are directly related to the fact that it is not economically feasible for many community physicians or their practitioners to come to the facility on
8
an as needed basis. Regularly scheduled visits involving multiple patients, usually once or twice a month are currently the norm. Even at the time of those visits, physicians are still under economic pressure to spend the minimum amount of time required to assess the resident’s needs and then return to the office or hospital. Acute changes in condition and problem focused follow-up assessments are usually managed by phone or fax. If the required information regarding a significant change of condition cannot be effectively communicated or if an “on-call” physician is covering for a facility attending physician, the patient is often sent to the emergency room. Economically speaking, community physicians and their practitioners lose money each time they come to the nursing facility to see only one or two patients. Despite the rationalization of the American Medical Association’s (AMA’s) Relative Value process, the economic reality is that it is simply not feasible for most physicians to take care of patients in the nursing facility because of economies of scale. Remembering that Medicare does not pay for travel time, any time spent going to and from the facility during the work day is an “opportunity cost” that must be applied to the equation when determining break even on providing nursing home care. One can assume that it costs a physician at least $200/hour to cover personal salary, staff salary and office overhead. Also one can assume that it takes a minimum of ½ hour to leave the productivity of the office or hospital to see patients in the nursing facility and an additional ½ hour to return back to the office or hospital. Thus the physician has incurred an overhead cost of $200 just to get to and from the facility and must make up that cost by generating income while at the facility. For a basic nursing facility visit, the physician will generate approximately $55 in final dollars and it will take a minimum of 10 minutes to provide that service. Running the break even analysis,
9
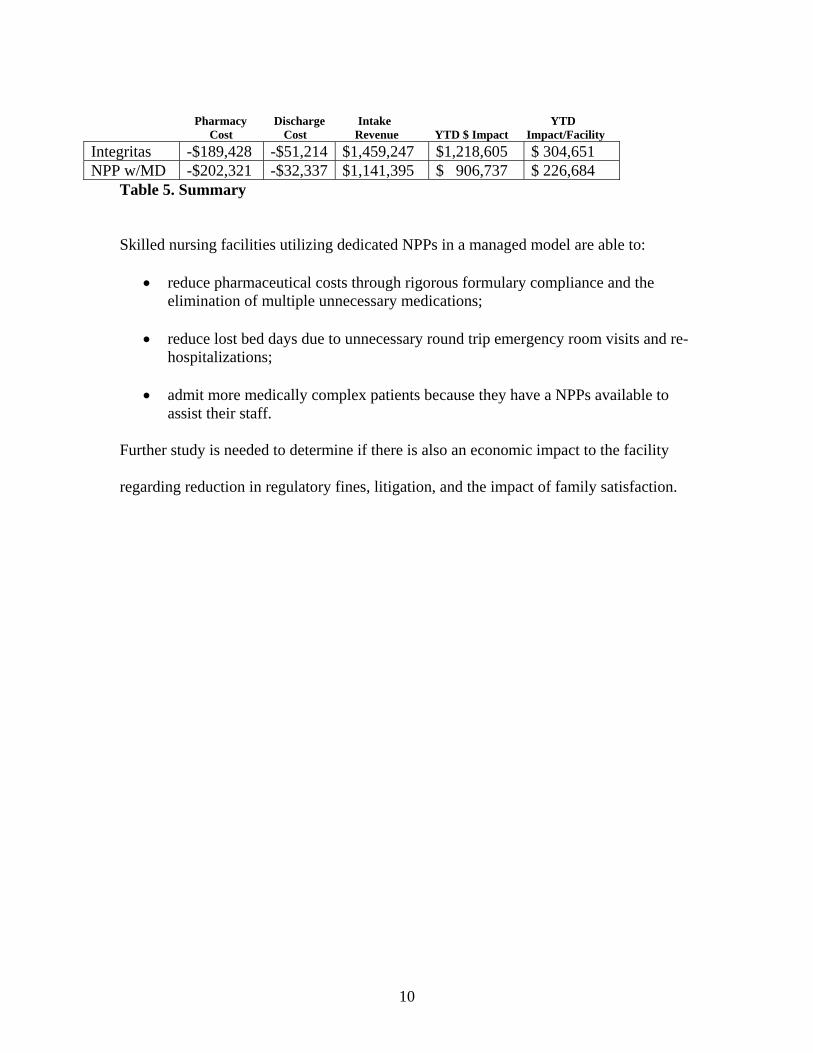
the physician must see 9 patients before he or she has recouped his or her overhead costs. Few physicians have 9 patients in the nursing facility who require a visit on any given day and few physicians can provide a complete service in only 10 minutes, so it remains economically impractical for a physician to have a nursing facility practice. Providing care by phone is fraught with multiple risks to the patient, the facility and the physician. The resident is at risk of a misdiagnosis, unnecessary laboratory or diagnostic studies, “cross purpose” medications being prescribed, an unnecessary ambulance ride, an uncomfortable emergency room visit or even an unnecessary hospitalization. The facility is at risk of paying for unnecessary tests, medications, and ambulance transportation if the patient is covered under Medicare Part A. The nursing facility is also subject to increased risk of regulatory noncompliance issues or litigation because the patient was not directly examined by a licensed medical provider. The physician is also at risk of not fully discerning the acuity, complexity, recent circumstances, co-morbidities, or physical findings required to make a sound medical judgment from the information provided over the phone or fax. Table #5 – Summary: Table #5 is a summary of the total financial impact on the SNF by each group. Both groups of facilities utilizing NPPs experienced economic improvement over the year. The Integritas nurse practitioner group, however, produced a total financial impact on their facilities $ 77,967 per facility greater than the other group or nearly 35% greater than the group of NPPs working with local physicians.
10
Pharmacy Discharge Intake YTD Cost Cost Revenue YTD $ Impact Impact/Facility
Integritas -$189,428 -$51,214 $1,459,247 $1,218,605 $ 304,651 NPP w/MD -$202,321 -$32,337 $1,141,395 $ 906,737 $ 226,684
Table 5. Summary Skilled nursing facilities utilizing dedicated NPPs in a managed model are able to:
• reduce pharmaceutical costs through rigorous formulary compliance and the elimination of multiple unnecessary medications;
• reduce lost bed days due to unnecessary round trip emergency room visits and re-
hospitalizations;
• admit more medically complex patients because they have a NPPs available to assist their staff.
Further study is needed to determine if there is also an economic impact to the facility regarding reduction in regulatory fines, litigation, and the impact of family satisfaction.