Embed Size (px)
Citation preview

Skilled Nursing Data ReportKey Occupancy & Revenue Trends
Based on Data from October 2011
through December 2017
Copyright ©2018 National Investment Center for Seniors Housing & Care (NIC). All rights reserved. Data believed to be accurate but not
guaranteed; subject to future revision.
2
Table of Contents
Key Takeaways3
National Skilled Nursing Trends
Skilled Nursing Coverage
Glossary
4
6
11
Urban and Rural Trends7
Copyright ©2018 National Investment Center for Seniors Housing & Care (NIC). All rights reserved. Data believed to be accurate but not
guaranteed; subject to future revision.
33
The addition of urban and rural comparisons in the release of this report
provides many noteworthy observations and trends for operators and investors.
For example, rural areas have a higher exposure to private pay patient day mix
in addition to less exposure to Medicaid patient day mix. Coupled with the fact
that growth in managed Medicare patient day mix has been essentially flat in
rural areas but growing in urban areas, this data suggests there are different risk
profiles between the geographic areas.
- Bill Kauffman, Senior Principal, NIC
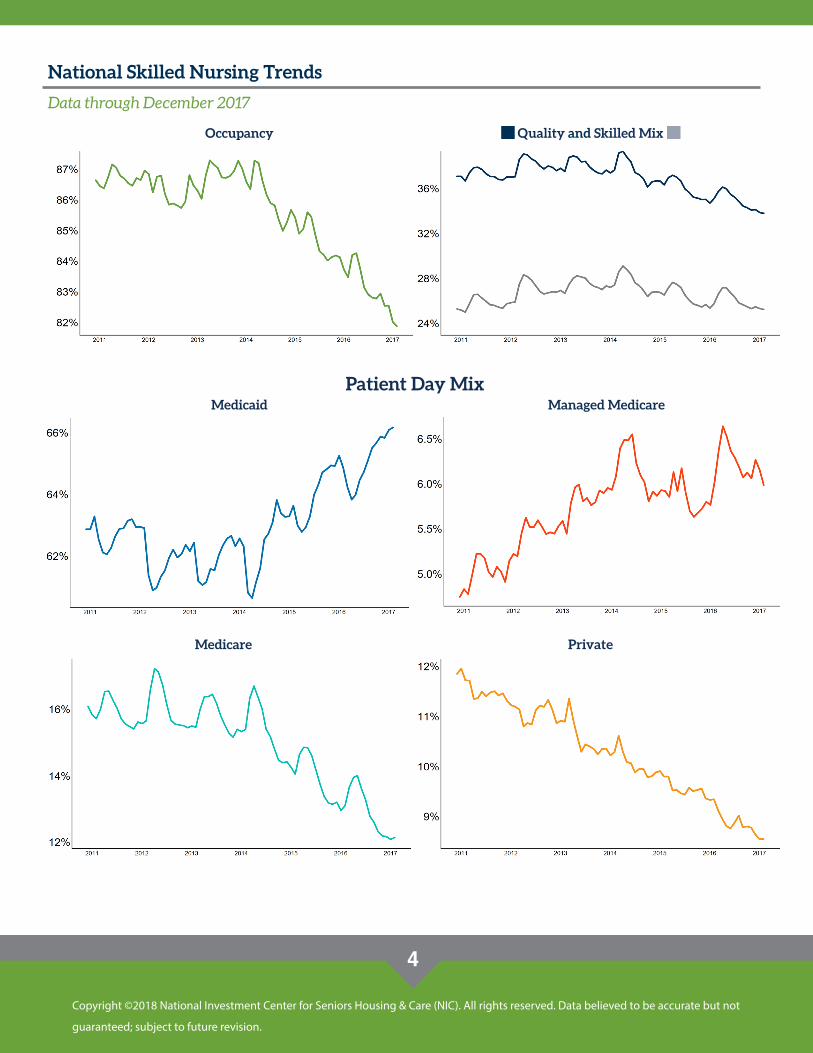
» Occupancy continued to decrease in the fourth quarter of 2017 despite an early and severe flu season.
Historically, occupancy experiences an uptick in the fourth quarter if flu season was both early and relatively
severe, as has been the case this year. Occupancy decreased 66 basis points from the third quarter of 2017 to
end the fourth quarter at 81.9%. Compared to a year ago, occupancy declined 159 basis points from 83.5% in the
fourth quarter of 2016.
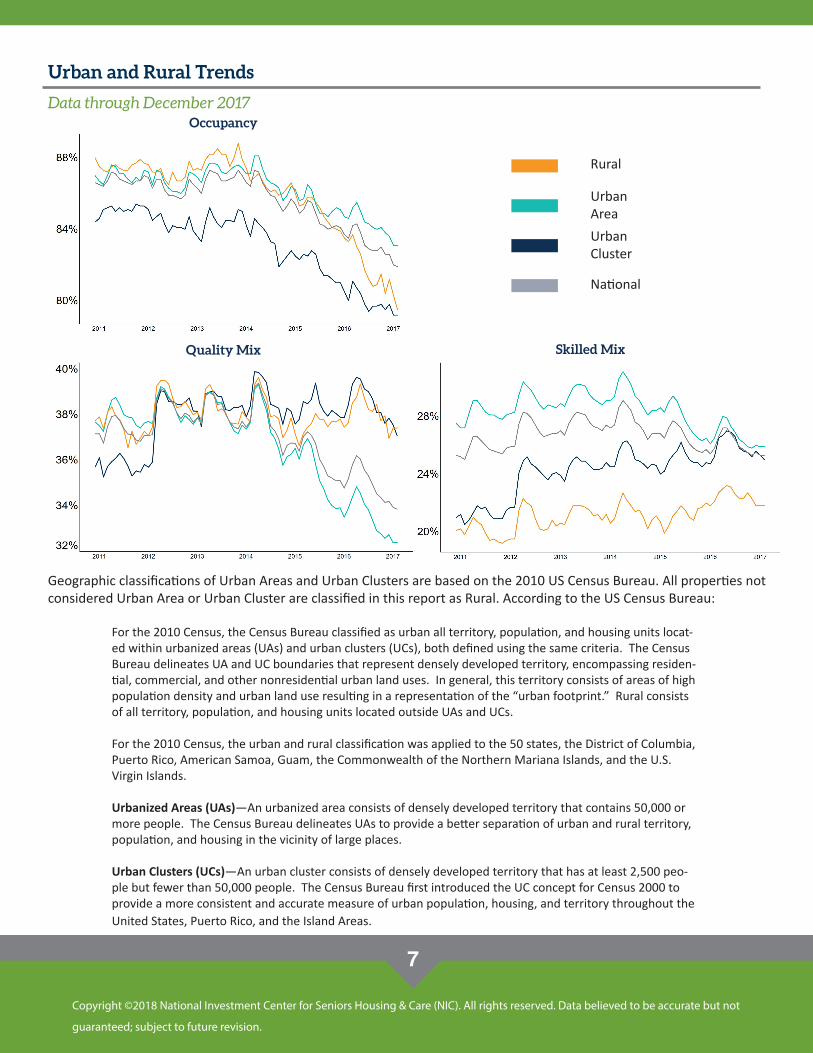
» Differences in occupancy trends in rural and urban settings were pronounced over the last 12 months,
with rural occupancy rates declining more sharply than urban. This difference may reflect a number of
influential factors, including demographics, competition from home healthcare and telehealth, and reforms to
the healthcare system. With the introduction of this new geographic perspective on NIC’s skilled nursing data,
more research is needed to shed light on the drivers of occupancy in the rural and urban sectors.
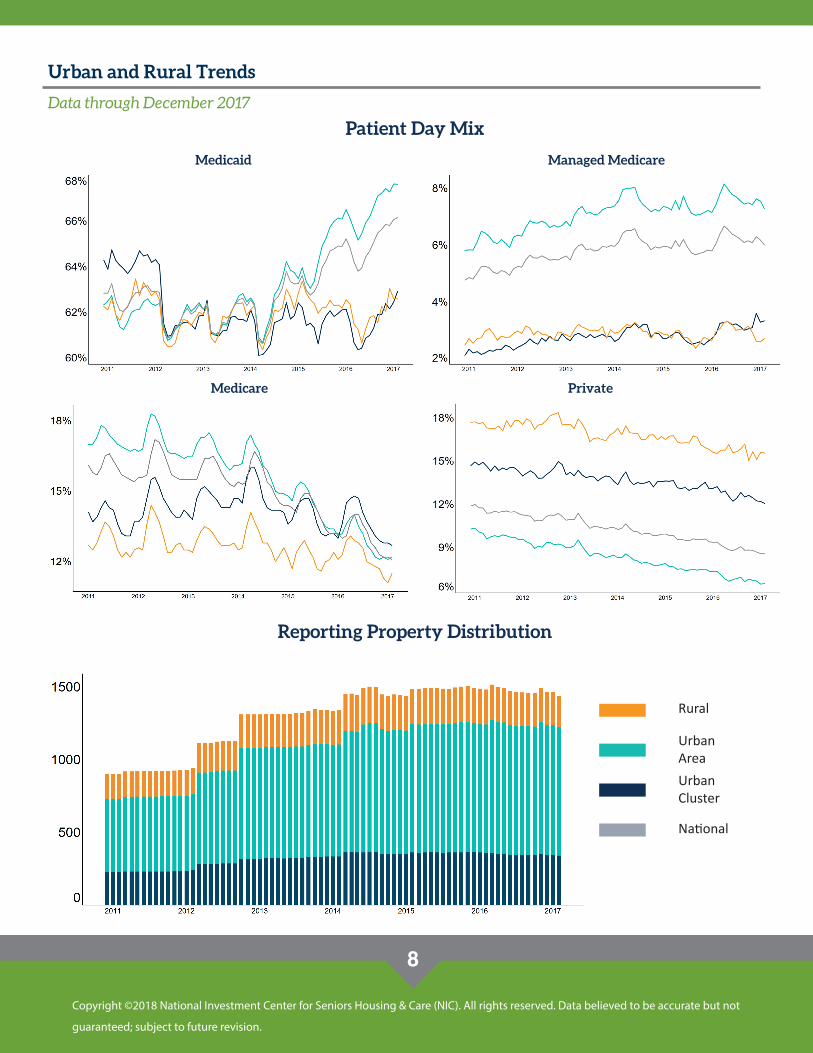
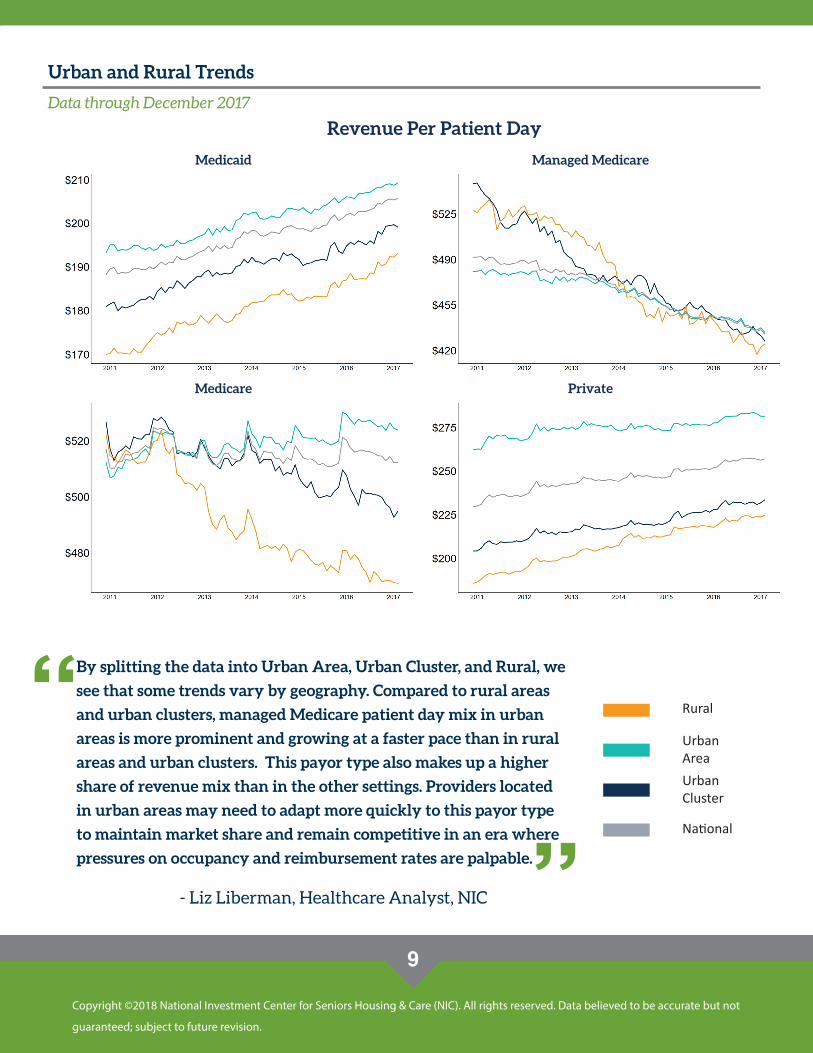
» Managed Medicare revenue per patient day (RPPD) pressures were again evident in the latest data as it
reached a new low at $433. However, an analysis of urban vs. rural areas suggests that the pressures of
managed Medicare are more prevalent in urban areas than rural areas, as the managed Medicare patient day
mix currently stands at 7.3% in urban areas and only 2.7% in rural areas.
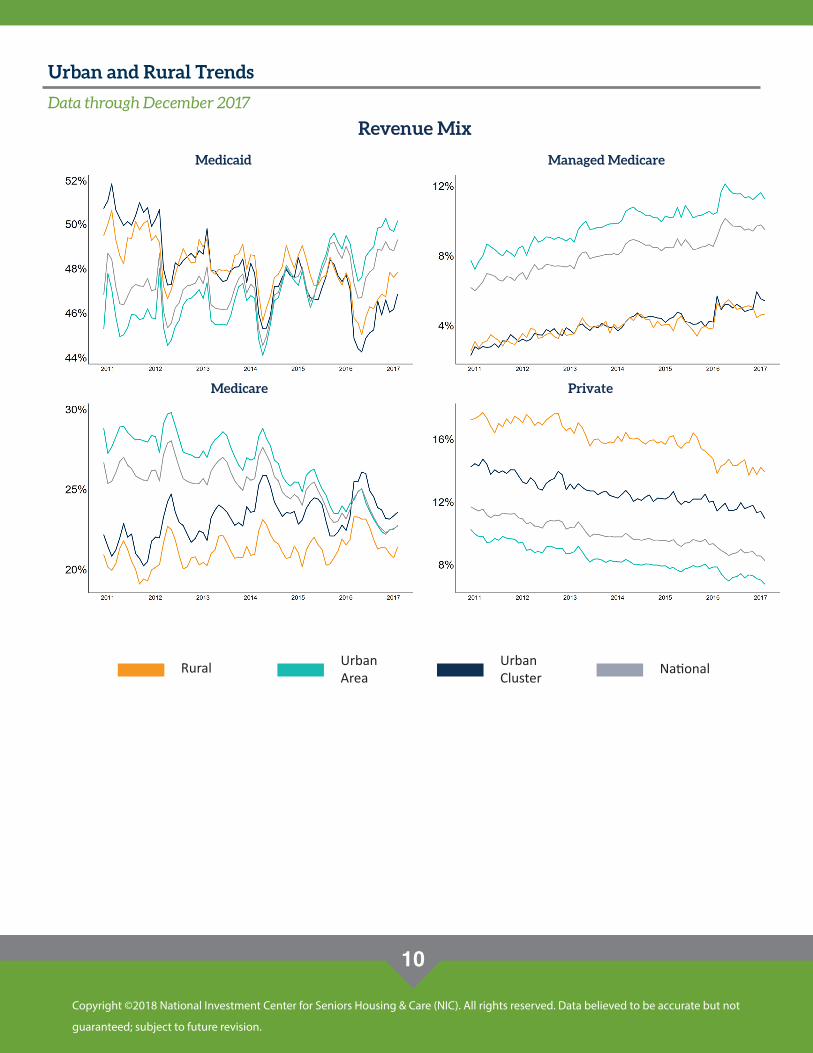
» Medicaid revenue mix now represents essentially half of all revenue at skilled nursing properties at 49.3% as
of the fourth quarter of 2017. That percentage is up 70 basis points from the prior year in the fourth quarter of
2016. Meanwhile, revenue mix has decreased for Medicare, the highest payor, to 22.8% which is down 98 basis
points from the prior year. This trend presents a challenge to the traditional skilled nursing business model as
Medicaid, the lowest payor, is growing in revenue mix as the highest payor, Medicare, is decreasing in revenue
mix.
» Private patient day mix in rural areas was more than that of urban areas at 15.6% compared to 6.5%,
respectively. One possible explanation for the differences among geography types is that urban skilled nursing
properties may face higher competition for market share, in part because of a greater supply of similar products
such as home care and other seniors housing types.
Key Takeaways
Copyright ©2018 National Investment Center for Seniors Housing & Care (NIC). All rights reserved. Data believed to be accurate but not
guaranteed; subject to future revision.
4
Patient Day Mix
Occupancy Quality and Skilled Mix
Medicaid
Medicare Private
Managed Medicare
Data through December 2017
National Skilled Nursing Trends

Copyright ©2018 National Investment Center for Seniors Housing & Care (NIC). All rights reserved. Data believed to be accurate but not
guaranteed; subject to future revision.
5
Revenue Per Patient Day Revenue Mix
Private
Medicaid
Medicare
Managed Medicare
Medicaid
Private
Managed Medicare
Medicare
Data through December 2017
National Skilled Nursing Trends

Copyright ©2018 National Investment Center for Seniors Housing & Care (NIC). All rights reserved. Data believed to be accurate but not
guaranteed; subject to future revision.
6
November DecemberStates Represented 48 48Number of Contributors 21 21Total SNF Properties 1,472 1,447
Data through December 2017
Skilled Nursing Coverage
Data through December 2017
Key Indicators
Copyright ©2018 National Investment Center for Seniors Housing & Care (NIC). All rights reserved. Data believed to be accurate but not
guaranteed; subject to future revision.
7
Occupancy
Quality Mix Skilled Mix
Rural
Urban Cluster
Urban Area
National
Geographic classifications of Urban Areas and Urban Clusters are based on the 2010 US Census Bureau. All properties not considered Urban Area or Urban Cluster are classified in this report as Rural. According to the US Census Bureau:
For the 2010 Census, the Census Bureau classified as urban all territory, population, and housing units locat-ed within urbanized areas (UAs) and urban clusters (UCs), both defined using the same criteria. The Census Bureau delineates UA and UC boundaries that represent densely developed territory, encompassing residen-tial, commercial, and other nonresidential urban land uses. In general, this territory consists of areas of high population density and urban land use resulting in a representation of the “urban footprint.” Rural consists of all territory, population, and housing units located outside UAs and UCs.
For the 2010 Census, the urban and rural classification was applied to the 50 states, the District of Columbia, Puerto Rico, American Samoa, Guam, the Commonwealth of the Northern Mariana Islands, and the U.S. Virgin Islands.
Urbanized Areas (UAs)—An urbanized area consists of densely developed territory that contains 50,000 or more people. The Census Bureau delineates UAs to provide a better separation of urban and rural territory, population, and housing in the vicinity of large places.
Urban Clusters (UCs)—An urban cluster consists of densely developed territory that has at least 2,500 peo-ple but fewer than 50,000 people. The Census Bureau first introduced the UC concept for Census 2000 to provide a more consistent and accurate measure of urban population, housing, and territory throughout the United States, Puerto Rico, and the Island Areas.
Urban and Rural Trends
Data through December 2017
Copyright ©2018 National Investment Center for Seniors Housing & Care (NIC). All rights reserved. Data believed to be accurate but not
guaranteed; subject to future revision.
8
Managed Medicare
PrivateMedicare
Medicaid
Reporting Property Distribution
Patient Day Mix
Data through December 2017
Urban and Rural Trends
Rural
Urban Cluster
Urban Area
National
Copyright ©2018 National Investment Center for Seniors Housing & Care (NIC). All rights reserved. Data believed to be accurate but not
guaranteed; subject to future revision.
9
Medicare Private
Managed MedicareMedicaid
Revenue Per Patient Day
Urban and Rural Trends
Data through December 2017
Rural
Urban Cluster
Urban Area
National
By splitting the data into Urban Area, Urban Cluster, and Rural, we
see that some trends vary by geography. Compared to rural areas
and urban clusters, managed Medicare patient day mix in urban
areas is more prominent and growing at a faster pace than in rural
areas and urban clusters. This payor type also makes up a higher
share of revenue mix than in the other settings. Providers located
in urban areas may need to adapt more quickly to this payor type
to maintain market share and remain competitive in an era where
pressures on occupancy and reimbursement rates are palpable.
- Liz Liberman, Healthcare Analyst, NIC
Copyright ©2018 National Investment Center for Seniors Housing & Care (NIC). All rights reserved. Data believed to be accurate but not
guaranteed; subject to future revision.
10
PrivateMedicare
Medicaid Managed Medicare
Revenue Mix
Urban and Rural Trends
Data through December 2017
Rural Urban Cluster
Urban Area
National
Copyright ©2018 National Investment Center for Seniors Housing & Care (NIC). All rights reserved. Data believed to be accurate but not
guaranteed; subject to future revision.
11
Glossary of Terms
Occupancy: Actual patient days divided by total days.
Patient Day Mix: Actual patient days of each payor source divided by the total actual days.
Quality Mix: Total number of Medicare, managed Medicare/other, and Private days divided by total number of actual
patient days.
Revenue Mix: Total revenue for the payor type divided by total revenue for all four payor types
Revenue Per Patient Day (RPPD): Total Revenue divided by actual patient days for each payor source.
Skilled Mix: Total number of Medicare and managed Medicare/other divided by total number of actual patient days.
Urban Area/ Urban Cluster/ Rural: See Page 7.
Explanation of Data
This data and its output is based on the sample population collected each month by NIC and the sample collected on an
historical basis. The historical data/time-series data and month/month figures are calculated using same-store analysis
as footnoted in the report.
This data should not be interpreted as a census survey for the skilled nursing properties within the United States, but
only a representation of the property count and state count as shown on Page 6.
National Skilled Nursing Trends are only reflective of the data from the current sample size within the NIC Skilled
Nursing Data Initiative.
About NIC
The National Investment Center for Seniors Housing & Care (NIC) is a 501(c)(3) organization whose mission is to advance
access and choice in seniors housing and care—from independent living, assisted living, and memory care, to skilled nursing
and post-acute care. NIC provides research, education, and increased transparency that facilitate leadership development,
quality outcomes, and informed investment decisions with respect to seniors housing and care. Since 1991, NIC has been the
leading source of research, data and analytics for owners, operators, developers, capital providers, researchers, academics,
public policy analysts and others interested in meeting the housing and care needs of America’s elders.
For more information, call (410) 267-0504.