Embed Size (px)
Citation preview

SKF Q1 results 2018
Alrik Danielson, President and CEO
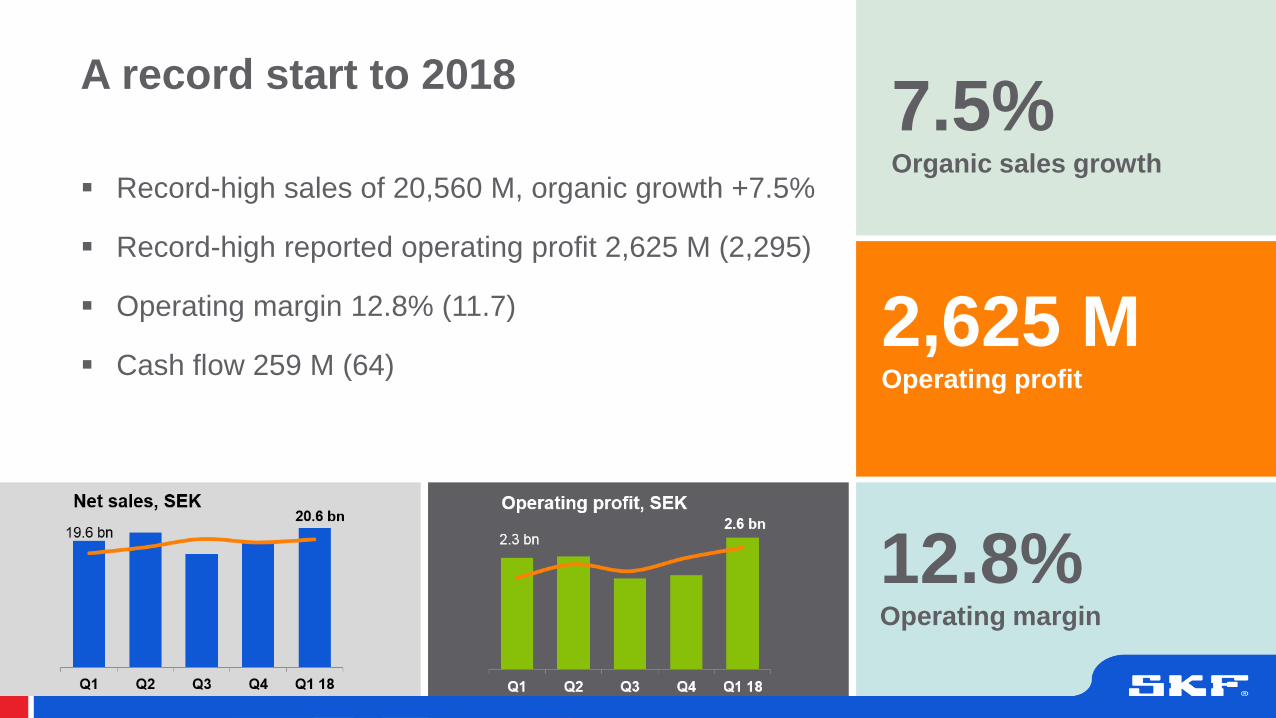
Record-high sales of 20,560 M, organic growth +7.5%
Record-high reported operating profit 2,625 M (2,295)
Operating margin 12.8% (11.7)
Cash flow 259 M (64)
A record start to 2018
12.8%Operating margin
2,625 MOperating profit
7.5% Organic sales growth

© SKF Group
Improving performance towards our targets
12.8%
Operating margin:
Target: 12%
66%
Net debt / equity:
Target: <80%
31.7%
Net working capital:
Target: 25%
15.0%
Return on capital employed:
Target: 16%
7.5%
Organic growth:
Target: 5%
Targets set in 2016 and valid over a business cycle:

© SKF Group
Sales growth in all marketsOrganic growth in local currency Q1 2018 vs Q1 2017
Europe
+7.6%
Asia/Pacific
+13.2%
Middle East
& Africa
+11.0%
Latin
America
+0.7%
North
America
+3.2%
© SKF Group
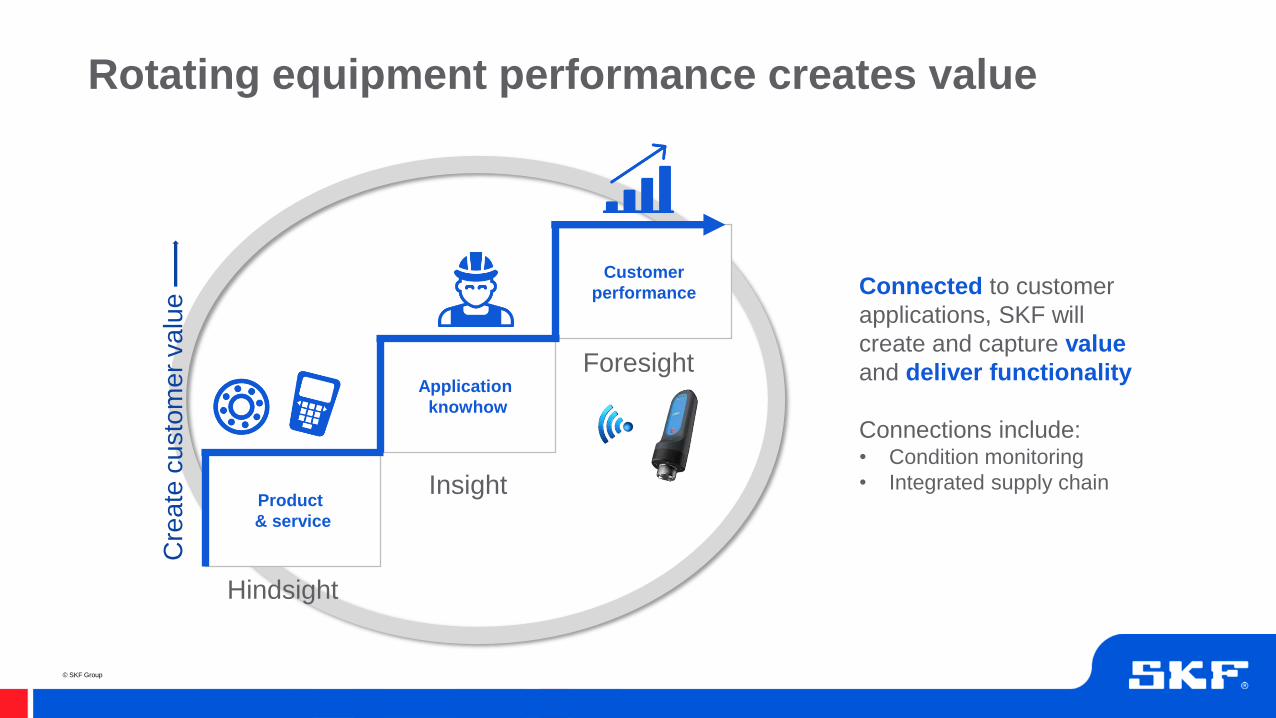
Rotating equipment performance creates value
Product
& service
Application
knowhow
Customer
performance Connected to customer
applications, SKF will
create and capture value
and deliver functionality
Connections include:• Condition monitoring
• Integrated supply chain
Hindsight
Foresight
Insight
Cre
ate
cu
sto
me
r va
lue
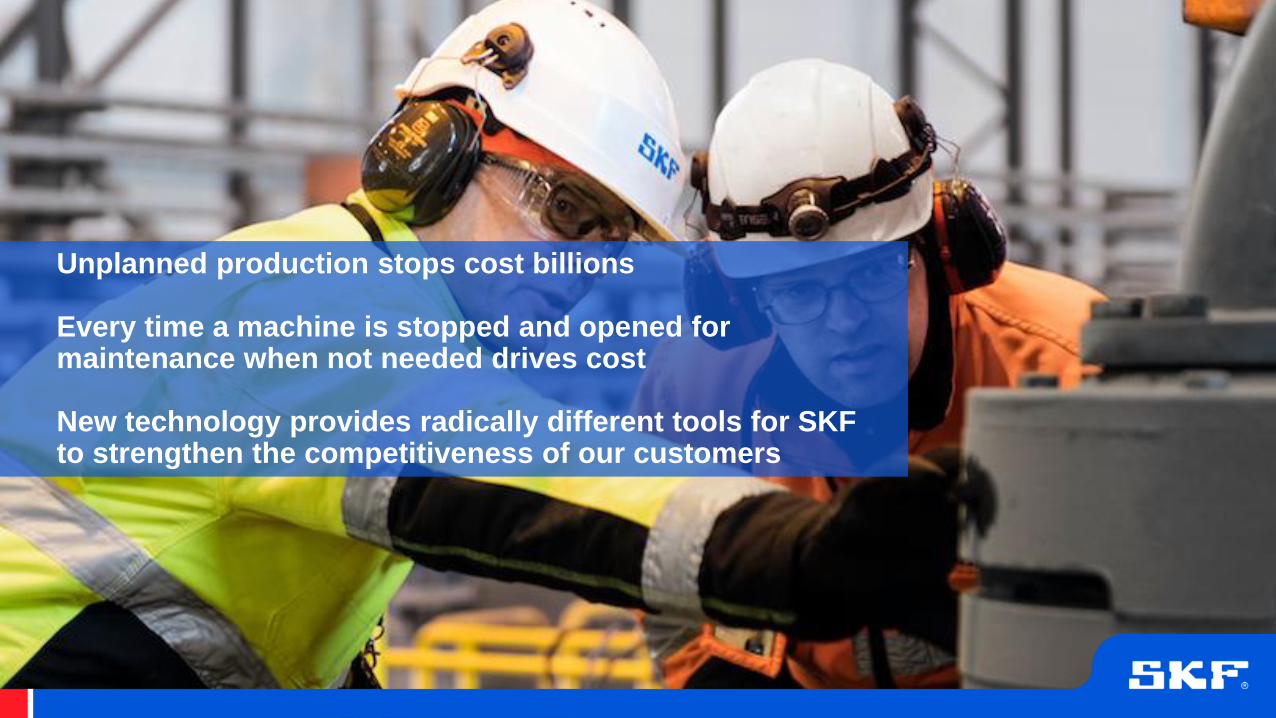
Unplanned production stops cost billions
Every time a machine is stopped and opened for maintenance when not needed drives cost
New technology provides radically different tools for SKF to strengthen the competitiveness of our customers

© SKF Group
SKF to supply bearings to Volkswagen’s all-electric MEB vehicle powertrain platform

© SKF Group
SKF selected for all main
shaft and most gearbox
bearings for the LEAP
Engine
SKF has now produced
more than 6,000 bearings
for the LEAP Engine
SKF is a development partner in manufacturing, design and testing of
main shaft and gearbox bearings
Ceramic hybrid main shaft ball bearings
SKF supports the LEAP program with a global supply chain, with plants
in US and Europe.
Key figures
14,300 total engine orders and commitments as of Feb. 2018
Sole engine for Boeing 737 and COMAC C919 aircrafts, and 50%
market share on Airbus A320neo
SKF has now produced more than 6,000 main shaft bearings
LEAP Engine : a success for SKF
Q1 results – the detailsChristian Johansson, CFO

© SKF Group
Sales development
2017 2018
Percent y-o-y Q1 Q2 Q3 Q4 Q1
Organic +8.0 +7.5 +8.0 +8.2 +7.5
Structure -2.0 -2.0 -0.7 -0.6 -0.7
Currency +4.9 +4.9 -3.0 -3.6 -1.9
Net sales +10.9 +10.4 +4.3 +4.0 +4.9

© SKF Group
Organic sales growth

© SKF Group
Operating profit

© SKF Group
Operating profit

© SKF Group
Industrial
Net sales 14,241 M
Organic sales +8.5%
Operating margin 15.0%, (14.0)
Automotive
Net sales 6,319 M
Organic sales +5.5%
Operating margin 7.7%, (6.8)
Performance by customer group

© SKF Group
SKF Group – Q1 2018
12.8%Operating margin
Financial performance (SEKm) 2018 2017
Net sales 20 560 19 601
Cost of goods sold -15 312 -14 627
Gross profit 5 248 4 974
Gross margin, % 25.5% 25.4%
Selling and administrative expenses -2 700 -2 691
Other operating income/expense 77 12
Operating profit 2 625 2 295
Operating margin, % 12.8 11.7
Financial income and expense, net -200 -170
Profit before taxes 2 425 2 125
Taxes -638 -654
Net profit 1 787 1 471
Basic earnings per share, SEK 3.77 3.09

© SKF Group
Cash flow after investments before financing*

© SKF Group
Net working capital 31.7% of annual sales

© SKF Group
Net debt/equity improved to 66 percent in the quarter

© SKF Group
Q2 2018:
Financial net: around -200 million
Currency impact on the operating profit is expected to be around 160 million negative
compared with 2017, based on exchange rates per 31 March, 2018.
2018:
Tax level: around 29% for 2018, excluding effects from divestments
Additions to property, plant and equipment: around 2,400 million for
2018
Guidance for 2018*
* Guidance is approximate and based on current assumptions and exchange rates.

© SKF Group
No adjustment for IAC on operating profit
No sequential demand guidance
Segment definitions have been aligned
with industry standard
Segment changes:
Cars & Light trucks has been renamed to
Light vehicles and includes two-wheelers
Industrial Heavy and Special has been
split in Agriculture, Food and Beverage,
Industrial Drives and Marine
Industrial General has been reclassified to
Industrial Drives
Other Industry has been renamed to Other
Industrial
Reporting changes

Continued growth in Q1
Record-high sales and operating profit
Expect to see continued growth in Q2 – higher
volumes year-over-year
Summary – Q1 a good start to 2018
12.8%Operating margin
2,625 MOperating profit
7.5% Organic sales growth
© SKF Group
Demand compared to the second quarter 2017
The demand for SKF’s products and services is expected to be higher for the Group,
including Industrial and Automotive. Demand is expected to be higher in Europe,
significantly higher in Asia and relatively unchanged in North America and Latin
America.
April 2018: SKF demand outlook Q2 2018

SKF Q1 results 2018Q & A
© SKF Group
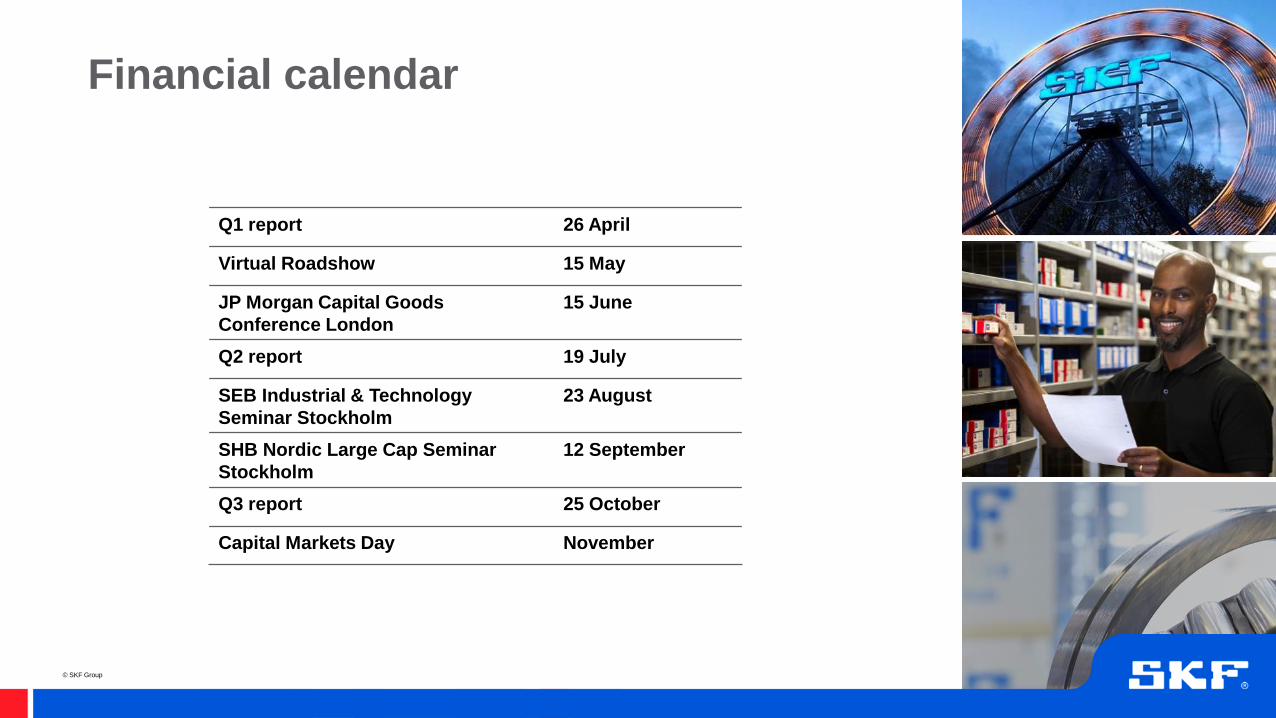
Financial calendar
Q1 report 26 April
Virtual Roadshow 15 May
JP Morgan Capital Goods
Conference London
15 June
Q2 report 19 July
SEB Industrial & Technology
Seminar Stockholm
23 August
SHB Nordic Large Cap Seminar
Stockholm
12 September
Q3 report 25 October
Capital Markets Day November

© SKF Group
This presentation contains forward-looking statements that are based on the current expectations of the
management of SKF.
Although management believes that the expectations reflected in such forward-looking statements are
reasonable, no assurance can be given that such expectations will prove to have been correct.
Accordingly, results could differ materially from those implied in the forward-looking statements as a
result of, among other factors, changes in economic, market and competitive conditions, changes in the
regulatory environment and other government actions, fluctuations in exchange rates and other factors
mentioned in SKF's latest annual report (available on www.skf.com) under the Administration Report;
“Risk management".
Cautionary statement