Embed Size (px)
Citation preview

Sketching Trigonometric Graphs
Starter
1) True or false? cos (x) = 1 + sin (x)
Why?
2) Solve 1 + 4sin(x) = 3 for 0 < x < 360
2 2
Sketching Trigonometric Graphs
Today we are learning...
How to sketch a variety of trigonometric graphs.
I will know if I have been successful if...
I can complete a table of values using a calculator.
I can plot the points from the table of values.
I can state the period and amplitude of a curve.
Sketching Trigonometric Graphs
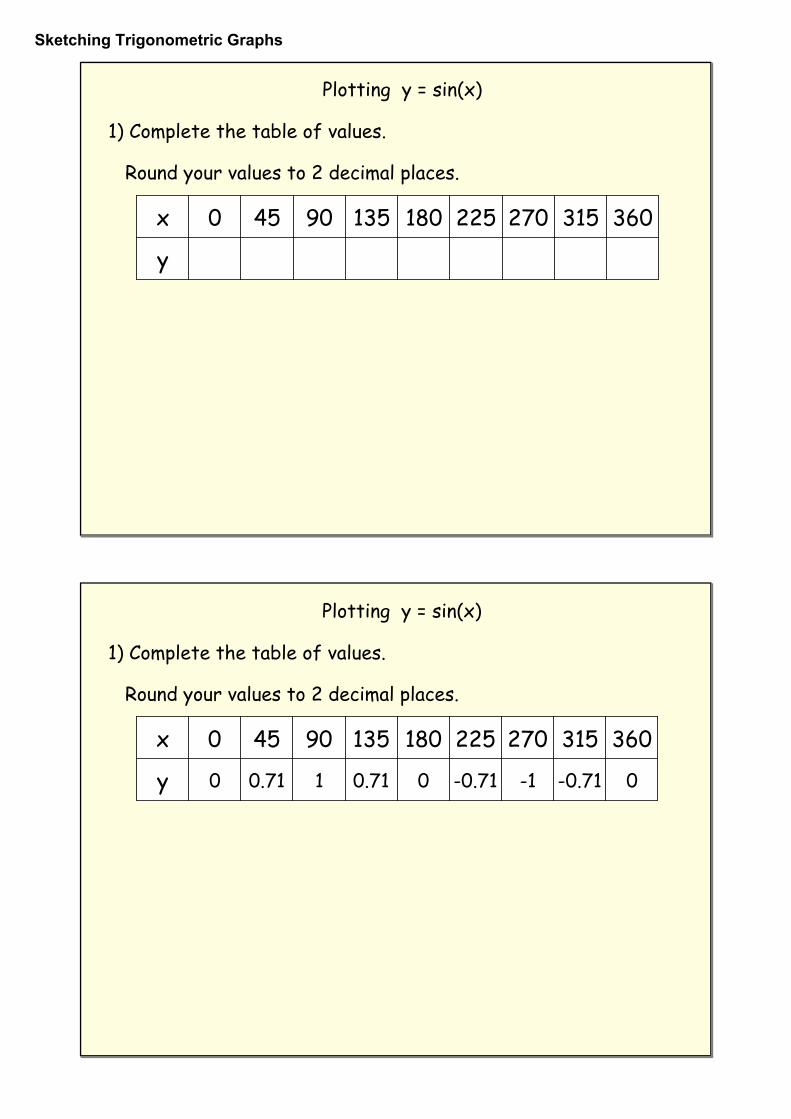
Plotting y = sin(x)
x 0 45 90 135 180 225 270 315 360
y
1) Complete the table of values.
Round your values to 2 decimal places.
Plotting y = sin(x)
x 0 45 90 135 180 225 270 315 360
y 0 0.71 1 0.71 0 -0.71 -1 -0.71 0
1) Complete the table of values.
Round your values to 2 decimal places.
Sketching Trigonometric Graphs
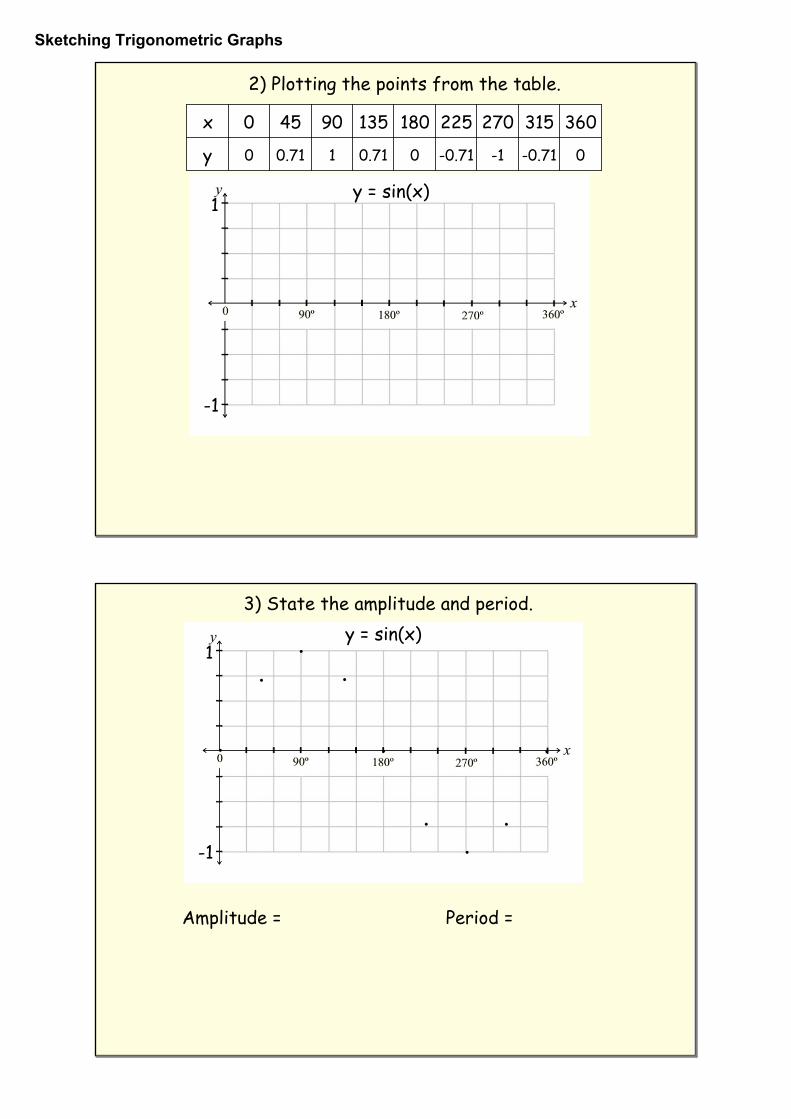
2) Plotting the points from the table.
1
-1
x 0 45 90 135 180 225 270 315 360
y 0 0.71 1 0.71 0 -0.71 -1 -0.71 0
y = sin(x)
3) State the amplitude and period.
1
-1
Amplitude = 1 Period = 360 o
y = sin(x)
Sketching Trigonometric Graphs
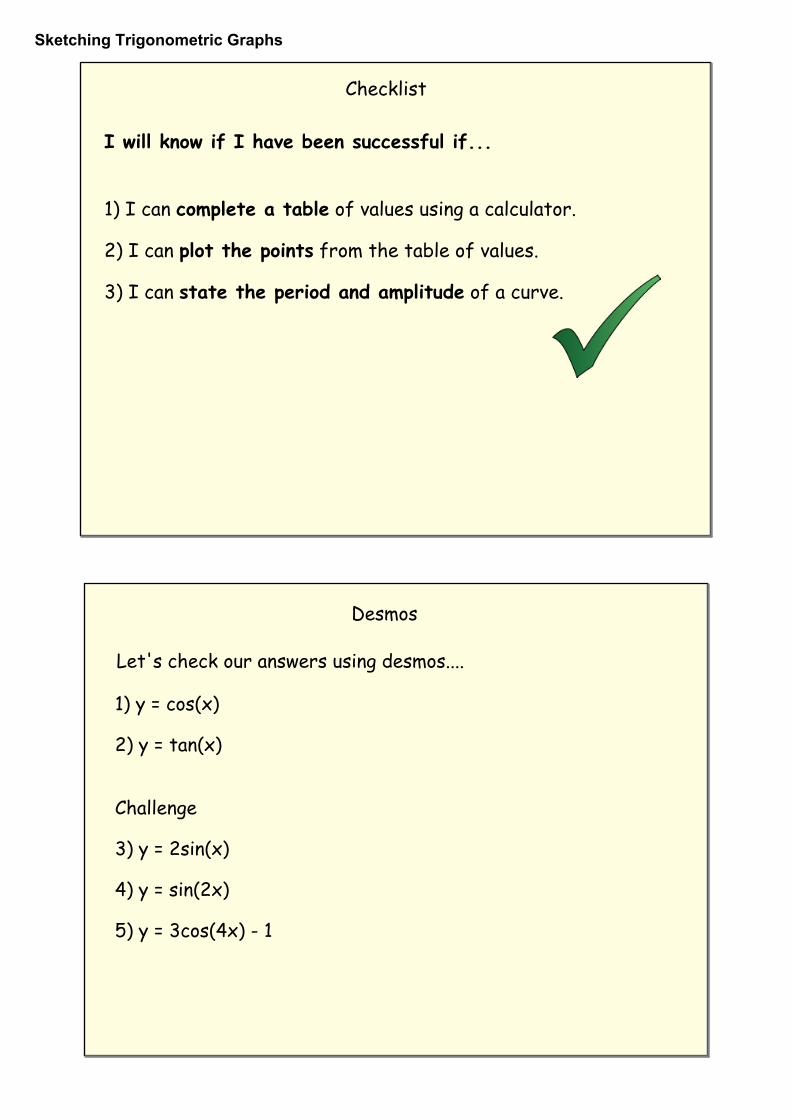
I will know if I have been successful if...
1) I can complete a table of values using a calculator.
2) I can plot the points from the table of values.
3) I can state the period and amplitude of a curve.
Checklist
Desmos
Let's check our answers using desmos....
1) y = cos(x)
2) y = tan(x)
Challenge
3) y = 2sin(x)
4) y = sin(2x)
5) y = 3cos(4x) - 1
Sketching Trigonometric Graphs
Summary
You are going to see 5 trigonometric graphs.
For each one on your whiteboard write down the...
Period =
Amplitude =
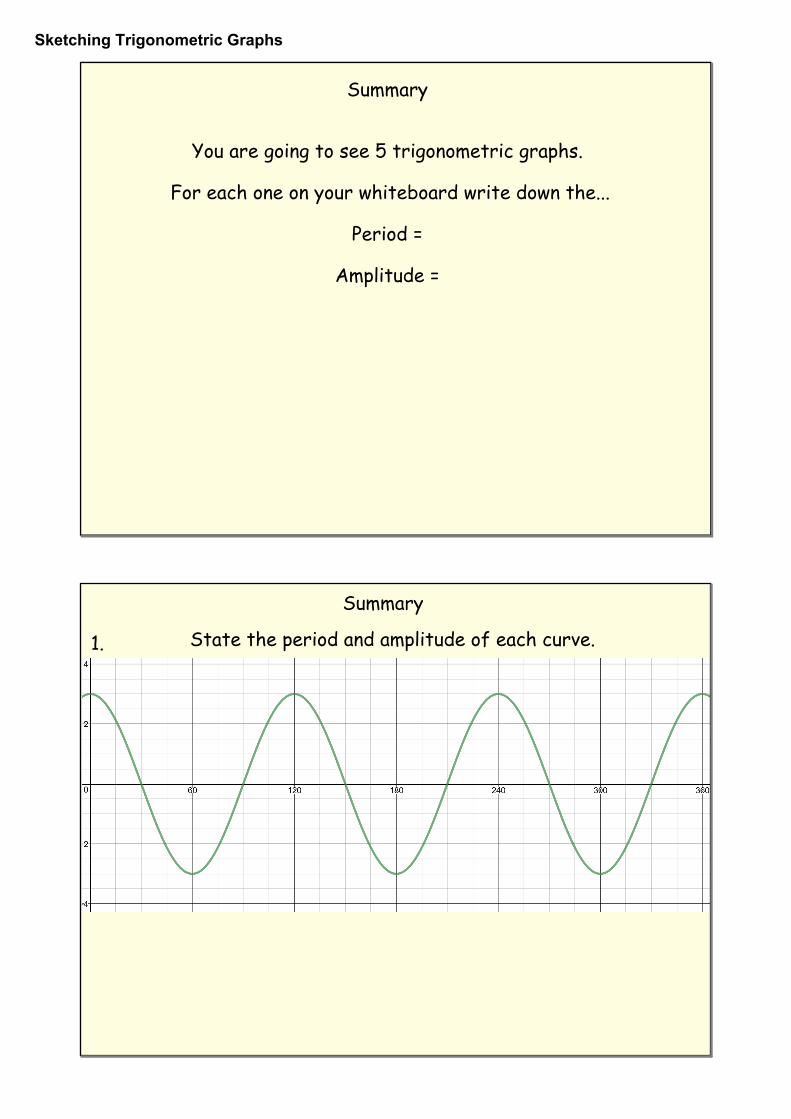
Summary
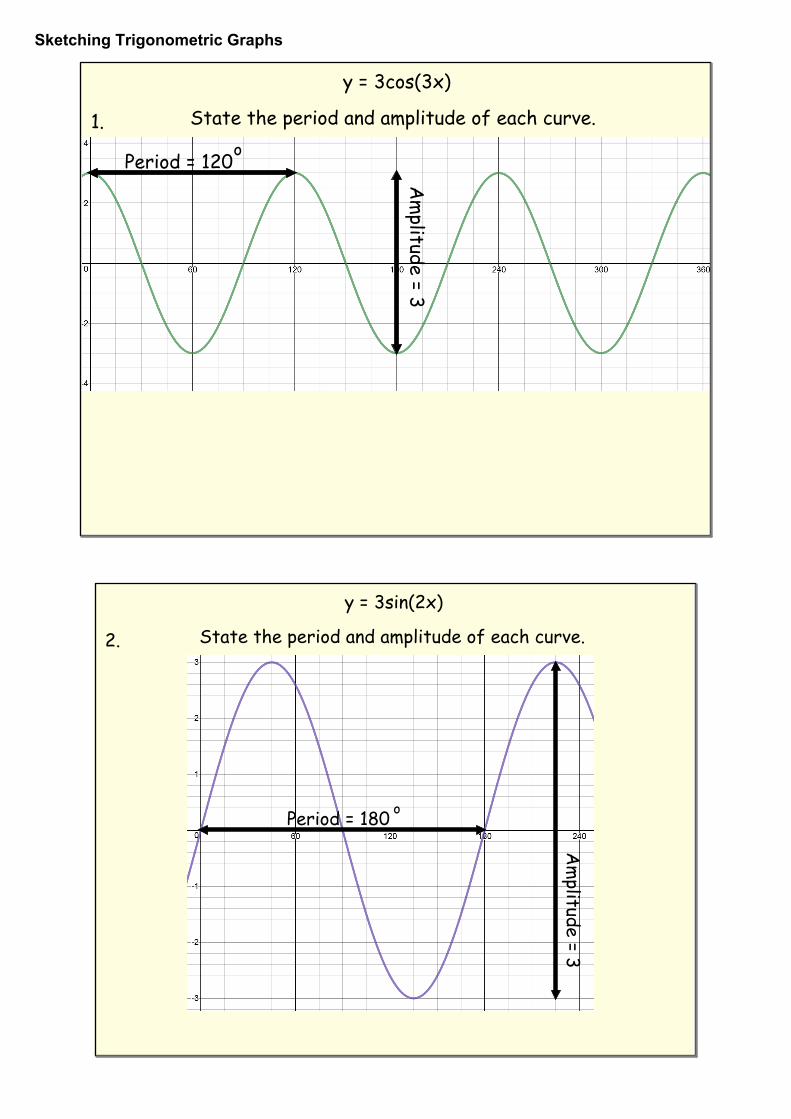
State the period and amplitude of each curve.1.

Sketching Trigonometric Graphs
Summary
State the period and amplitude of each curve.1.
Period = 120o
Am
plitude = 3
Summary
State the period and amplitude of each curve.2.
Sketching Trigonometric Graphs
Summary
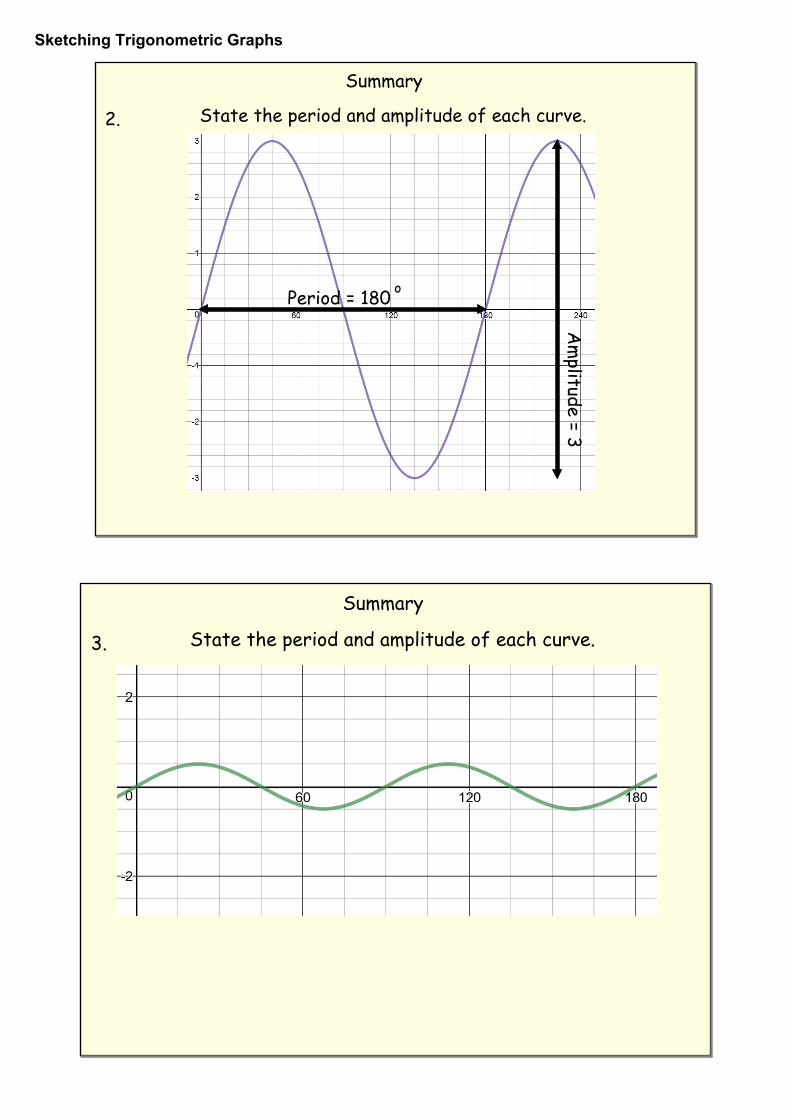
State the period and amplitude of each curve.2.
Period = 180 o
Am
plitude = 3
Summary
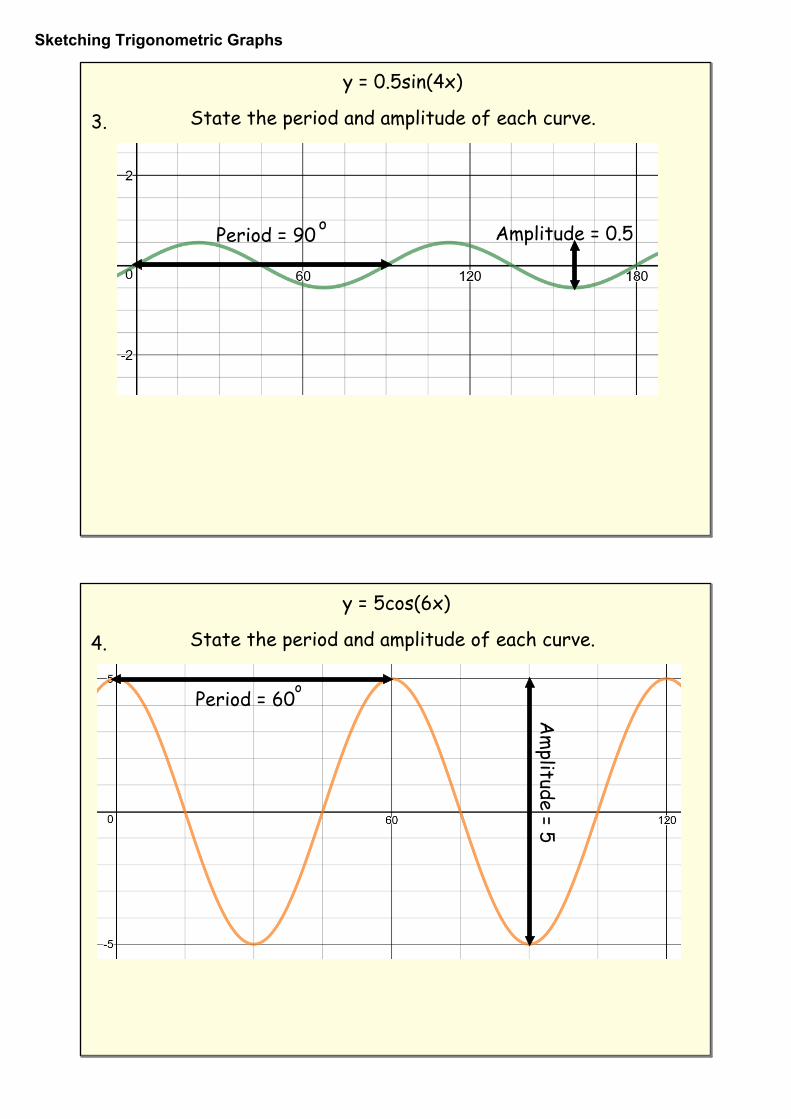
State the period and amplitude of each curve.3.
Sketching Trigonometric Graphs
Summary
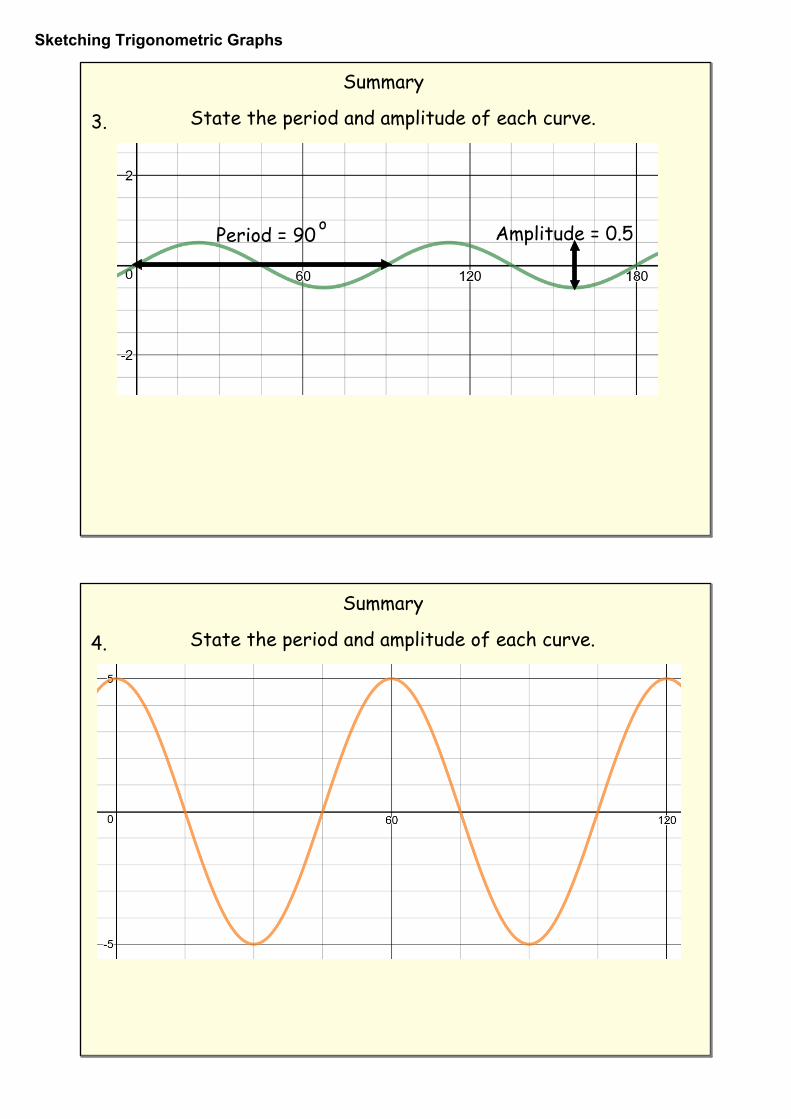
State the period and amplitude of each curve.3.
Period = 90 o Amplitude = 0.5
Summary
State the period and amplitude of each curve.4.

Sketching Trigonometric Graphs
Summary
State the period and amplitude of each curve.4.
Period = 60o
Am
plitude = 5
Summary
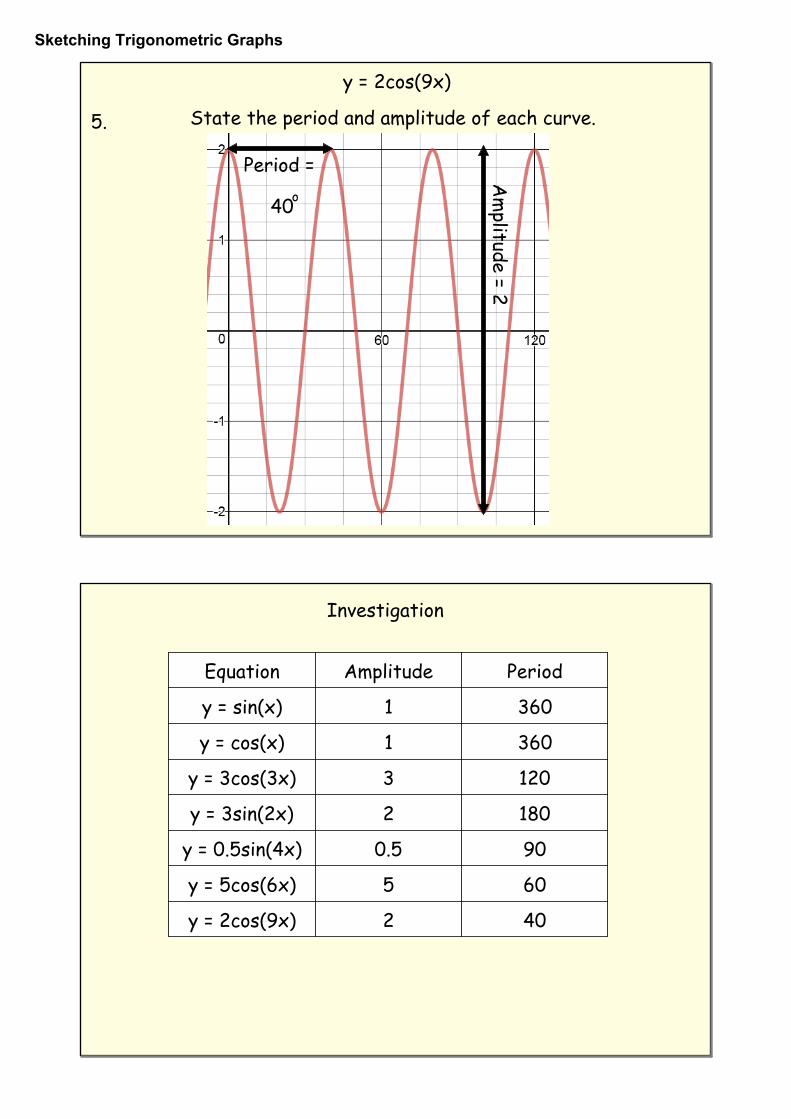
State the period and amplitude of each curve.5.
Sketching Trigonometric Graphs
Summary
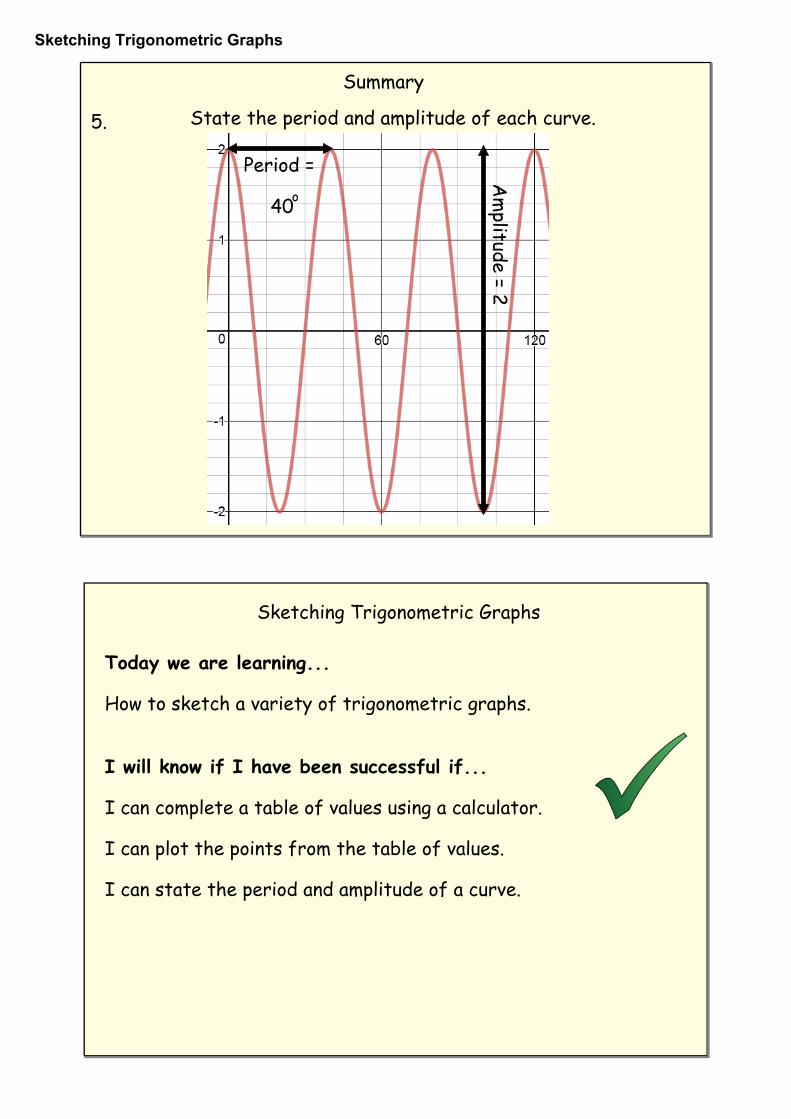
State the period and amplitude of each curve.5.
Period =
40o
Am
plitude = 2
Sketching Trigonometric Graphs
Today we are learning...
How to sketch a variety of trigonometric graphs.
I will know if I have been successful if...
I can complete a table of values using a calculator.
I can plot the points from the table of values.
I can state the period and amplitude of a curve.
Sketching Trigonometric Graphs
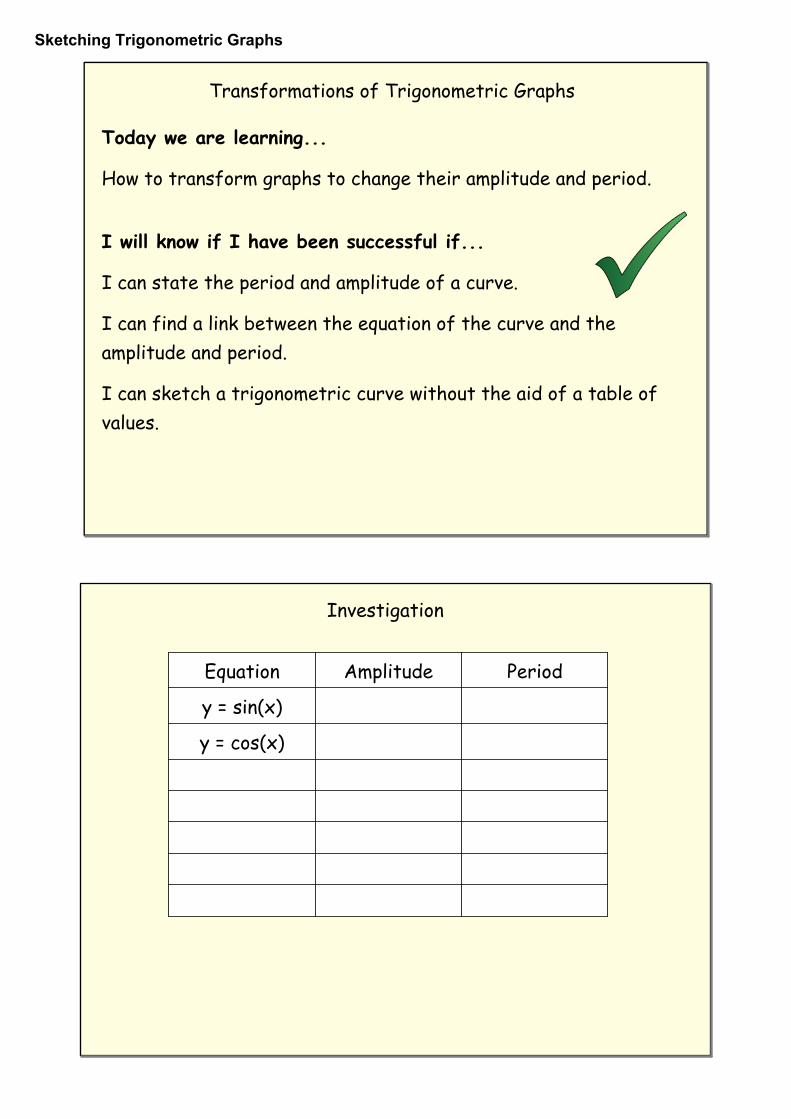
Transformations of Trigonometric Graphs
Today we are learning...
How to transform graphs to change their amplitude and period.
I will know if I have been successful if...
I can state the period and amplitude of a curve.
I can find a link between the equation of the curve and the amplitude and period.
I can sketch a trigonometric curve without the aid of a table of values.
Equation Amplitude Period
y = sin(x)
y = cos(x)
Investigation
Sketching Trigonometric Graphs
y = 3cos(3x)
State the period and amplitude of each curve.1.
Period = 120o
Am
plitude = 3
y = 3sin(2x)
State the period and amplitude of each curve.2.
Period = 180 o
Am
plitude = 3
Sketching Trigonometric Graphs
y = 0.5sin(4x)
State the period and amplitude of each curve.3.
Period = 90 o Amplitude = 0.5
y = 5cos(6x)
State the period and amplitude of each curve.4.
Period = 60o
Am
plitude = 5
Sketching Trigonometric Graphs
y = 2cos(9x)
State the period and amplitude of each curve.5.
Period =
40o
Am
plitude = 2
Equation Amplitude Period
y = sin(x) 1 360
y = cos(x) 1 360
y = 3cos(3x) 3 120
y = 3sin(2x) 2 180
y = 0.5sin(4x) 0.5 90
y = 5cos(6x) 5 60
y = 2cos(9x) 2 40
Investigation
Sketching Trigonometric Graphs
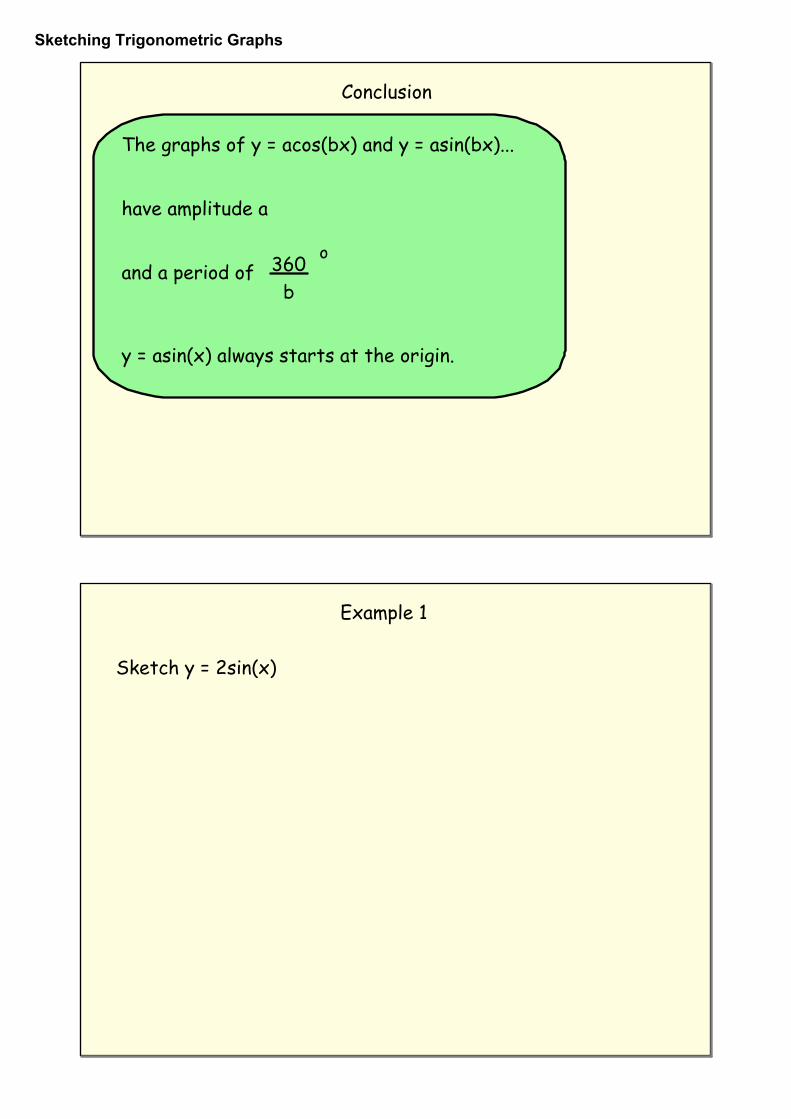
Conclusion
The graphs of y = acos(bx) and y = asin(bx)...
have amplitude a
and a period of
y = asin(x) always starts at the origin.
360b
o
Example 1
Sketch y = 2sin(x)
Sketching Trigonometric Graphs
Example 2
Sketch y = 1.5cos(x)
Practice
Choosing a suitable scale, sketch the following trigonometric graphs without using a table of values.
a) y = 3cos(x)
b) y = 2sin(x)
c) y = 0.5sin(x)
d) y = -4cos(x)
Challenge
e) y = 2.25sin(2x)
Sketching Trigonometric Graphs
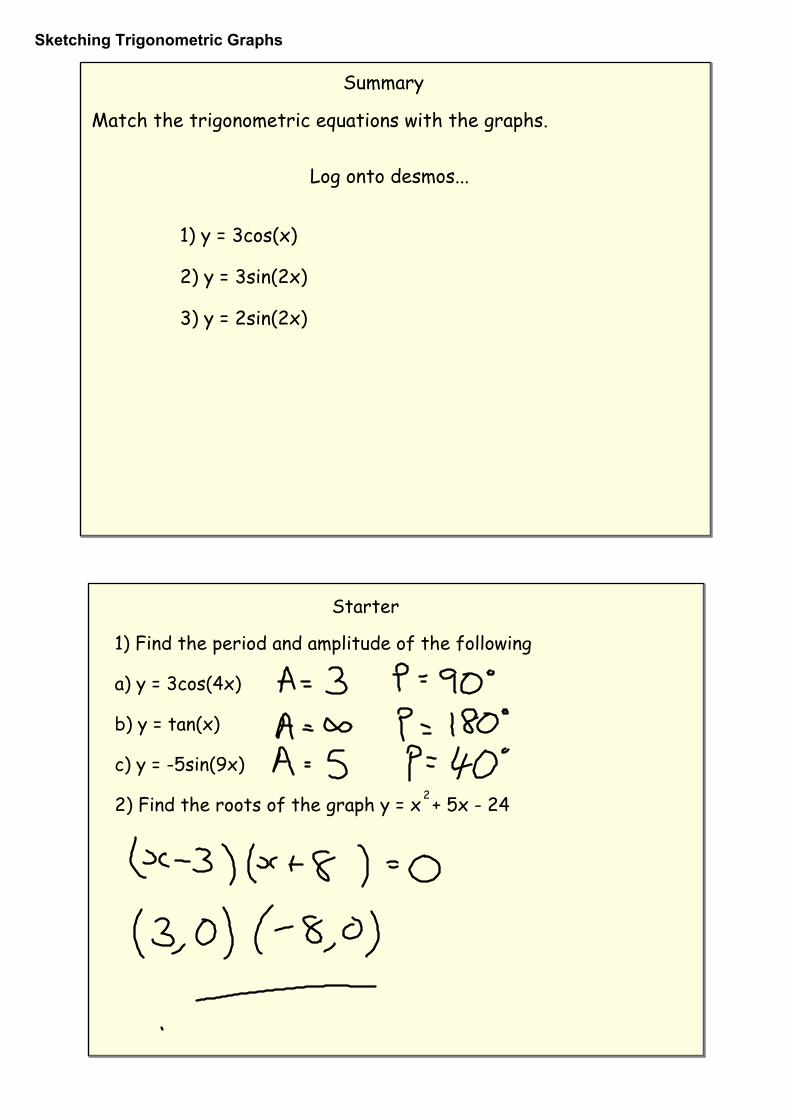
Summary
Match the trigonometric equations with the graphs.
Log onto desmos...
1) y = 3cos(x)
2) y = 3sin(2x)
3) y = 2sin(2x)
Starter
1) Find the period and amplitude of the following
a) y = 3cos(4x)
b) y = tan(x)
c) y = -5sin(9x)
2) Find the roots of the graph y = x + 5x - 242

Sketching Trigonometric Graphs
Graphing Trigonometric Functions
Today we are learning...
How to sketch trig functions without drawing a table.
I will know if I have been successful if...
I know where the curve starts.
I know the period and amplitude of the curve.
I can sketch the graph.
y = 2cos(3x) - Amplitude
- Period
- Origin?

Sketching Trigonometric Graphs
y = 3sin(6x) - Amplitude
- Period
- Origin?
Practice
1) y = 2cos(3x)
2) y = 4cos(2x)
3) y = sin(6x)
4) y = 3cos(12x)
5) y = -2sin(3x)
6) y = 4cos(6x)
Check answers on desmos...
Sketching Trigonometric Graphs
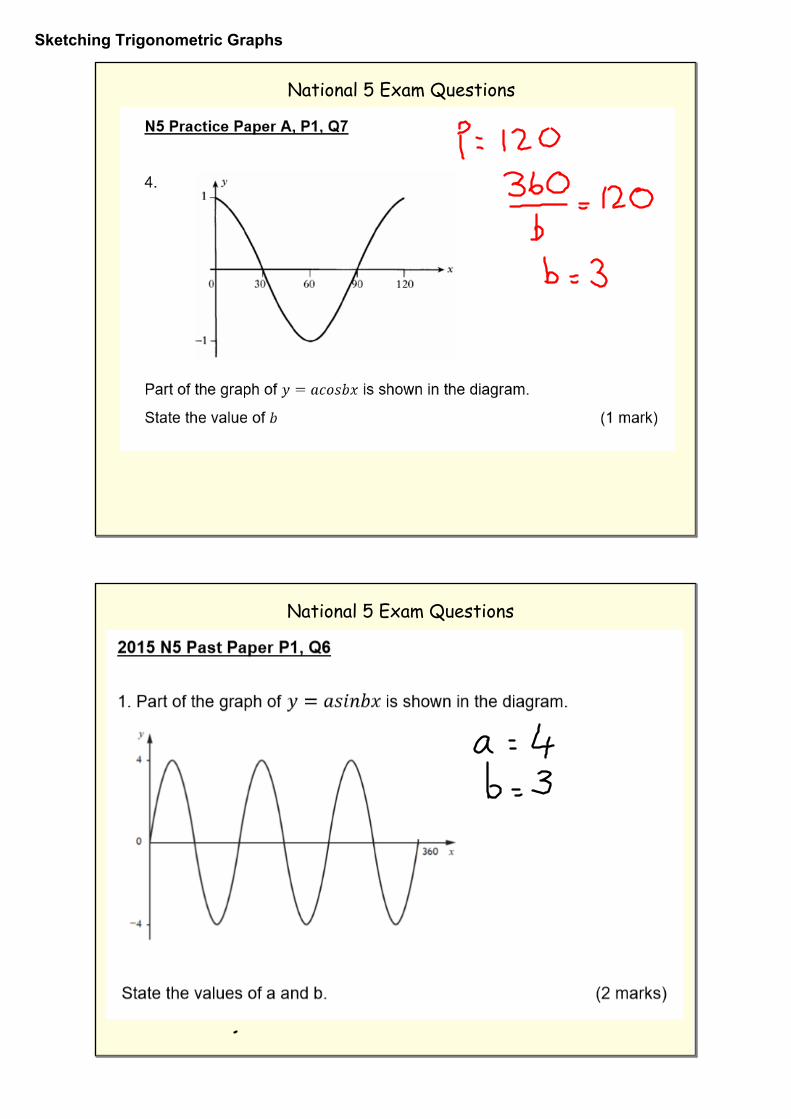
National 5 Exam Questions
National 5 Exam Questions

Sketching Trigonometric Graphs
Graphing Trigonometric Functions
Today we are learning...
How to sketch trig functions without drawing a table.
I will know if I have been successful if...
I know where the curve starts.
I know the period and amplitude of the curve.
I can sketch the graph.


![11X1 T02 07 sketching graphs [2011]](https://img.pdfslide.us/doc/110x75/55b6017fbb61eb350a8b46b0/11x1-t02-07-sketching-graphs-2011.jpg)