Embed Size (px)
Citation preview
1
Skeletal muscle oxidative function in vivo and ex vivo in athletes with marked 1
hypertrophy from resistance training 2
3
Desy Salvadego1, Rossana Domenis1, Stefano Lazzer1, Simone Porcelli1-2, Jörn Rittweger3-4, 4
Giovanna Rizzo2, Irene Mavelli1, Bostjan Šimunič5, Rado Pišot5, Bruno Grassi1-2 5
6
1 Department of Medical and Biological Sciences, University of Udine, Udine, Italy 7
2 Institute of Bioimaging and Molecular Physiology, National Research Council, Milan, Italy 8
3 Institute of Aerospace Medicine, German Aerospace Center, Cologne, Germany 9
4 Institute for Biomedical Research into Human Movement and Health, Manchester Metropolitan 10
University, Manchester, United Kingdom 11
5 Institute for Kinesiology Research, Science and Research Center, University of Primorska, 12
Koper, Slovenia 13
14
Running head: Oxidative function in athletes with marked muscle hypertrophy 15
16
Corresponding author: 17
Bruno Grassi, MD PhD 18
Dipartimento di Scienze Mediche e Biologiche 19
Piazzale M. Kolbe 4 20
I – 33100 Udine 21
Italy 22
Tel. +39-0432-494335, fax +39-0432-494301 23
E-mail: [email protected] 24
25
Articles in PresS. J Appl Physiol (March 21, 2013). doi:10.1152/japplphysiol.00883.2012
Copyright © 2013 by the American Physiological Society.
by 10.220.33.3 on January 25, 2017http://jap.physiology.org/
Dow
nloaded from
2
Abstract 26
27
Oxidative function during exercise was evaluated in 11 young athletes with marked skeletal 28
muscle hypertrophy induced by long-term resistance training (RTA, body mass 102.6±7.3 kg, 29
mean±SD) and 11 controls (CTRL, body mass 77.8±6.0). Pulmonary O2 uptake ( OV 2) and vastus 30
lateralis muscle fractional O2 extraction (by near-infrared spectroscopy) were determined during 31
an incremental cycle ergometer (CE) and one-leg knee-extension (KE) exercise. Mitochondrial 32
respiration was evaluated ex vivo by high-resolution respirometry in permeabilized vastus lateralis 33
fibers obtained by biopsy. Quadriceps femoris muscle cross sectional area, volume (determined by 34
magnetic resonance imaging) and strength were greater in RTA vs. CTRL (by ~40%, ~33% and 35
~20%, respectively). OV 2peak during CE was higher in RTA vs. CTRL (4.05±0.64 L min-1 vs. 36
3.56±0.30); no difference between groups was observed during KE. The O2 cost of CE exercise 37
was not different between groups. When divided per muscle mass (for CE) or quadriceps muscle 38
mass (for KE) OV 2peak was lower (by 15-20%) in RTA vs. CTRL. Vastus lateralis fractional O2 39
extraction was lower in RTA vs. CTRL at all work rates, both during CE and KE. RTA had higher 40
ADP-stimulated mitochondrial respiration (56.7±23.7 pmolO2·s-1·mg-1 ww) vs. CTRL (35.7±10.2), 41
and a tighter coupling of oxidative phosphorylation. In RTA the greater muscle mass and maximal 42
force, and the enhanced mitochondrial respiration seem to compensate for the hypertrophy-43
induced impaired peripheral O2 diffusion. The net results are an enhanced whole body oxidative 44
function at peak exercise, and unchanged efficiency and O2 cost at submaximal exercise, despite a 45
much greater body mass. 46
47
Key words: skeletal muscle hypertrophy; mitochondrial respiration; oxidative metabolism during 48
exercise. 49
50
by 10.220.33.3 on January 25, 2017http://jap.physiology.org/
Dow
nloaded from
3
Introduction 51
52
Resistance training programs have been developed with the aim of improving variables of muscle 53
function such as strength, power, speed, local muscular endurance, coordination, and flexibility 54
(21). Resistance training is now considered an important part of training and rehabilitation 55
programs for healthy subjects and for various types of patients, such as cardiac patients (45), 56
patients with pulmonary diseases (10), patients undergoing prolonged bed rest periods (2), or 57
elderly subjects (28). In these populations, the combination of resistance training with the more 58
conventional endurance exercise improves the patients’ outcomes and quality of life (45). 59
An increase in the cross sectional area of skeletal muscle fibers and a shift of fiber type 60
distribution towards type 2 fibers are typical adaptations induced by resistance training; these 61
adaptations enhance the muscle force-generating potential (12) but could represent an impairment 62
to skeletal muscle oxidative metabolism. On the other hand, muscles with higher maximal force 63
would need to recruit a lower number of motor units, and therefore more oxidative (and more 64
efficient) muscle fibers (20, 26). According to other authors strength training may increase 65
skeletal muscle efficiency (4) and enhance skeletal muscle “metabolic stability” (50). Other 66
studies reported, after resistance training, unchanged values of maximal O2 uptake (6), as well as 67
unchanged (19) or lower (42, 43) mitochondrial volume density, oxidative enzyme activity, and 68
capillary density in the hypertrophic muscles. Thus, the specific effects of resistance training, with 69
the related changes in muscle phenotype, on oxidative metabolism appear difficult to reconcile in 70
a unifying scenario. The aim of the present study was to determine whether increases in muscle 71
mass induced by chronic resistance training are associated, in humans, with alterations in skeletal 72
muscle oxidative function and aerobic performance. Experiments were carried out on a group of 73
resistance-trained athletes (RTA), in whom muscle adaptations to resistance exercise are expected 74
to be particularly marked. An integrative approach was applied by analyzing oxidative metabolism 75
by 10.220.33.3 on January 25, 2017http://jap.physiology.org/
Dow
nloaded from
4
at different levels, spanning from pulmonary gas exchange to skeletal muscle function and 76
mitochondrial respiration. Oxidative function was assessed in vivo during incremental cycle 77
ergometer (CE) exercise and dynamic knee extension (KE) exercise with one leg (3). During KE 78
the recruitment of a relatively small muscle mass, i.e. the quadriceps femoris of one leg, 79
significantly reduces constraints to oxidative function deriving from cardiovascular O2 delivery, 80
thereby allowing a more direct assessment of quadriceps muscle oxidative capacity in vivo. The 81
intrinsic properties of mitochondria were assessed ex vivo, in permeabilized muscle fibers 82
obtained by biopsy, by high-resolution respirometry (36). 83
We hypothesized, in RTA vs. control subjects (CTRL), an impaired skeletal muscle oxidative 84
function in vivo and an impaired mitochondrial respiratory function ex vivo. 85
86
Materials and Methods 87
88
Subjects 89
We evaluated eleven male RTA (age 25.4 ± 6.1 [mean ± SD] years; body mass (BM) 102.6 ± 7.3 90
kg; stature 1.84 ± 0.04 m; body mass index (BMI) 30.1 ± 2.6 kg·m-2), who had been following for 91
at least 5 years resistance training programs specifically designed to increase quadriceps muscle 92
strength and power, and eleven physically active CTRL (age 25.4 ± 3.8 years; BM 77.8 ± 6.0 kg; 93
height 1.81 ± 0.05 m; BMI 23.8 ± 2.2 kg·m-2). A thigh circumference above 60 cm (with thigh fat 94
thickness below 10 mm) was taken as a criterion for including subjects in the RTA group. A diary 95
of the training regimen and physical activity, focused on the 8 weeks preceding the evaluation, 96
was collected. RTA practiced sport activities such as American football (tackle position), track 97
and field (throwing), and weightlifting for an average of 487 ± 204 minutes per week. Most of 98
them took part at national-level competitions and championships. In their training sessions RTA 99
included standard protocols of resistance exercise targeting all major upper body and lower body 100
by 10.220.33.3 on January 25, 2017http://jap.physiology.org/
Dow
nloaded from
5
muscle groups. The RTA training regimen could be categorized as high-intensity and low-volume 101
resistance exercise training (21). The RTA subjects also practiced aerobic exercise such as running 102
and cycling for about 127 ± 150 minutes per week. CTRL practiced running and cycling for about 103
153 ± 133 minutes/wk and sport activities such as tennis, handball or gym activities for 102 ± 143 104
minutes/wk, respectively, essentially for recreational purposes. They did not follow any resistance 105
training program or any other specific training schedule. 106
Careful medical and pharmacological histories were collected. RTA and CTRL were not affected 107
by any disease and were not taking any drug at the time of the study. RTA did not report any drug 108
misuse to support their training. Participants were informed about the aims and methods of the 109
investigation and gave their written informed consent. The experiments were carried out at the 110
Valdoltra Orthopaedic Hospital of Ankaran, Slovenia. All procedures conformed to the 111
declaration of Helsinki (2000) and were approved by the Slovenian National Medical Ethics 112
Committee. 113
All tests were conducted under close medical supervision and following standard safety 114
procedures, and the subjects were continuously monitored by 12-lead electrocardiography (ECG). 115
116
Exercise protocols 117
Incremental exercise protocols were carried out by utilizing a mechanically braked cycle (CE) 118
ergometer (Monark Ergomedic 839E), and a custom-built knee extension (KE) ergometer 119
(modified Monark cycle ergometer), as originally described by Andersen et al. (3). The exercise 120
protocols were conducted in random order during different experimental sessions separated by a 121
24h recovery period. 122
During CE subjects performed an initial 4 min pedalling at 80 W, thereafter 20 W increments 123
were imposed every minute until voluntary exhaustion. Pedalling frequency was kept at ~60 rpm, 124
as imposed by a metronome. During KE subjects were constrained on an adjustable seat by a 125
by 10.220.33.3 on January 25, 2017http://jap.physiology.org/
Dow
nloaded from

6
safety belt, which anchored the angle of the hip at ~90°. Subjects pushed on a padded bar attached 126
to a lever arm connected to the crank of the cycle ergometer, and allowing a knee extension 127
between ~90 to ~170 degrees. This type of exercise confines muscle contractile activity to the 128
quadriceps femoris muscle of one leg, which is activated during the extension phase. The return of 129
the leg to the starting position is brought about passively by the momentum of the flywheel of the 130
ergometer (see 37 for details). Before data collection, each subject was familiarized with the setup 131
environment and the exercise protocol by short preliminary practice runs. After an initial 3 min of 132
unloaded KE exercise, an incremental test was performed. Work rate increments were imposed 133
every minute, in order to allow the subjects to reach exhaustion in ~10 min. Work rate was applied 134
by adjusting the tension of a strap around the ergometer flywheel, as in a mechanically braked 135
cycle ergometer. Throughout the test the active KE and passive knee flexion cycle was carried out 136
~40 times per minute, as imposed by a metronome. During each cycle (total duration 1.5 s) KE 137
lasted ~1 s. In other words muscle contraction corresponded to ~65% of the duty cycle. 138
All the exercises were conducted up to the limit of tolerance. The latter was defined as the 139
inability to maintain the imposed work rate at the required frequency, despite vigorous 140
encouragement by the operators. Mean values of cardiovascular, ventilatory, gas exchange and 141
muscle oxygenation variables (see below) were calculated during the last 20 seconds of each work 142
rate; values obtained during the exhausting work rate were considered “peak” values. 143
144
Measurements 145
Anthropometry. Fat-free mass (FFM) and total skeletal muscle mass were assessed by bioelectric 146
impedance analysis (BIA) performed by a tetrapolar device (Human IM, Dietosystem, Italy) in 147
accordance with the conventional standard technique (25). 148
Anatomical CSA, muscle volumes and muscle force. Anatomical cross sectional area (CSA) of 149
right thigh muscles and of the right quadriceps were measured from turbo spin-echo, T1-weighted, 150
by 10.220.33.3 on January 25, 2017http://jap.physiology.org/
Dow
nloaded from
7
Magnetic Resonance Images (MRI) obtained with a 1.5 Tesla (Magnetom Avanto; Siemens 151
Medical Solution, Erlangen, Germany). On each MRI slice, contours corresponding to the thigh 152
muscles and quadriceps were delineated by an expert of MRI imaging, using the image processing 153
tools available in the commercial software package AMIRA (v 4.1, Mercury Computer System 154
Inc., Chelmsford, MA, USA). The volumes of thigh muscles and quadriceps were then derived as 155
the geometrical volumes included in these contours. 156
Before the incremental tests, subjects performed two maximal voluntary isometric contractions 157
(MVC) of the knee extensors of the right leg at a 110° knee angle. Force was measured by an 158
electrical transducer (TSD121C, BIOPAC Systems, Inc., USA) implemented on a custom-built 159
chair for isometric contractions of knee extensor and flexor muscle groups. Force was sampled at 160
a frequency of 1 kHz (MP100, BIOPAC Systems). 161
Measurements during the incremental tests. Time to exhaustion was taken as an index of 162
performance. Pulmonary ventilation ( EV ), tidal volume (VT), respiratory frequency (fR), O2 163
uptake ( OV 2) and CO2 output ( COV 2) were determined on a breath-by-breath basis by means of 164
a metabolic unit (Quark b2, Cosmed, Italy). Expiratory flow measurements were performed by a 165
turbine flow meter calibrated before each experiment by a 3 L syringe at three different flow rates. 166
Calibration of O2 and CO2 analyzers was performed before each experiment by utilizing gas 167
mixtures of known composition. The gas exchange ratio (R) was calculated as COV 2/ OV 2. The 168
gas exchange threshold (GET) was determined by the V-slope method (5). All the data related to 169
GET were expressed as a percentage of OV 2 peak. 170
During KE a biphasic pattern in the OV 2 vs. work rate relationship was observed (see Richardson 171
et al., 34). During CE OV 2 and OV 2 peak values were expressed as L·min-1 and normalized per 172
unit of whole body muscle mass (mL·min-1·kg-1), whereas during KE OV 2 and OV 2 peak values 173
were expressed as L·min-1 and normalized as mL·min-1·100g-1 of quadriceps muscle mass (QM). 174
by 10.220.33.3 on January 25, 2017http://jap.physiology.org/
Dow
nloaded from
8
The latter was calculated on the basis of quadriceps muscle volume (see above), after assuming a 175
standard value for skeletal muscle density of 1.060 kg·L-1 (27). 176
Heart rate (HR) was determined by ECG. Stroke volume (SV) was estimated beat-by-beat by 177
impedence cardiography (Physio Flow, Manatec, Paris, France) (33). The accuracy of this device 178
has been previously evaluated during incremental exercise in healthy subjects against the direct 179
Fick method (33); in that study, the correlation coefficient between the two methods was r = 0.946 180
(P<0.01), and the mean difference was equal to -2.78 ± 12.33% (2 SD). Overall, the accuracy of 181
this method can be considered “acceptable” for the purpose of the study, that is to demonstrate 182
that the cardiac involvement during KE was not “maximal” also at peak exercise (as confirmed 183
also from HR measurements). Cardiac output ( Q ) was calculated as HR·SV. Cardiac index (CI; 184
Q /body surface) was also determined in order to take into account the difference in body size 185
between RTA and CTRL. 186
Oxygenation changes in vastus lateralis muscle were evaluated by near-infrared spectroscopy 187
(NIRS) (7, 13). Reliability of tissue oxygenation indices obtained by NIRS, evaluated by the 188
intraclass correlation coefficient for repeated measurements on the same subject during different 189
days, was found to be very high for skeletal muscle (41). NIRS measurements in muscle tissue 190
have been shown to be well correlated with local venous O2 saturation (48). A portable NIR 191
continuous-wave photometer (PortaMon, Artinis, The Netherlands) was utilized. Specific details 192
on the method can be found in recent papers by our group (32, 37). The instrument measures 193
micromolar (μM) changes in oxygenated haemoglobin (Hb) + myoglobin (Mb) concentrations 194
(∆[oxy(Hb+Mb)]), and in deoxygenated [Hb + Mb] (∆[deoxy(Hb+Mb)]), with respect to an initial 195
value arbitrarily set equal to zero and obtained during the resting condition preceding the test. 196
∆[deoxy(Hb+Mb)] is relatively insensitive to changes in blood volume and has been considered an 197
estimate of skeletal muscle fractional O2 extraction (ratio between O2 consumption and O2 198
delivery) (15, 18). A "physiological calibration" of ∆[deoxy(Hb+Mb)] values was performed by 199
by 10.220.33.3 on January 25, 2017http://jap.physiology.org/
Dow
nloaded from
9
obtaining a transient ischemia of the limb after the exercise period: data obtained during exercise 200
were expressed as a percentage of the values of maximal muscle deoxygenation obtained by 201
pressure cuff inflation (at 300-350 mm Hg), carried out at the inguinal crease of the thigh for a 202
few minutes, until ∆[deoxy(Hb+Mb)] increase reached a plateau (18). ∆[deoxy(Hb+Mb)] kinetics 203
during the incremental tests were fitted by a sigmoid function, as proposed by Ferreira et al. (14). 204
Skeletal muscle biopsy and high-resolution respirometry. Muscle samples were obtained from the 205
vastus lateralis muscle of the left limb by percutaneous biopsy which was taken, for all subjects, 5 206
h after the last incremental test. Biopsy was done after anesthesia of the skin, the subcutaneous fat 207
tissue and the muscle fascia with 2 mL of lidocaine (2%). A small skin incision was then made to 208
penetrate skin and fascia, and the tissue sample was harvested with a purpose-built rongeur (Zepf 209
Instruments, Tuttlingen, Germany). The muscle samples were divided into two portions. One 210
portion (~10 mg wet weight) was immediately frozen in liquid nitrogen and stored at –80°C until 211
enzymatic determination of citrate synthase (CS) activity. The other portion (~10 mg wet weight) 212
was used to measure mitochondrial respiration ex vivo and was immediately placed in an ice-cold 213
relaxing solution containing: EGTA-calcium buffer (10 mM) (free Ca2+ concentration 100 nmol L-214
1), imidazole (20 mM), taurine (20mM), K+/4 morpholinoethanesulfonic acid (K-MES; 50 mM), 215
dithiothreitol (DTT; 0.5 mM), MgCl2 (6.56 mM), ATP (5.77 mM), phosphocreatine (15 mM), pH 216
7.1. 217
The fiber bundles were separated with sharp-ended needles, leaving only small areas of contact, 218
and were incubated in 5 mL of the above solution (4°C) containing 50 μg mL-1 saponin for 30 min 219
with continuous gentle stirring, in order to ensure complete permeabilization. After being rinsed 220
twice for 10 min in a respiration medium (MiR05, Oroboros, Innsbruck, Austria; 0.5 mM EGTA, 221
60 mM potassium lactobionate, 3 mM MgCl2 6H2O, 20 mM taurine, 10 mM KH2PO4, 20 mM 222
HEPES, 110 mM sucrose and 1 g/L BSA, pH 7.1), permeabilized fibers were measured for wet 223
by 10.220.33.3 on January 25, 2017http://jap.physiology.org/
Dow
nloaded from
10
weight and immediately transferred into a respirometer (Oxygraph-2k; Oroboros Instruments, 224
Innsbruck, Austria) for the analysis. 225
Mitochondrial respiratory function was evaluated by measuring O2 consumption polarographically 226
by high-resolution respirometry (17, 29). Data were digitally recorded using DatLab4 software 227
(Oroboros Instruments). The instrumentation allows for O2 consumption measurements with small 228
amounts of sample in closed respiration chambers containing 3 mL of air-saturated respiration 229
medium at 30°C; 3-5 mg of muscle fibers were used for the analysis. Standardized instrumental 230
and chemical calibrations were performed to correct for back-diffusion of O2 into the chamber 231
from the various components, leak from the exterior, O2 consumption by the chemical medium, 232
and sensor O2 consumption (29). The O2 concentration in the chamber was maintained between 233
250 and 400 μM to avoid O2 limitation of respiration. Intermittent reoxygenation steps were 234
performed during the experiments by adding a 200 mM hydrogen peroxide solution into the 235
medium containing catalase (29). A substrate-uncoupler-inhibitor-titration protocol with a 236
substrate combination that matches physiological intracellular conditions was applied (17). Non 237
phosphorylating resting mitochondrial respiration was measured in the presence of malate (4 238
mM), glutamate (10 mM), and succinate (10 mM), without ADP, so that O2 consumption was 239
mainly driven by the back leakage of protons through the inner mitochondrial membrane (“leak” 240
respiration). ADP-stimulated mitochondrial respiration (“state 3” respiration) was measured after 241
the subsequent addition of ADP (2.5 mM) as phosphate acceptor with malate, glutamate and 242
succinate as substrates. The addition of cytochrome c (10 μM) had no additive effects on 243
respiration, with minor increases of ~2%, thereby confirming the integrity of the outer 244
mitochondrial membrane. We also examined electron transport system capacity by stepwise 245
addition of the chemical uncoupler protonophore carbonylcyanide-p-246
trifluoromethoxyphenylhydrazone (FCCP) to optimum concentration (1.25 μM). Rotenone (1 μM) 247
and antimycin A (2.5 μM) were added to inhibit complexes I and III, providing a measure of 248
by 10.220.33.3 on January 25, 2017http://jap.physiology.org/
Dow
nloaded from
11
residual O2 consumption, indicative of non-mitochondrial O2 consumption. Mitochondrial 249
respiration was then corrected for O2 flux due to the residual O2 consumption. The respiratory 250
acceptor control ratio (RCR), taken as an index of coupling between electron transfer and 251
phosphorylation, was obtained by dividing state 3 respiration by leak respiration. 252
CS activity was determined in frozen fiber bundles (~5 mg wet weight), which were homogenized 253
in buffer (2,5% w/v) containing 250 mM sucrose, 40 mM KCl, 2 mM EGTA, 20 mM Tris HCl 254
(pH 7.4) and supplemented with 0,1% Triton X-100. CS activity was assayed according to Srere 255
(40) by spectrophotometric methods (Lambda 14 Spectrometer; Perkin Elmer) and was expressed 256
as micromoles of substrate per minute per gram of total protein content. Protein content was 257
estimated by Bradford assay (8). 258
259
Statistical analysis 260
Results were expressed as means ± standard deviation (SD). Statistical significance of differences 261
between groups (RTA vs. CTRL) was checked by two-tailed Student’s t test for unpaired data. 262
Bonferroni correction was used for multiple comparisons. The level of significance was set at 263
P<0.05. Statistical analyses were carried out with software packages (GraphPad Prism 4.0, 264
GraphPad Software Inc.; SPSS, Statistical Package Social Sciences, 13.0.1). 265
266
Results 267
268
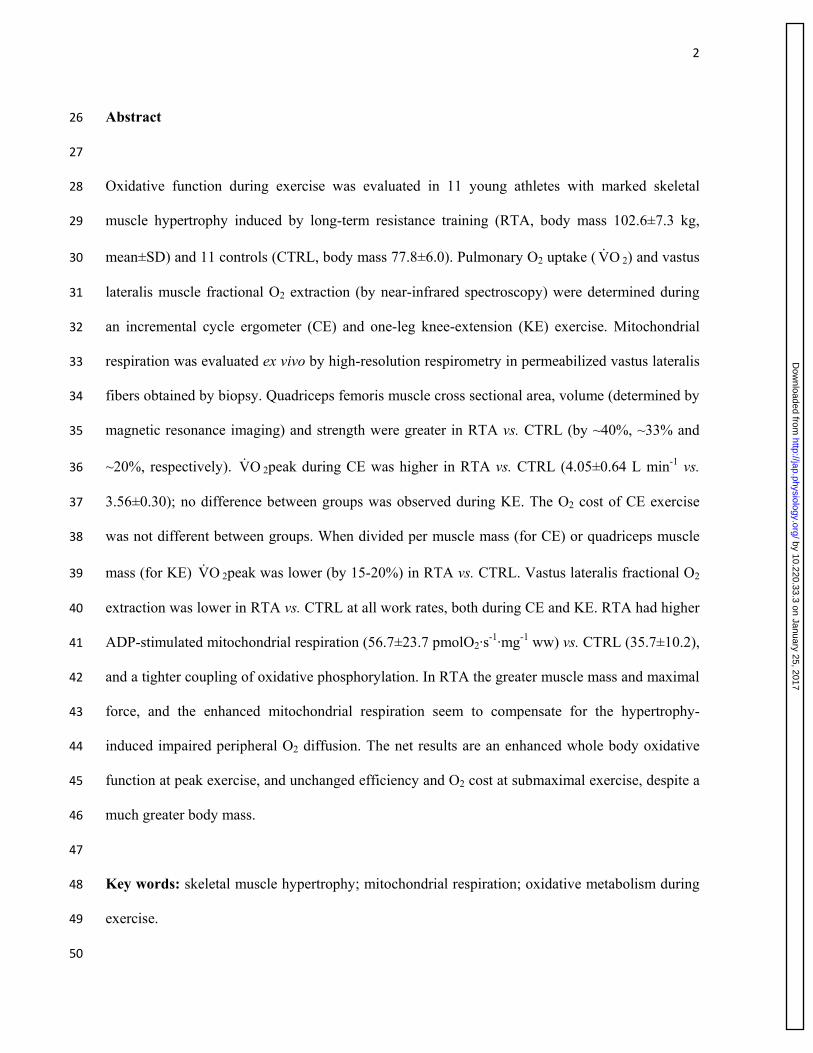
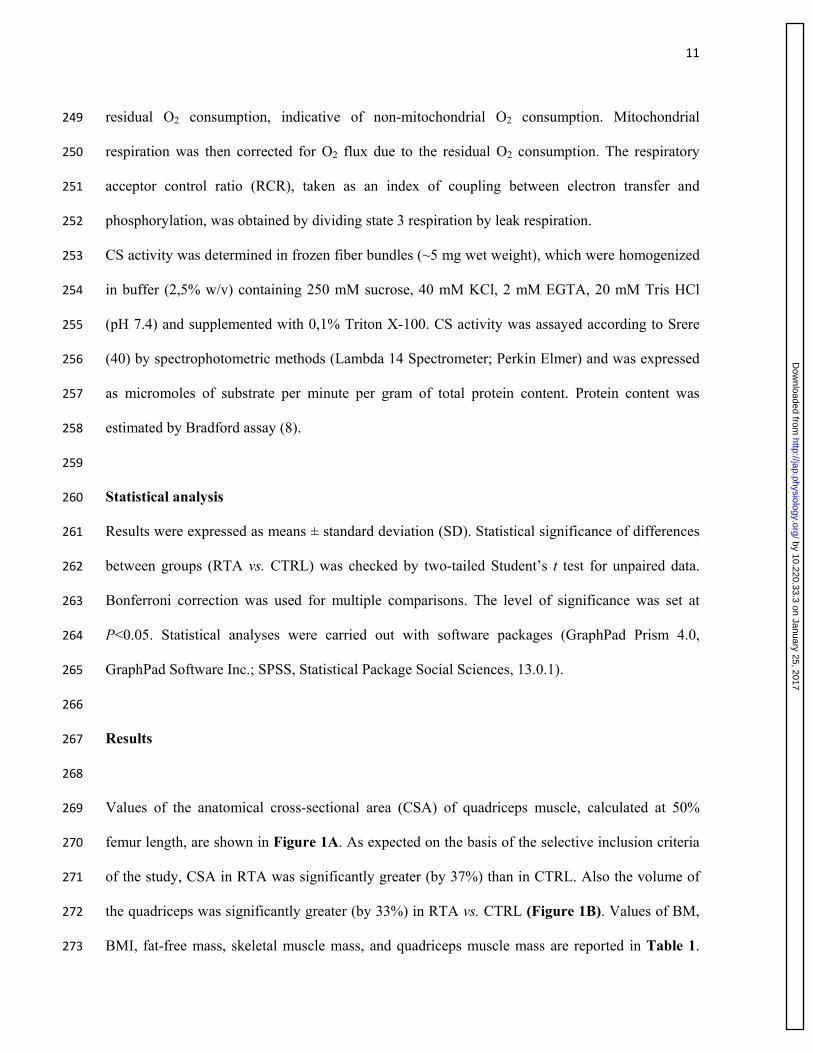
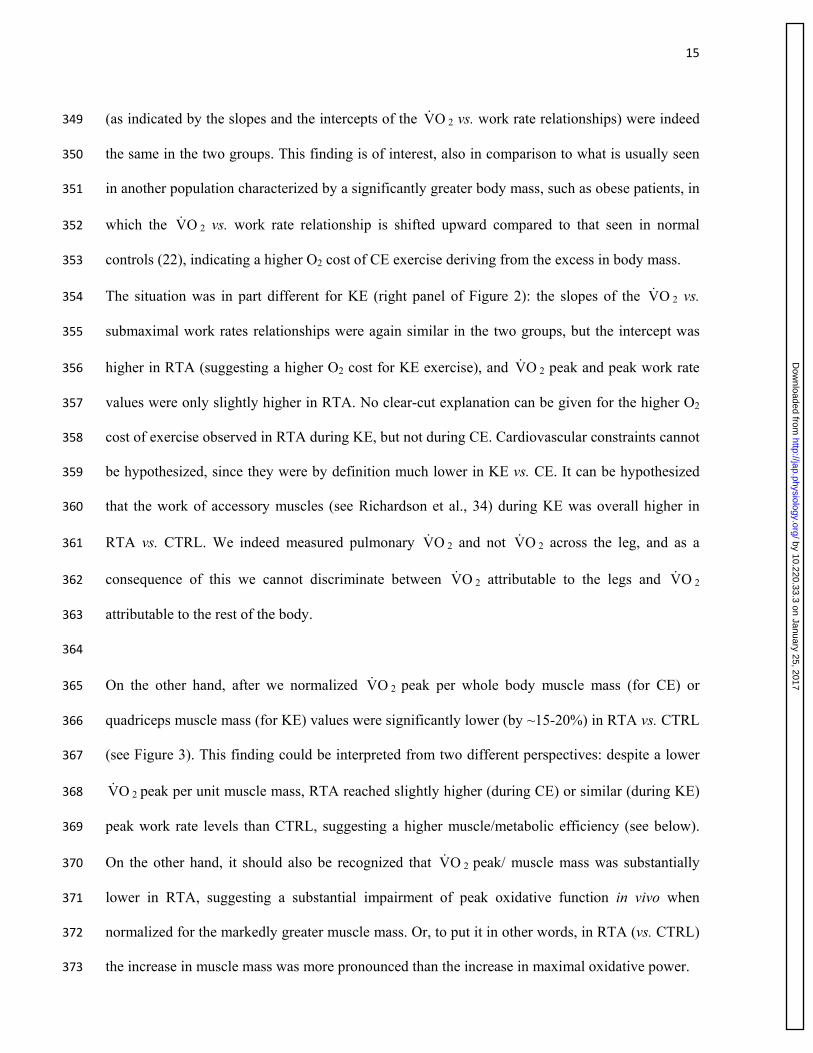
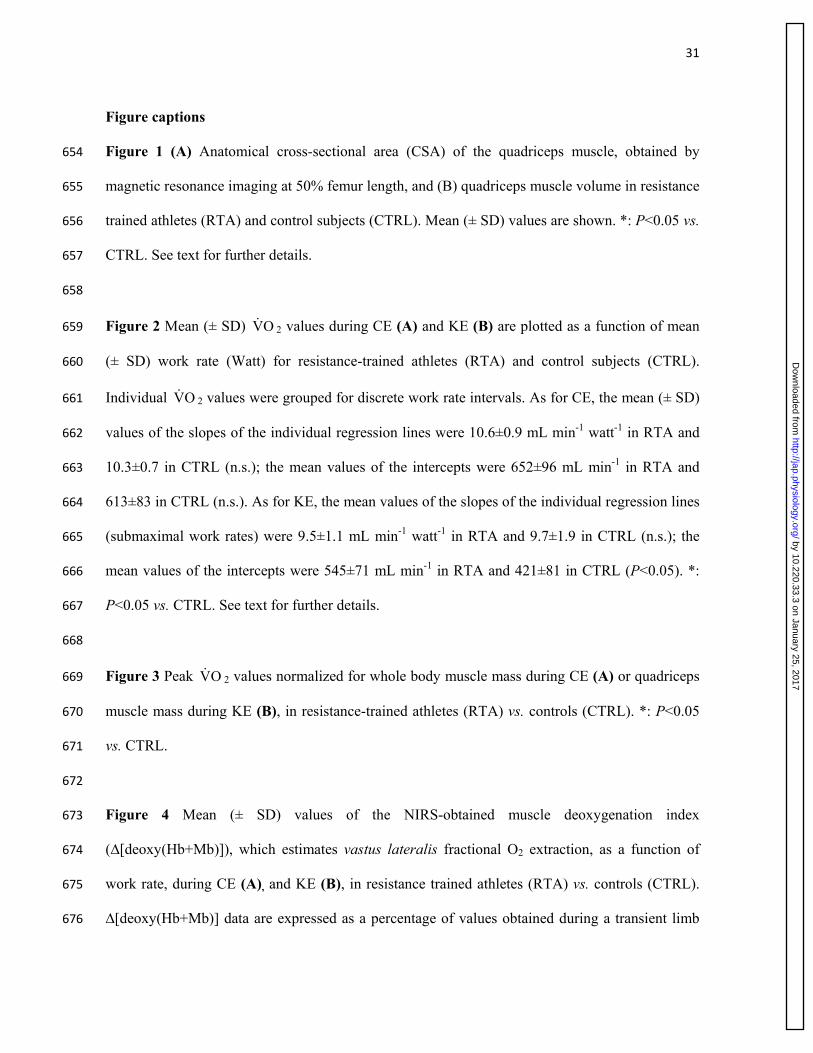
Values of the anatomical cross-sectional area (CSA) of quadriceps muscle, calculated at 50% 269
femur length, are shown in Figure 1A. As expected on the basis of the selective inclusion criteria 270
of the study, CSA in RTA was significantly greater (by 37%) than in CTRL. Also the volume of 271
the quadriceps was significantly greater (by 33%) in RTA vs. CTRL (Figure 1B). Values of BM, 272
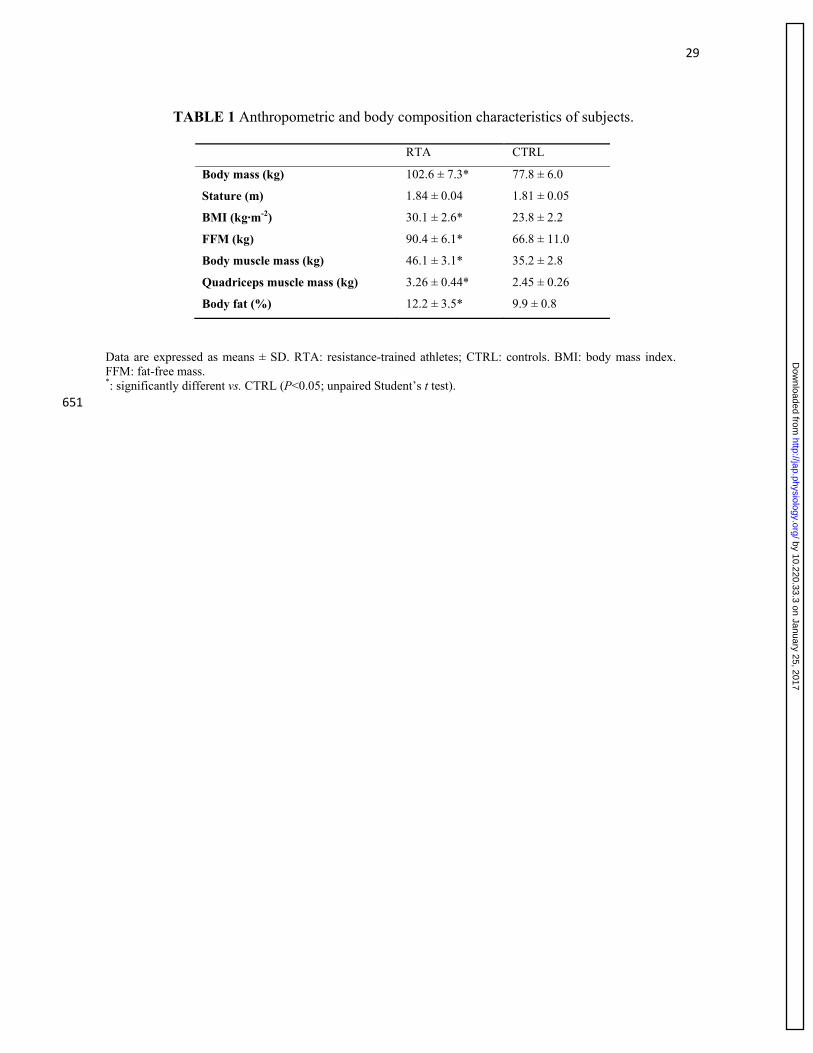
BMI, fat-free mass, skeletal muscle mass, and quadriceps muscle mass are reported in Table 1. 273
by 10.220.33.3 on January 25, 2017http://jap.physiology.org/
Dow
nloaded from
12
For all variables, values in RTA were significantly (by about 30%) greater in RTA vs. CTRL. 274
Also the percentage of body fat was slightly but significantly greater in RTA vs. CTRL. 275
The mean force exerted by the knee extensors during MVC was significantly higher (by 18%; 276
P=0.026) in RTA (998 ± 163 N) vs. CTRL (811 ± 188 N). Once normalized per unit of CSA, 277
values did not differ between groups (7.9 ± 0.8 N·cm-2 in RTA vs. 8.7 ± 1.9 N·cm-2 in CTRL). 278
279
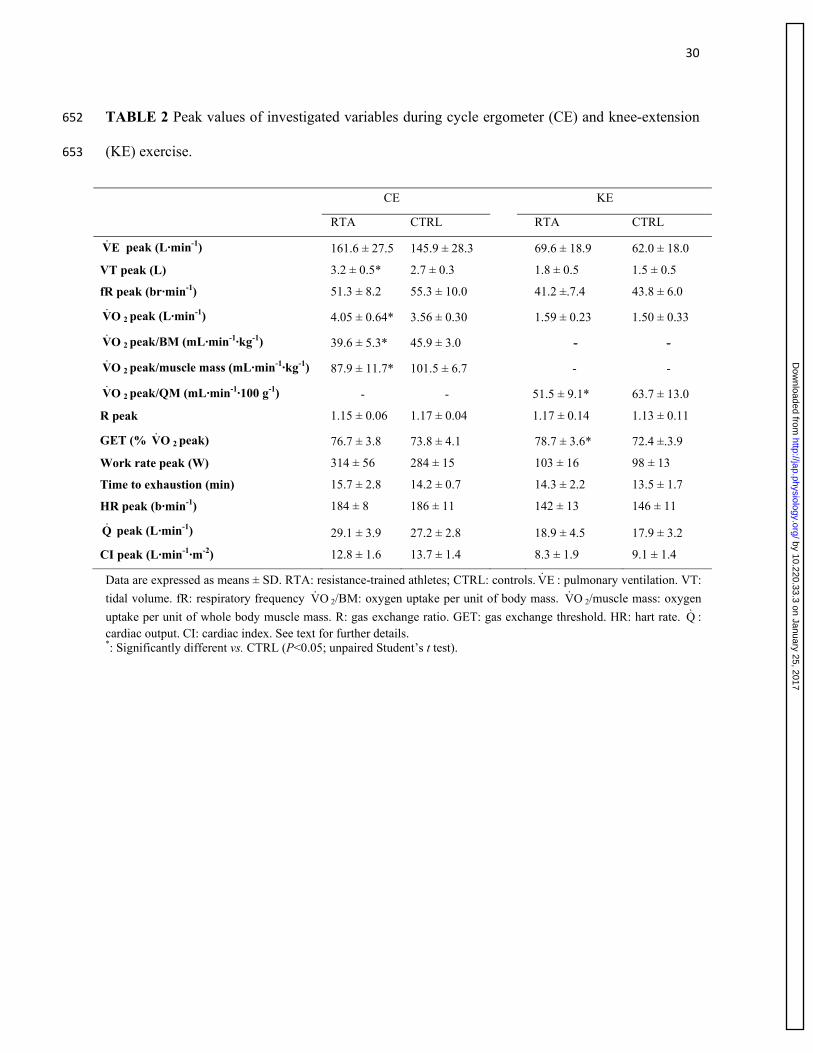
Peak values of the main ventilatory and gas-exchange variables determined at the limit of 280
tolerance during CE and KE are presented in Table 2. Ventilatory variables were not different in 281
the two groups, both during CE and KE, with the exception of a higher VT peak in RTA during 282
CE. When expressed in L·min-1, OV 2 peak was higher in RTA vs. CTRL during CE; no 283
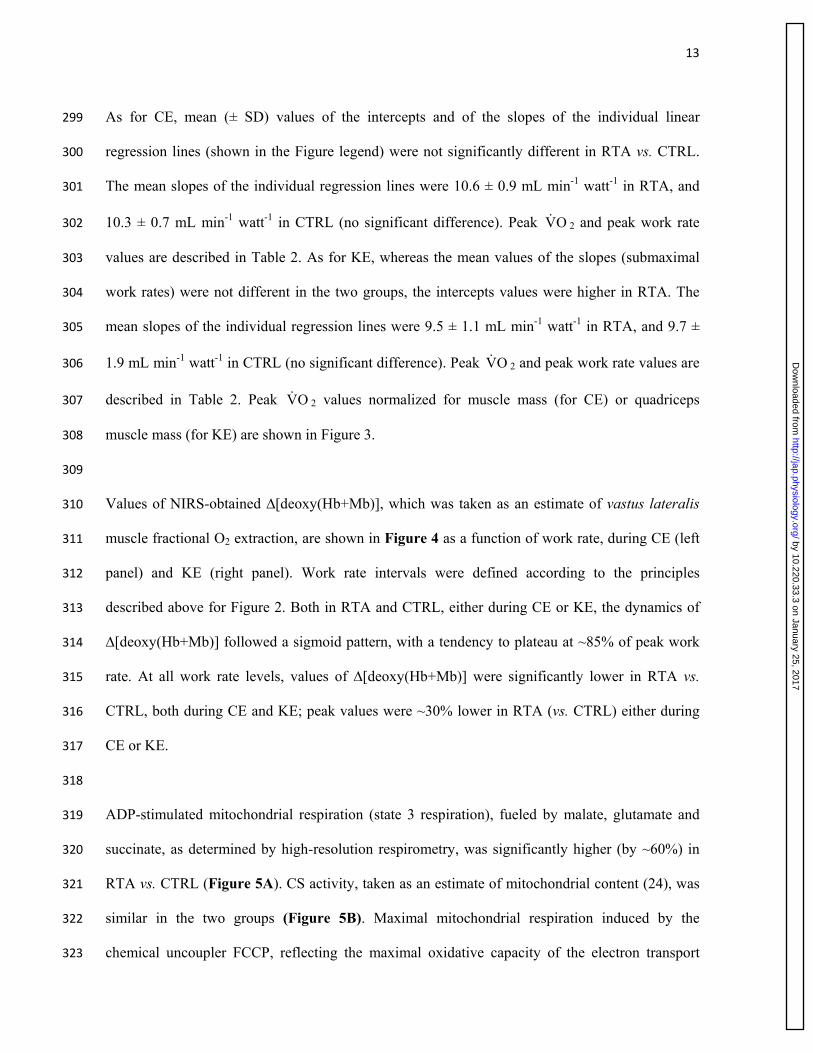
significant difference was observed during KE. When OV 2 peak was expressed per unit of body 284
mass or body muscle mass (for CE) and per unit of quadriceps muscle mass (for KE), values were 285
significantly lower (by ~15-20%) in RTA vs. CTRL. Peak work rate was slightly but not 286
significantly higher during CE in RTA vs. CTRL; time to exhaustion values were not different in 287
the two groups, either during CE or KE. R peak values were higher than 1.1 in both groups during 288
both types of exercise. Peak values of HR, Q and CI were similar between RTA and CTRL, either 289
during KE or during CE (Table 2). As expected, in both groups peak values of cardiovascular 290
variables obtained in KE were significantly lower than in CE. 291
292
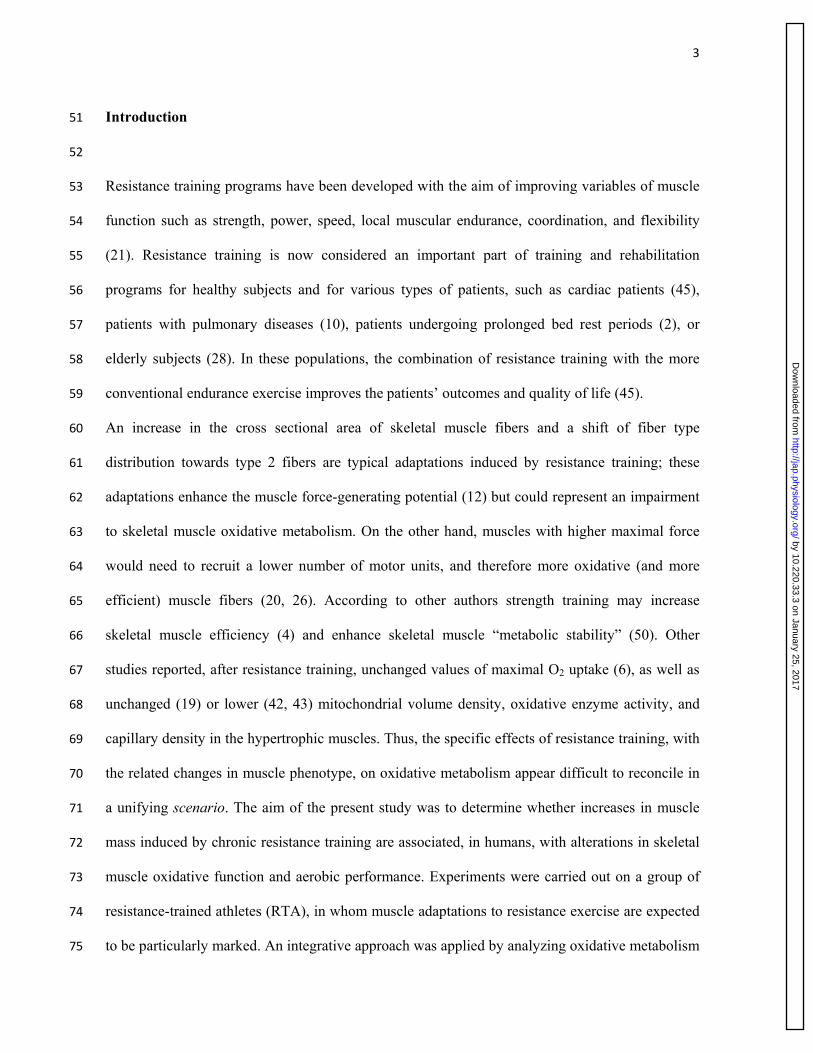
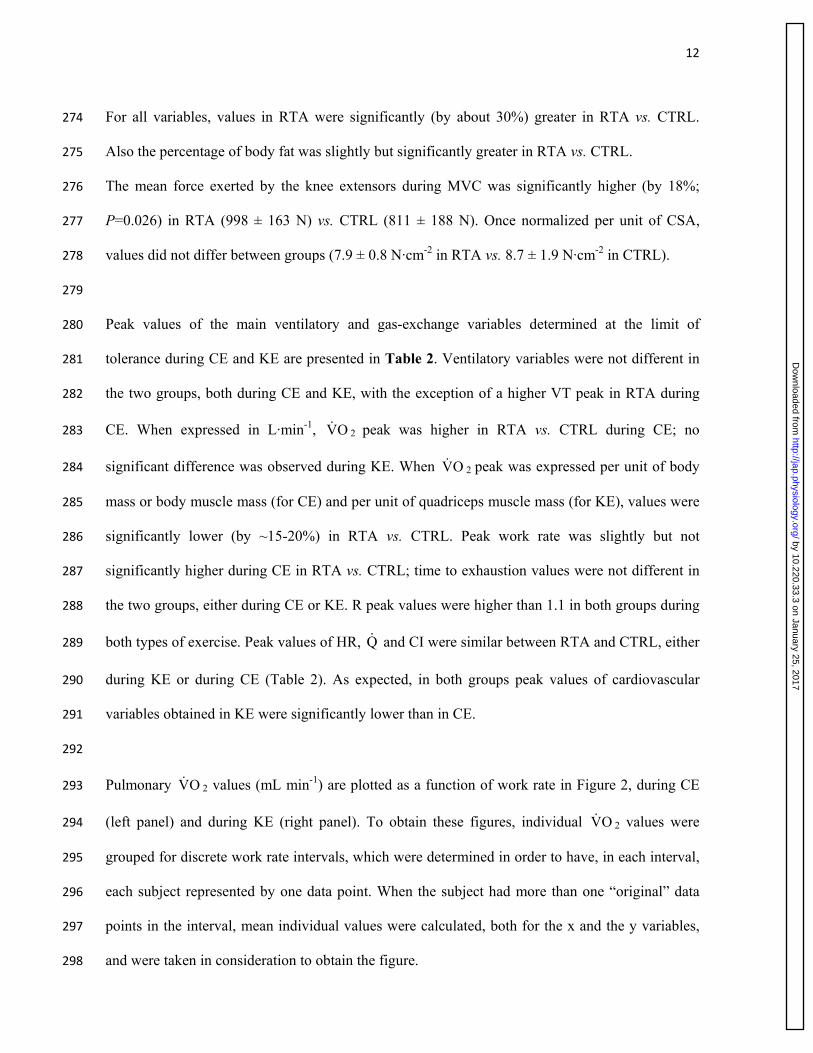
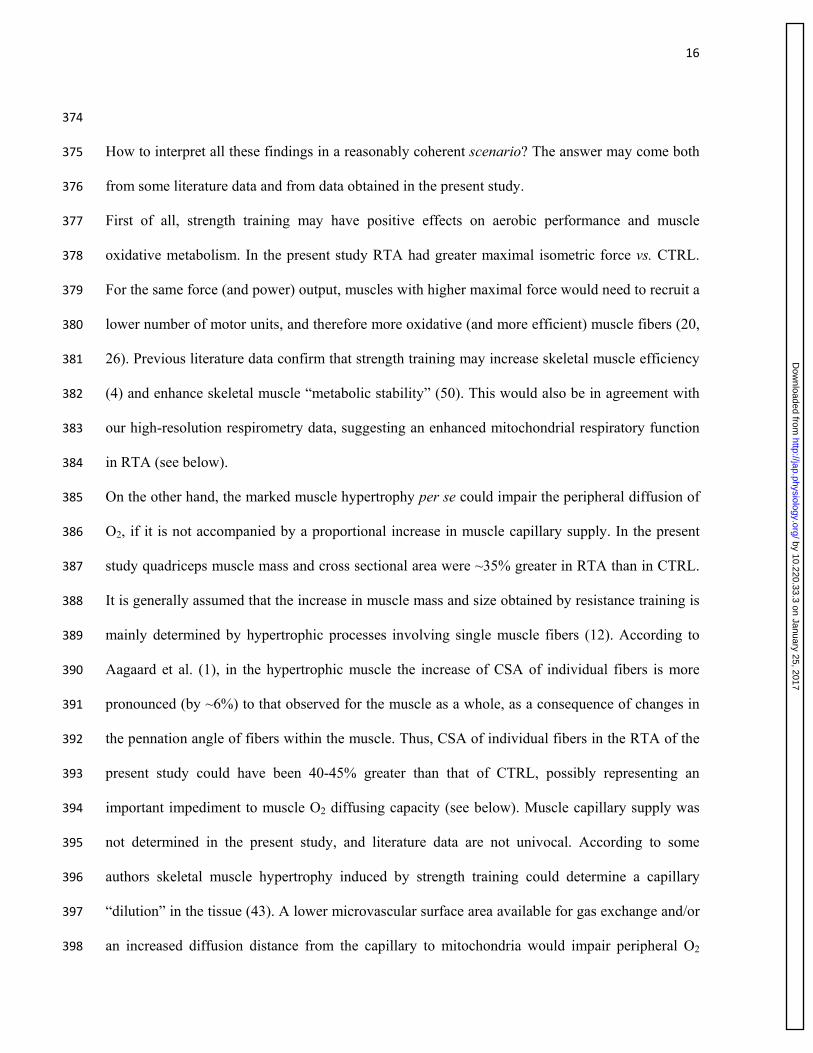
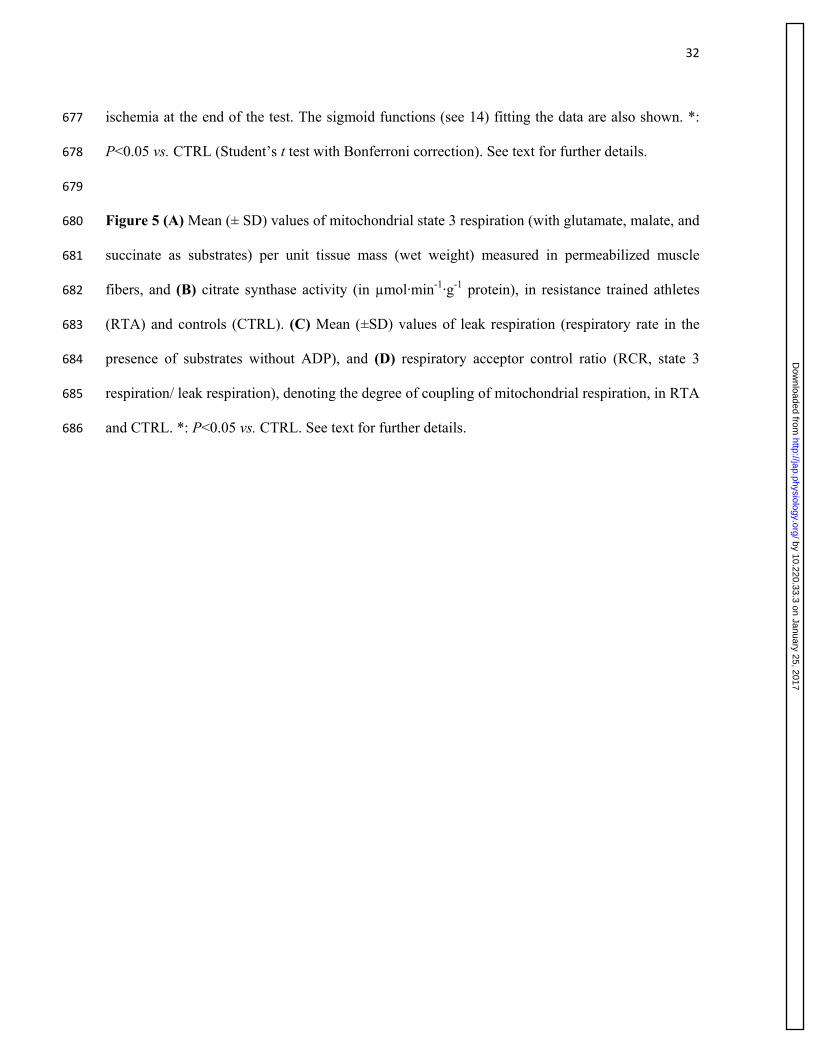
Pulmonary OV 2 values (mL min-1) are plotted as a function of work rate in Figure 2, during CE 293
(left panel) and during KE (right panel). To obtain these figures, individual OV 2 values were 294
grouped for discrete work rate intervals, which were determined in order to have, in each interval, 295
each subject represented by one data point. When the subject had more than one “original” data 296
points in the interval, mean individual values were calculated, both for the x and the y variables, 297
and were taken in consideration to obtain the figure. 298
by 10.220.33.3 on January 25, 2017http://jap.physiology.org/
Dow
nloaded from
13
As for CE, mean (± SD) values of the intercepts and of the slopes of the individual linear 299
regression lines (shown in the Figure legend) were not significantly different in RTA vs. CTRL. 300
The mean slopes of the individual regression lines were 10.6 ± 0.9 mL min-1 watt-1 in RTA, and 301
10.3 ± 0.7 mL min-1 watt-1 in CTRL (no significant difference). Peak OV 2 and peak work rate 302
values are described in Table 2. As for KE, whereas the mean values of the slopes (submaximal 303
work rates) were not different in the two groups, the intercepts values were higher in RTA. The 304
mean slopes of the individual regression lines were 9.5 ± 1.1 mL min-1 watt-1 in RTA, and 9.7 ± 305
1.9 mL min-1 watt-1 in CTRL (no significant difference). Peak OV 2 and peak work rate values are 306
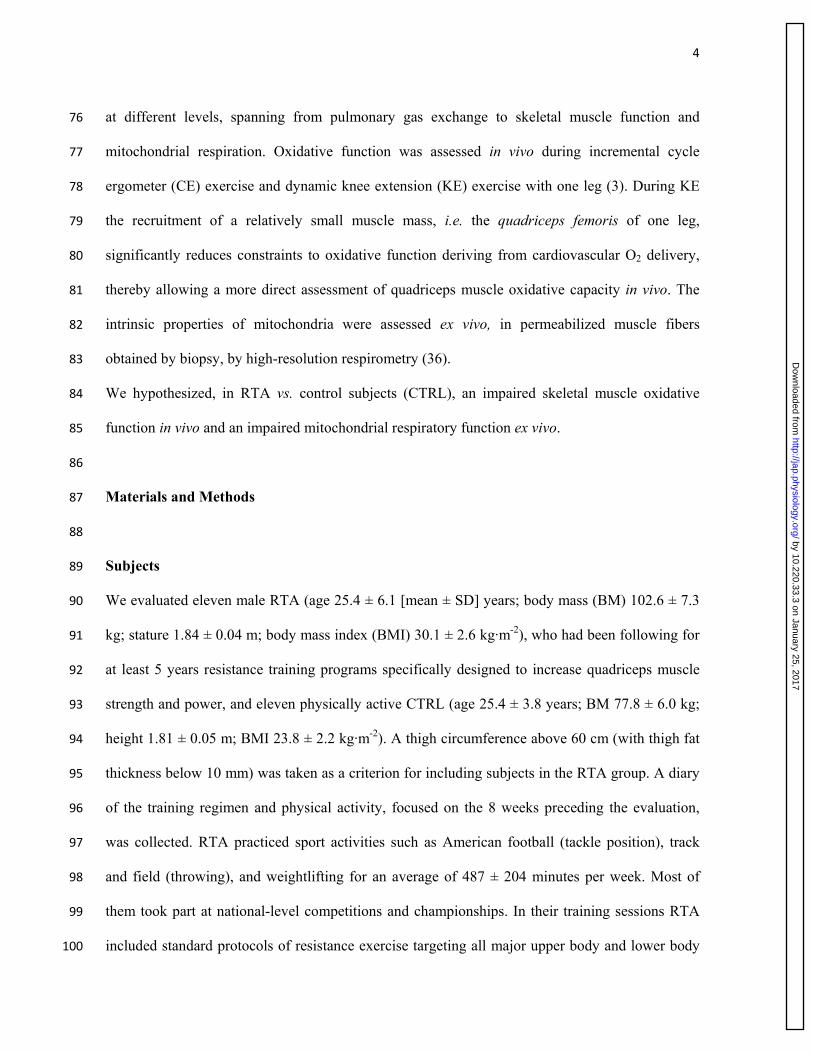
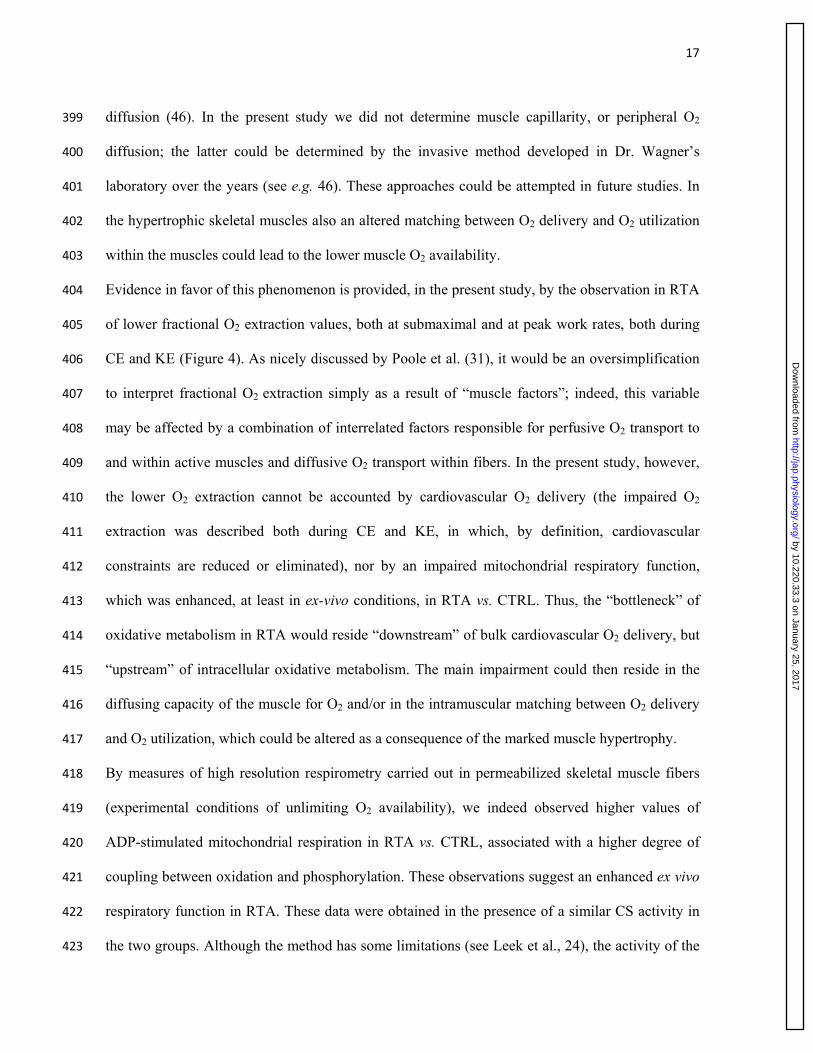
described in Table 2. Peak OV 2 values normalized for muscle mass (for CE) or quadriceps 307
muscle mass (for KE) are shown in Figure 3. 308
309
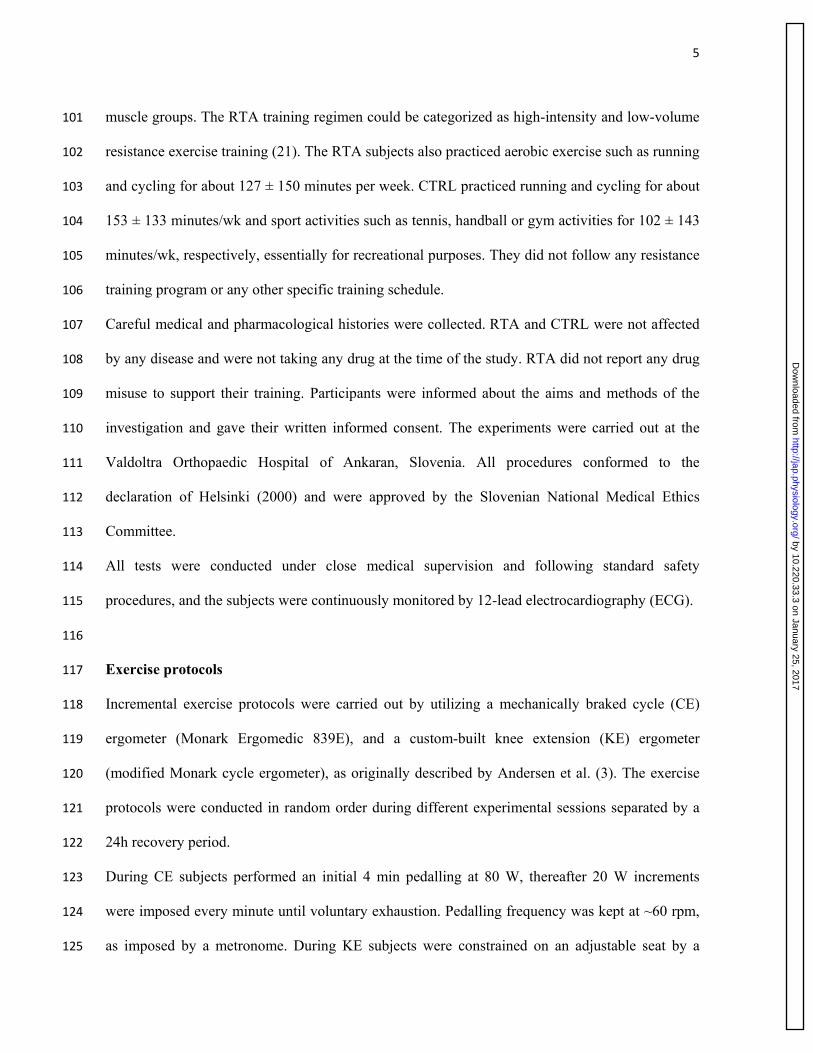
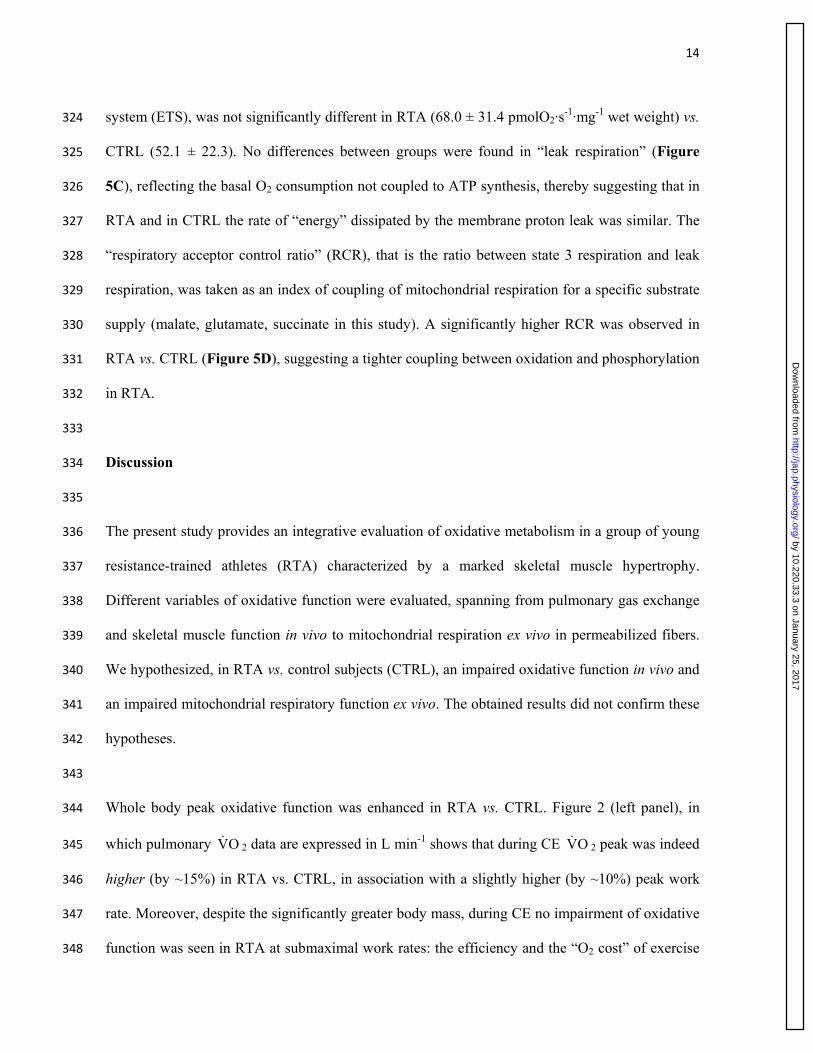
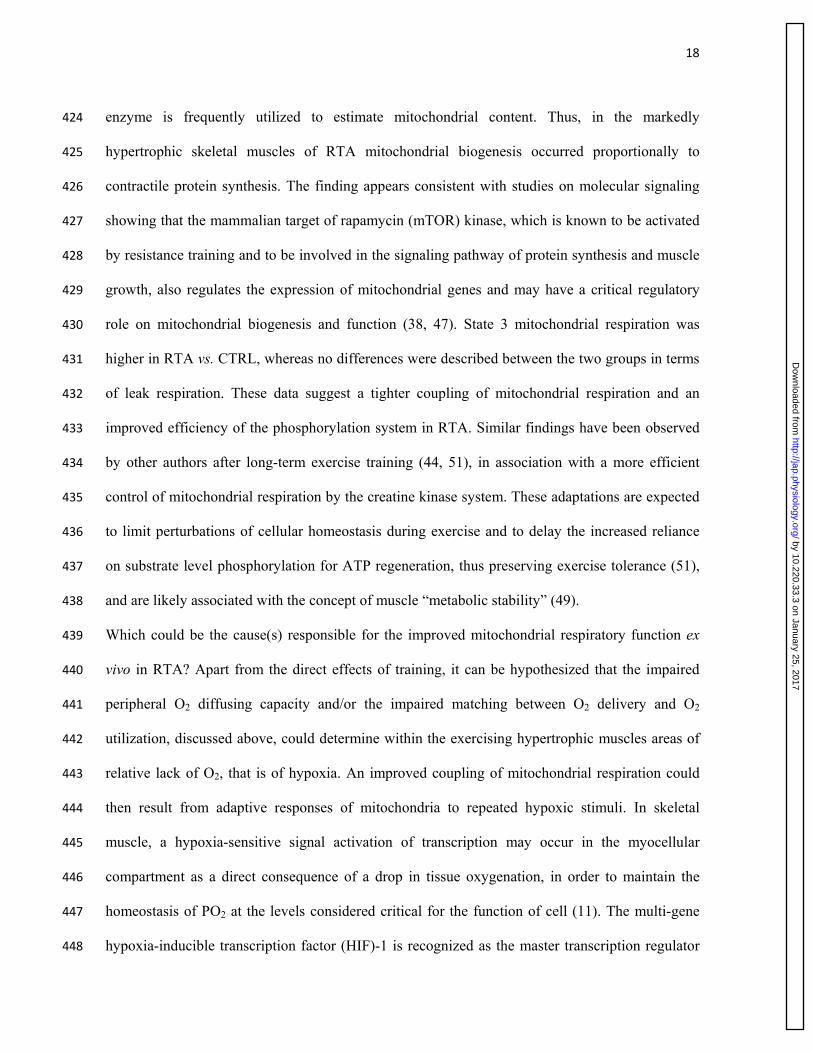
Values of NIRS-obtained ∆[deoxy(Hb+Mb)], which was taken as an estimate of vastus lateralis 310
muscle fractional O2 extraction, are shown in Figure 4 as a function of work rate, during CE (left 311
panel) and KE (right panel). Work rate intervals were defined according to the principles 312
described above for Figure 2. Both in RTA and CTRL, either during CE or KE, the dynamics of 313
∆[deoxy(Hb+Mb)] followed a sigmoid pattern, with a tendency to plateau at ~85% of peak work 314
rate. At all work rate levels, values of ∆[deoxy(Hb+Mb)] were significantly lower in RTA vs. 315
CTRL, both during CE and KE; peak values were ~30% lower in RTA (vs. CTRL) either during 316
CE or KE. 317
318
ADP-stimulated mitochondrial respiration (state 3 respiration), fueled by malate, glutamate and 319
succinate, as determined by high-resolution respirometry, was significantly higher (by ~60%) in 320
RTA vs. CTRL (Figure 5A). CS activity, taken as an estimate of mitochondrial content (24), was 321
similar in the two groups (Figure 5B). Maximal mitochondrial respiration induced by the 322
chemical uncoupler FCCP, reflecting the maximal oxidative capacity of the electron transport 323
by 10.220.33.3 on January 25, 2017http://jap.physiology.org/
Dow
nloaded from
14
system (ETS), was not significantly different in RTA (68.0 ± 31.4 pmolO2·s-1·mg-1 wet weight) vs. 324
CTRL (52.1 ± 22.3). No differences between groups were found in “leak respiration” (Figure 325
5C), reflecting the basal O2 consumption not coupled to ATP synthesis, thereby suggesting that in 326
RTA and in CTRL the rate of “energy” dissipated by the membrane proton leak was similar. The 327
“respiratory acceptor control ratio” (RCR), that is the ratio between state 3 respiration and leak 328
respiration, was taken as an index of coupling of mitochondrial respiration for a specific substrate 329
supply (malate, glutamate, succinate in this study). A significantly higher RCR was observed in 330
RTA vs. CTRL (Figure 5D), suggesting a tighter coupling between oxidation and phosphorylation 331
in RTA. 332
333
Discussion 334
335
The present study provides an integrative evaluation of oxidative metabolism in a group of young 336
resistance-trained athletes (RTA) characterized by a marked skeletal muscle hypertrophy. 337
Different variables of oxidative function were evaluated, spanning from pulmonary gas exchange 338
and skeletal muscle function in vivo to mitochondrial respiration ex vivo in permeabilized fibers. 339
We hypothesized, in RTA vs. control subjects (CTRL), an impaired oxidative function in vivo and 340
an impaired mitochondrial respiratory function ex vivo. The obtained results did not confirm these 341
hypotheses. 342
343
Whole body peak oxidative function was enhanced in RTA vs. CTRL. Figure 2 (left panel), in 344
which pulmonary OV 2 data are expressed in L min-1 shows that during CE OV 2 peak was indeed 345
higher (by ~15%) in RTA vs. CTRL, in association with a slightly higher (by ~10%) peak work 346
rate. Moreover, despite the significantly greater body mass, during CE no impairment of oxidative 347
function was seen in RTA at submaximal work rates: the efficiency and the “O2 cost” of exercise 348
by 10.220.33.3 on January 25, 2017http://jap.physiology.org/
Dow
nloaded from
15
(as indicated by the slopes and the intercepts of the OV 2 vs. work rate relationships) were indeed 349
the same in the two groups. This finding is of interest, also in comparison to what is usually seen 350
in another population characterized by a significantly greater body mass, such as obese patients, in 351
which the OV 2 vs. work rate relationship is shifted upward compared to that seen in normal 352
controls (22), indicating a higher O2 cost of CE exercise deriving from the excess in body mass. 353
The situation was in part different for KE (right panel of Figure 2): the slopes of the OV 2 vs. 354
submaximal work rates relationships were again similar in the two groups, but the intercept was 355
higher in RTA (suggesting a higher O2 cost for KE exercise), and OV 2 peak and peak work rate 356
values were only slightly higher in RTA. No clear-cut explanation can be given for the higher O2 357
cost of exercise observed in RTA during KE, but not during CE. Cardiovascular constraints cannot 358
be hypothesized, since they were by definition much lower in KE vs. CE. It can be hypothesized 359
that the work of accessory muscles (see Richardson et al., 34) during KE was overall higher in 360
RTA vs. CTRL. We indeed measured pulmonary OV 2 and not OV 2 across the leg, and as a 361
consequence of this we cannot discriminate between OV 2 attributable to the legs and OV 2 362
attributable to the rest of the body. 363
364
On the other hand, after we normalized OV 2 peak per whole body muscle mass (for CE) or 365
quadriceps muscle mass (for KE) values were significantly lower (by ~15-20%) in RTA vs. CTRL 366
(see Figure 3). This finding could be interpreted from two different perspectives: despite a lower 367
OV 2 peak per unit muscle mass, RTA reached slightly higher (during CE) or similar (during KE) 368
peak work rate levels than CTRL, suggesting a higher muscle/metabolic efficiency (see below). 369
On the other hand, it should also be recognized that OV 2 peak/ muscle mass was substantially 370
lower in RTA, suggesting a substantial impairment of peak oxidative function in vivo when 371
normalized for the markedly greater muscle mass. Or, to put it in other words, in RTA (vs. CTRL) 372
the increase in muscle mass was more pronounced than the increase in maximal oxidative power. 373
by 10.220.33.3 on January 25, 2017http://jap.physiology.org/
Dow
nloaded from
16
374
How to interpret all these findings in a reasonably coherent scenario? The answer may come both 375
from some literature data and from data obtained in the present study. 376
First of all, strength training may have positive effects on aerobic performance and muscle 377
oxidative metabolism. In the present study RTA had greater maximal isometric force vs. CTRL. 378
For the same force (and power) output, muscles with higher maximal force would need to recruit a 379
lower number of motor units, and therefore more oxidative (and more efficient) muscle fibers (20, 380
26). Previous literature data confirm that strength training may increase skeletal muscle efficiency 381
(4) and enhance skeletal muscle “metabolic stability” (50). This would also be in agreement with 382
our high-resolution respirometry data, suggesting an enhanced mitochondrial respiratory function 383
in RTA (see below). 384
On the other hand, the marked muscle hypertrophy per se could impair the peripheral diffusion of 385
O2, if it is not accompanied by a proportional increase in muscle capillary supply. In the present 386
study quadriceps muscle mass and cross sectional area were ~35% greater in RTA than in CTRL. 387
It is generally assumed that the increase in muscle mass and size obtained by resistance training is 388
mainly determined by hypertrophic processes involving single muscle fibers (12). According to 389
Aagaard et al. (1), in the hypertrophic muscle the increase of CSA of individual fibers is more 390
pronounced (by ~6%) to that observed for the muscle as a whole, as a consequence of changes in 391
the pennation angle of fibers within the muscle. Thus, CSA of individual fibers in the RTA of the 392
present study could have been 40-45% greater than that of CTRL, possibly representing an 393
important impediment to muscle O2 diffusing capacity (see below). Muscle capillary supply was 394
not determined in the present study, and literature data are not univocal. According to some 395
authors skeletal muscle hypertrophy induced by strength training could determine a capillary 396
“dilution” in the tissue (43). A lower microvascular surface area available for gas exchange and/or 397
an increased diffusion distance from the capillary to mitochondria would impair peripheral O2 398
by 10.220.33.3 on January 25, 2017http://jap.physiology.org/
Dow
nloaded from
17
diffusion (46). In the present study we did not determine muscle capillarity, or peripheral O2 399
diffusion; the latter could be determined by the invasive method developed in Dr. Wagner’s 400
laboratory over the years (see e.g. 46). These approaches could be attempted in future studies. In 401
the hypertrophic skeletal muscles also an altered matching between O2 delivery and O2 utilization 402
within the muscles could lead to the lower muscle O2 availability. 403
Evidence in favor of this phenomenon is provided, in the present study, by the observation in RTA 404
of lower fractional O2 extraction values, both at submaximal and at peak work rates, both during 405
CE and KE (Figure 4). As nicely discussed by Poole et al. (31), it would be an oversimplification 406
to interpret fractional O2 extraction simply as a result of “muscle factors”; indeed, this variable 407
may be affected by a combination of interrelated factors responsible for perfusive O2 transport to 408
and within active muscles and diffusive O2 transport within fibers. In the present study, however, 409
the lower O2 extraction cannot be accounted by cardiovascular O2 delivery (the impaired O2 410
extraction was described both during CE and KE, in which, by definition, cardiovascular 411
constraints are reduced or eliminated), nor by an impaired mitochondrial respiratory function, 412
which was enhanced, at least in ex-vivo conditions, in RTA vs. CTRL. Thus, the “bottleneck” of 413
oxidative metabolism in RTA would reside “downstream” of bulk cardiovascular O2 delivery, but 414
“upstream” of intracellular oxidative metabolism. The main impairment could then reside in the 415
diffusing capacity of the muscle for O2 and/or in the intramuscular matching between O2 delivery 416
and O2 utilization, which could be altered as a consequence of the marked muscle hypertrophy. 417
By measures of high resolution respirometry carried out in permeabilized skeletal muscle fibers 418
(experimental conditions of unlimiting O2 availability), we indeed observed higher values of 419
ADP-stimulated mitochondrial respiration in RTA vs. CTRL, associated with a higher degree of 420
coupling between oxidation and phosphorylation. These observations suggest an enhanced ex vivo 421
respiratory function in RTA. These data were obtained in the presence of a similar CS activity in 422
the two groups. Although the method has some limitations (see Leek et al., 24), the activity of the 423
by 10.220.33.3 on January 25, 2017http://jap.physiology.org/
Dow
nloaded from
18
enzyme is frequently utilized to estimate mitochondrial content. Thus, in the markedly 424
hypertrophic skeletal muscles of RTA mitochondrial biogenesis occurred proportionally to 425
contractile protein synthesis. The finding appears consistent with studies on molecular signaling 426
showing that the mammalian target of rapamycin (mTOR) kinase, which is known to be activated 427
by resistance training and to be involved in the signaling pathway of protein synthesis and muscle 428
growth, also regulates the expression of mitochondrial genes and may have a critical regulatory 429
role on mitochondrial biogenesis and function (38, 47). State 3 mitochondrial respiration was 430
higher in RTA vs. CTRL, whereas no differences were described between the two groups in terms 431
of leak respiration. These data suggest a tighter coupling of mitochondrial respiration and an 432
improved efficiency of the phosphorylation system in RTA. Similar findings have been observed 433
by other authors after long-term exercise training (44, 51), in association with a more efficient 434
control of mitochondrial respiration by the creatine kinase system. These adaptations are expected 435
to limit perturbations of cellular homeostasis during exercise and to delay the increased reliance 436
on substrate level phosphorylation for ATP regeneration, thus preserving exercise tolerance (51), 437
and are likely associated with the concept of muscle “metabolic stability” (49). 438
Which could be the cause(s) responsible for the improved mitochondrial respiratory function ex 439
vivo in RTA? Apart from the direct effects of training, it can be hypothesized that the impaired 440
peripheral O2 diffusing capacity and/or the impaired matching between O2 delivery and O2 441
utilization, discussed above, could determine within the exercising hypertrophic muscles areas of 442
relative lack of O2, that is of hypoxia. An improved coupling of mitochondrial respiration could 443
then result from adaptive responses of mitochondria to repeated hypoxic stimuli. In skeletal 444
muscle, a hypoxia-sensitive signal activation of transcription may occur in the myocellular 445
compartment as a direct consequence of a drop in tissue oxygenation, in order to maintain the 446
homeostasis of PO2 at the levels considered critical for the function of cell (11). The multi-gene 447
hypoxia-inducible transcription factor (HIF)-1 is recognized as the master transcription regulator 448
by 10.220.33.3 on January 25, 2017http://jap.physiology.org/
Dow
nloaded from
19
of cell hypoxic signaling (39). HIF-1 drives the expression of a variety of genes involved in 449
mitochondrial metabolism in skeletal muscle under hypoxic exposure, among which those 450
controlling the efficiency of cytochrome c oxidase enzyme (COX) in the mitochondrial respiratory 451
chain. HIF-1 would coordinate a switch from COX4-1 subunit to COX4-2, thereby increasing the 452
efficiency of electron transfer to O2 at complex IV, and minimizing electron leakage at complexes 453
I and III. This switch would also enhance the efficiency of ATP synthesis, by increasing proton 454
pumping into the mitochondrial intermembrane space (16). By this way, electron transfer and 455
phosphorylation would result more tightly coupled, and the efficiency of oxidative 456
phosphorylation improved. 457
458
Methodological considerations 459
In the present study the values of ADP-stimulated mitochondrial respiration and maximal 460
uncoupled respiration were in the low-end of values for healthy subject’s quadriceps muscle. A 461
wide range of values for mitochondrial respiratory capacity can be found in the literature (17). 462
This could be attributable to the investigated population, to intrinsic metabolic characteristics of 463
tissue samples, and to methodological procedures, such as titration protocol, sequence and 464
combination of administered substrates, [ADP], experimental temperature, wet or dry state of 465
tissue mass utilized for normalization, fresh or frozen tissue samples, etc (17). In any case, the 466
data obtained in the present study are similar to those obtained, after following substantially the 467
same protocol of the present study, in the healthy control subjects of recent studies (9, 23, 30). In 468
the present study, after adding cytochrome c to the measuring chamber, the increase in 469
mitochondrial respiration was very small (~2%). A small increase in respiration after adding 470
cytochrome c is a standard criterion to check the absence of a significant damage of the outer 471
mitochondrial membrane, possibly occurring during the preparation of samples. 472
by 10.220.33.3 on January 25, 2017http://jap.physiology.org/
Dow
nloaded from
20
At first sight a comparison of OV 2 between the two groups at submaximal work rates may not be 473
warranted since the two groups presumably have different OV 2 kinetics (slower in the resistance-474
trained athletes), and as a consequence different rates of adjustment to the work rate increments. 475
However, as elegantly discussed in the recent review by Rossiter (35), during a standard 476
incremental test different time-constants of the OV 2 kinetics do not affect the slope of the OV 2 477
vs. work rate relationship, but only shift the linear relationship to the right (in case of a slower 478
OV 2 kinetics) or to the left (in case of a faster OV 2 kinetics), the “horizontal distance” between 479
these linear relationships being reflected by the difference in time-constants. We did not determine 480
the OV 2 kinetics in the two groups of subjects of our study. However, if we assume a slower 481
OV 2 kinetics in the strength-trained group, imagine a difference in time-constants of 15 seconds 482
(this is likely an exaggeration, considering that both groups had a common endurance training 483
background), and assume the same gain in the two groups (as actually observed in this study), the 484
small horizontal shifts of the OV 2 vs. work rate relationships do not change data interpretation: 485
same slopes and intercepts between the two groups during CE, same slopes but higher intercepts 486
in RTA during KE, suggesting a slightly higher O2 cost of KE exercise in this group. 487
488
Conclusions 489
In a group of young resistance-trained athletes characterized by a marked skeletal muscle 490
hypertrophy, the greater muscle mass and maximal force, and the enhanced mitochondrial 491
respiratory function seem to compensate for the hypertrophy-induced impaired peripheral O2 492
diffusion. The net results are an enhanced whole body oxidative function at peak exercise, and 493
unchanged efficiency and O2 cost at submaximal exercise, despite the much greater muscle mass 494
and body mass. 495
496
497
by 10.220.33.3 on January 25, 2017http://jap.physiology.org/
Dow
nloaded from
21
References 498
499
1. Aagaard P, Andersen JL, Dyhre-Poulsen P, Leffers AM, Wagner A, Magnusson SP, 500
Halkjaer-Kristensen J, Simonsen EB. A mechanism for increased contractile strength of 501
human pennate muscle in response to strength training: changes in muscle architecture. J 502
Physiol 534: 613-623, 2001. 503
2. Alkner BA, Tesch PA. Knee extensor and plantar flexor muscle size and function following 504
90 days of bed rest with or without resistance exercise. Eur J Appl Physiol 93: 294–305, 505
2004. 506
3. Andersen P, Adams RP, Sjøgaard G, Thorboe A, Saltin B. Dynamic knee extension as 507
model for study of isolated exercising muscle in humans. J Appl Physiol 59: 1647-53, 1985. 508
4. Barrett-O'Keefe Z, Helgerud J, Wagner PD, Richardson RS. Maximal strength training 509
and increased work efficiency: contribution from the trained muscle bed. J Appl Physiol 113: 510
1846–1851, 2012. 511
5. Beaver WL, Wasserman K, Whipp BJ. A new method for detecting anaerobic threshold by 512
gas exchange. J Appl Physiol 60: 2020-2027, 1986. 513
6. Bishop D, Jenkins DG, Mackinnon LT, McEniery M, Carey MF. The effects of strength 514
training on endurance performance and muscle characteristics. Med Sci Sports Exerc 31: 886-515
891, 1999. 516
7. Boushel R, Langberg H, Olesen J, Gonzales-Alonso J, Bülow J, Kjær M. Monitoring 517
tissue oxygen availability with near infrared spectroscopy (NIRS) in health and disease. 518
Scand J Med Sci Sports 11: 213-222, 2001. 519
8. Bradford MM. Rapid and sensitive method for the quantitation of microgram quantities of 520
protein utilizing the principle of protein-dye binding. Anal Biochem 72: 248–254, 1976. 521
by 10.220.33.3 on January 25, 2017http://jap.physiology.org/
Dow
nloaded from
22
9. Brands M, Hoeks J, Sauerwein HP, Ackermans MT, Ouwens M, Lammers NM, van der 522
Plas MN, Schrauwen P, Groen AK, Serlie MJ. Short-term increase of plasma free fatty 523
acids does not interfere with intrinsic mitochondrial function in healthy young men. 524
Metabolism 60: 1398-1405, 2011. 525
10. Butcher SJ, Jones RL. The impact of exercise training intensity on change in physiological 526
function in patients with chronic obstructive pulmonary disease. Sports Med 36: 307-325, 527
2006. 528
11. Cerretelli P, Marzorati M, Marconi C. Muscle bioenergetics and metabolic control at 529
altitude. High Alt Med Biol 10: 165-174, 2009. 530
12. D'Antona G, Lanfranconi F, Pellegrino MA, Brocca L, Adami R, Rossi R, Moro G, 531
Miotti D, Canepari M, Bottinelli R. Skeletal muscle hypertrophy and structure and function 532
of skeletal muscle fibres in male body builders. J Physiol 570: 611-627, 2006. 533
13. Ferrari M, Mottola L, Quaresima V. Principles, techniques, and limitations of near-infrared 534
spectroscopy. Can J Appl Physiol 29: 463-487, 2004. 535
14. Ferreira LF, Koga S, Barstow TJ. Dynamics of noninvasively estimated microvascular O2 536
extraction during ramp exercise. J Appl Physiol 103: 1999-2004, 2007. 537
15. Ferreira LF, Poole DC, Barstow TJ. Muscle blood flow-O2 uptake interaction and their 538
relation to on-exercise dynamics of O2 exchange. Respir Physiol Neurobiol 147: 91–103, 539
2005. 540
16. Fukuda R, Zhang H, Kim JW, Shimoda L, Dang CV, Semenza GL. HIF-1 regulates 541
cytochrome oxidase subunits to optimize efficiency of respiration in hypoxic cells. Cell 129: 542
111-122, 2007. 543
17. Gnaiger E. Capacity of oxidative phosphorylation in human skeletal muscle. New 544
perspectives of mitochondrial physiology. Int J Biochem Cell Biol 41: 1837–1845, 2009. 545
by 10.220.33.3 on January 25, 2017http://jap.physiology.org/
Dow
nloaded from
23
18. Grassi B, Pogliaghi S, Rampichini S, Quaresima V, Ferrari M, Marconi C, Cerretelli P. 546
Muscle oxygenation and gas exchange kinetics during cycling exercise on-transition in 547
humans. J Appl Physiol 95: 149–158, 2003. 548
19. Green H, Goreham C, Ouyang J, Ball-Burnett M, Ranney D. Regulation of fiber size, 549
oxidative potential, and capillarization in human muscle by resistance exercise. Am J Physiol 550
276: R591-596, 1998. 551
20. Hickson RC, Rosenkoetter MA, Brown MM. Strength training effects on aerobic power 552
and short-term endurance. Med Sci Sports Exerc 12: 336-339, 1980. 553
21. Kraemer WJN, Ratamess A, French DN. Resistance training for health and performance. 554
Curr Sports Med Rep 1: 165–171, 2002. 555
22. Lafortuna CL, Proietti M, Agosti F, Sartorio A. The energy cost of cycling in young obese 556
women. Eur J Appl Physiol 97:16–25, 2006. 557
23. Larsen S, Rabøl R, Hansen CN, Madsbad S, Helge JW Dela F. Metformin-treated patients 558
with type 2 diabetes have normal mitochondrial complex I respiration. Diabetologia 55:443–559
449; 2012. 560
24. Leek BT, Mudaliar SR, Henry R, Mathieu-Costello O, Richardson RS. Effect of acute 561
exercise on citrate synthase activity in untrained and trained human skeletal muscle. Am J 562
Physiol Regul Integr Comp Physiol 280:R441–R447, 2001. 563
25. Lukaski HC, Bolonchuk WW, Hall CB, Siders WA. Validation of tetrapolar bioelectrical 564
measurements to assess human body composition. J Appl Physiol 60: 1327–1332, 1986. 565
26. Marcinik EJ, Potts J, Schlabach G, Will S, Dawson P, Hurley BF. Effects of strength 566
training on lactate threshold and endurance performance. Med Sci Sports Exerc 23: 739-743, 567
1991. 568
27. Mendez J, Keys A. Density and composition of mammalian muscle. Metabolism 9, 184–188, 569
1960. 570
by 10.220.33.3 on January 25, 2017http://jap.physiology.org/
Dow
nloaded from
24
28. Mian OS, Baltzopoulos V, Minetti AE, Narici MV. The impact of physical training on 571
locomotor function in older people. Sports Med 37: 683-701, 2007. 572
29. Pesta D, Gnaiger E. High-resolution respirometry. OXPHOS protocols for human cell 573
cultures and permeabilized fibers from small biopsies of human muscle. Methods Mol Biol 574
810: 25–58, 2012. 575
30. Phielix E, Meex R, Moonen-Kornips E, Hesselink MKC, Schrauwen P. Exercise training 576
increases mitochondrial content and ex vivo mitochondrial function similarly in patients with 577
type 2 diabetes and in control individuals. Diabetologia 53:1714–1721, 2010. 578
31. Poole DC, Hirai DM, Copp SW, Musch TI. Muscle oxygen transport and utilization in heart 579
failure: implications for exercise (in)tolerance. Am J Physiol Heart Circ Physiol 302: H1050-580
H1063, 2012. 581
32. Porcelli S, Marzorati M, Lanfranconi F, Vago P, Pišot R, Grassi B. Role of skeletal 582
muscles impairment and brain oxygenation in limiting oxidative metabolism during exercise 583
after bed rest. J Appl Physiol 109: 101-111, 2010. 584
33. Richard R, Lonsdorfer-Wolf E, Charloux A, Doutreleau S, Bucheit M, Oswald-585
Mammosser M, Lampert E, Mettauer B, Geny B, Lonsdorfer J. Non-invasive cardiac 586
output evaluation during a maximal progressive exercise test, using a new impedance 587
cardiograph device. Eur J Appl Physiol 85: 202-207, 2001. 588
34. Richardson RS, Poole DC, Knight DR, Kurdak SS, Hogan MC, Grassi B, Johnson EC, 589
Kendrick KF, Erickson BK, Wagner PD. High muscle blood flow in man: is maximal O2 590
extraction compromised? J Appl Physiol 75: 1911–1916, 1993. 591
35. Rossiter HB. Exercise: Kinetic Considerations for Gas Exchange. Compr Physiol 1: 203-244, 592
2011. 593
by 10.220.33.3 on January 25, 2017http://jap.physiology.org/
Dow
nloaded from
25
36. Saks VA, Veksler VI, Kuznetsov AV, Kay L, Sikk P, Tiivel T, Tranqui L, Olivares J, 594
Winkler K, Wiedemann F, Kunz WS. Permeabilized cell and skinned fiber techniques in 595
studies of mitochondrial function in vivo. Mol Cell Biochem 184: 81–100, 1998. 596
37. Salvadego D, Lazzer S, Marzorati M, Porcelli S, Rejc E, Simunic B, Pisot R, di 597
Prampero PE, Grassi B. Functional impairment of skeletal muscle oxidative metabolism 598
during knee extension exercise after bed rest. J Appl Physiol 111: 1719–1726, 2011. 599
38. Schieke SM, Phillips D, McCoy JP Jr, Aponte AM, Shen RF, Balaban RS, Finkel T. The 600
mammalian target of rapamycin (mTOR) pathway regulates mitochondrial oxygen 601
consumption and oxidative capacity. J Biol Chem 281: 27643-27652, 2006. 602
39. Semenza GL. Oxygen-dependent regulation of mitochondrial respiration by hypoxia-603
inducible factor 1. Biochem J 405: 1-9, 2007. 604
40. Srere PA. Citrate synthase. Methods Enzymol 13: 3-5, 1969. 605
41. Subudhi AW, Dimmen AC, Roach RC. Effects of acute hypoxia on cerebral and muscle 606
oxygenation during incremental exercise. J Appl Physiol 103: 177-183, 2007. 607
42. Tesch PA, Thorsson A, Esse´n-Gustavsson B. Enzyme activities of FT and ST muscle 608
fibers in heavy-resistance trained athletes. J Appl Physiol 67: 83–87, 1989. 609
43. Tesch PA, Thorsson A, Kaiser P. Muscle capillary supply and fiber type characteristics in 610
weight and power lifters. J Appl Physiol 56: 35–38, 1984. 611
44. Tonkonogi M, Walsh B, Svensson M, Sahlin K. Mitochondrial function and antioxidative 612
defence in human muscle: effects of endurance training and oxidative stress. 528: 379–388, 613
2000. 614
45. Volaklis KA, Tokmakidis SP. Resistance exercise training in patients with heart failure. 615
Sports Med 35: 1085-1103, 2005. 616
46. Wagner PD. Determinants of maximal oxygen transport and utilization. Annu Rev Physiol 617
58: 21–50, 1996. 618
by 10.220.33.3 on January 25, 2017http://jap.physiology.org/
Dow
nloaded from
26
47. Wang L, Mascher H, Psilander N, Blomstrand E, Sahlin K. Resistance exercise enhances 619
the molecular signaling of mitochondrial biogenesis induced by endurance exercise in human 620
skeletal muscle. J Appl Physiol 111: 1335-1344, 2011. 621
48. Wilson JR, Mancini DM, McCully K, Ferraro N, Lanoce V, Chance B. Noninvasive 622
detection of skeletal muscle underperfusion with near-infrared spectroscopy in patients with 623
heart failure. Circulation 80: 1668-1674, 1989. 624
49. Zoladz JA, Korzeniewski B, Grassi B. Training-induced acceleration of oxygen uptake 625
kinetics in skeletal muscle: the underlying mechanisms. J Physiol Pharmacol 57: 67-84, 626
2006. 627
50. Zoladz JA, Szkutnik Z, Majerczak J, Grandys M, Duda K, Grassi B Isometric strength 628
training lowers the O2 cost of cycling during moderate-intensity exercise. Eur J Appl Physiol 629
112: 4151-4161, 2012. 630
51. Zoll J, Sanchez H, N’Guessan B, Ribera F, Lampert E, Bigard X, Serrurier B, Fortin D, 631
Geny B, Veksler V, Ventura-Clapier R, Mettauer B. Physical activity changes the 632
regulation of mitochondrial respiration in human skeletal muscle. J Physiol 543: 191–200, 633
2002. 634
635
by 10.220.33.3 on January 25, 2017http://jap.physiology.org/
Dow
nloaded from
27
Author contributions 636
The experiments were carried out at the Valdoltra Hospital, Ankaran, Slovenia. B.G., S.L. 637
conceived the study and obtained the financial support. All authors contributed to the design of the 638
experiments. R.P., S.L. and B.S. were responsible for the recruitment of the subjects and for the 639
logistics of the study. Data were collected and analyzed by D.S., R.D., S.P., J.R, G.R. and B.S. 640
D.S. and B.G. interpreted the data and wrote the first draft of the manuscript. All authors 641
contributed to the critical revision of the manuscript and approved its final version. 642
643
by 10.220.33.3 on January 25, 2017http://jap.physiology.org/
Dow
nloaded from
28
Acknowledgments 644
The authors thank Prof. Pietro E. di Prampero and Dr. Jerzy A. Zoladz for constructive criticism, 645
and Drs. Enrico Rejc, Antonio Buglione, Mariasole Da Boit for technical collaboration during data 646
collection. The authors are also grateful to the subjects who enthusiastically participated in this 647
study. 648
Financial support by Agenzia Spaziale Italiana ASI-OSMA Contract I/007/06/0 (Workpackage 649
1B-32-1) and by Telethon – UILDM Grant GUP08007 is acknowledged. 650
by 10.220.33.3 on January 25, 2017http://jap.physiology.org/
Dow
nloaded from
29
TABLE 1 Anthropometric and body composition characteristics of subjects.
Data are expressed as means ± SD. RTA: resistance-trained athletes; CTRL: controls. BMI: body mass index. FFM: fat-free mass. *: significantly different vs. CTRL (P<0.05; unpaired Student’s t test).
651
RTA CTRL
Body mass (kg) 102.6 ± 7.3* 77.8 ± 6.0
Stature (m) 1.84 ± 0.04 1.81 ± 0.05
BMI (kg·m-2) 30.1 ± 2.6* 23.8 ± 2.2
FFM (kg) 90.4 ± 6.1* 66.8 ± 11.0
Body muscle mass (kg) 46.1 ± 3.1* 35.2 ± 2.8
Quadriceps muscle mass (kg) 3.26 ± 0.44* 2.45 ± 0.26
Body fat (%) 12.2 ± 3.5* 9.9 ± 0.8
by 10.220.33.3 on January 25, 2017http://jap.physiology.org/
Dow
nloaded from
30
TABLE 2 Peak values of investigated variables during cycle ergometer (CE) and knee-extension 652
(KE) exercise. 653
Data are expressed as means ± SD. RTA: resistance-trained athletes; CTRL: controls. EV : pulmonary ventilation. VT:
tidal volume. fR: respiratory frequency OV 2/BM: oxygen uptake per unit of body mass. OV 2/muscle mass: oxygen
uptake per unit of whole body muscle mass. R: gas exchange ratio. GET: gas exchange threshold. HR: hart rate. Q : cardiac output. CI: cardiac index. See text for further details. *: Significantly different vs. CTRL (P<0.05; unpaired Student’s t test).
CE KE
RTA CTRL RTA CTRL
EV peak (L·min-1) 161.6 ± 27.5 145.9 ± 28.3 69.6 ± 18.9 62.0 ± 18.0
VT peak (L) 3.2 ± 0.5* 2.7 ± 0.3 1.8 ± 0.5 1.5 ± 0.5
fR peak (br·min-1) 51.3 ± 8.2 55.3 ± 10.0 41.2 ±.7.4 43.8 ± 6.0
OV 2 peak (L·min-1) 4.05 ± 0.64* 3.56 ± 0.30 1.59 ± 0.23 1.50 ± 0.33
OV 2 peak/BM (mL·min-1·kg-1) 39.6 ± 5.3* 45.9 ± 3.0 - -
OV 2 peak/muscle mass (mL·min-1·kg-1) 87.9 ± 11.7* 101.5 ± 6.7 - -
OV 2 peak/QM (mL·min-1·100 g-1) - - 51.5 ± 9.1* 63.7 ± 13.0
R peak 1.15 ± 0.06 1.17 ± 0.04 1.17 ± 0.14 1.13 ± 0.11
GET (% OV 2 peak) 76.7 ± 3.8 73.8 ± 4.1 78.7 ± 3.6* 72.4 ±.3.9
Work rate peak (W) 314 ± 56 284 ± 15 103 ± 16 98 ± 13
Time to exhaustion (min) 15.7 ± 2.8 14.2 ± 0.7 14.3 ± 2.2 13.5 ± 1.7
HR peak (b·min-1) 184 ± 8 186 ± 11 142 ± 13 146 ± 11
Q peak (L·min-1) 29.1 ± 3.9 27.2 ± 2.8 18.9 ± 4.5 17.9 ± 3.2
CI peak (L·min-1·m-2) 12.8 ± 1.6 13.7 ± 1.4 8.3 ± 1.9 9.1 ± 1.4
by 10.220.33.3 on January 25, 2017http://jap.physiology.org/
Dow
nloaded from
31
Figure captions
Figure 1 (A) Anatomical cross-sectional area (CSA) of the quadriceps muscle, obtained by 654
magnetic resonance imaging at 50% femur length, and (B) quadriceps muscle volume in resistance 655
trained athletes (RTA) and control subjects (CTRL). Mean (± SD) values are shown. *: P<0.05 vs. 656
CTRL. See text for further details. 657
658
Figure 2 Mean (± SD) OV 2 values during CE (A) and KE (B) are plotted as a function of mean 659
(± SD) work rate (Watt) for resistance-trained athletes (RTA) and control subjects (CTRL). 660
Individual OV 2 values were grouped for discrete work rate intervals. As for CE, the mean (± SD) 661
values of the slopes of the individual regression lines were 10.6±0.9 mL min-1 watt-1 in RTA and 662
10.3±0.7 in CTRL (n.s.); the mean values of the intercepts were 652±96 mL min-1 in RTA and 663
613±83 in CTRL (n.s.). As for KE, the mean values of the slopes of the individual regression lines 664
(submaximal work rates) were 9.5±1.1 mL min-1 watt-1 in RTA and 9.7±1.9 in CTRL (n.s.); the 665
mean values of the intercepts were 545±71 mL min-1 in RTA and 421±81 in CTRL (P<0.05). *: 666
P<0.05 vs. CTRL. See text for further details. 667
668
Figure 3 Peak OV 2 values normalized for whole body muscle mass during CE (A) or quadriceps 669
muscle mass during KE (B), in resistance-trained athletes (RTA) vs. controls (CTRL). *: P<0.05 670
vs. CTRL. 671
672
Figure 4 Mean (± SD) values of the NIRS-obtained muscle deoxygenation index 673
(∆[deoxy(Hb+Mb)]), which estimates vastus lateralis fractional O2 extraction, as a function of 674
work rate, during CE (A), and KE (B), in resistance trained athletes (RTA) vs. controls (CTRL). 675
∆[deoxy(Hb+Mb)] data are expressed as a percentage of values obtained during a transient limb 676
by 10.220.33.3 on January 25, 2017http://jap.physiology.org/
Dow
nloaded from
32
ischemia at the end of the test. The sigmoid functions (see 14) fitting the data are also shown. *: 677
P<0.05 vs. CTRL (Student’s t test with Bonferroni correction). See text for further details. 678
679
Figure 5 (A) Mean (± SD) values of mitochondrial state 3 respiration (with glutamate, malate, and 680
succinate as substrates) per unit tissue mass (wet weight) measured in permeabilized muscle 681
fibers, and (B) citrate synthase activity (in µmol·min-1·g-1 protein), in resistance trained athletes 682
(RTA) and controls (CTRL). (C) Mean (±SD) values of leak respiration (respiratory rate in the 683
presence of substrates without ADP), and (D) respiratory acceptor control ratio (RCR, state 3 684
respiration/ leak respiration), denoting the degree of coupling of mitochondrial respiration, in RTA 685
and CTRL. *: P<0.05 vs. CTRL. See text for further details. 686
by 10.220.33.3 on January 25, 2017http://jap.physiology.org/
Dow
nloaded from
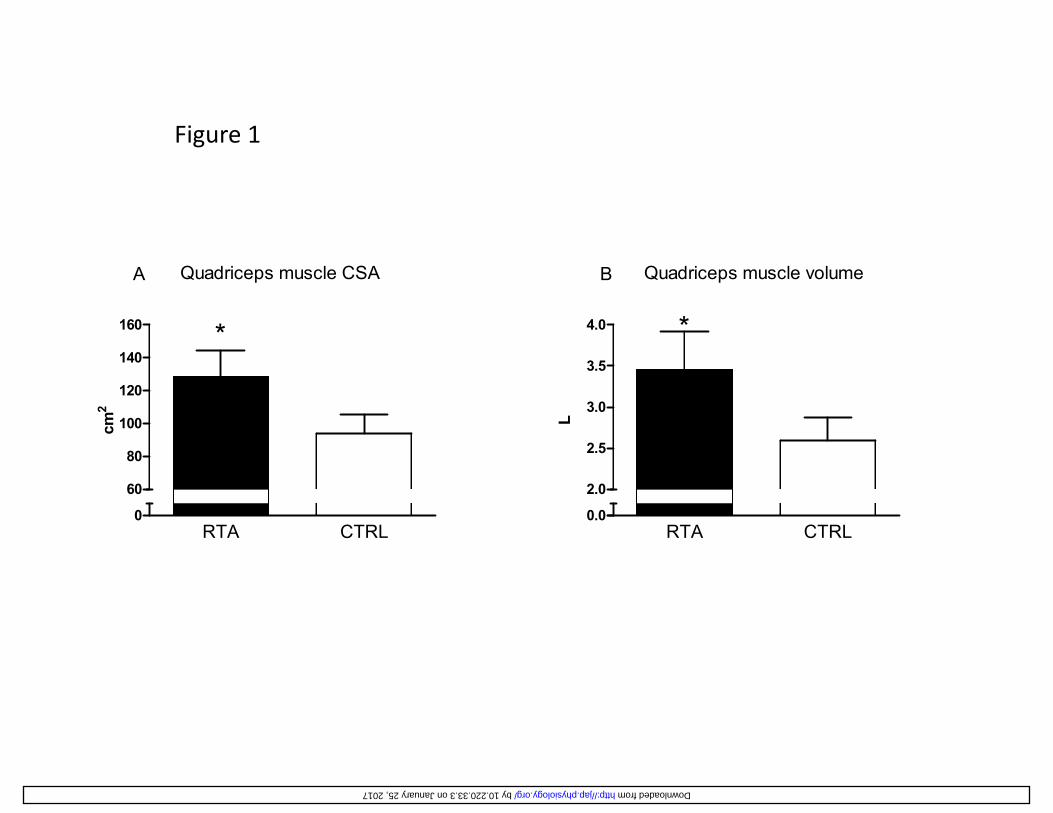
Figure 1
140
160
Quadriceps muscle CSA
*
A
4.0
Quadriceps muscle volume
*
B
80
100
120
140
cm2
2.5
3.0
3.5
L
RTA CTRL0
60
80
RTA CTRL0.0
2.0
by 10.220.33.3 on January 25, 2017 http://jap.physiology.org/ Downloaded from
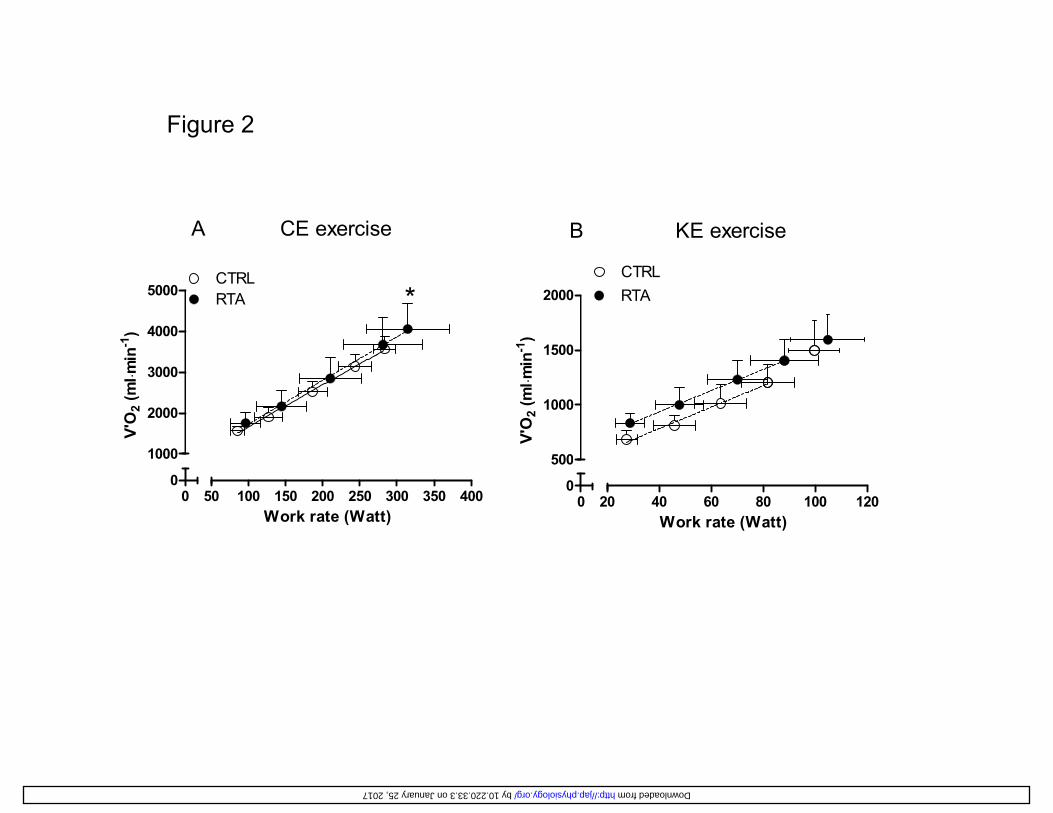
Figure 2
A CE exercise B KE exercise
4000
5000CTRLRTA
n-1)
*1500
2000CTRLRTA
n-1)
1000
2000
3000
V'O
2 (m
l ⋅min
500
1000
V'O
2 (m
l ⋅min
00
50 100 150 200 250 300 350 400
1000
Work rate (Watt)0
020 40 60 80 100 120
500
Work rate (Watt)
by 10.220.33.3 on January 25, 2017 http://jap.physiology.org/ Downloaded from
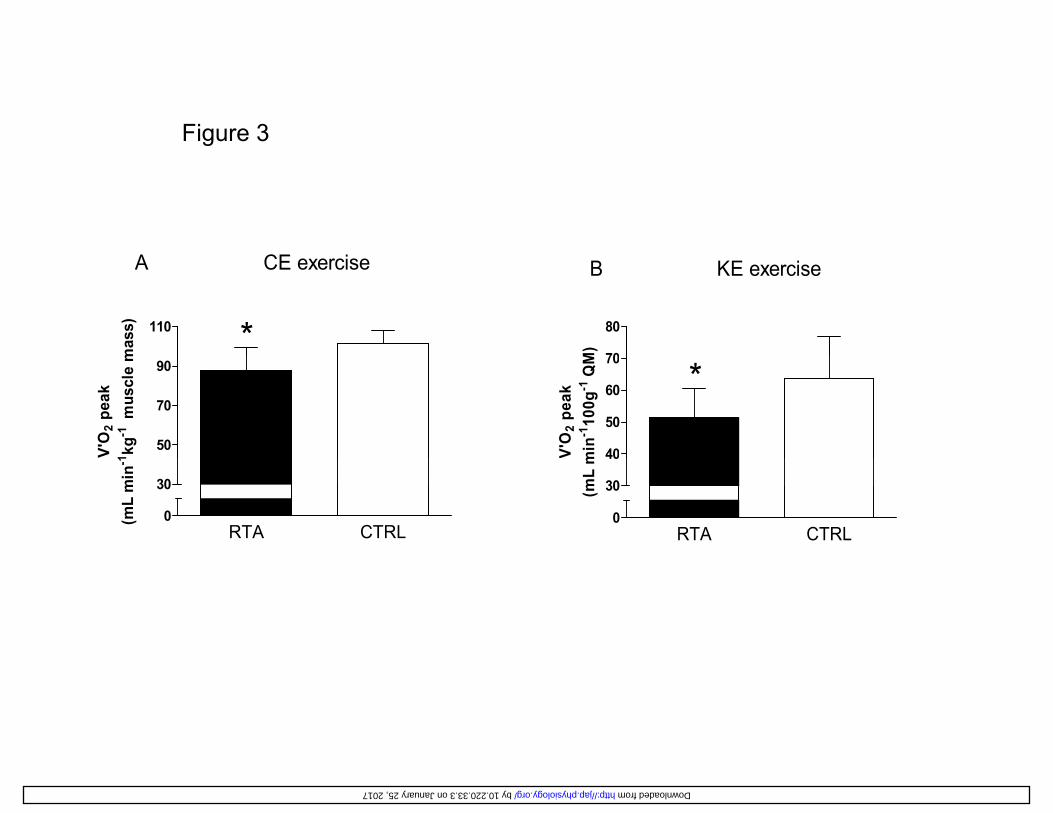
Figure 3
110 *
A CE exercise
mas
s)
70
80
B KE exercise
M)
50
70
90
V'O
2 pe
ak1 kg
-1m
uscl
e m
40
50
60
70
*
V'O
2 pe
akm
in-1
100g
-1Q
M
RTA CTRL0
30
(mL
min
-1
RTA CTRL0
30
40V(m
L m
by 10.220.33.3 on January 25, 2017 http://jap.physiology.org/ Downloaded from
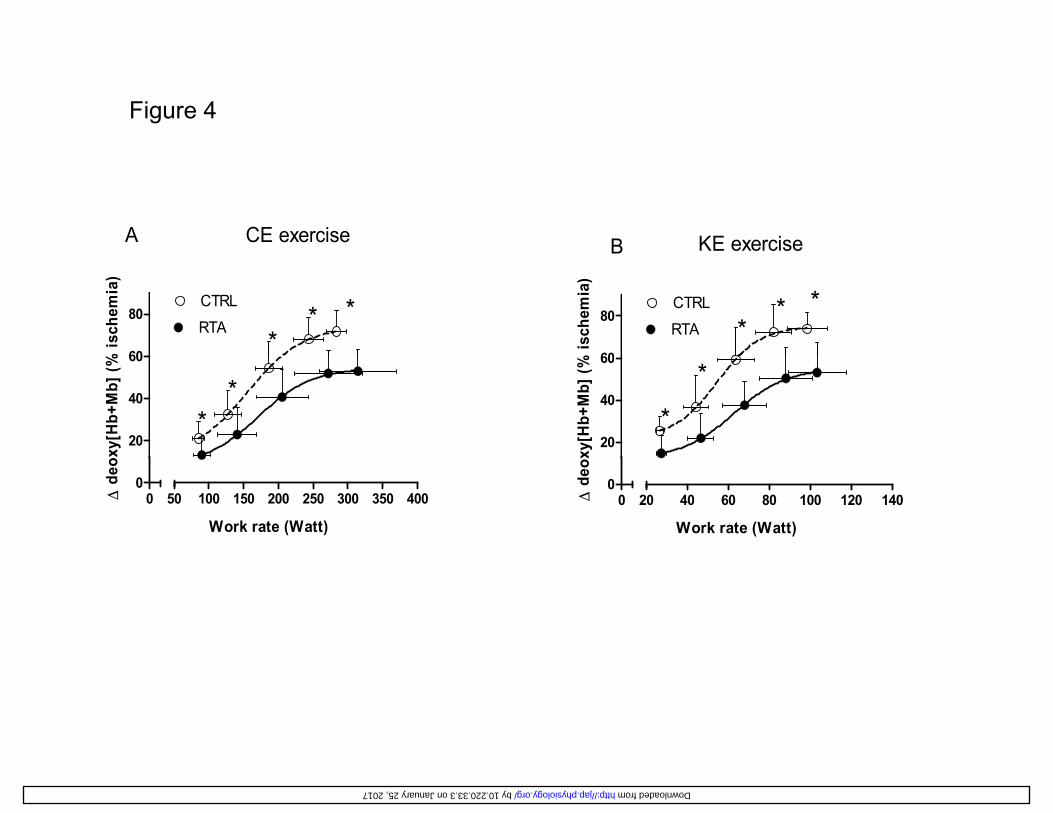
Figure 4
B KE exerciseA CE exercise
60
80CTRL
RTA
B
*
% is
chem
ia)
**
60
80CTRL
RTA**
*
% is
chem
ia)
20
40
60
xy[H
b+M
b] (% *
*20
40
60
**
o xy[
Hb+
Mb]
(%
00
20 40 60 80 100 120 140
Work rate (Watt)
Δ d
eox
00
50 100 150 200 250 300 350 400
Work rate (Watt)
Δ d
e o
by 10.220.33.3 on January 25, 2017 http://jap.physiology.org/ Downloaded from
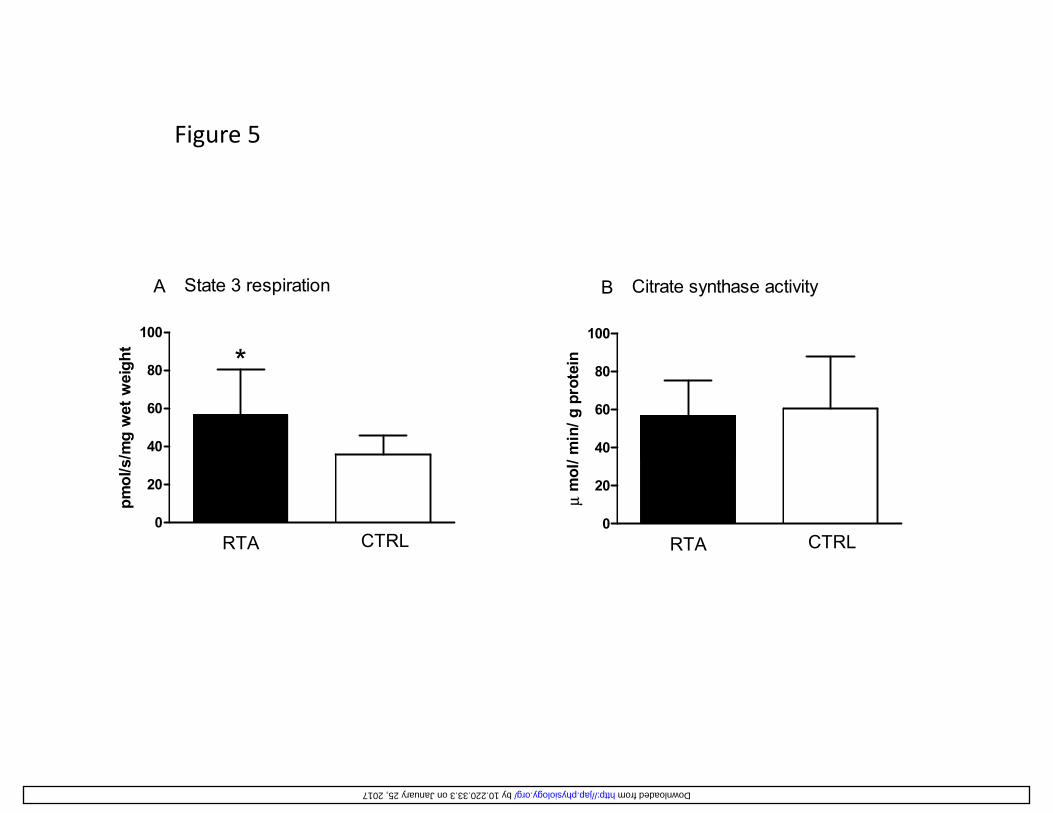
Figure 5
100
State 3 respiration
*
A
ht
100
Citrate synthase activityB
n
40
60
80 *
/mg
wet
wei
gh
40
60
80
min
/ g p
rote
in
0
20
RTA CTRL
pmol
/s/
0
20
RTA CTRLμ
mol
/
by 10.220.33.3 on January 25, 2017 http://jap.physiology.org/ Downloaded from
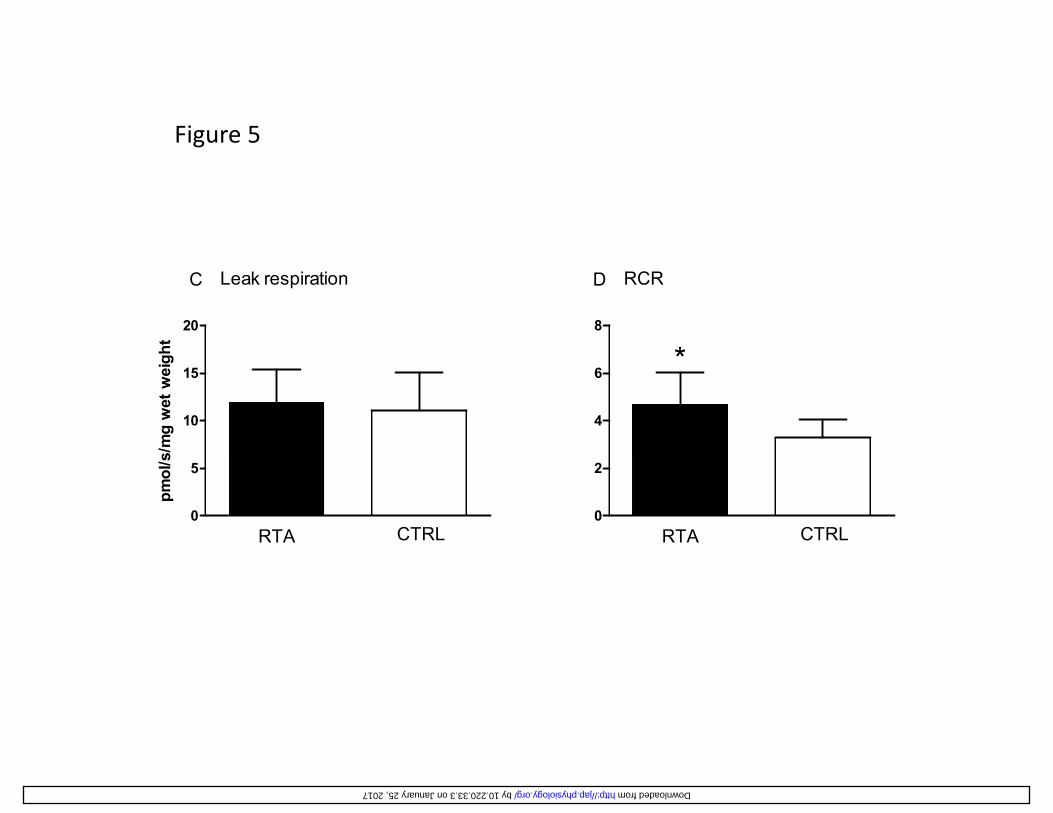
Figure 5
20
Leak respirationC
ght
8
RCRD
*
10
15
s/m
g w
et w
eig
4
6 *
0
5
RTA CTRL
pmol
/s
0
2
RTA CTRL
by 10.220.33.3 on January 25, 2017 http://jap.physiology.org/ Downloaded from


![(Pi), [PJ] Pi), - dm5migu4zj3pb.cloudfront.net · 31P-Magnetic ResonanceSpectroscopyAssessmentof Subnormal Oxidative Metabolism in Skeletal Muscleof Renal Failure Patients GeoffreyE](https://img.pdfslide.us/doc/110x75/5e09012eeed381361417cf43/pi-pj-pi-31p-magnetic-resonancespectroscopyassessmentof-subnormal-oxidative.jpg)