Embed Size (px)
Citation preview
MAGNETIC RESONANCE IN CHEMISTRYMagn. Reson. Chem. 2005; 43: S174–S182Published online in Wiley InterScience (www.interscience.wiley.com). DOI: 10.1002/mrc.1664
Size effects in chromium-doped PbTiO3 nanopowdersobserved by multi-frequency EPR†
Emre Erdem,1 Rolf Bottcher,1∗ Hans-Jurgen Glasel2 and Eberhard Hartmann2
1 Institut fur Experimentelle Physik II, Fakultat fur Physik und Geowissenschaften, Universitat Leipzig, D-04103 Leipzig, Germany2 Leibniz-Institut fur Oberflachenmodifizierung, D-04318 Leipzig, Germany
Received 16 March 2005; Revised 13 May 2005; Accepted 24 May 2005
A multi-frequency (X, Q, and W band) electron paramagnetic resonance (EPR) study of Cr-doped PbTiO3
micro- and nanopowder samples was performed. Three Cr3+ centres were identified in tetragonal phasesamples with different axial Zero Field Splitting (ZFS) parameters, C1, C2, and C3. The centre C1 is similarto that observed in previous X-band crystal and ceramic sample measurements. The superposition modelby Newman and Urban was applied to translate the ZFS data into local displacements inside the distortedoxygen octahedra of the PbTiO3 lattice. In the tetragonal phase, only the centre C1 was observed. Thepowder spectra were fitted using a spin-Hamiltonian in which a Gaussian distribution of ZFS terms,characterized by a mean value D and distribution width 1D, was assumed. The variation of D and 1Dwith mean particle size was determined. A critical particle size, dcr, exists, particles smaller than this sizeremain in the cubic phase for all temperatures, there is a size-driven tetragonal-to-cubic phase transition.Particles with d < dcr were found to give a new Cr3+ centre spectrum, C4, consisting of a single line with anisotropic g-factor, so allowing the cubic phase content to be quantified. Further, temperature-dependentEPR measurements were made, which allowed the variation in Curie temperature with mean particle sizeto be determined. Copyright 2005 John Wiley & Sons, Ltd.
KEYWORDS: EPR; chromium ion; lead titanate; nanocrystals; ferroelectricity; size effects; critical size; size-driven phasetransition
INTRODUCTION
The examination of nanocrystalline ferroelectrics with per-ovskite structure and the determination of their physicaland chemical properties are one of the challenges of thesolid-state physics and the modern material science dueto their potential applications (thin film capacitors, micro-mechanical devices, chemical and pyroelectric sensors, non-linear optics). Interest in this material system is growingrapidly because the high dielectric constant can be utilizedin dynamic random access memories, whereas its capacityfor being polarized in opposite directions makes it an attrac-tive candidate for non-volatile random access memories.1
An important motivation for studying particle size effects inferroelectrics is to determine the ultimate level to which adevice based on such system can be miniaturized. On theother hand, finite-size effects in ferroelectric particles haveattracted interest, yielding the smallest size limit to verify acorresponding computer simulation on the phase transitionin electric dipole systems.
†Presented as part of a special issue on High-field EPR in Biology,Chemistry and Physics.ŁCorrespondence to: Rolf Bottcher, Institut fur ExperimentellePhysik II, Fakultat fur Physik und Geowissenschaften, Linnestr. 5,Universitat Leipzig, D-04103 Leipzig, Germany.E-mail: [email protected]/grant sponsor: Deutsche Forschungsgemeinschaft;Contract/grant number: (Priority programme SPP 1051).
The main characteristic feature of the perovskitic ABO3
nanocrystals (BaTiO3, PbTiO3, etc.) is the inhomogeneity intheir intrinsic properties: electrical polarization, dielectricsusceptibility, tetragonality, and so on. The inhomogeneousproperties of the nanoparticles are related to the strongimpact of the surface layer, in which the properties differfrom those in the centre of the particle. In the frameworkof the phenomenological Landau–Ginzburg–Devonshire(LGD) theory, the inhomogeneity of the spontaneous polar-isation within one spherical nanoparticle is modelled bymeans of one parameter, the extrapolation length υ, describ-ing the difference between the surface and bulk (for furtherdetails see Ref. 2). In particular, the decrease of the valueof the polarization (PS�d�) averaged over the nanoparticleand the shift of the Curie temperature (TC) in dependenceon the particle size as well as the existence of a criticalsize (dcr) at which the ferroelectricity disappears and thenanosystem goes into the paraelectric state were theoreti-cally predicted.2,3 The size-driven phase transition has thesame order as the temperature-driven one. These statementsare experimentally confirmed by various methods.4 – 6 Thestrong scattering of the derived value for TC and dcr wasfound to be dependent on the preparation conditions of thenanocrystalline powders.
Grain sizes, their statistical distribution, and non-localproperties can be determined by conventional X-ray diffrac-tion (XRD) and transmission electron microscopy (TEM).
Copyright 2005 John Wiley & Sons, Ltd.
Size effects in chromium-doped PbTiO3 nanopowders S175
Access to the local structure, i.e. the geometric and electronicproperties of the constituting ions or paramagnetic impuri-ties and their local coordination spheres can be achieved onlyby means of local probe spectroscopic methods like NMR,EPR, and Mossbauer spectroscopy. Results on nanocrys-talline BaTiO3 cannot be transferred to PbTiO3.7 – 10 Althoughthe two substances have the same crystal structure at roomtemperature, their physical properties are very different fromeach other. The differences between the two materials arelikely due to the presence of the Pb 6s electrons; these areinvolved in covalent bonding and are thought to contributeto the stabilization of the PbTiO3 structure.
The aim of the work presented here is to investigatethe structure of PbTiO3 nanocrystallites and give insighton structure–property relations using multi-frequency EPRspectroscopy. For these investigations, the PbTiO3 nanocrys-tallites were doped with chromium.
Starting from microcrystalline PbTiO3 samples, whichhave the physical properties of bulk material (TC D765 K, tetragonal: P4mm, a D 0.3905 nm, c D 0.4156 nm,spontaneous polarization PS D 60 µC/cm2; cubic: Pm3m,a D 0.3970 nm)11 and by going to nanocrystalline powders,the purpose of this work is
1. to identify the different Cr centres in micro- andnanocrystalline powders,
2. to get more detailed information on the change of thelocal structure of the nanocrystallites (symmetry andlattice parameter) by measuring the mean Zero FieldSplitting (ZFS) parameters and their distribution functionsas well as by theoretical interpretation in the frame of thesuperposition model (SPM), and
3. to probe the ferroelectric properties by measuring thetemperature dependence of the spectral parameters.
This paper is organized as follows: In Section 2, we intro-duce the features of Cr3C EPR spectra in micro- and nanocrys-talline powders. Section 3 refers briefly to the experimentalconditions. Section 4 presents the experimental results ofthe multi-frequency EPR investigations on chromium-dopedmicro- and nanocrystalline PbTiO3 powders, their interpre-tation in the framework of the superposition model, andthe determination of the size-dependent TC. In Section 5, theexperimental EPR results are correlated with the XRD dataand discussed within the framework of the LGD theory, andfinally conclusions are drawn in the last section.
FEATURES OF CR3+ EPR SPECTRA IN MICRO-AND NANOCRYSTALLINE POWDERS
For the discussion of the EPR findings, it is important torecall that the spectrum of an ideal, microcrystalline powder(neglecting the surface effects) is a superposition of spectrafrom randomly oriented crystallites. The resonance fieldBres���, the intensity A���, and the line width ��� of atransition depend on the orientation � between the crystalliteand the external magnetic field. The powder spectrum canbe expressed as
P�B� D∫
�A���f �B� Bres���, ����d� �1�
where f �B� Bres, � is the line shape function and � D ��, �,�, and being the polar and azimutal angles of the externalmagnetic field in the principal coordinate system of thespin-Hamiltonian, respectively.12,13 Replacing the line shapefunction by the Dirac delta function and transforming thenatural co-ordinate, one obtains the stick spectrum as a lineintegral over the contour line Bres D B
P�B� D∮
Bres���DB
A���
jrBres���j �2�
with
jrBresj D[(
∂Bres
∂�
)2
C 1sin2 �
(∂Bres
∂
)2] 1
2
. �3�
It is evident from (3) that resonance lines are only observedwhen a change in the orientation of the external magneticfield B gives a very small change in the resonance fieldBres���. These orientations, in whichrBres��� D 0, are termedpolycrystalline critical points and give rise to singularities,leading to either divergences or shoulders in the EPR powderpattern.
For the 50,52,54Cr3C ions with the electron spin S D 3/2and the nuclear spin I D 0, we used the rhombic spin-Hamiltonian of the form
OH D ˇ Ð EB Ð g Ð ESCD(OS2
z �13
S�SC 1�
)C E� OS2
x � OS2y�, �4�
where g is the electronic g-tensor, ˇ the Bohr magneton, D andE the axial and rhombic ZFS parameters, respectively. Theisotope 53Cr (natural abundance 9.5%) has the nuclear spinI D 3/2 and the spin-Hamiltonian (4) must be augmented bythe hyperfine term.
In the case of the weak or strong crystalline field, onemay use the perturbation theory to calculate the resonancefields Bres��� of the spin-Hamiltonian (4). For the weak axialcrystalline fields (jDj − gˇB, E D 0), one gets three typesof polycrystalline critical points: � D 0, �2 D
2 , and �3 D0.2322, and seven allowed transitions with the selectionMs D š1 are expected in derivative powder spectrum aspeaks or lines. The angular-dependent resonance field Bres���of the central transition Ms D � 1
2 �! Ms D 12 has critical
points for �1, �2, and �3 (central ZFS peaks). The intensitiesof the ZFS transitions belonging to the orientation �1 D 0 areweak and their detection in the powder spectrum is difficult.Therefore, for the selection rules Ms D š 1
2 �! Ms D š 32
frequently the peaks with � D 2 are only detectable in the
powder spectrum (peripheral ZFS peaks). Note that all peakseparations (proportional to D2/B0 and D for the central andperipheral ZFS groups respectively) are determined by thetetragonal ZFS parameter D. If the local symmetry of theCr3C ion is less than the axial one (E 6D 0), then the peakswith �2 D
2 and �3 D 0.2322 reflect the symmetry reductionand are split by the orthorhombic distortion.
Paramagnetic Cr3C ions incorporated into this type ofnanoparticles are described by a spin-Hamiltonian whosesymmetry is temperature-dependent (axial and cubic forT < TC and T > TC respectively). Below TC, the axial
Copyright 2005 John Wiley & Sons, Ltd. Magn. Reson. Chem. 2005; 43: S174–S182
S176 E. Erdem et al.
ZFS parameter is temperature- and size-dependent, and therelation
D�d, T� / P2S�d, T� /
(c�d, T�
a�d, T�� 1
)�5�
proven for paramagnetic ions in single ABO3 crystals14 isassumed to be valid in nanomaterials. PS�T, d� is the averagedvalue of the temperature-dependent PS of the nanoparticlewith the diameter d. At the individual phase-transitiontemperature TC�d� of the nanocrystallites, its ZFS parameterD�d� vanishes.
Moreover, for the characterization of the EPR spectrum ofa paramagnetic defect incorporated into nanocrystallites, onehas to take into account the distribution of the particle size inthe powder. Our samples may be characterized by the meanparticle size (dm) and size distribution function. Owing tothis distribution, in the powder samples the nanocrystallitesmay be divided into two classes corresponding to theparticle size. In the first one, there are all nanocrystalswith diameters larger than dcr. Their physical properties,for instance, the values of spontaneous polarization, andtetragonality averaged over the nanocrystal as well as thephase-transition temperature, are size-dependent. Below TC,their crystal structure is tetragonal and the particles are inthe ferroelectric state, whereas, above TC they are in theparaelectric state with the cubic symmetry. The second classcontains all crystallites whose diameters are smaller than thecritical one dcr. These particles crystallize in the cubic crystalstructure and are only in paraelectric state independent of thetemperature. Cr3C ions incorporated into these nanocrystalsmay be described by a cubic spin-Hamiltonian without anyZFS terms. Consequently, in the powder spectrum of the‘cubic’ Cr3C ions, only one symmetric line is observed, whoseposition in the spectrum is given by the isotropic g-factor.The complete EPR spectrum of a nanocrystalline powder isthe weighting average of all size-dependent partial spectra.
For the simulation of the EPR spectra of the chromiumions in the nanocrystallites with d > dcr, the followingprocedure was performed: using a particular set of spin-Hamiltonian parameters dependent on the mean particlesize, the powder spectrum of the ideal polycrystal issimulated and then the distributions of the spin-Hamiltonianparameters were taken into account. However, only thedistribution of axial ZFS parameter D has to be considered,which can be comprised in a dense way by the statisticalstrain model proposed by Wenzel et al.15 In this model,the distributions of the ZFS parameters are assumed tobe Gaussian and independent of each other. To these partialpowder spectra, a cubic one is added, whose intensity is givenby the volume of all nanocrystallites with cubic symmetry.
EXPERIMENTAL
The application of the combined polymerization and pyrol-ysis (CPP) allow for the preparation of perovskitic ABO3
nanopowders doped with paramagnetic ions in a wide meanparticle range (from 25 nm up to 2 µm).7 Our preparationroute of PbTiO3 nanopowders may be briefly describedby the following reactions: In the first step, lead titaniummethacrylate is obtained as a monomeric metallo-organic
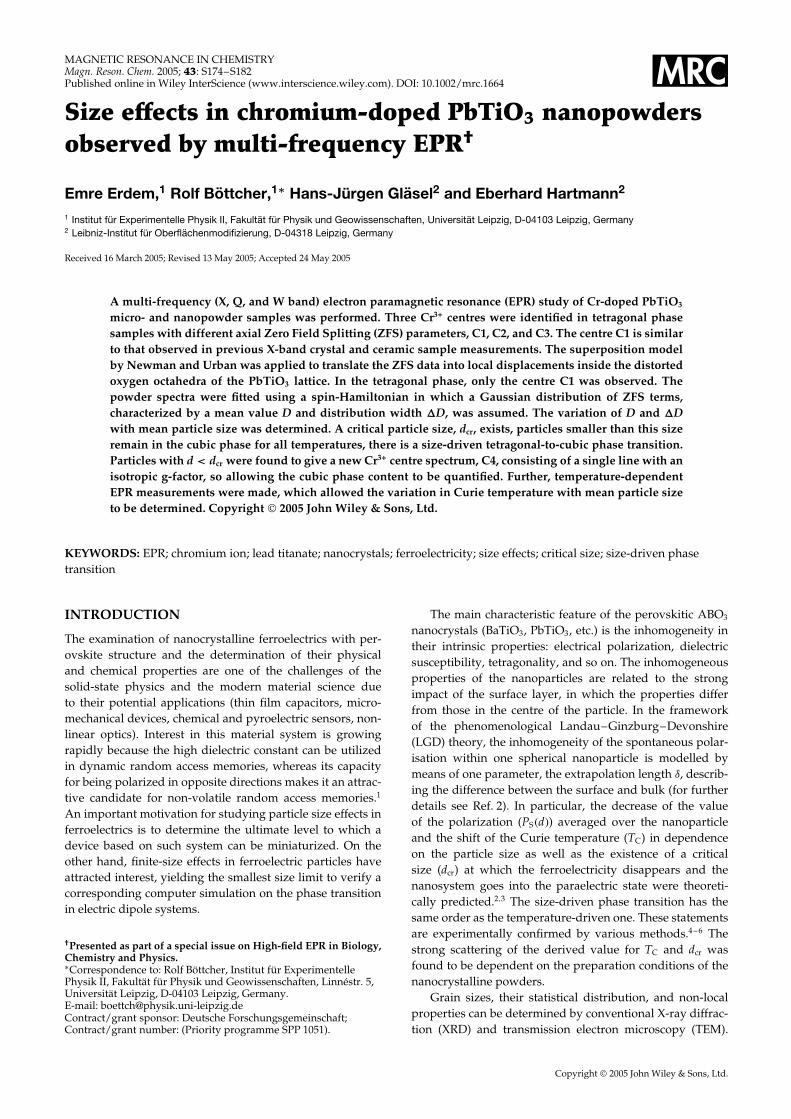
precursor from lead(II) oxide PbO, titanium(IV) isopropox-ide Ti(O-C3H7)4 and methacrylic acid CH2 C(CH3)-COOHin boiling chloroform. Then, the solid-phase polymeriza-tion and the concomitant pyrolysis proceed simultaneouslyat temperatures above 200 °C. Nucleation and growth ofPbTiO3 particles start at about 320 °C, where the tempera-ture determines the resulting particle size (see Fig. 1). Thedopant was introduced in the first stage of the preparationroute by adding the corresponding acetates (e.g. chromiumacetylacetonate for doping with chromium). For the differentpreparative and solid-state aspects, the interested reader isreferred to Ref. 9, 10.
The product (yield 96%) was verified with the aid ofthe elemental analysis and spectroscopic methods: Fouriertransform Raman and X-ray absorption near structure(XANES) at the Ti K edge. Mean particle sizes and thedistribution functions as well as the mean tetragonality givenby the lattice parameters a and c were determined for allsamples by means of XRD.9 A good approximation of thesize distribution function (d particle size) for nanocrystallitesis the log-normal distribution in the form of
n�d� D 1p2d ln �
exp(� �ln d� ln ��2
2�ln ��2
)�6�
where the parameters � and � describe the median and thewidth of the distribution.
Alternatively, gradual reduction of mean particle sizeof the parent nanopowder up to 6 nm was done with theaid of a planetary ball mill under soft grinding conditions(low rotation frequency 360 min�1, 6 ZrO2 milling balls withdiameter of 1 cm, milling times ranging from 5 min up to2 days).16
EPR spectra were taken at room temperature using theBruker spectrometers ESP 380, EMX, and ELEXSYS E 600 inthe X (9 GHz), Q (34 GHz), and W (94 GHz) band respec-tively. High-temperature experiments (X-band Varian E112spectrometer) up to 830 K were carried out with a mod-ified H011 cavity, which is water-cooled and temperature-monitored with a platinum wire resistance heating element.17
A thermo-couple-enabled in situ temperature measurement
300 350 400 450 500 550 600 650 700 750 800 850 9000
25
50
75
100
125
150
175
200
225
250
Mea
n pa
rtic
le s
ize
(nm
)
Reaction temperature (°C)
Figure 1. Dependence of the mean particle size dm of the CPProute prepared PbTiO3 powders on the reaction temperature.
Copyright 2005 John Wiley & Sons, Ltd. Magn. Reson. Chem. 2005; 43: S174–S182
Size effects in chromium-doped PbTiO3 nanopowders S177
at the middle point of the powder samples, which yielded atemperature gradient across the sample length (about 4 mm)of about 3 K. The program XSophe18 was employed to deducethe parameters of the spin-Hamiltonian and their distributionfrom the powder spectra. This advanced simulation programis based on matrix diagonalization and the so-called Sophescheme for partitioning the surface of the unit sphere.
EXPERIMENTAL RESULTS
Cr3+ EPR spectra of microcrystalline PbTiO3
samples taken at room temperatureThe first derivative of the absorption X-band EPR spectrumof the Cr-doped PbTiO3 micropowder (Fig. 2) measured atroom temperature reveals in the middle of the spectrum (g D1.94) a multi-line pattern, which is to be attributed to Cr5C
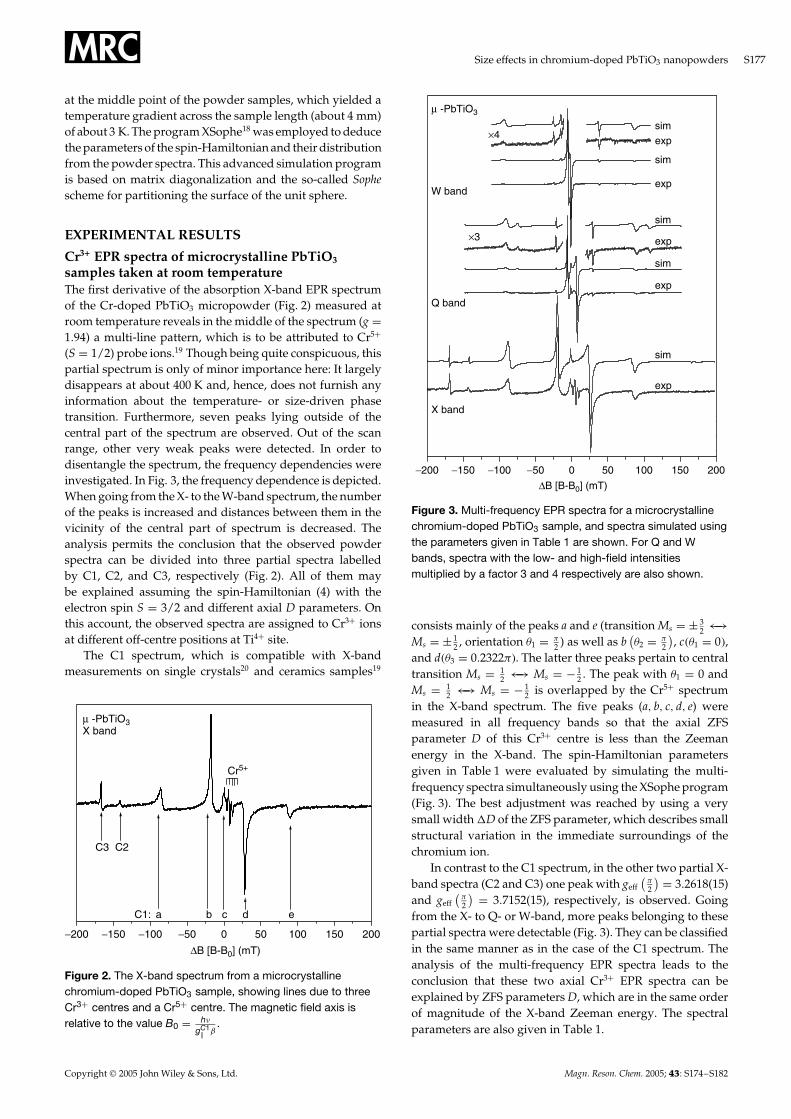
(S D 1/2) probe ions.19 Though being quite conspicuous, thispartial spectrum is only of minor importance here: It largelydisappears at about 400 K and, hence, does not furnish anyinformation about the temperature- or size-driven phasetransition. Furthermore, seven peaks lying outside of thecentral part of the spectrum are observed. Out of the scanrange, other very weak peaks were detected. In order todisentangle the spectrum, the frequency dependencies wereinvestigated. In Fig. 3, the frequency dependence is depicted.When going from the X- to the W-band spectrum, the numberof the peaks is increased and distances between them in thevicinity of the central part of spectrum is decreased. Theanalysis permits the conclusion that the observed powderspectra can be divided into three partial spectra labelledby C1, C2, and C3, respectively (Fig. 2). All of them maybe explained assuming the spin-Hamiltonian (4) with theelectron spin S D 3/2 and different axial D parameters. Onthis account, the observed spectra are assigned to Cr3C ionsat different off-centre positions at Ti4C site.
The C1 spectrum, which is compatible with X-bandmeasurements on single crystals20 and ceramics samples19
−200 −150 −100 −50 0 50 100 150 200
Cr5+
µ -PbTiO3X band
edcbaC1:
C2C3
∆B [B-B0] (mT)
Figure 2. The X-band spectrum from a microcrystallinechromium-doped PbTiO3 sample, showing lines due to threeCr3C centres and a Cr5C centre. The magnetic field axis isrelative to the value B0 D h
gC1jj ˇ
.
−200 −150 −100 −50 0 50 100 150 200
exp
exp
sim
sim
µ -PbTiO3
sim
exp
sim
exp
exp
sim
X band
Q band
W band
×4
×3
∆B [B-B0] (mT)
Figure 3. Multi-frequency EPR spectra for a microcrystallinechromium-doped PbTiO3 sample, and spectra simulated usingthe parameters given in Table 1 are shown. For Q and Wbands, spectra with the low- and high-field intensitiesmultiplied by a factor 3 and 4 respectively are also shown.
consists mainly of the peaks a and e (transition Ms D š 32 �!
Ms D š 12 , orientation �1 D
2 ) as well as b(�2 D
2
), c��1 D 0�,
and d��3 D 0.2322�. The latter three peaks pertain to centraltransition Ms D 1
2 �! Ms D � 12 . The peak with �1 D 0 and
Ms D 12 �! Ms D � 1
2 is overlapped by the Cr5C spectrumin the X-band spectrum. The five peaks (a, b, c, d, e) weremeasured in all frequency bands so that the axial ZFSparameter D of this Cr3C centre is less than the Zeemanenergy in the X-band. The spin-Hamiltonian parametersgiven in Table 1 were evaluated by simulating the multi-frequency spectra simultaneously using the XSophe program(Fig. 3). The best adjustment was reached by using a verysmall width D of the ZFS parameter, which describes smallstructural variation in the immediate surroundings of thechromium ion.
In contrast to the C1 spectrum, in the other two partial X-band spectra (C2 and C3) one peak with geff
(2
) D 3.2618(15)and geff
(2
) D 3.7152(15), respectively, is observed. Goingfrom the X- to Q- or W-band, more peaks belonging to thesepartial spectra were detectable (Fig. 3). They can be classifiedin the same manner as in the case of the C1 spectrum. Theanalysis of the multi-frequency EPR spectra leads to theconclusion that these two axial Cr3C EPR spectra can beexplained by ZFS parameters D, which are in the same orderof magnitude of the X-band Zeeman energy. The spectralparameters are also given in Table 1.
Copyright 2005 John Wiley & Sons, Ltd. Magn. Reson. Chem. 2005; 43: S174–S182
S178 E. Erdem et al.
Table 1. Spin–Hamiltonian parameters for Cr3C centres, assuming a Gaussian distribution of ZFS term Dvalues of width D, and linewidth used to simulate the experimental multi-frequency spectra formicrocrystalline chromium-doped PbTiO3 powders
Centre gjj g? D (10�4 cm�1) D (10�4 cm�1) Linewidth (10�4 cm�1)
C1 1.9725(8) 1.9790(11) 840(20) 20(5) 8(2)C2 1.9715(12) 1.9720(12) 1600(30) <10 5(2)C3 1.9660(11) 1.9695(10) 3090(30) <10 5(2)
Newman superposition model and determinationof Cr3+ positions in PbTiO3
Former EPR studies on doped perovskite oxide (ATiO3,A D Pb,20,21 Ba,8 Sr22) have shown that 3d ions areincorporated in the distorted TiO6
8� octahedron on thenear-central Ti4C site because atomic radii of Ti4C (0.68 A)is closer to that of impurity ion (e.g. Cr3C 0.63 A). Therefore,we attribute the EPR spectra C1, C2, and C3 to Cr3C ionsaccommodated in TiO6
8� octahedra. In order to examinethe local structure and the exact position of Cr3C ions inthe PbTiO3 host in a more detailed way, we used the semi-empirical Newman SPM, first introduced by Newman.23 Itallows to separate the geometrical and physical information,and has proven to be a very useful way of probing thelocal structure and configuration of the paramagnetic ionsinside the crystal host lattice. It enables the determination ofthe spin-Hamiltonian parameters for a known structure of adefect in a solid-state material or vice versa, the deductionof the local environment of a paramagnetic centre from theEPR data. This model is mainly based on the presuppositionthat the spin-Hamiltonian parameters of a paramagneticion can be built up from individual contributions dueto neighbouring ligands. The contributions of next-nearestneighbours as well as the interaction between ligands areignored. In this approximation, ZFS parameter D of a Cr3C
ion accommodated in the distorted TiO68� octahedron may
be determined from a linear superposition of six single ligandcontributions of the form:
D D6∑
iD1
b2�Ri�12
�3 cos2 �i � 1� �7�
where the terms b2�Ri� and 12 �3 cos2 �i � 1� are the intrinsic
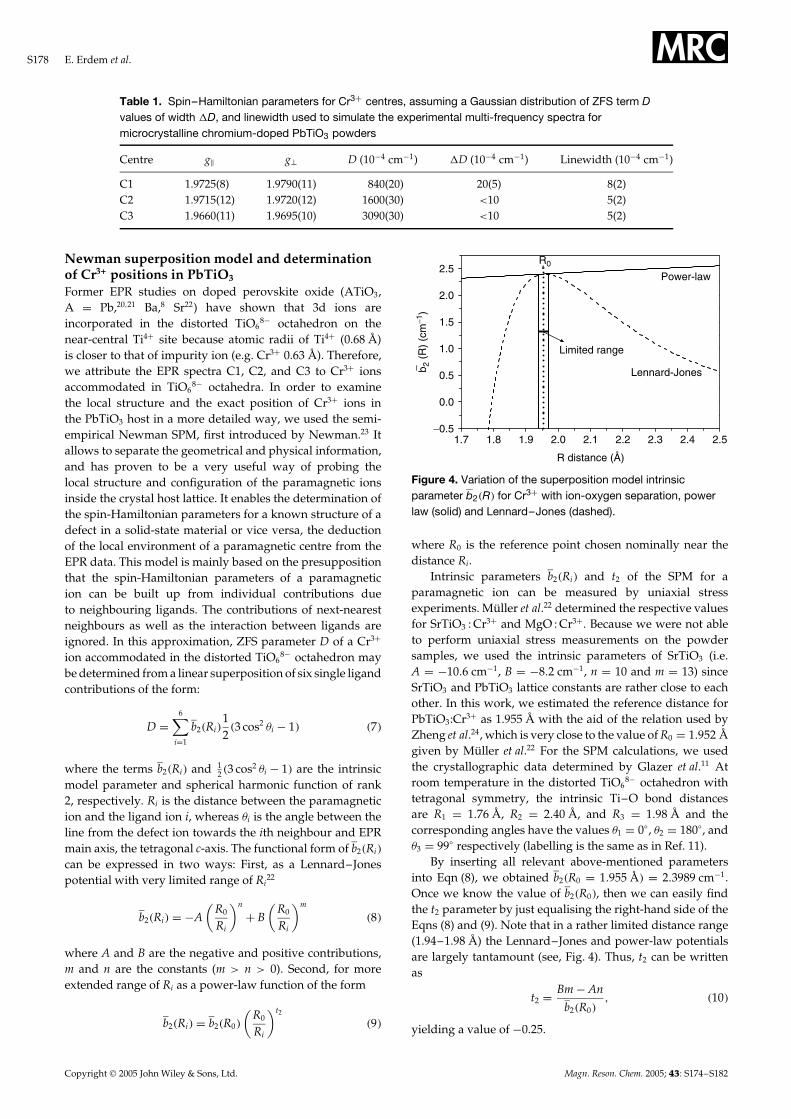
model parameter and spherical harmonic function of rank2, respectively. Ri is the distance between the paramagneticion and the ligand ion i, whereas �i is the angle between theline from the defect ion towards the ith neighbour and EPRmain axis, the tetragonal c-axis. The functional form of b2�Ri�can be expressed in two ways: First, as a Lennard–Jonespotential with very limited range of Ri
22
b2�Ri� D �A(
R0
Ri
)n
C B(
R0
Ri
)m
�8�
where A and B are the negative and positive contributions,m and n are the constants (m > n > 0). Second, for moreextended range of Ri as a power-law function of the form
b2�Ri� D b2�R0�
(R0
Ri
)t2
�9�
1.7 1.8 1.9 2.0 2.1 2.2 2.3 2.4 2.5−0.5
0.0
0.5
1.0
1.5
2.0
2.5R0
Lennard-Jones
Power-law
Limited range
b 2 (
R)
(cm
−1)
R distance (Å)
Figure 4. Variation of the superposition model intrinsicparameter b2�R� for Cr3C with ion-oxygen separation, powerlaw (solid) and Lennard–Jones (dashed).
where R0 is the reference point chosen nominally near thedistance Ri.
Intrinsic parameters b2�Ri� and t2 of the SPM for aparamagnetic ion can be measured by uniaxial stressexperiments. Muller et al.22 determined the respective valuesfor SrTiO3 : Cr3C and MgO : Cr3C. Because we were not ableto perform uniaxial stress measurements on the powdersamples, we used the intrinsic parameters of SrTiO3 (i.e.A D �10.6 cm�1, B D �8.2 cm�1, n D 10 and m D 13) sinceSrTiO3 and PbTiO3 lattice constants are rather close to eachother. In this work, we estimated the reference distance forPbTiO3:Cr3C as 1.955 A with the aid of the relation used byZheng et al.24, which is very close to the value of R0 D 1.952 Agiven by Muller et al.22 For the SPM calculations, we usedthe crystallographic data determined by Glazer et al.11 Atroom temperature in the distorted TiO6
8 – octahedron withtetragonal symmetry, the intrinsic Ti–O bond distancesare R1 D 1.76 A, R2 D 2.40 A, and R3 D 1.98 A and thecorresponding angles have the values �1 D 0°, �2 D 180°, and�3 D 99° respectively (labelling is the same as in Ref. 11).
By inserting all relevant above-mentioned parametersinto Eqn (8), we obtained b2�R0 D 1.955 A� D 2.3989 cm�1.Once we know the value of b2�R0�, then we can easily findthe t2 parameter by just equalising the right-hand side of theEqns (8) and (9). Note that in a rather limited distance range(1.94–1.98 A) the Lennard–Jones and power-law potentialsare largely tantamount (see, Fig. 4). Thus, t2 can be writtenas
t2 D Bm� An
b2�R0�, �10�
yielding a value of �0.25.
Copyright 2005 John Wiley & Sons, Ltd. Magn. Reson. Chem. 2005; 43: S174–S182
Size effects in chromium-doped PbTiO3 nanopowders S179
0.00 0.05 0.10 0.15 0.20 0.25 0.30 0.350.00
0.05
0.10
0.15
0.20
0.25
0.30
0.35
0.40
0.45
0.50
O(1)
O(2)O(2)
O(1)
Cr3+
∆R
exp
exp
exp
C1
C2
C3
|D| (
cm−1
)
Cr3+ displacement ∆R (Å)
c
Figure 5. The variation in ZFS parameter D calculated usingthe superposition model as a function of displacement of theCr3C ion from the O(2) plane (cf. inset in the figure).
Consequently, SPM enables to determine the differentpositions of Cr3C ions on the c-axis in the distorted TiO6
8�
octahedron. Displacements of the paramagnetic ion, whichare perpendicular to the tetragonal symmetry axis may bedisregarded because they annihilate the axial symmetry ofthe centres. The axial ZFS parameter D in dependence ofthe Cr3C displacement R is depicted in Fig. 5. Thus, theSPM calculation (7) yielded a central Cr3C position for theC1 centre within an oxygen octahedron elongated along thecrystallographic c-axis. For the C2 and C3 centre, larger Cr3C
displacements are obtained (0.16 A, 0.26 A), which, in thelatter case, are quite close to that of the Ti4C ion at roomtemperature. Finally, the SPM excludes for the centres C1,C2, and C3 in PbTiO3 an association of the Cr3C ion with anoxygen vacancy lying in the first ligand sphere.
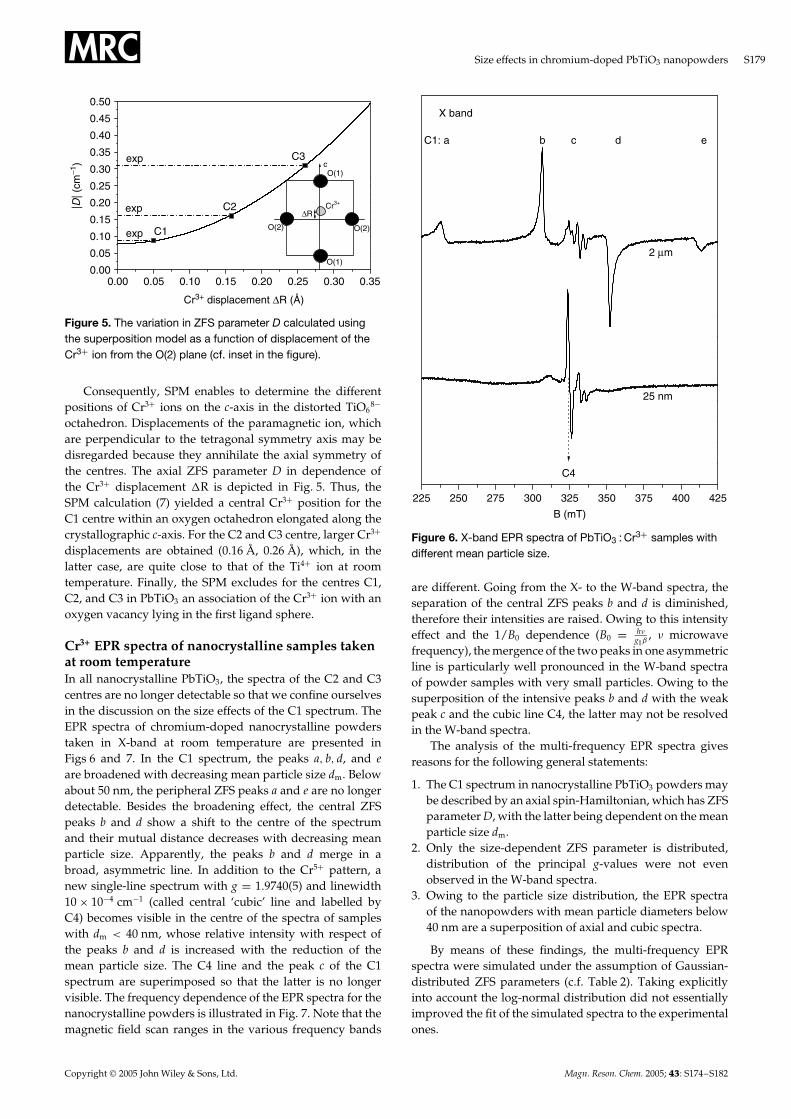
Cr3+ EPR spectra of nanocrystalline samples takenat room temperatureIn all nanocrystalline PbTiO3, the spectra of the C2 and C3centres are no longer detectable so that we confine ourselvesin the discussion on the size effects of the C1 spectrum. TheEPR spectra of chromium-doped nanocrystalline powderstaken in X-band at room temperature are presented inFigs 6 and 7. In the C1 spectrum, the peaks a, b, d, and eare broadened with decreasing mean particle size dm. Belowabout 50 nm, the peripheral ZFS peaks a and e are no longerdetectable. Besides the broadening effect, the central ZFSpeaks b and d show a shift to the centre of the spectrumand their mutual distance decreases with decreasing meanparticle size. Apparently, the peaks b and d merge in abroad, asymmetric line. In addition to the Cr5C pattern, anew single-line spectrum with g D 1.9740(5) and linewidth10ð 10�4 cm�1 (called central ‘cubic’ line and labelled byC4) becomes visible in the centre of the spectra of sampleswith dm < 40 nm, whose relative intensity with respect ofthe peaks b and d is increased with the reduction of themean particle size. The C4 line and the peak c of the C1spectrum are superimposed so that the latter is no longervisible. The frequency dependence of the EPR spectra for thenanocrystalline powders is illustrated in Fig. 7. Note that themagnetic field scan ranges in the various frequency bands
225 250 275 300 325 350 375 400 425
C1: a
C4
c edb
X band
25 nm
2 µm
B (mT)
Figure 6. X-band EPR spectra of PbTiO3 : Cr3C samples withdifferent mean particle size.
are different. Going from the X- to the W-band spectra, theseparation of the central ZFS peaks b and d is diminished,therefore their intensities are raised. Owing to this intensityeffect and the 1/B0 dependence (B0 D h
gjjˇ , microwavefrequency), the mergence of the two peaks in one asymmetricline is particularly well pronounced in the W-band spectraof powder samples with very small particles. Owing to thesuperposition of the intensive peaks b and d with the weakpeak c and the cubic line C4, the latter may not be resolvedin the W-band spectra.
The analysis of the multi-frequency EPR spectra givesreasons for the following general statements:
1. The C1 spectrum in nanocrystalline PbTiO3 powders maybe described by an axial spin-Hamiltonian, which has ZFSparameter D, with the latter being dependent on the meanparticle size dm.
2. Only the size-dependent ZFS parameter is distributed,distribution of the principal g-values were not evenobserved in the W-band spectra.
3. Owing to the particle size distribution, the EPR spectraof the nanopowders with mean particle diameters below40 nm are a superposition of axial and cubic spectra.
By means of these findings, the multi-frequency EPRspectra were simulated under the assumption of Gaussian-distributed ZFS parameters (c.f. Table 2). Taking explicitlyinto account the log-normal distribution did not essentiallyimproved the fit of the simulated spectra to the experimentalones.
Copyright 2005 John Wiley & Sons, Ltd. Magn. Reson. Chem. 2005; 43: S174–S182
S180 E. Erdem et al.
200 250 300 350 400 450
sim
sim
sim
sim
X band
90 nm
25 nm
110 nm
2 µm
B (mT)
1180 1200 1220 1240 1260 1280 1300
sim
sim
sim
sim
90 nm
Q band
25 nm
110 nm
2 µm
B (mT)
sim
sim
sim
sim
90 nm
25 nm
110 nm
2 µm
W band
3390 3400 3410 3420 3430
B (mT)
Figure 7. Multi-frequency EPR spectra for different mean particle size chromium-doped PbTiO3 powders. The simulated Cr3C
spectra using the spin-Hamiltonian parameters given in Table 2 are also shown.
Table 2. Mean value and distribution widths for the Cr3C
centre C1 ZFS parameter D as a function of mean particlesize obtained from fitting the experimental spectra. Thelinewidth used in the simulation is also included
Particlesize
DC1
(10�4 cm�1)DC1
(10�4 cm�1)Linewidth
(10�4 cm�1)
2 µm 840(20) 20(5) 8(2)110 nm 830(20) 70(10) 8(2)90 nm 790(20) 100(10) 12(2)25 nm 770(20) 110(10) 12(2)16 nm 730(20) 125(10) 12(2)10 nm 720(20) 150(10) 12(2)
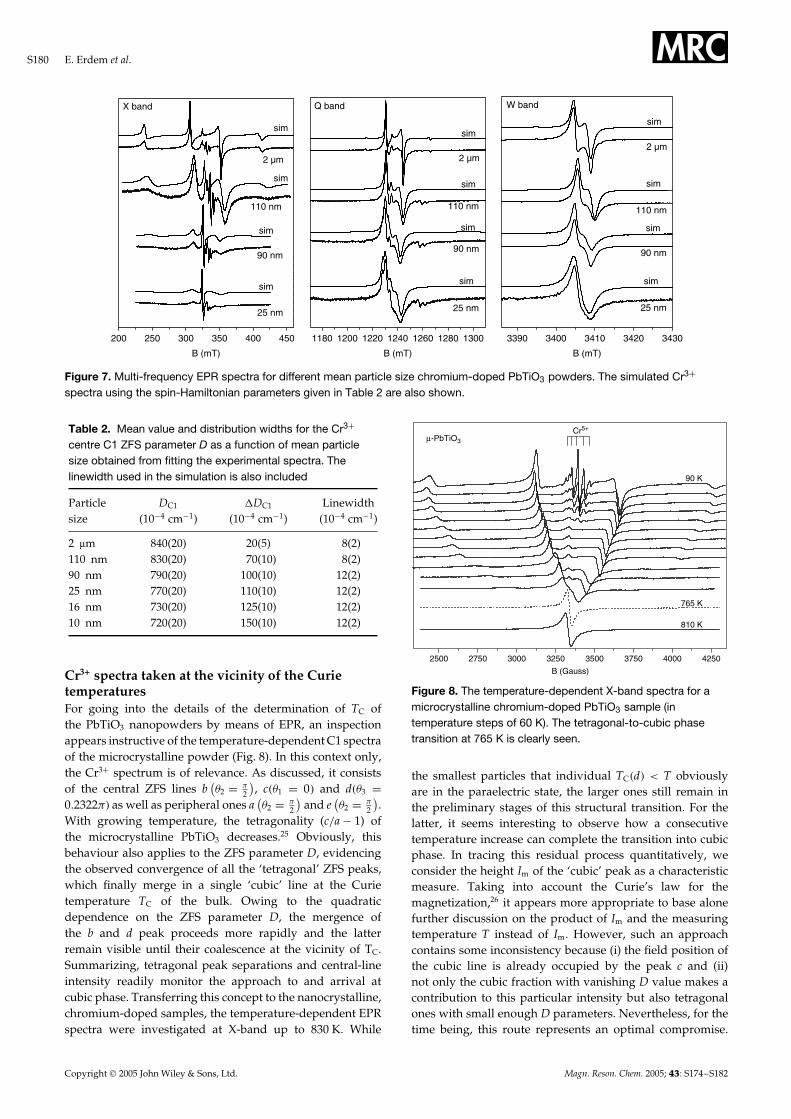
Cr3+ spectra taken at the vicinity of the CurietemperaturesFor going into the details of the determination of TC ofthe PbTiO3 nanopowders by means of EPR, an inspectionappears instructive of the temperature-dependent C1 spectraof the microcrystalline powder (Fig. 8). In this context only,the Cr3C spectrum is of relevance. As discussed, it consistsof the central ZFS lines b
(�2 D
2
), c��1 D 0� and d��3 D
0.2322� as well as peripheral ones a(�2 D
2
)and e
(�2 D
2
).
With growing temperature, the tetragonality (c/a� 1) ofthe microcrystalline PbTiO3 decreases.25 Obviously, thisbehaviour also applies to the ZFS parameter D, evidencingthe observed convergence of all the ‘tetragonal’ ZFS peaks,which finally merge in a single ‘cubic’ line at the Curietemperature TC of the bulk. Owing to the quadraticdependence on the ZFS parameter D, the mergence ofthe b and d peak proceeds more rapidly and the latterremain visible until their coalescence at the vicinity of TC.Summarizing, tetragonal peak separations and central-lineintensity readily monitor the approach to and arrival atcubic phase. Transferring this concept to the nanocrystalline,chromium-doped samples, the temperature-dependent EPRspectra were investigated at X-band up to 830 K. While
2500 2750 3000 3250 3500 3750 4000 4250
µ-PbTiO3
Cr5+
810 K
765 K
90 K
B (Gauss)
Figure 8. The temperature-dependent X-band spectra for amicrocrystalline chromium-doped PbTiO3 sample (intemperature steps of 60 K). The tetragonal-to-cubic phasetransition at 765 K is clearly seen.
the smallest particles that individual TC�d� < T obviouslyare in the paraelectric state, the larger ones still remain inthe preliminary stages of this structural transition. For thelatter, it seems interesting to observe how a consecutivetemperature increase can complete the transition into cubicphase. In tracing this residual process quantitatively, weconsider the height Im of the ‘cubic’ peak as a characteristicmeasure. Taking into account the Curie’s law for themagnetization,26 it appears more appropriate to base alonefurther discussion on the product of Im and the measuringtemperature T instead of Im. However, such an approachcontains some inconsistency because (i) the field position ofthe cubic line is already occupied by the peak c and (ii)not only the cubic fraction with vanishing D value makes acontribution to this particular intensity but also tetragonalones with small enough D parameters. Nevertheless, for thetime being, this route represents an optimal compromise.
Copyright 2005 John Wiley & Sons, Ltd. Magn. Reson. Chem. 2005; 43: S174–S182
Size effects in chromium-doped PbTiO3 nanopowders S181
300 400 500 600 700 800
1
2
3
4
5
I m ⋅
T
Temperature (K)
2 µm29 nm16 nm9 nm6 nm
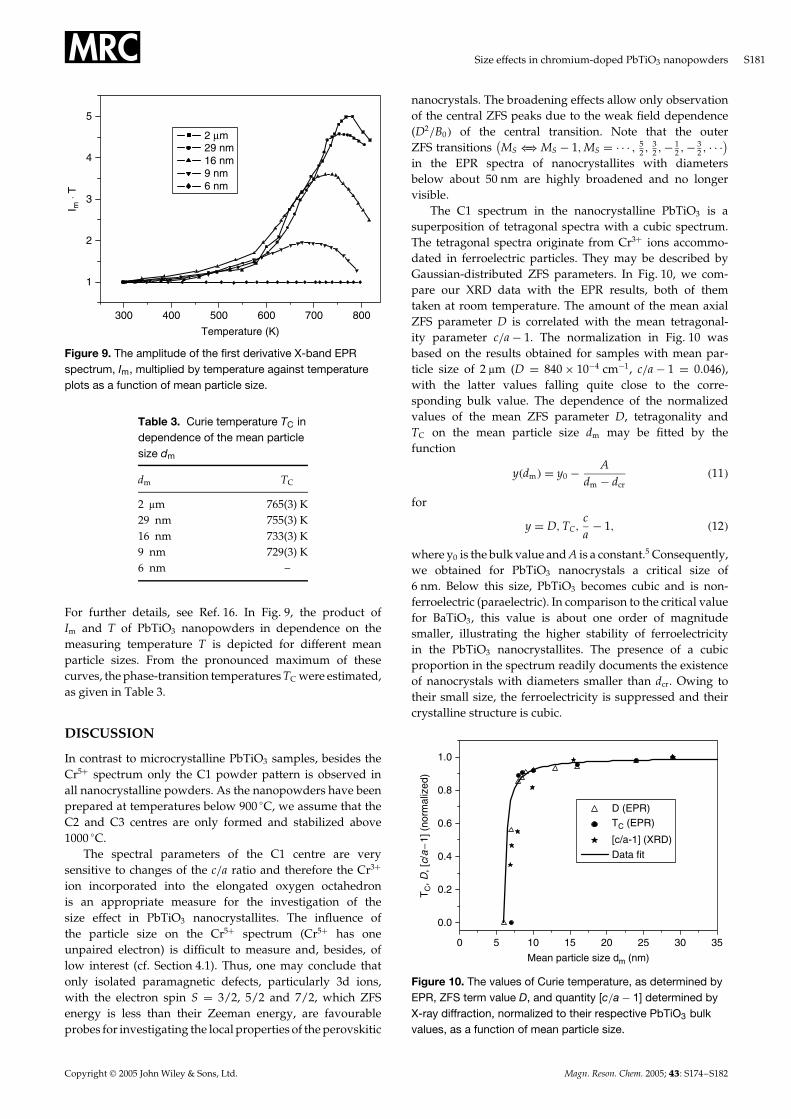
Figure 9. The amplitude of the first derivative X-band EPRspectrum, Im, multiplied by temperature against temperatureplots as a function of mean particle size.
Table 3. Curie temperature TC independence of the mean particlesize dm
dm TC
2 µm 765(3) K29 nm 755(3) K16 nm 733(3) K9 nm 729(3) K6 nm –
For further details, see Ref. 16. In Fig. 9, the product ofIm and T of PbTiO3 nanopowders in dependence on themeasuring temperature T is depicted for different meanparticle sizes. From the pronounced maximum of thesecurves, the phase-transition temperatures TC were estimated,as given in Table 3.
DISCUSSION
In contrast to microcrystalline PbTiO3 samples, besides theCr5C spectrum only the C1 powder pattern is observed inall nanocrystalline powders. As the nanopowders have beenprepared at temperatures below 900 °C, we assume that theC2 and C3 centres are only formed and stabilized above1000 °C.
The spectral parameters of the C1 centre are verysensitive to changes of the c/a ratio and therefore the Cr3C
ion incorporated into the elongated oxygen octahedronis an appropriate measure for the investigation of thesize effect in PbTiO3 nanocrystallites. The influence ofthe particle size on the Cr5C spectrum (Cr5C has oneunpaired electron) is difficult to measure and, besides, oflow interest (cf. Section 4.1). Thus, one may conclude thatonly isolated paramagnetic defects, particularly 3d ions,with the electron spin S D 3/2, 5/2 and 7/2, which ZFSenergy is less than their Zeeman energy, are favourableprobes for investigating the local properties of the perovskitic
nanocrystals. The broadening effects allow only observationof the central ZFS peaks due to the weak field dependence(D2/B0� of the central transition. Note that the outerZFS transitions
(MS ()MS � 1, MS D Ð Ð Ð , 5
2 , 32 ,� 1
2 ,� 32 , Ð Ð Ð)
in the EPR spectra of nanocrystallites with diametersbelow about 50 nm are highly broadened and no longervisible.
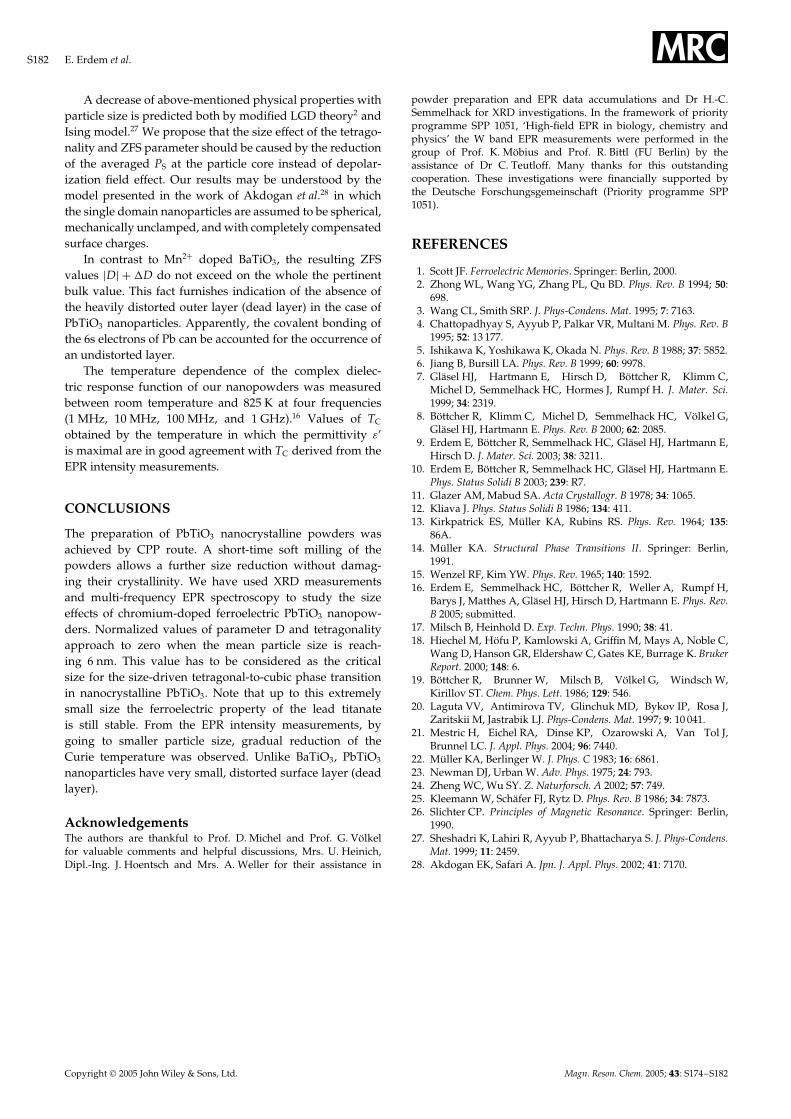
The C1 spectrum in the nanocrystalline PbTiO3 is asuperposition of tetragonal spectra with a cubic spectrum.The tetragonal spectra originate from Cr3C ions accommo-dated in ferroelectric particles. They may be described byGaussian-distributed ZFS parameters. In Fig. 10, we com-pare our XRD data with the EPR results, both of themtaken at room temperature. The amount of the mean axialZFS parameter D is correlated with the mean tetragonal-ity parameter c/a� 1. The normalization in Fig. 10 wasbased on the results obtained for samples with mean par-ticle size of 2 µm (D D 840ð 10�4 cm�1, c/a� 1 D 0.046),with the latter values falling quite close to the corre-sponding bulk value. The dependence of the normalizedvalues of the mean ZFS parameter D, tetragonality andTC on the mean particle size dm may be fitted by thefunction
y�dm� D y0 � Adm � dcr
�11�
for
y D D, TC,ca� 1, �12�
where y0 is the bulk value and A is a constant.5 Consequently,we obtained for PbTiO3 nanocrystals a critical size of6 nm. Below this size, PbTiO3 becomes cubic and is non-ferroelectric (paraelectric). In comparison to the critical valuefor BaTiO3, this value is about one order of magnitudesmaller, illustrating the higher stability of ferroelectricityin the PbTiO3 nanocrystallites. The presence of a cubicproportion in the spectrum readily documents the existenceof nanocrystals with diameters smaller than dcr. Owing totheir small size, the ferroelectricity is suppressed and theircrystalline structure is cubic.
0 5 10 15 20 25 30 35
0.0
0.2
0.4
0.6
0.8
1.0
TC, D
, [c/
a−1
] (no
rmal
ized
)
Mean particle size dm (nm)
D (EPR)TC (EPR)
[c/a-1] (XRD)
Data fit
Figure 10. The values of Curie temperature, as determined byEPR, ZFS term value D, and quantity [c/a� 1] determined byX-ray diffraction, normalized to their respective PbTiO3 bulkvalues, as a function of mean particle size.
Copyright 2005 John Wiley & Sons, Ltd. Magn. Reson. Chem. 2005; 43: S174–S182
S182 E. Erdem et al.
A decrease of above-mentioned physical properties withparticle size is predicted both by modified LGD theory2 andIsing model.27 We propose that the size effect of the tetrago-nality and ZFS parameter should be caused by the reductionof the averaged PS at the particle core instead of depolar-ization field effect. Our results may be understood by themodel presented in the work of Akdogan et al.28 in whichthe single domain nanoparticles are assumed to be spherical,mechanically unclamped, and with completely compensatedsurface charges.
In contrast to Mn2C doped BaTiO3, the resulting ZFSvalues jDj CD do not exceed on the whole the pertinentbulk value. This fact furnishes indication of the absence ofthe heavily distorted outer layer (dead layer) in the case ofPbTiO3 nanoparticles. Apparently, the covalent bonding ofthe 6s electrons of Pb can be accounted for the occurrence ofan undistorted layer.
The temperature dependence of the complex dielec-tric response function of our nanopowders was measuredbetween room temperature and 825 K at four frequencies(1 MHz, 10 MHz, 100 MHz, and 1 GHz).16 Values of TC
obtained by the temperature in which the permittivity ε’is maximal are in good agreement with TC derived from theEPR intensity measurements.
CONCLUSIONS
The preparation of PbTiO3 nanocrystalline powders wasachieved by CPP route. A short-time soft milling of thepowders allows a further size reduction without damag-ing their crystallinity. We have used XRD measurementsand multi-frequency EPR spectroscopy to study the sizeeffects of chromium-doped ferroelectric PbTiO3 nanopow-ders. Normalized values of parameter D and tetragonalityapproach to zero when the mean particle size is reach-ing 6 nm. This value has to be considered as the criticalsize for the size-driven tetragonal-to-cubic phase transitionin nanocrystalline PbTiO3. Note that up to this extremelysmall size the ferroelectric property of the lead titanateis still stable. From the EPR intensity measurements, bygoing to smaller particle size, gradual reduction of theCurie temperature was observed. Unlike BaTiO3, PbTiO3
nanoparticles have very small, distorted surface layer (deadlayer).
AcknowledgementsThe authors are thankful to Prof. D. Michel and Prof. G. Volkelfor valuable comments and helpful discussions, Mrs. U. Heinich,Dipl.-Ing. J. Hoentsch and Mrs. A. Weller for their assistance in
powder preparation and EPR data accumulations and Dr H.-C.Semmelhack for XRD investigations. In the framework of priorityprogramme SPP 1051, ‘High-field EPR in biology, chemistry andphysics’ the W band EPR measurements were performed in thegroup of Prof. K. Mobius and Prof. R. Bittl (FU Berlin) by theassistance of Dr C. Teutloff. Many thanks for this outstandingcooperation. These investigations were financially supported bythe Deutsche Forschungsgemeinschaft (Priority programme SPP1051).
REFERENCES
1. Scott JF. Ferroelectric Memories. Springer: Berlin, 2000.2. Zhong WL, Wang YG, Zhang PL, Qu BD. Phys. Rev. B 1994; 50:
698.3. Wang CL, Smith SRP. J. Phys-Condens. Mat. 1995; 7: 7163.4. Chattopadhyay S, Ayyub P, Palkar VR, Multani M. Phys. Rev. B
1995; 52: 13 177.5. Ishikawa K, Yoshikawa K, Okada N. Phys. Rev. B 1988; 37: 5852.6. Jiang B, Bursill LA. Phys. Rev. B 1999; 60: 9978.7. Glasel HJ, Hartmann E, Hirsch D, Bottcher R, Klimm C,
Michel D, Semmelhack HC, Hormes J, Rumpf H. J. Mater. Sci.1999; 34: 2319.
8. Bottcher R, Klimm C, Michel D, Semmelhack HC, Volkel G,Glasel HJ, Hartmann E. Phys. Rev. B 2000; 62: 2085.
9. Erdem E, Bottcher R, Semmelhack HC, Glasel HJ, Hartmann E,Hirsch D. J. Mater. Sci. 2003; 38: 3211.
10. Erdem E, Bottcher R, Semmelhack HC, Glasel HJ, Hartmann E.Phys. Status Solidi B 2003; 239: R7.
11. Glazer AM, Mabud SA. Acta Crystallogr. B 1978; 34: 1065.12. Kliava J. Phys. Status Solidi B 1986; 134: 411.13. Kirkpatrick ES, Muller KA, Rubins RS. Phys. Rev. 1964; 135:
86A.14. Muller KA. Structural Phase Transitions II. Springer: Berlin,
1991.15. Wenzel RF, Kim YW. Phys. Rev. 1965; 140: 1592.16. Erdem E, Semmelhack HC, Bottcher R, Weller A, Rumpf H,
Barys J, Matthes A, Glasel HJ, Hirsch D, Hartmann E. Phys. Rev.B 2005; submitted.
17. Milsch B, Heinhold D. Exp. Techn. Phys. 1990; 38: 41.18. Hiechel M, Hofu P, Kamlowski A, Griffin M, Mays A, Noble C,
Wang D, Hanson GR, Eldershaw C, Gates KE, Burrage K. BrukerReport. 2000; 148: 6.
19. Bottcher R, Brunner W, Milsch B, Volkel G, Windsch W,Kirillov ST. Chem. Phys. Lett. 1986; 129: 546.
20. Laguta VV, Antimirova TV, Glinchuk MD, Bykov IP, Rosa J,Zaritskii M, Jastrabik LJ. Phys-Condens. Mat. 1997; 9: 10 041.
21. Mestric H, Eichel RA, Dinse KP, Ozarowski A, Van Tol J,Brunnel LC. J. Appl. Phys. 2004; 96: 7440.
22. Muller KA, Berlinger W. J. Phys. C 1983; 16: 6861.23. Newman DJ, Urban W. Adv. Phys. 1975; 24: 793.24. Zheng WC, Wu SY. Z. Naturforsch. A 2002; 57: 749.25. Kleemann W, Schafer FJ, Rytz D. Phys. Rev. B 1986; 34: 7873.26. Slichter CP. Principles of Magnetic Resonance. Springer: Berlin,
1990.27. Sheshadri K, Lahiri R, Ayyub P, Bhattacharya S. J. Phys-Condens.
Mat. 1999; 11: 2459.28. Akdogan EK, Safari A. Jpn. J. Appl. Phys. 2002; 41: 7170.
Copyright 2005 John Wiley & Sons, Ltd. Magn. Reson. Chem. 2005; 43: S174–S182


![Ceramics based on calcium pyrophosphate nanopowders 19 02.pdf · 9 Processing and Application of Ceramics 7 [1] (2013) 9–14 Ceramics based on calcium pyrophosphate nanopowders Tatiana](https://img.pdfslide.us/doc/110x75/5eda4b32b3745412b571196b/ceramics-based-on-calcium-pyrophosphate-19-02pdf-9-processing-and-application.jpg)