Embed Size (px)
Citation preview
Smiu
OE
a
ARRAA
KSNAA(I
1
orufo
abTtauaMA
0h
Journal of Chromatography A, 1321 (2013) 100– 108
Contents lists available at ScienceDirect
Journal of Chromatography A
j our nal homep age: www.elsev ier .com/ locate /chroma
ize and mass determination of silver nanoparticles in an aqueousatrix using asymmetric flow field flow fractionation coupled to
nductively coupled plasma mass spectrometer andltraviolet–visible detectors
tmar Geiss ∗, Claudia Cascio, Douglas Gilliland, Fabio Franchini, Josefa Barrero-Morenouropean Commission, Joint Research Centre, Institute for Health and Consumer Protection, Via E. Fermi 2749, 21027 Ispra, VA, Italy
r t i c l e i n f o
rticle history:eceived 12 July 2013eceived in revised form 10 October 2013ccepted 20 October 2013vailable online 27 October 2013
eywords:ilveranoparticles
a b s t r a c t
The powerful antibacterial properties of engineered silver nanoparticles (AgNPs) have, in recent years,led to a great increase in their use in consumer products such as textiles and personal care products offers.This widespread and often indiscriminate use of nano-silver is inevitably increasing the probability thatsuch materials be accidentally or deliberately lost into the environment. Once present in the environmentthe normally useful antibacterial properties of the silver may instead become a potential hazard to bothman and the environment. In the face of such concerns it therefore desirable to develop easy, reliableand sensitive analytical methods for the determination of nano-sized silver in various matrices. Thispaper describes a method for the simultaneous determination of particles-size and mass-concentration
gNPsymmetric flow field flow fractionation
AF4)CP-MS
of citrate-stabilized silver nano-particles in aqueous matrices by asymmetric flow field flow fractionationcoupled to an ICP-mass spectrometer and UV/vis detector. In particular, this work has evaluated the useof pre-channel injections of mono-dispersed silver nano-particles as a means of accurate size and mass-calibration. The suitability of the method as a means to generate accurate and reliable results was verifiedby determination of parameters such as precision under repeatability conditions, linearity, accuracy,recovery and analytical sensitivity.
. Introduction
According to the current EU recommendation on the definitionf a nanomaterial [1], nanomaterials are defined as being a “natu-al, incidental or manufactured material containing particles, in annbound state or as an aggregate or as an agglomerate and where,or 50% or more of the particles in the number size distribution, oner more external dimensions is in the size range 1–100 nm”.
This definition covers naturally occurring (e.g. dust, volcanicsh), incidental nanomaterials (e.g. particulate matter from com-ustion processes) as well as engineered nanoparticles (ENPs).he use of ENPs in consumer products has strongly increased inhe last years. They are used for example in textiles, cosmeticsnd personal care products, paints and coatings, household prod-cts for cleaning, food and nutrients, electronics, photovoltaics
nd pharmaceuticals [2]. The Woodrow Wilson databank [2] as ofarch 2011, listed 1317 products or product lines containing ENPs.mong these, the most common material mentioned in the product
∗ Corresponding author. Tel.: +39 0332 786323; fax: +39 0332 786012.E-mail address: [email protected] (O. Geiss).
021-9673/$ – see front matter © 2013 Elsevier B.V. All rights reserved.ttp://dx.doi.org/10.1016/j.chroma.2013.10.060
© 2013 Elsevier B.V. All rights reserved.
descriptions is nano-silver (313 products), mostly used for antimi-crobial applications such as anti-odour sportswear, bed mattresses,socks and underwear, and wound dressings [3–5]. Due to their largespecific surface area, silver nanoparticles (AgNPs) are efficient asslow release sources of silver ions and consequently show goodantimicrobial efficacy against bacteria, viruses and other eukaryoticmicro-organisms [6–8]. For such applications, nanoparticles withsizes below 100 nm [9,10] are especially well suited. The increasingproduction and use of silver nanoparticles goes in parallel with theprobability that they deliberately or accidentally reach the envi-ronment [11–14] where their accumulation may result in a toxichazard [15].
For this reason easy, reliable and sensitive methods for thedetermination of nano-sized silver in various matrices are required.
Currently a variety of methods exist which could be applied forthe determination of nanoparticles in general and therefore alsofor nano-silver. A detailed overview of applicable techniques hasbeen prepared by the Joint Research Centre of the European Com-
mission and published in a recent reference report [16]. Linsingeret al. [16] provide a comprehensive overview of the methodswith descriptions of their operational principles and their advan-tages and disadvantages. However, none of the mentioned methods
togr. A
stootUpdarist
ehtcnd(ctqsi
caAmt
npamsncc[(ttsswdTrdnl
Ubi
abtscd4
O. Geiss et al. / J. Chroma
atisfy alone all the prerequisites, including sensitivity and selec-ivity, for the size and mass determination of AgNPs in a varietyf matrices. After detailed consideration of the possible meth-ds, asymmetric flow field flow fractionation (AF4) coupled onlineo inductively coupled plasma mass spectrometry (ICP-MS) andV/vis spectroscopy was deemed to be the most suitable andromising approach. Such systems, when combined with onlineynamic light-scattering (DLS) detectors, have shown promise as
means of verifying nanoparticle size without having to rely onetention time. Unfortunately these advantages can be fully real-zed only with relatively concentrated samples due to the limitedensitivity of DLS instruments when compared to common detec-ion methods such as UV/vis and in particular ICP-MS [17].
Although as per se the field flow fractionation (FFF) is a well-stablished technique for separating particles on the basis of theirydrodynamic diameter and ICP-MS is similarly a well-establishedechnique for selective mass quantification of metal traces, theiroupling and holistic system calibration for size and mass determi-ation remains a challenge and is currently part of lively scientificiscussions. Various strategies/approaches for size determinatione.g. empirical calibration using reference standards or theoreticalalculation according to FFF theory after calibration of reten-ion time with available size-certified bead standards) and massuantification (e.g. post-channel calibration using ionic standardolutions or nanoparticles dispersions with pre- or post-channelnjection) are feasible.
In particular, a number of recent studies report the use of FFFoupled with various detectors and then interfaced to ICP-MS as
means to address the separation, detection and quantification ofgNPs in aqueous matrices. In these reports a variety of the aboveentioned calibration strategies, used singularly or in combina-
ion, have been described [18–22].For example, Bolea et al. [18] proposed a method for the determi-
ation of the size and quantity of silver nanoparticles in consumerroducts (antiseptic and dietary supplements) by combining AF4nd ICP-MS. In this study the experimental conditions were opti-ized in terms of eluent selection and separation parameters with
ilver nanoparticles being used for size calibration of the chan-el. In order to quantify the amount of silver eluting from theolumn the authors adopted a calibration procedure based on post-hannel injection of ionic silver standard solutions. Poda et al.19] investigated the use of symmetrical field flow fractionationFFF)-interfaced to ICP-MS as a method for the selective detec-ion and characterization of silver nanoparticles in mixtures. Inhis work, the results obtained with FFF-ICP-MS were compared toize-results obtained with other techniques such as dynamic light-cattering (DLS) and electron microscopy. Size calibration in FFFas done using both NIST-traceable polystyrene bead size stan-ards and commercially available silver nanoparticle suspensions.he work of Poda was focused primarily on qualitative detectionather than on mass-calibration and quantification. The methodeveloped in this work was used in toxicity studies applied toanoparticle suspensions before and after being exposed to bio-
ogical tissue.The same approach of size calibration has been reported by
nrine et al. [22] in their study on interactions between abiotic andiotic ecosystems and the way that they influence AgNP behaviour
n aquatic environments.Hoque et al. [20] developed a method to detect and char-
cterize silver nanoparticles in aqueous matrices which wasased on AF4 with on-line detection by ultraviolet–visible spec-roscopy or inductively coupled plasma spectroscopy. In this case
ize calibration was done using silver nanoparticles capped witharboxy-functionalized polyacrylate for 10 nm and colloidal stan-ards of uncapped silver nanoparticles suspended in water for 20,0 and 60 nm. Different calibration approaches were evaluated1321 (2013) 100– 108 101
for quantification of AF4-ICP-MS measurements including externalpre-channel calibration using carboxy-functionalized polyacrylate10 nm particles and post-channel calibration with ionic silver. Themethod was applied to the analysis of wastewater collected froma wastewater treatment plant. Recently Loeschner et al. [21] pub-lished a work describing the development of a separation methodfor polyvinylpyrrolidone (PVP)-stabilized silver nanoparticles inaqueous suspensions on-line coupling AF4 to ICP-MS and detec-tors based on light absorbance. Size calibration with polystyrenenanoparticles and theoretical calculations of size based on AF4 the-ory were investigated as a means to convert the retention timesof silver nanoparticles into their corresponding sizes. Quantifica-tion of silver nanoparticles concentration was not discussed in thiswork.
Each of the cited articles examines various interesting aspects ofhow field flow fractionation coupled to ICP-MS and/or UV/vis detec-tors can be used for the characterization of silver nanoparticles inaqueous matrices, however a systematic and documented evalua-tion process for determination of method validation parameters islacking in literature.
In this study, we present a method for the simultaneousdetermination of particle-size and mass-concentration of citrate-stabilized silver nanoparticles in aqueous matrices. Size andmass-calibration are done by pre-channel injections of multi-size,multi-level monodisperse nanoparticle suspensions, thus con-structing the calibration curve and running samples under exactlythe same conditions. The ability of the method to generate accurateand reliable results was verified by determining key parameterssuch as precision under repeatability conditions, linearity, accu-racy, recovery, ruggedness and analytical sensitivity.
2. Materials and methods
2.1. Instrumentation
2.1.1. Asymmetric flow field flow fractionation system (AF4) anddetectors
The asymmetric flow field flow fractionation system used inthis study was an AF2000 model (Postnova Analytics, Lands-berg, Germany). The channel used was an analytical AF4 cartridge(325 mm × 60 mm) with a channel length of 280 mm. The channel(spacer) thickness was 350 �m. The semi-permeable membraneused as the accumulation wall was composed of regenerated cel-lulose with a 10 kDa molecular cut-off. The injection loop volumewas 50 �L.
2.1.2. Detectors2.1.2.1. UV/vis detector. The fractionation system was coupled on-line to a SPD-20AV UV/vis detector (Postnova Analytics, Landsberg,Germany) which was set at a wavelength of 420 nm. The spe-cific spectral response of spherical silver nanoparticles varies asa function of their diameter and exhibit peak maxima varying fromaround 395-400 nm for small (<10 nm) particles to over 500 nm forparticles of 100 nm size. In this study a value of 420 nm was chosenas an effective compromise wavelength able to detect particle withsizes across the range of 10-110 nm but with the highest sensitivityin the lower size-range. A limitation of using the UV/vis detector isthe very low specific absorption of silver nanoparticles larger than110 nm.
2.1.2.2. ICP-MS. An Agilent 7700x ICP-MS system (Agilent Tech-
nologies, Santa Clara, USA) equipped with quartz nebulizer andspray chamber was connected online to the AF4 and operated intime resolved acquisition mode. A schematic of the complete AF4-UV/vis-ICP-MS set-up used in this study is represented in Fig. 1.
102 O. Geiss et al. / J. Chromatogr. A 1321 (2013) 100– 108
F ; nebuv ure.
(Tlt0a5aa(
pIme
2
psa1aas
a2
sfsactattetB
ig. 1. Scheme of AF4-UV/vis-ICP-MS interface; detector flow on AF4 is 0.5 mL min−1
olume was aspirated from a make-up solution of 5% nitric acid indicated in the fig
Immediately after leaving the UV/vis detector the eluent0.5 mL min−1) was acidified with a 5% nitric acid solution via a-connector. The acidification step was done by setting the ana-yte peristaltic pump at a slightly higher flow rate (0.6 mL min−1)han the output from the AF4 column thus allowing the additional.1 mL min−1 of liquid to be aspirated from a reservoir of 5% nitriccid solution via the T-connector. Rhodium at a concentration of0 �g L−1 in 1% nitric acid was used as internal standard and wasdded online via the nebulizer dual peristaltic pump. Monitorednalytical masses were 107 and 109 for silver and 103 for rhodiuminternal standard).
AF4 and ICP-MS were disconnected in between runs to allowurging and cleaning of the AF4 and a simultaneous cleaning of the
CP-MS with 2-5% nitric acid. Background counts of Ag-107 wereonitored till an acceptable and stable level was reached before
ach new injection.
.2. Nanosilver particles
Near-monodispersed citrate stabilized silver nanoparticle dis-ersions of declared size and concentration (20 mg L−1) wereupplied by Sigma–Aldrich (Sigma–Aldrich Corp., St. Louis, USA;vailable particle diameters: 10 nm, 20 nm, 40 nm, 60 nm and00 nm) and by Ted-Pella (Ted Pella Inc., Redding, USA; NanoX-ct; available particle diameters: 20–110 nm in 10 nm steps). Tovoid silver particle degradation or precipitation, dispersions weretored at 4 ◦C and protected from prolonged exposure to light.
Particles provided by both companies were negatively chargednd had zeta-potentials in the range −40 mV to −50 mV (at pH 7 in
mM aqueous sodium citrate solution).Although nominal concentration values were provided by the
uppliers, these were not sold as reference standards and the manu-acturer declared concentrations of 20 mg L−1 were not found to beufficiently reliable for direct use in mass-calibration. Consequentlyll the silver particle standard suspensions used in this study wereharacterized in terms of both ionic and particulate silver concen-ration before use. ICP-MS was used to determine (a) the total silvernd (b) ionic silver in the stock-solutions with the amount par-iculate silver being obtained by subtraction [23]. To determine
he content of ionic silver in the stock suspensions, samples ofach batch of material were subjected to centrifugal ultrafiltra-ion (3 kDa Amicon Ultracel Centrifugal Filter Unit, Merck Milliporeillerica, USA) and the resulting filtrate analyzed by ICP-MS [24].lizer peristaltic pump is set at 0.2 rps corresponding to 0.6 mL min−1 – the remaining
Preparation was done in triplicate. As a further control of themethodology the recovery of ionic silver from the filter unit wasdetermined by filtration of a 400 �g L−1 ionic silver solution fol-lowed by quantification of silver in the filtrate. The recovery of ionicsilver was found to be around 90%. The detailed description of themethod is reported under supplementary data [SD.1].
In the current study the effective concentrations of nano-silverstock suspensions ranged from 13 to 20 mg L−1 independently ofthe manufacturer and size while the content of ionic silver rangedfrom 0.1 to 0.9% of the total silver. This level of ionic silver wasdeemed to be negligible for the scope of the present study.
Declared particle diameters were verified by using ScanningTransmission Electron Microscopy (STEM) and Centrifugal LiquidSedimentation (CLS). From the CLS analysis of the single sizes, thelevel of monodispersivity was found to be good and the measuredsizes corresponded well with those declared by the manufacturers.The absolute sizes as determined by STEM were consistent withmanufacturers’ declaration.
2.3. Development and optimization of silver nanoparticlesseparation with AF4
Parameters directly influencing separation of nanoparticleswith AF4 are [25]:
- Channel spacer thickness (channel height).- Flow conditions (tip flow, focus flow, cross-flow).- Eluent used (pH, ion strength, temperature, viscosity).- Membrane material.- Type of particles (surface chemistry/coating).
As described earlier a standard channel thickness spacer of350 �m was used for all runs in the current study. Based on thework done in precedent studies [19,20] membranes of regeneratedcellulose were chosen for all runs.
In practice it was found that each new channel membrane couldbe used for least 50 analysis runs before separation efficiency wascompromised and replacement become necessary. Each time themembrane was substituted it was necessary to do a precondition-
ing step in which silver particles were injected repeatedly till stableand reproducible elutions of silver were observed by UV signal.In the current study carrier liquid composition and pH as wellas a number of flow conditions were tested and optimized.
togr. A
2
rno
----
ip1o
2
dr
(
(
(
ta4
2
daowd
2
ipai
2r
cccasstpe
O. Geiss et al. / J. Chroma
.3.1. Selection of carrier liquid compositionThe correct choice of eluent liquid is important to achieving a
eproducible and quantitative fractogram using AF4. To this end, aumber of eluents were tested in this study, including some previ-usly reported in the literature for silver nanoparticles:
0.01% sodium dodecyl sulfate (SDS) adjusted at pH 8 [18]. Ultrapure water [20]. 20% methanol. 0.02% Novachem® (Postnova Analytics, Landsberg, Germany)(Novachem® is a mixture of non-ionic and ionic detergents).
The quality of separation for each eluent was assessed bynjecting a mixture of silver nanoparticles (Sigma–Aldrich) com-osed of c(Ag 20 nm, 40 nm and 60 nm) = 450 �g L−1 and c(Ag00 nm) = 5000 �g L−1 and running an elution profile similar to theptimized one described under Section 2.3.2.
.3.2. Development of AF4 method (elution profile)For this study an optimized focusing and elution profile was
eveloped to achieve controlled separation over the particle sizeange of 10-110 nm with minimum loss of analyte material.
The optimization process included 3 steps:
a) careful adjustment of the injection/focussing time was done tominimize the potential loss of material in the void peak – acommon source of material loss through non-specific elution;
b) a clear separation of void peak from AgNP 10 nm peak wasobtained by adjusting the initial cross-flow;
c) optimization of the peak separation and resolution for all othernanoparticle species was achieved primarily by adjusting thecross-flow gradient.
At a constant detector flow of 0.5 mL min−1, various injec-ion/focusing times and initial cross flow rates were tested injecting
mixture of silver nanoparticles composed of c(Ag 10 nm, 20 nm,0 nm and 60 nm) = 450 �g L−1 and c(Ag 100 nm) = 5000 �g L−1.
.4. Method characterization
Following optimization of the separation conditions asescribed in Sections 2.3, 3.1 and 3.2, the method was subjected to
detailed characterization of its analytical performance. This stagef the study was conducted using an eluent solution of ultrapureater adjusted to a pH of 9.3 with NaOH. The choice of eluent isiscussed in more detail later in Section 3.1.
.4.1. Particle size calibrationIn this method the size calibration was done by singularly
njecting mono-dispersed silver nanoparticle dispersions (2.2) and,lotting the known particle size against resulting elution timesnd determining the curve-fitting equation. The concentration ofnjected dispersions was 400 �g L−1.
.4.2. Pre-column mass-calibration and verification ofesponse-linearity
Mass-calibration was done by performing a series of pre-hannel injections of silver nano-particle dispersions with knownoncentration (2.2) (range from 0 to 1000 �g L−1) and plotting theseoncentrations against the relative signals obtained by the UV/visnd ICP-MS detectors. Each calibration point was measured usingame experimental parameters and elution profiles as used in the
tandard separation procedure. Compared to post-channel calibra-ion with ionic silver solutions, pre-channel calibration with silverarticles had the advantage of producing calibration curves underxactly the same conditions as a sample-run hence compensating1321 (2013) 100– 108 103
for possible losses due to interactions between the analyte particlesand the semi permeable membrane and/or other wetted surfacesin the flow path of the instrument.
2.4.3. Limit of detection/quantificationTo determine the limits of detection and quantification,
a series of standard dispersions with decreasing concentra-tion (range 1000–5 �g L−1 for particle sizes below 100 nm and15,000–50 �g L−1 for particles larger than 100 nm) were injected.The limit of detection (LOD) was determined as the lowest con-centration that could be detected (Signal-to-noise ratio 3:1) andthe limit of quantification (LOQ) as the lowest concentration thatcould be determined (Signal-to-noise ratio 10:1).
2.4.4. Determination of trueness and repeatability for silvermass-concentration
Trueness, defined as the closeness of agreement between atest result and the accepted reference value and repeatability,defined as the closeness of agreement between repeat-edly injected test samples were investigated. Nanoparticledispersions containing particles of one size of known con-centration (c(Ag10 nm/20 nm/40 nm/60 nm) = 400 �g L−1 andc(Ag100 nm) = 4000 �g L−1) were prepared, injected 5 times eachand quantified against calibration curves. Concentrations werethen compared with the theoretically calculated concentrationvalue and the 95% confidence interval was calculated. These testswere conducted with the UV/vis detector only.
2.4.5. Recovery-experiments: possible interactions betweennanoparticles and the permeation membrane
The possible loss of sample materials due to interactionsbetween the silver nanoparticles and the permeation membrane orother wetted surfaces in the channel was investigated by repeat-edly (5 times) injecting single particle-size containing dispersions(10 nm/20 nm/40 nm/60 nm or 100 nm) of known concentration(1.8 mg L−1) with and without applying cross-flow and comparingthe resulting peak-areas. For injections with cross-flow, the areataken for comparison was the sum of the void peak and the ana-lyte peak. For these tests the UV/vis detector was used as it allowedselective detection of silver particles whereas ICP-MS cannot dis-criminate ions from particles.
2.5. Application of method on trimodal sample of knownconcentration
A dispersion containing silver nanoparticles of three differentsizes of known concentration was prepared starting from near-monodispersed nanoparticle dispersions of experimentally verifiedsize and concentration (Section 2.2). This dispersion was injectedin duplicate and quantified against external silver nanopar-ticle calibration curves with both online-UV/vis and ICP-MS.Calibration curves were in the range 0–1000 �g L−1. Concentra-tions in the trimodal mixture were: c(Ag10 nm) = 201.5 �g L−1,c(Ag50 nm) = 100.7 �g L−1 and c(Ag100 nm) = 806.4 �g L−1. Recov-eries against the theoretical values were calculated and evaluated.
3. Results and discussion
3.1. Selection of carrier liquid composition
The addition of an anionic surfactant SDS (0.01%) or commercial
surfactant mixture Novachem® (0.02%) to ultrapure water did notshow any significant improvement in separation of a dispersioncontaining silver particles of 20, 40, 60 and 100 nm in size comparedto using basified ultrapure water only. In both cases the 40 nm and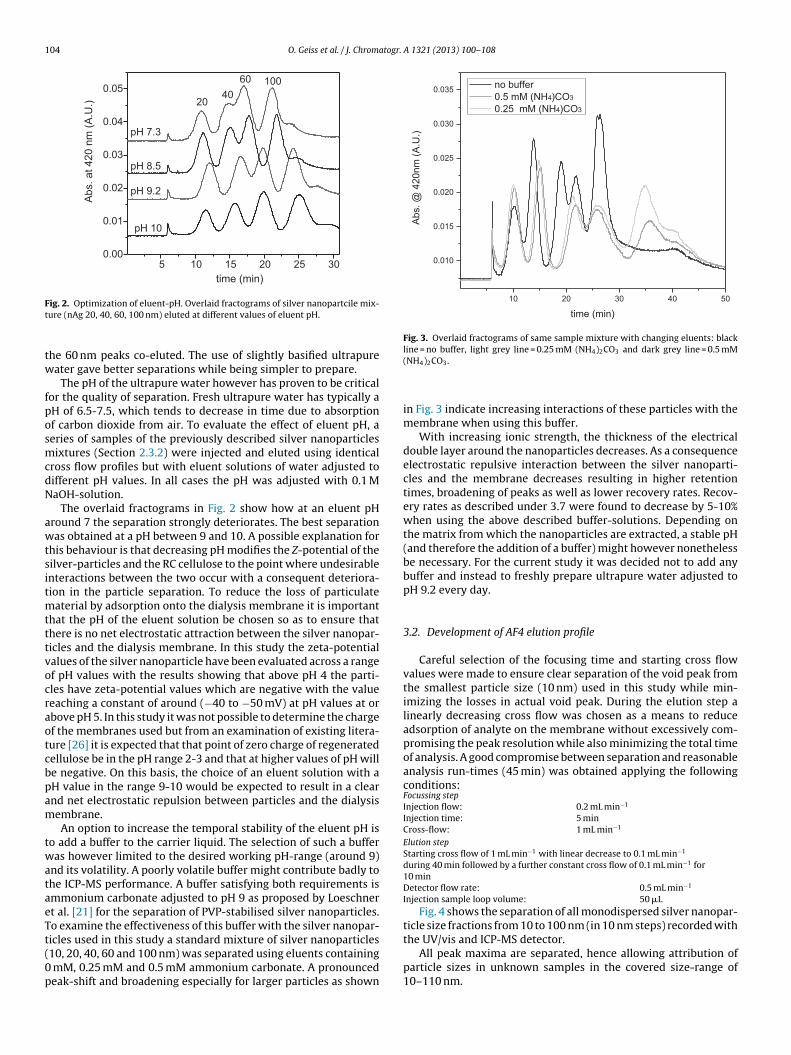
104 O. Geiss et al. / J. Chromatogr. A 1321 (2013) 100– 108
5 10 15 20 25 300.00
0.01
0.02
0.03
0.04
0.0510060
40
pH 8.5
pH 7.3
pH 9.2
Abs
. at 4
20 n
m (A
.U.)
time (min)
pH 10
20
Ft
tw
fposmcdN
awtsitmtttvocraotcbpam
twataeTt(0p
10 20 30 40 50
0.010
0.015
0.020
0.025
0.030
0.035
Abs
. @ 4
20nm
(A.U
.)
time (min)
no buffer 0.5 mM (NH 4)CO 3
0.25 mM (NH 4)CO 3
Fig. 3. Overlaid fractograms of same sample mixture with changing eluents: blackline = no buffer, light grey line = 0.25 mM (NH ) CO and dark grey line = 0.5 mM
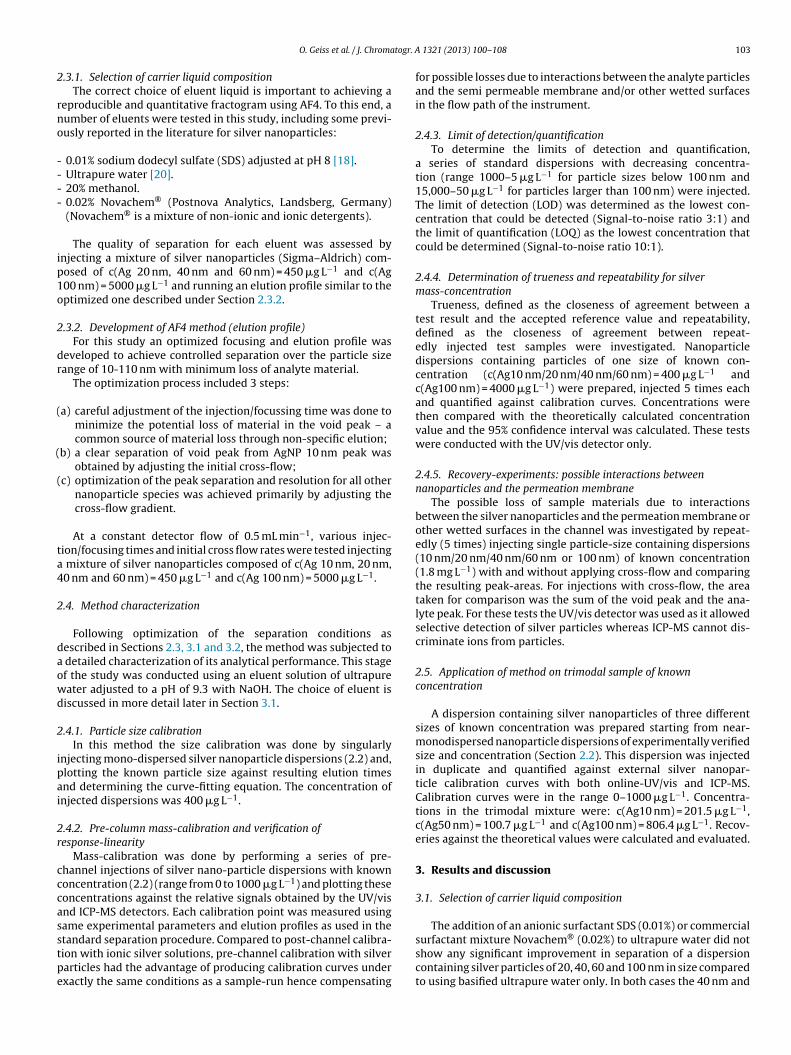
ig. 2. Optimization of eluent-pH. Overlaid fractograms of silver nanopartcile mix-ure (nAg 20, 40, 60, 100 nm) eluted at different values of eluent pH.
he 60 nm peaks co-eluted. The use of slightly basified ultrapureater gave better separations while being simpler to prepare.
The pH of the ultrapure water however has proven to be criticalor the quality of separation. Fresh ultrapure water has typically aH of 6.5-7.5, which tends to decrease in time due to absorptionf carbon dioxide from air. To evaluate the effect of eluent pH, aeries of samples of the previously described silver nanoparticlesixtures (Section 2.3.2) were injected and eluted using identical
ross flow profiles but with eluent solutions of water adjusted toifferent pH values. In all cases the pH was adjusted with 0.1 MaOH-solution.
The overlaid fractograms in Fig. 2 show how at an eluent pHround 7 the separation strongly deteriorates. The best separationas obtained at a pH between 9 and 10. A possible explanation for
his behaviour is that decreasing pH modifies the Z-potential of theilver-particles and the RC cellulose to the point where undesirablenteractions between the two occur with a consequent deteriora-ion in the particle separation. To reduce the loss of particulate
aterial by adsorption onto the dialysis membrane it is importanthat the pH of the eluent solution be chosen so as to ensure thathere is no net electrostatic attraction between the silver nanopar-icles and the dialysis membrane. In this study the zeta-potentialalues of the silver nanoparticle have been evaluated across a rangef pH values with the results showing that above pH 4 the parti-les have zeta-potential values which are negative with the valueeaching a constant of around (−40 to −50 mV) at pH values at orbove pH 5. In this study it was not possible to determine the chargef the membranes used but from an examination of existing litera-ure [26] it is expected that that point of zero charge of regeneratedellulose be in the pH range 2-3 and that at higher values of pH wille negative. On this basis, the choice of an eluent solution with aH value in the range 9-10 would be expected to result in a clearnd net electrostatic repulsion between particles and the dialysisembrane.An option to increase the temporal stability of the eluent pH is
o add a buffer to the carrier liquid. The selection of such a bufferas however limited to the desired working pH-range (around 9)
nd its volatility. A poorly volatile buffer might contribute badly tohe ICP-MS performance. A buffer satisfying both requirements ismmonium carbonate adjusted to pH 9 as proposed by Loeschnert al. [21] for the separation of PVP-stabilised silver nanoparticles.o examine the effectiveness of this buffer with the silver nanopar-icles used in this study a standard mixture of silver nanoparticles
10, 20, 40, 60 and 100 nm) was separated using eluents containingmM, 0.25 mM and 0.5 mM ammonium carbonate. A pronouncedeak-shift and broadening especially for larger particles as shown
4 2 3
(NH4)2CO3.
in Fig. 3 indicate increasing interactions of these particles with themembrane when using this buffer.
With increasing ionic strength, the thickness of the electricaldouble layer around the nanoparticles decreases. As a consequenceelectrostatic repulsive interaction between the silver nanoparti-cles and the membrane decreases resulting in higher retentiontimes, broadening of peaks as well as lower recovery rates. Recov-ery rates as described under 3.7 were found to decrease by 5-10%when using the above described buffer-solutions. Depending onthe matrix from which the nanoparticles are extracted, a stable pH(and therefore the addition of a buffer) might however nonethelessbe necessary. For the current study it was decided not to add anybuffer and instead to freshly prepare ultrapure water adjusted topH 9.2 every day.
3.2. Development of AF4 elution profile
Careful selection of the focusing time and starting cross flowvalues were made to ensure clear separation of the void peak fromthe smallest particle size (10 nm) used in this study while min-imizing the losses in actual void peak. During the elution step alinearly decreasing cross flow was chosen as a means to reduceadsorption of analyte on the membrane without excessively com-promising the peak resolution while also minimizing the total timeof analysis. A good compromise between separation and reasonableanalysis run-times (45 min) was obtained applying the followingconditions:Focussing stepInjection flow: 0.2 mL min−1
Injection time: 5 minCross-flow: 1 mL min−1
Elution stepStarting cross flow of 1 mL min−1 with linear decrease to 0.1 mL min−1
during 40 min followed by a further constant cross flow of 0.1 mL min−1 for10 minDetector flow rate: 0.5 mL min−1
Injection sample loop volume: 50 �LFig. 4 shows the separation of all monodispersed silver nanopar-
ticle size fractions from 10 to 100 nm (in 10 nm steps) recorded withthe UV/vis and ICP-MS detector.
All peak maxima are separated, hence allowing attribution ofparticle sizes in unknown samples in the covered size-range of10–110 nm.
O. Geiss et al. / J. Chromatogr. A 1321 (2013) 100– 108 105
F etectoe ze of e
3
imc
tdtpPttptrn
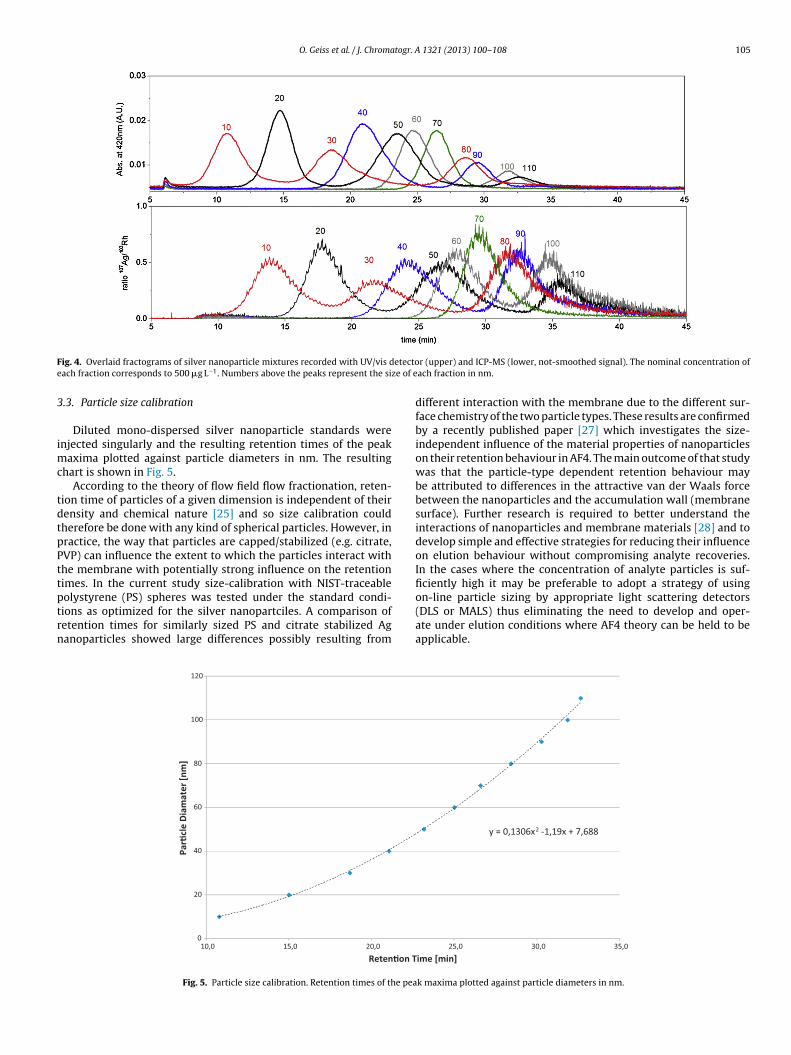
ig. 4. Overlaid fractograms of silver nanoparticle mixtures recorded with UV/vis dach fraction corresponds to 500 �g L−1. Numbers above the peaks represent the si
.3. Particle size calibration
Diluted mono-dispersed silver nanoparticle standards werenjected singularly and the resulting retention times of the peak
axima plotted against particle diameters in nm. The resultinghart is shown in Fig. 5.
According to the theory of flow field flow fractionation, reten-ion time of particles of a given dimension is independent of theirensity and chemical nature [25] and so size calibration couldherefore be done with any kind of spherical particles. However, inractice, the way that particles are capped/stabilized (e.g. citrate,VP) can influence the extent to which the particles interact withhe membrane with potentially strong influence on the retentionimes. In the current study size-calibration with NIST-traceable
olystyrene (PS) spheres was tested under the standard condi-ions as optimized for the silver nanopartciles. A comparison ofetention times for similarly sized PS and citrate stabilized Aganoparticles showed large differences possibly resulting from0
20
40
60
80
100
120
10,0 15,0 20,0
Par�
cle
Diam
ater
[nm
]
Reten�on T
Fig. 5. Particle size calibration. Retention times of the pea
r (upper) and ICP-MS (lower, not-smoothed signal). The nominal concentration ofach fraction in nm.
different interaction with the membrane due to the different sur-face chemistry of the two particle types. These results are confirmedby a recently published paper [27] which investigates the size-independent influence of the material properties of nanoparticleson their retention behaviour in AF4. The main outcome of that studywas that the particle-type dependent retention behaviour maybe attributed to differences in the attractive van der Waals forcebetween the nanoparticles and the accumulation wall (membranesurface). Further research is required to better understand theinteractions of nanoparticles and membrane materials [28] and todevelop simple and effective strategies for reducing their influenceon elution behaviour without compromising analyte recoveries.In the cases where the concentration of analyte particles is suf-ficiently high it may be preferable to adopt a strategy of using
on-line particle sizing by appropriate light scattering detectors(DLS or MALS) thus eliminating the need to develop and oper-ate under elution conditions where AF4 theory can be held to beapplicable.y = 0,1306x2 -1,19x + 7,688
25,0 30,0 35,0
ime [min]
k maxima plotted against particle diameters in nm.

106 O. Geiss et al. / J. Chromatogr.
R² = 0,999
R² = 0,9994
R² = 0,9971
0
20
40
60
80
100
120
140
0 200 400 600 800 1000 1200
Area
[AU
]
Concentra�on [μg L-1]
Ag10 nm
Ag50 nm
Ag100 nm
R² = 0,9867
R² = 0,9953
R² = 0,9969
0
20000000
40000000
60000000
80000000
100000000
120000000
140000000
0 200 400 600 800 1000 1200
Area
[AU
]
Concentra�on [μg L-1 ]
Ag10 nm
Ag50 nm
Ag100 nm
Ff
3
1r
d4twt
siapqr
3
tdirsf
sM
ig. 6. Calibration curves recorded with UV/vis detector (upper) and ICP-MS (lower)or isotope 107Ag.
.4. Mass-calibration and linearity
Fig. 6 shows mass calibration curves for 10 nm, 50 nm and00 nm silver particles recorded with UV/vis and ICP-MS detectorsespectively.
In addition to silver particles of 10 nm, 50 nm and 100 nm iniameter, calibration curves were also generated for silver 20 nm,0 nm and 60 nm as well however only using the UV/vis detec-or. Average correlation coefficients of the linear regression curvesere 0.996 ± 0.004 and 0.993 ± 0.005 for UV/vis and ICP-MS detec-
ion respectively.In contrast to post-channel mass-calibration with ionic silver
olutions, pre-channel mass-calibration with particles does takento account possible material-losses in the channel or tubingnd/or differences in recoveries due to material losses on the semi-ermeable membrane. Calibrations curves can directly be used foruantification without the need to apply correction factors to theesults.
.5. Limit of detection and quantification
The UV/vis spectral response of silver nanoparticles as a func-ion of diameter is variable and decreases with increasing particleiameter. This has to be taken into consideration when determin-
ng the limit of quantification using a UV/vis detector. The detectoresponse when using ICP-MS is mostly independent of the particleize. Table 1 shows the detection and quantification limits obtained
or both UV/vis and ICP-MS.Bolea et al. [18] determined a quantification limit of 5.6 �g L−1
ilver using a 20 �L injection loop and quantifying with ICP-S. Poda et al. [19] injected 50 �L and found a detection limit
A 1321 (2013) 100– 108
of 10 �g L−1 for detection with ICP-MS. In a very recently pub-lished work, Bednar et al. [17] determined a detection limit of10 �g L−1 for ICP-MS with an injection volume of 100 �L. Gener-ally detection/quantification limits determined in the current workfor ICP-MS are comparable with those found in other works. Differ-ences can partly be attributed to differing injection volumes and/ordiffering instrumental performance characteristics and set-up suchas the type of nebulizer used.
In evaluating the quantification limits determined in this workit is relevant to place them in the context by comparing them withlevels of silver contamination actually observed or predicted instudies of environmental samples. Blaser et al. [29] conducted astudy on the analysis of risk to freshwater ecosystems from silverreleased from silver nanoparticles incorporated into textiles andplastics. The study included the assessment of the fate of silverin a river system and the estimation of predicted environmentalconcentrations (PECs). The assessment was based on estimated sil-ver use in the year 2010 in the European Union, focussing on theRhine river as a case study. Predicted environmental concentrationswere modelled for a minimum, intermediate and a maximum sce-nario and ranged from 2 to 18 �g L−1 in a sewage treatment plant.Another study [30] reports concentrations in a range of 2–4 �g L−1
in three sewage treatment plants treating common wastewaterand 24–105 �g L−1 in two plants receiving high silver loadingsfrom industrial discharges. In summary the concentration of silvernanoparticles does vary in time and with location. In those caseswhere the quantification limit determined in the current study isabove or very close to the silver nanoparticle concentration of thesample, a bigger injection volume could be applied.
3.6. Determination of trueness and repeatability precision
Repeated injections (n = 5) of colloidal suspensions containingknown concentration of silver nanoparticles were evaluated interms of trueness and repeatability precision. Results are shownin Table 2.
Trueness was determined by applying the t-test (p = 95%). Aver-age silver concentrations for each size were compared to theirtheoretical concentrations. t-Values were calculated by applyingthe following equation:
t = |X − �|s
√n (1)
where X is the average concentration of the 5 replicate mea-surements, � is the theoretical “should” value, s is the standarddeviation of the 5 replicate measurements and n is the number ofreplicate measurements. The resulting t-value is compared with thet-value taken from t-tables. Average concentrations lie within theconfidence interval of 95%, when the calculated t-value is smallerthan the t-value from the table. Except for silver particles of 40 nmdiameter t-values are all within the 95% confidence interval and aretherefore adequately accurate.
3.7. Recovery-experiments: possible interactions betweennanoparticles and the permeation membrane
Median recoveries of 5 replicates were found to range from69.5% up to 97.7% (Fig. 7). The non-parametric approach used toassess variance in recovery (Kurskal–Wallis test) at a 5% level of sig-nificance, revealed a significant difference among the five groups(p-value = 0.0042, degree of freedom 4). The significantly differinggroup was identified by re-running the Kurskal–Wallis test with
only 4 groups until the null hypothesis was not rejected. This wasachieved by excluding the 100 nm data series (p-value of >0.05) anddemonstrated that recovery for 100 nm particles was significantlylower compared to all other particle sizes.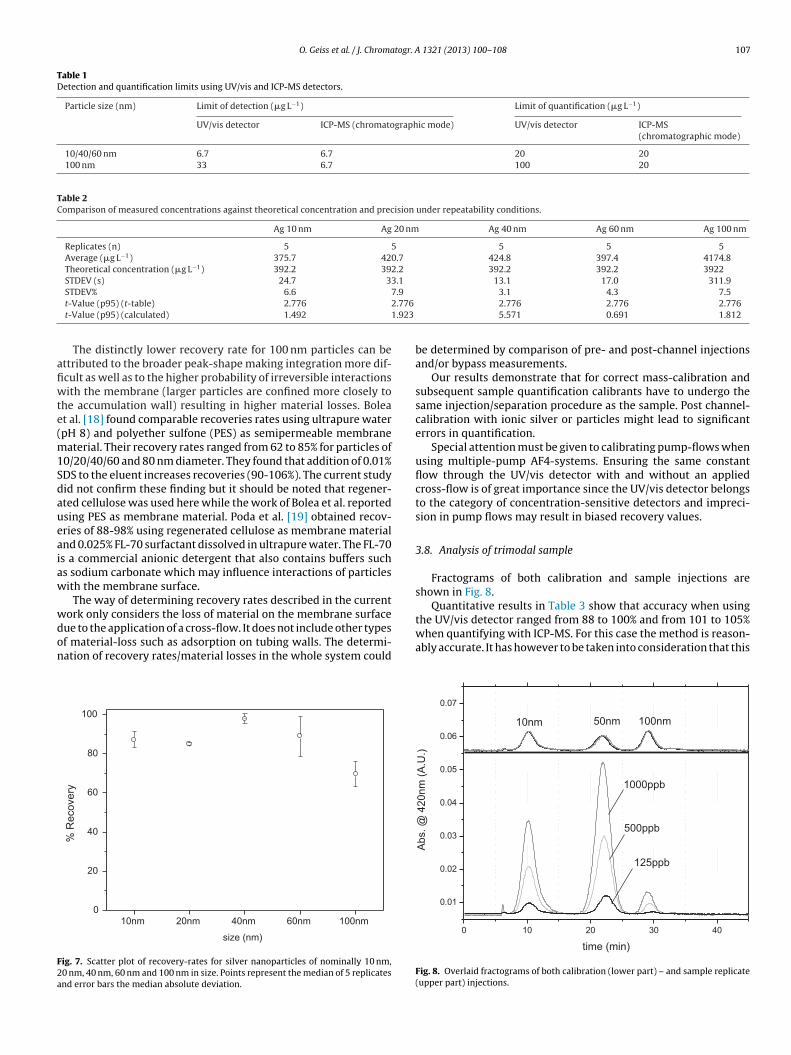
O. Geiss et al. / J. Chromatogr. A 1321 (2013) 100– 108 107
Table 1Detection and quantification limits using UV/vis and ICP-MS detectors.
Particle size (nm) Limit of detection (�g L−1) Limit of quantification (�g L−1)
UV/vis detector ICP-MS (chromatographic mode) UV/vis detector ICP-MS(chromatographic mode)
10/40/60 nm 6.7 6.7 20 20100 nm 33 6.7 100 20
Table 2Comparison of measured concentrations against theoretical concentration and precision under repeatability conditions.
Ag 10 nm Ag 20 nm Ag 40 nm Ag 60 nm Ag 100 nm
Replicates (n) 5 5 5 5 5Average (�g L−1) 375.7 420.7 424.8 397.4 4174.8Theoretical concentration (�g L−1) 392.2 392.2 392.2 392.2 3922STDEV (s) 24.7 33.1 13.1 17.0 311.9
7.9
2.776
1.923
afiwte(m1Sdaueaiaw
wdon
F2a
the UV/vis detector ranged from 88 to 100% and from 101 to 105%
STDEV% 6.6
t-Value (p95) (t-table) 2.776
t-Value (p95) (calculated) 1.492
The distinctly lower recovery rate for 100 nm particles can bettributed to the broader peak-shape making integration more dif-cult as well as to the higher probability of irreversible interactionsith the membrane (larger particles are confined more closely to
he accumulation wall) resulting in higher material losses. Boleat al. [18] found comparable recoveries rates using ultrapure waterpH 8) and polyether sulfone (PES) as semipermeable membrane
aterial. Their recovery rates ranged from 62 to 85% for particles of0/20/40/60 and 80 nm diameter. They found that addition of 0.01%DS to the eluent increases recoveries (90-106%). The current studyid not confirm these finding but it should be noted that regener-ted cellulose was used here while the work of Bolea et al. reportedsing PES as membrane material. Poda et al. [19] obtained recov-ries of 88-98% using regenerated cellulose as membrane materialnd 0.025% FL-70 surfactant dissolved in ultrapure water. The FL-70s a commercial anionic detergent that also contains buffers suchs sodium carbonate which may influence interactions of particlesith the membrane surface.
The way of determining recovery rates described in the currentork only considers the loss of material on the membrane surfaceue to the application of a cross-flow. It does not include other types
f material-loss such as adsorption on tubing walls. The determi-ation of recovery rates/material losses in the whole system could10nm 20nm 40nm 60nm 100nm0
20
40
60
80
100
% R
ecov
ery
size (nm)
ig. 7. Scatter plot of recovery-rates for silver nanoparticles of nominally 10 nm,0 nm, 40 nm, 60 nm and 100 nm in size. Points represent the median of 5 replicatesnd error bars the median absolute deviation.
3.1 4.3 7.52.776 2.776 2.7765.571 0.691 1.812
be determined by comparison of pre- and post-channel injectionsand/or bypass measurements.
Our results demonstrate that for correct mass-calibration andsubsequent sample quantification calibrants have to undergo thesame injection/separation procedure as the sample. Post channel-calibration with ionic silver or particles might lead to significanterrors in quantification.
Special attention must be given to calibrating pump-flows whenusing multiple-pump AF4-systems. Ensuring the same constantflow through the UV/vis detector with and without an appliedcross-flow is of great importance since the UV/vis detector belongsto the category of concentration-sensitive detectors and impreci-sion in pump flows may result in biased recovery values.
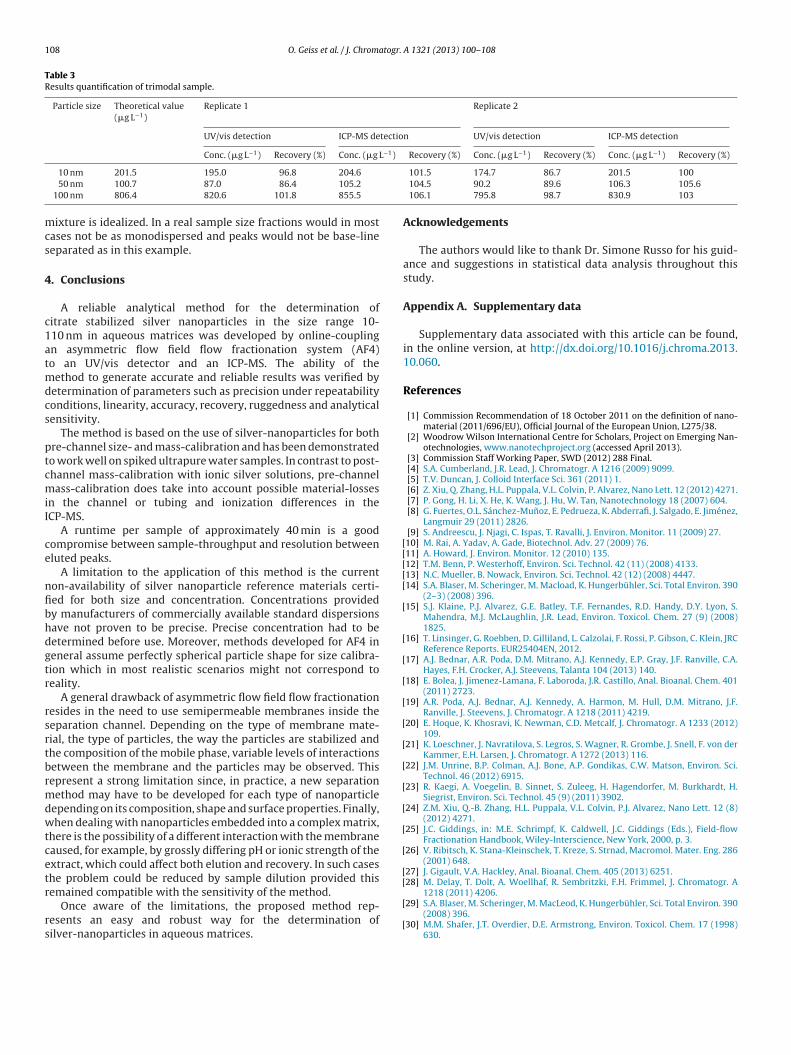
3.8. Analysis of trimodal sample
Fractograms of both calibration and sample injections areshown in Fig. 8.
Quantitative results in Table 3 show that accuracy when using
when quantifying with ICP-MS. For this case the method is reason-ably accurate. It has however to be taken into consideration that this
0 10 20 30 40
0.01
0.02
0.03
0.04
0.05
0.06
0.07
1000ppb
500ppb
100nm
Abs
. @ 4
20nm
(A.U
.)
time (min)
10nm 50nm
125ppb
Fig. 8. Overlaid fractograms of both calibration (lower part) – and sample replicate(upper part) injections.
108 O. Geiss et al. / J. Chromatogr. A 1321 (2013) 100– 108
Table 3Results quantification of trimodal sample.
Particle size Theoretical value(�g L−1)
Replicate 1 Replicate 2
UV/vis detection ICP-MS detection UV/vis detection ICP-MS detection
Conc. (�g L−1) Recovery (%) Conc. (�g L−1) Recovery (%) Conc. (�g L−1) Recovery (%) Conc. (�g L−1) Recovery (%)
mcs
4
c1atmdcs
ptcmiI
ce
nfibhdgtr
rsrtbrmdwtcetr
rs
[[[[[
[
[
[
[
[
[
[
[
[
[
[
[
[[
10 nm 201.5 195.0 96.8 204.6
50 nm 100.7 87.0 86.4 105.2
100 nm 806.4 820.6 101.8 855.5
ixture is idealized. In a real sample size fractions would in mostases not be as monodispersed and peaks would not be base-lineeparated as in this example.
. Conclusions
A reliable analytical method for the determination ofitrate stabilized silver nanoparticles in the size range 10-10 nm in aqueous matrices was developed by online-couplingn asymmetric flow field flow fractionation system (AF4)o an UV/vis detector and an ICP-MS. The ability of the
ethod to generate accurate and reliable results was verified byetermination of parameters such as precision under repeatabilityonditions, linearity, accuracy, recovery, ruggedness and analyticalensitivity.
The method is based on the use of silver-nanoparticles for bothre-channel size- and mass-calibration and has been demonstratedo work well on spiked ultrapure water samples. In contrast to post-hannel mass-calibration with ionic silver solutions, pre-channelass-calibration does take into account possible material-losses
n the channel or tubing and ionization differences in theCP-MS.
A runtime per sample of approximately 40 min is a goodompromise between sample-throughput and resolution betweenluted peaks.
A limitation to the application of this method is the currenton-availability of silver nanoparticle reference materials certi-ed for both size and concentration. Concentrations providedy manufacturers of commercially available standard dispersionsave not proven to be precise. Precise concentration had to beetermined before use. Moreover, methods developed for AF4 ineneral assume perfectly spherical particle shape for size calibra-ion which in most realistic scenarios might not correspond toeality.
A general drawback of asymmetric flow field flow fractionationesides in the need to use semipermeable membranes inside theeparation channel. Depending on the type of membrane mate-ial, the type of particles, the way the particles are stabilized andhe composition of the mobile phase, variable levels of interactionsetween the membrane and the particles may be observed. Thisepresent a strong limitation since, in practice, a new separationethod may have to be developed for each type of nanoparticle
epending on its composition, shape and surface properties. Finally,hen dealing with nanoparticles embedded into a complex matrix,
here is the possibility of a different interaction with the membraneaused, for example, by grossly differing pH or ionic strength of thextract, which could affect both elution and recovery. In such caseshe problem could be reduced by sample dilution provided this
emained compatible with the sensitivity of the method.Once aware of the limitations, the proposed method rep-esents an easy and robust way for the determination ofilver-nanoparticles in aqueous matrices.
[
[
101.5 174.7 86.7 201.5 100104.5 90.2 89.6 106.3 105.6106.1 795.8 98.7 830.9 103
Acknowledgements
The authors would like to thank Dr. Simone Russo for his guid-ance and suggestions in statistical data analysis throughout thisstudy.
Appendix A. Supplementary data
Supplementary data associated with this article can be found,in the online version, at http://dx.doi.org/10.1016/j.chroma.2013.10.060.
References
[1] Commission Recommendation of 18 October 2011 on the definition of nano-material (2011/696/EU), Official Journal of the European Union, L275/38.
[2] Woodrow Wilson International Centre for Scholars, Project on Emerging Nan-otechnologies, www.nanotechproject.org (accessed April 2013).
[3] Commission Staff Working Paper, SWD (2012) 288 Final.[4] S.A. Cumberland, J.R. Lead, J. Chromatogr. A 1216 (2009) 9099.[5] T.V. Duncan, J. Colloid Interface Sci. 361 (2011) 1.[6] Z. Xiu, Q. Zhang, H.L. Puppala, V.L. Colvin, P. Alvarez, Nano Lett. 12 (2012) 4271.[7] P. Gong, H. Li, X. He, K. Wang, J. Hu, W. Tan, Nanotechnology 18 (2007) 604.[8] G. Fuertes, O.L. Sánchez-Munoz, E. Pedrueza, K. Abderrafi, J. Salgado, E. Jiménez,
Langmuir 29 (2011) 2826.[9] S. Andreescu, J. Njagi, C. Ispas, T. Ravalli, J. Environ. Monitor. 11 (2009) 27.10] M. Rai, A. Yadav, A. Gade, Biotechnol. Adv. 27 (2009) 76.11] A. Howard, J. Environ. Monitor. 12 (2010) 135.12] T.M. Benn, P. Westerhoff, Environ. Sci. Technol. 42 (11) (2008) 4133.13] N.C. Mueller, B. Nowack, Environ. Sci. Technol. 42 (12) (2008) 4447.14] S.A. Blaser, M. Scheringer, M. Macload, K. Hungerbühler, Sci. Total Environ. 390
(2–3) (2008) 396.15] S.J. Klaine, P.J. Alvarez, G.E. Batley, T.F. Fernandes, R.D. Handy, D.Y. Lyon, S.
Mahendra, M.J. McLaughlin, J.R. Lead, Environ. Toxicol. Chem. 27 (9) (2008)1825.
16] T. Linsinger, G. Roebben, D. Gilliland, L. Calzolai, F. Rossi, P. Gibson, C. Klein, JRCReference Reports. EUR25404EN, 2012.
17] A.J. Bednar, A.R. Poda, D.M. Mitrano, A.J. Kennedy, E.P. Gray, J.F. Ranville, C.A.Hayes, F.H. Crocker, A.J. Steevens, Talanta 104 (2013) 140.
18] E. Bolea, J. Jimenez-Lamana, F. Laboroda, J.R. Castillo, Anal. Bioanal. Chem. 401(2011) 2723.
19] A.R. Poda, A.J. Bednar, A.J. Kennedy, A. Harmon, M. Hull, D.M. Mitrano, J.F.Ranville, J. Steevens, J. Chromatogr. A 1218 (2011) 4219.
20] E. Hoque, K. Khosravi, K. Newman, C.D. Metcalf, J. Chromatogr. A 1233 (2012)109.
21] K. Loeschner, J. Navratilova, S. Legros, S. Wagner, R. Grombe, J. Snell, F. von derKammer, E.H. Larsen, J. Chromatogr. A 1272 (2013) 116.
22] J.M. Unrine, B.P. Colman, A.J. Bone, A.P. Gondikas, C.W. Matson, Environ. Sci.Technol. 46 (2012) 6915.
23] R. Kaegi, A. Voegelin, B. Sinnet, S. Zuleeg, H. Hagendorfer, M. Burkhardt, H.Siegrist, Environ. Sci. Technol. 45 (9) (2011) 3902.
24] Z.M. Xiu, Q.-B. Zhang, H.L. Puppala, V.L. Colvin, P.J. Alvarez, Nano Lett. 12 (8)(2012) 4271.
25] J.C. Giddings, in: M.E. Schrimpf, K. Caldwell, J.C. Giddings (Eds.), Field-flowFractionation Handbook, Wiley-Interscience, New York, 2000, p. 3.
26] V. Ribitsch, K. Stana-Kleinschek, T. Kreze, S. Strnad, Macromol. Mater. Eng. 286(2001) 648.
27] J. Gigault, V.A. Hackley, Anal. Bioanal. Chem. 405 (2013) 6251.28] M. Delay, T. Dolt, A. Woellhaf, R. Sembritzki, F.H. Frimmel, J. Chromatogr. A
1218 (2011) 4206.29] S.A. Blaser, M. Scheringer, M. MacLeod, K. Hungerbühler, Sci. Total Environ. 390
(2008) 396.30] M.M. Shafer, J.T. Overdier, D.E. Armstrong, Environ. Toxicol. Chem. 17 (1998)
630.