Embed Size (px)
Citation preview
RESEARCH Open Access
Six weeks of strength endurance trainingdecreases circulating senescence-proneT-lymphocytes in cytomegalovirusseropositive but not seronegativeolder womenHung Cao Dinh1,2,5, Ivan Bautmans1,2,3, Ingo Beyer1,2,3, Oscar Okwudiri Onyema1,2, Keliane Liberman1,2,Liza De Dobbeleer1,2, Wim Renmans4, Sam Vander Meeren4, Kristin Jochmans4, Andreas Delaere1,2,Veerle Knoop1,2 and Rose Njemini1,2*
Abstract
Background: Ageing is associated with a decline in immune function termed immunosenescence. This process ischaracterized amongst others by less naive T-cells and more senescent phenotypes, which have been implicated inthe pathogenesis of many age-related diseases. Thus far, reports regarding the long-term adaptation effects ofexercise on T-cell phenotypes are scant and largely equivocal. These inconsistencies may be due to potentialcontributors to immunosenescence, particularly cytomegalovirus infection, which is considered a hallmark of T-cellsenescence. Therefore, we sought to investigate the impact of cytomegalovirus serostatus on the distribution ofperipheral T-cell subsets following long-term exercise in older women.
Methods: One hundred women (aged 65 years and above) were randomized to 3 times/weekly training at eitherintensive strength training (3 × 10 repetitions at 80% of one-repetition maximum, n = 31), strength endurancetraining (2 × 30 repetitions at 40% of one-repetition maximum, n = 33), or control (passive stretching exercise,n = 36) for 6 weeks. All training sessions were supervised by trained instructors to minimize the risk of injury and toensure that the participants adhered to the training protocol throughout the entire range of motion. The T-cellpercentages and absolute blood counts were determined before and after 6 weeks (24 h–48 h after the last trainingsession) using flow cytometry and a haematology analyser. Cytomegalovirus antibodies were measured in serumusing Architect iSystem and cytomegalovirus serostatus was balanced in the three intervention groups. C-reactiveprotein was measured using immunonephelometry.
Results: We report for the first time that 6 weeks of strength endurance training significantly decreasedsenescence-prone T-cells along with a small increase in the number of CD8– naive T-cells in blood. The absolutecounts of senescent-like T-cells decreased by 44% (from 26.03 ± 35.27 to 14.66 ± 21.36 cells/μL, p < 0.01) and by 51%(from 6.55 ± 12.37 to 3.18 ± 6.83 cells/μL, p < 0.05) for the CD8+ and CD8– T-cell pools, respectively. Intriguingly,these changes were observed in cytomegalovirus seropositive, but not cytomegalovirus seronegative individuals.
(Continued on next page)
© The Author(s). 2019 Open Access This article is distributed under the terms of the Creative Commons Attribution 4.0International License (http://creativecommons.org/licenses/by/4.0/), which permits unrestricted use, distribution, andreproduction in any medium, provided you give appropriate credit to the original author(s) and the source, provide a link tothe Creative Commons license, and indicate if changes were made. The Creative Commons Public Domain Dedication waiver(http://creativecommons.org/publicdomain/zero/1.0/) applies to the data made available in this article, unless otherwise stated.
* Correspondence: [email protected] in Ageing Research Group, Vrije Universiteit Brussel, Laarbeeklaan 103,B-1090 Brussels, Belgium2Gerontology Department, Vrije Universiteit Brussel, Laarbeeklaan 103, B-1090Brussels, BelgiumFull list of author information is available at the end of the article
Cao Dinh et al. Immunity & Ageing (2019) 16:17 https://doi.org/10.1186/s12979-019-0157-8
(Continued from previous page)
Conclusions: In conclusion, the present study shows that strength endurance training leads to a reduction incirculating senescence-prone T-cells in cytomegalovirus seropositive older women. It remains to be established ifmonitoring of peripheral senescence-prone T-cells may have utility as cellular biomarkers of immunosenescence.
Keywords: Community-dwelling older women, Cytomegalovirus infection, Immunosenescence, T-lymphocytes,Exercise, Strength endurance training
IntroductionAgeing is characterized by physiological changes, whichare known to negatively impact different areas of the hu-man body [1]. A severe change associated with this processis the progressive decline in immune response, referred toas immunosenescence. Of all the immune compartments,that of T-cells is among the most affected with ageing [2].Advancing age leads to a shift in T-cell phenotypes, with amanifest decrease of naive T-cells - dealing with newly en-countered antigens - and a concomitant accumulation ofmemory and senescent T-cells [3]. These changes are keycontributors to the process of immunosenescence and areassociated with greater risk of morbidity and mortality inolder people [4]. Indeed, clinical evidence indicates that theability to mount primary immune responses against novelantigens declines significantly with age [5], leading to thesusceptibility of older people to often severe infectiousdiseases. Additionally, senescent T-cells are dysfunctionalimmune cells, which secrete increased amounts of pro-in-flammatory substances and matrix degrading enzymes [6,7], thereby creating a micro-environment favourable forthe development of inflammatory diseases [8].There are strong indications that infection with cyto-
megalovirus (CMV) may evoke the most deleterious ef-fects on T-cell immunity due to the chronic antigenic loadit delivers to T-cells [9, 10]. More so, evidence for frequentage-related reactivation and increased viral load of CMVin individuals with positive CMV serology has been re-ported [11, 12]. On the other hand, reactivation of theCMV infection has been postulated to trigger the immuneresponse to generate highly oligoclonal T-cells. In this per-spective, Khan et al. reported that age-related increase ofmemory CD8+ T-cells, is paralleled by an increase in theproportion of CMV epitope-specific T-cells [13]. In theirstudy, individual CMV epitope-specific CD8+ T-cellscould represent up to 23% of the total CD8+ T-cells inolder adults with CMV infection. This clonal expansion ofCMV-specific T-cells may exacerbate human T-cell im-munosenescence and increase the susceptibility of olderpeople to inflammatory processes [14].Physical exercise is increasingly being recognized as a
powerful countermeasure for immunosenescence and in-flammation [15]. Although the mechanism underpinningexercise-induced immune response has not been com-pletely elucidated, an overwhelming body of evidence,
including some from our research group, suggests thatregular bouts of exercise may improve immune functionand lower inflammation [16–18] via the induction ofanti-inflammatory cytokines and/or the inhibition of theexpression of Toll-like receptors, with subsequent inhib-ition of the production of pro-inflammatory cytokines[19]. Another potential mechanism by which exercisemay counteract immunosenescence and its associateddiseases is by limiting the accumulation of senescentT-cells and repopulating blood with naive T-cells [20]. Inthis perspective, physical exercise has been shown toinduce the mobilization of lymphocytes into the blood-stream, followed by the migration of lymphocytes to se-lected peripheral tissues for immune surveillance [21]with subsequent apoptosis of senescent T-cells [22]. Thisapoptotic process is thought to induce hematopoietic stemcell production in the bloodstream, which may move tothe thymus and stimulate the development of naiveT-cells [22].Although cross-sectional studies indicate that regular
exercise may combat the adverse effects of immunose-nescence, available reports regarding the long-termadaptation benefits of exercise in the immune responseof older persons are equivocal and most studies have ei-ther not examined or have failed to detect associationswith CMV because almost all the older participants wereCMV positive [23]. Considering the limited availabledata and ongoing controversies, we sought to study theeffects of 6 weeks of resistance exercise at different in-tensities on circulating senescence-prone T-cells, with aparticular focus on the role of CMV serostatus.
ResultsDescriptiveThe purpose of this study was to evaluate the role ofCMV on the effects of 6 weeks resistance training ateither intensive strength training (3 × 10 repetitions at80% one-repetition maximum (1RM, i.e. the maximumweight that can be moved once over the whole range ofmovement)), strength endurance training (2 × 30 repeti-tions at 40% 1RM), or flexibility training (control) onblood T-cell subtypes in older women. The overall CMVseroprevalence was 65% and there were no differences inBMI or CRP levels between the CMV-seropositiveand -seronegative groups. The participants with positive
Cao Dinh et al. Immunity & Ageing (2019) 16:17 Page 2 of 14
CMV serology were significantly older than the CMV sero-negative participants (p = 0.029). Moreover, we found veryweak, albeit significant, associations between age and thepercentage of the memory phenotypes in both the CD8+and CD8– T-cell subsets (r = 0.250, p = 0.012 and r = 0.243,p = 0.015; for CD8 +CD28 −CD57− and CD8 −CD28 −CD57−, respectively). Also, a significant increase was no-ticed in the proportion of CD8–CD57+ senescence-pronecells with age (r = 0.261, p = 0.009). On the other hand, avery weak inverse association was found between the pro-portion of naive cell phenotypes and age in both CD8+ andCD8– T-cell pools (r = − 0.329, p = 0.001 and r = − 0.243,p = 0.015; for CD8 +CD28 +CD57− and CD8 −CD28 +CD57−, respectively).Overall muscle strength (muscle strength index repre-
senting the sum of 1RM on the 6 training devices)improved significantly after intensive strength training(+ 7.3 ± 4.5 kg, p < 0.01) and strength endurance training(+ 6.4 ± 4.5 kg, p < 0.01) compared to control (ANOVApost-hoc test, p < 0.001). Strength gains did not differ sig-nificantly between the intensive strength and strength
endurance training groups (ANOVA post-hoc test,p = 0.485).
Absolute counts and percentage of T-cells at baselineaccording to CMV serostatusTable 1 portrays the baseline absolute counts and per-centage of T-cell subsets according to CMV serostatus.In both CD8– and CD8+ T-cell pools, the seropositiveCMV participants had higher absolute numbers ofCD28–CD57– memory and CD28–CD57+ senescentphenotypes compared to their CMVseronegative coun-terparts (see Table 1). There were no significant dif-ferences in the absolute counts of CD8 − CD28 +CD57+ and CD8 + CD28 + CD57+ senescent pheno-types according to CMV serostatus. When age andCMV IgG were entered in a model together, wefound that only CMV IgG was a significant predictorof both the number and percentage of senescence-prone T-cells (see Supporting Information Additionalfile 1: Tables S1 and Additional file 1: Table S2).There were no significant differences in the absolute
Table 1 Absolute counts and Percentage of T-cell subsets at baseline with respect to CMV serostatus
Parameter CMV − (n = 34) CMV + (n = 63) p valuea
T-cell subset
CD8+ T-cells
CD8 + CD28 + CD57− (naïve) cells/μL 130.29 (88.50) 154.60 (117.30) 0.111
% 73.60 (24.40) 54.90 (26.40) < 0.001
CD8 + CD28 − CD57− (memory) cells/μL 30.00 (52.50) 90.00 (100) < 0.001
% 20.30 (18.53) 29.50 (22.30) < 0.001
CD8 + CD57+ (SPC) cells/μL 5.81 (17.30) 27.06 (38.30) < 0.001
% 4.00 (7.15) 7.15 (13.08) 0.010
CD8 + CD28 − CD57+ (SPC) cells/μL 4.90 (15.70) 26.38 (37.40) < 0.001
% 2.90 (6.25) 6.35 (11.98) 0.004
CD8 + CD28 + CD57+ (SPC) cells/μL 0.84 (1.40) 0.65 (1.40) 0.913
% 0.30 (0.80) 0.20 (0.40) 0.065
CD8− T-cells
CD8 − CD28 + CD57 − (naive) cells/μL 641.91 (310.20) 650.27 (343.30) 0.844
% 99.40 (0.90) 96.50 (4.70) < 0.001
CD8 − CD28 − CD57− (memory) cells/μL 0.00 (10.00) 20.00 (20.00) < 0.001
% 0.45 (0.65) 2.00 (4.00) < 0.001
CD8 − CD57+ (SPC) cells/μL 0.66 (1.50) 6.92 (13.80) < 0.001
% 0.10 (0.20) 0.90 (2.00) < 0.001
CD8 − CD28 − CD57 + (SPC) cells/μL 0.00 (0.80) 6.12 (10.00) < 0.001
% 0.00 (0.13) 0.80 (1.70) < 0.001
CD8 − CD28 + CD57 + (SPC) cells/μL 0.56 (0.90) 0.81 (1.80) 0.081
% 0.10 (0.10) 0.10 (0.40) 0.151
Note: The values denote median (Interquartile range). CMV cytomegalovirus, SPC senescence-prone cells. T-cell subsets were expressed as percentages within theCD3 + CD8+ or CD3 + CD8− T-cells or absolute number of cells in peripheral blood (cells/μL). aResults of Mann-Whitney U Test
Cao Dinh et al. Immunity & Ageing (2019) 16:17 Page 3 of 14
counts of naive T-cells between the CMV-seropositiveand -seronegative groups. Also, no significant differ-ences in the absolute counts of T-cell phenotypeswere noticed among the 3 intervention groups atbaseline with respect to CMV serostatus (seeAdditional file 1: Table S3).Regarding the baseline proportion of cells, the CMV
seropositive group was characterized by a significantlylower proportion of the naive phenotype - defined asCD28 + CD57– expressing cells - in both the CD8+ andthe CD8– sub-populations of T-cells (all p < 0.001, seeTable 1). Contrariwise, the proportions of CD28–CD57–memory cells and CD28–CD57+ senescent phenotypeswere significantly lower in participants without CMVcompared to CMV–seropositive participants, in bothlineage markers of the lymphocyte subset (all p < 0.05,see Table 1). There were no significant differences in thepercentage of CD8 −CD28 + CD57+ or CD8+ CD28 +CD57+ senescent phenotypes according to CMV serosta-tus. Also, no significant differences in the percentage ofT-cell phenotypes were noticed among the 3 interven-tion groups at baseline with respect to CMV serostatus(see Additional file 1: Table S3).
Training-induced changes in the absolute counts of T-cellsubsetsConsidering the huge impact of CMV on the absolutecounts of various T-cell subsets, we analysed the abso-lute blood counts of the various T-cell subsets stratifyingby CMV serostatus.
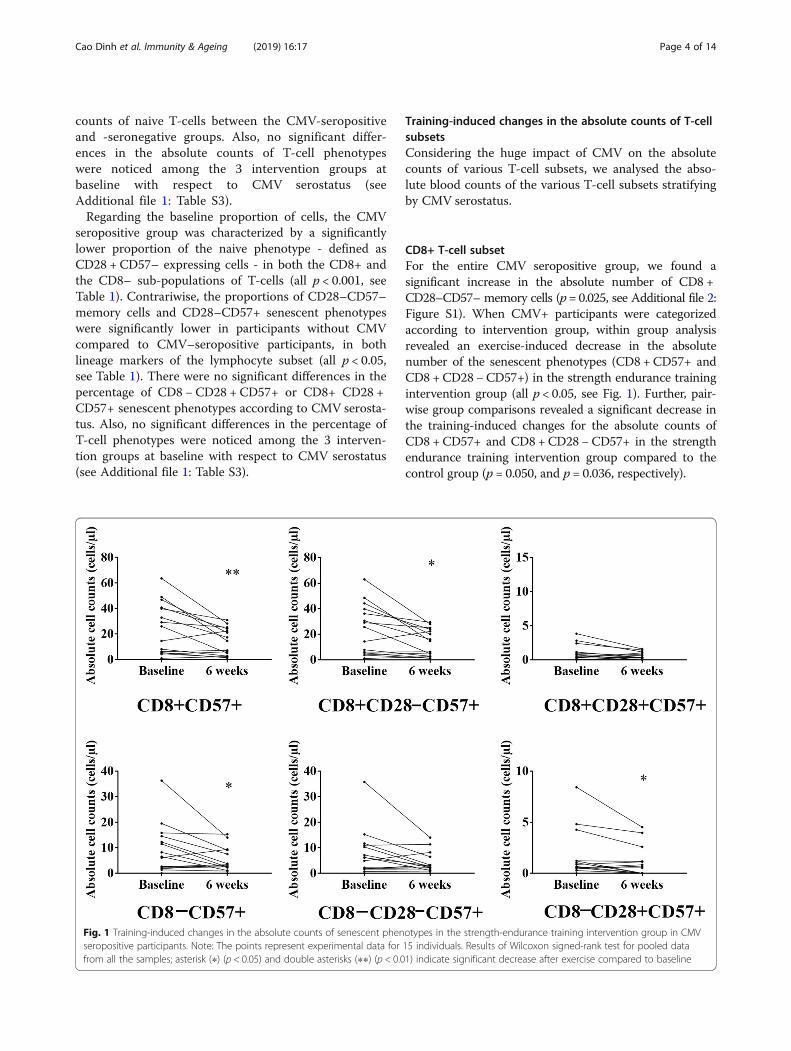
CD8+ T-cell subsetFor the entire CMV seropositive group, we found asignificant increase in the absolute number of CD8 +CD28–CD57– memory cells (p= 0.025, see Additional file 2:Figure S1). When CMV+ participants were categorizedaccording to intervention group, within group analysisrevealed an exercise-induced decrease in the absolutenumber of the senescent phenotypes (CD8 + CD57+ andCD8 +CD28 −CD57+) in the strength endurance trainingintervention group (all p < 0.05, see Fig. 1). Further, pair-wise group comparisons revealed a significant decrease inthe training-induced changes for the absolute counts ofCD8 +CD57+ and CD8 + CD28 −CD57+ in the strengthendurance training intervention group compared to thecontrol group (p = 0.050, and p = 0.036, respectively).
Fig. 1 Training-induced changes in the absolute counts of senescent phenotypes in the strength-endurance training intervention group in CMVseropositive participants. Note: The points represent experimental data for 15 individuals. Results of Wilcoxon signed-rank test for pooled datafrom all the samples; asterisk (∗) (p < 0.05) and double asterisks (∗∗) (p < 0.01) indicate significant decrease after exercise compared to baseline
Cao Dinh et al. Immunity & Ageing (2019) 16:17 Page 4 of 14
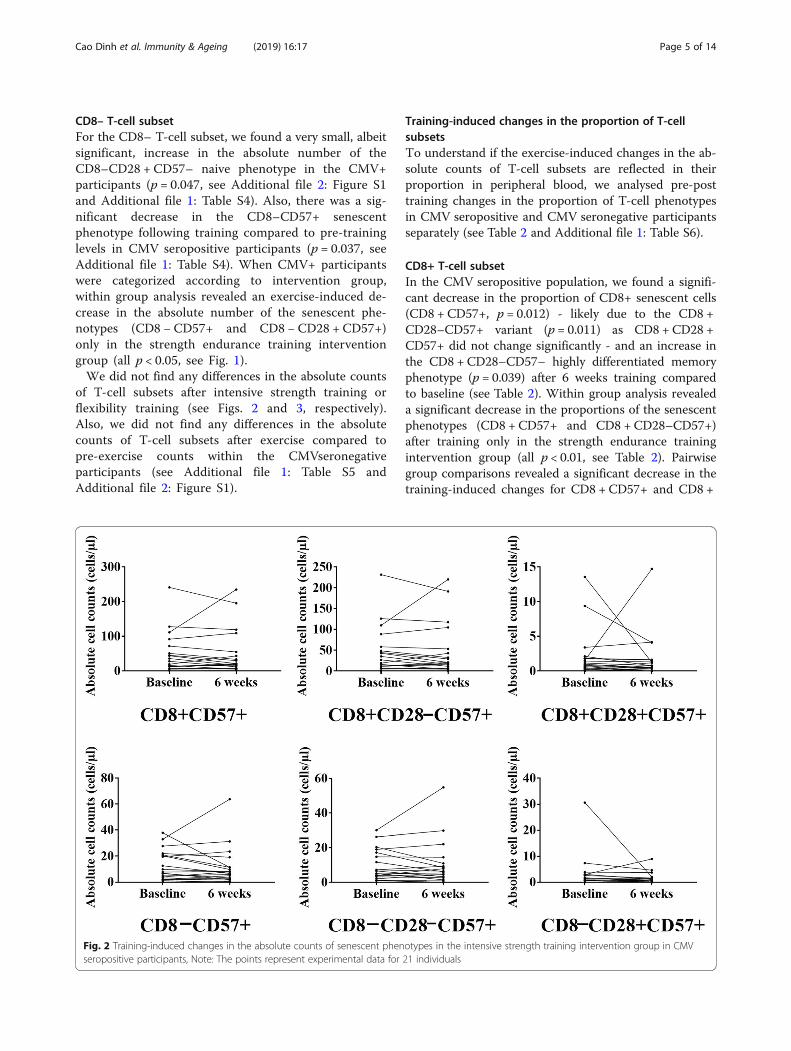
CD8– T-cell subsetFor the CD8– T-cell subset, we found a very small, albeitsignificant, increase in the absolute number of theCD8–CD28 + CD57– naive phenotype in the CMV+participants (p = 0.047, see Additional file 2: Figure S1and Additional file 1: Table S4). Also, there was a sig-nificant decrease in the CD8–CD57+ senescentphenotype following training compared to pre-traininglevels in CMV seropositive participants (p = 0.037, seeAdditional file 1: Table S4). When CMV+ participantswere categorized according to intervention group,within group analysis revealed an exercise-induced de-crease in the absolute number of the senescent phe-notypes (CD8 − CD57+ and CD8 − CD28 + CD57+)only in the strength endurance training interventiongroup (all p < 0.05, see Fig. 1).We did not find any differences in the absolute counts
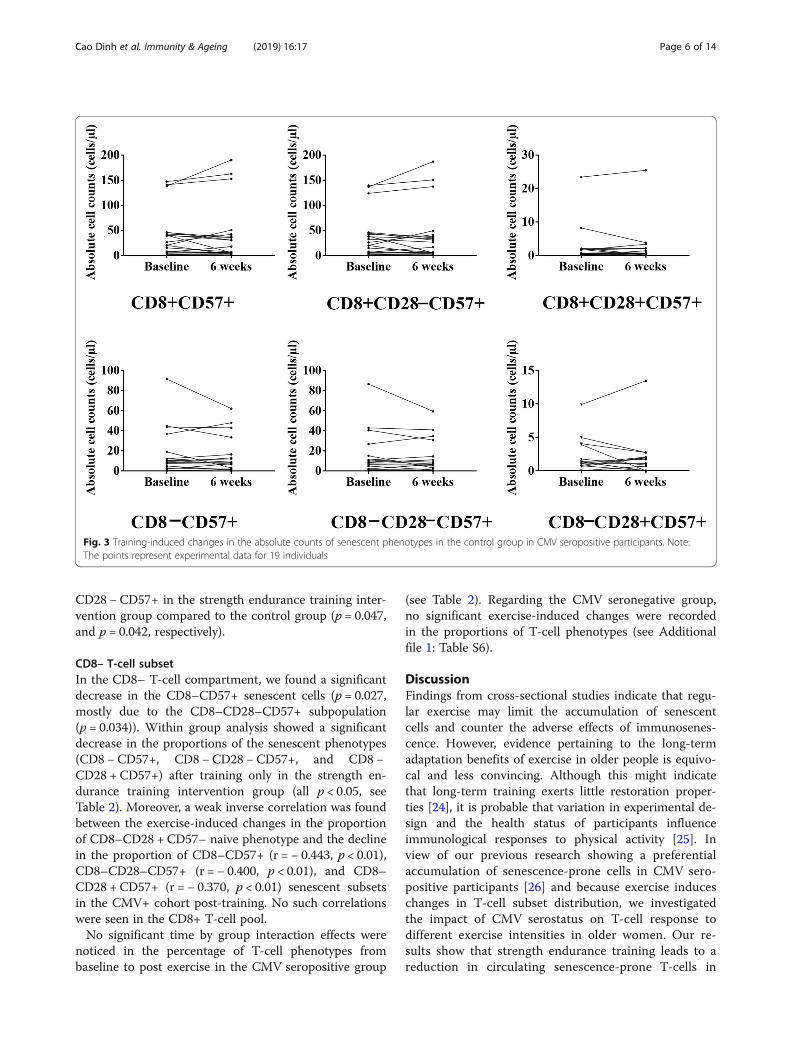
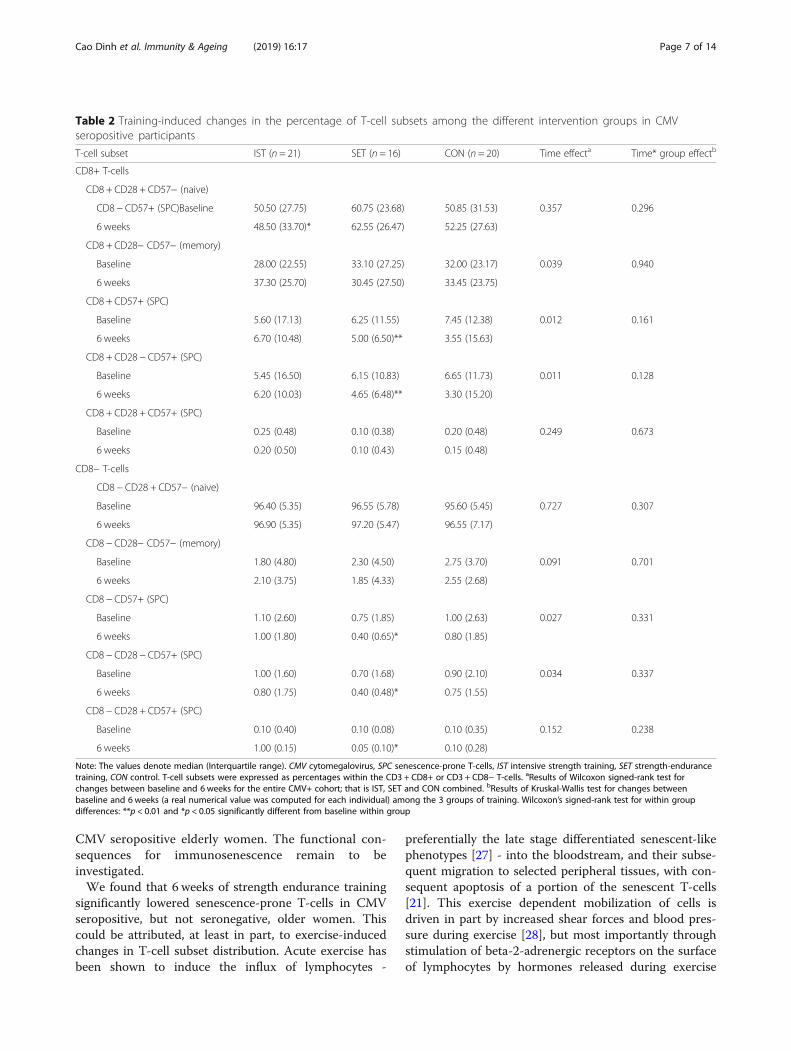
of T-cell subsets after intensive strength training orflexibility training (see Figs. 2 and 3, respectively).Also, we did not find any differences in the absolutecounts of T-cell subsets after exercise compared topre-exercise counts within the CMVseronegativeparticipants (see Additional file 1: Table S5 andAdditional file 2: Figure S1).
Training-induced changes in the proportion of T-cellsubsetsTo understand if the exercise-induced changes in the ab-solute counts of T-cell subsets are reflected in theirproportion in peripheral blood, we analysed pre-posttraining changes in the proportion of T-cell phenotypesin CMV seropositive and CMV seronegative participantsseparately (see Table 2 and Additional file 1: Table S6).
CD8+ T-cell subsetIn the CMV seropositive population, we found a signifi-cant decrease in the proportion of CD8+ senescent cells(CD8 + CD57+, p = 0.012) - likely due to the CD8 +CD28–CD57+ variant (p = 0.011) as CD8 + CD28 +CD57+ did not change significantly - and an increase inthe CD8 + CD28–CD57– highly differentiated memoryphenotype (p = 0.039) after 6 weeks training comparedto baseline (see Table 2). Within group analysis revealeda significant decrease in the proportions of the senescentphenotypes (CD8 + CD57+ and CD8 + CD28–CD57+)after training only in the strength endurance trainingintervention group (all p < 0.01, see Table 2). Pairwisegroup comparisons revealed a significant decrease in thetraining-induced changes for CD8 + CD57+ and CD8 +
Fig. 2 Training-induced changes in the absolute counts of senescent phenotypes in the intensive strength training intervention group in CMVseropositive participants, Note: The points represent experimental data for 21 individuals
Cao Dinh et al. Immunity & Ageing (2019) 16:17 Page 5 of 14
CD28 −CD57+ in the strength endurance training inter-vention group compared to the control group (p = 0.047,and p = 0.042, respectively).
CD8– T-cell subsetIn the CD8– T-cell compartment, we found a significantdecrease in the CD8–CD57+ senescent cells (p = 0.027,mostly due to the CD8–CD28–CD57+ subpopulation(p = 0.034)). Within group analysis showed a significantdecrease in the proportions of the senescent phenotypes(CD8 − CD57+, CD8 −CD28 − CD57+, and CD8 −CD28 + CD57+) after training only in the strength en-durance training intervention group (all p < 0.05, seeTable 2). Moreover, a weak inverse correlation was foundbetween the exercise-induced changes in the proportionof CD8–CD28 + CD57– naive phenotype and the declinein the proportion of CD8–CD57+ (r = − 0.443, p < 0.01),CD8–CD28–CD57+ (r = − 0.400, p < 0.01), and CD8–CD28 + CD57+ (r = − 0.370, p < 0.01) senescent subsetsin the CMV+ cohort post-training. No such correlationswere seen in the CD8+ T-cell pool.No significant time by group interaction effects were
noticed in the percentage of T-cell phenotypes frombaseline to post exercise in the CMV seropositive group
(see Table 2). Regarding the CMV seronegative group,no significant exercise-induced changes were recordedin the proportions of T-cell phenotypes (see Additionalfile 1: Table S6).
DiscussionFindings from cross-sectional studies indicate that regu-lar exercise may limit the accumulation of senescentcells and counter the adverse effects of immunosenes-cence. However, evidence pertaining to the long-termadaptation benefits of exercise in older people is equivo-cal and less convincing. Although this might indicatethat long-term training exerts little restoration proper-ties [24], it is probable that variation in experimental de-sign and the health status of participants influenceimmunological responses to physical activity [25]. Inview of our previous research showing a preferentialaccumulation of senescence-prone cells in CMV sero-positive participants [26] and because exercise induceschanges in T-cell subset distribution, we investigatedthe impact of CMV serostatus on T-cell response todifferent exercise intensities in older women. Our re-sults show that strength endurance training leads to areduction in circulating senescence-prone T-cells in
Fig. 3 Training-induced changes in the absolute counts of senescent phenotypes in the control group in CMV seropositive participants. Note:The points represent experimental data for 19 individuals
Cao Dinh et al. Immunity & Ageing (2019) 16:17 Page 6 of 14
CMV seropositive elderly women. The functional con-sequences for immunosenescence remain to beinvestigated.We found that 6 weeks of strength endurance training
significantly lowered senescence-prone T-cells in CMVseropositive, but not seronegative, older women. Thiscould be attributed, at least in part, to exercise-inducedchanges in T-cell subset distribution. Acute exercise hasbeen shown to induce the influx of lymphocytes -
preferentially the late stage differentiated senescent-likephenotypes [27] - into the bloodstream, and their subse-quent migration to selected peripheral tissues, with con-sequent apoptosis of a portion of the senescent T-cells[21]. This exercise dependent mobilization of cells isdriven in part by increased shear forces and blood pres-sure during exercise [28], but most importantly throughstimulation of beta-2-adrenergic receptors on the surfaceof lymphocytes by hormones released during exercise
Table 2 Training-induced changes in the percentage of T-cell subsets among the different intervention groups in CMVseropositive participants
T-cell subset IST (n = 21) SET (n = 16) CON (n = 20) Time effecta Time* group effectb
CD8+ T-cells
CD8 + CD28 + CD57− (naive)
CD8 − CD57+ (SPC)Baseline 50.50 (27.75) 60.75 (23.68) 50.85 (31.53) 0.357 0.296
6 weeks 48.50 (33.70)* 62.55 (26.47) 52.25 (27.63)
CD8 + CD28− CD57− (memory)
Baseline 28.00 (22.55) 33.10 (27.25) 32.00 (23.17) 0.039 0.940
6 weeks 37.30 (25.70) 30.45 (27.50) 33.45 (23.75)
CD8 + CD57+ (SPC)
Baseline 5.60 (17.13) 6.25 (11.55) 7.45 (12.38) 0.012 0.161
6 weeks 6.70 (10.48) 5.00 (6.50)** 3.55 (15.63)
CD8 + CD28 − CD57+ (SPC)
Baseline 5.45 (16.50) 6.15 (10.83) 6.65 (11.73) 0.011 0.128
6 weeks 6.20 (10.03) 4.65 (6.48)** 3.30 (15.20)
CD8 + CD28 + CD57+ (SPC)
Baseline 0.25 (0.48) 0.10 (0.38) 0.20 (0.48) 0.249 0.673
6 weeks 0.20 (0.50) 0.10 (0.43) 0.15 (0.48)
CD8− T-cells
CD8 − CD28 + CD57− (naive)
Baseline 96.40 (5.35) 96.55 (5.78) 95.60 (5.45) 0.727 0.307
6 weeks 96.90 (5.35) 97.20 (5.47) 96.55 (7.17)
CD8 − CD28− CD57− (memory)
Baseline 1.80 (4.80) 2.30 (4.50) 2.75 (3.70) 0.091 0.701
6 weeks 2.10 (3.75) 1.85 (4.33) 2.55 (2.68)
CD8 − CD57+ (SPC)
Baseline 1.10 (2.60) 0.75 (1.85) 1.00 (2.63) 0.027 0.331
6 weeks 1.00 (1.80) 0.40 (0.65)* 0.80 (1.85)
CD8 − CD28 − CD57+ (SPC)
Baseline 1.00 (1.60) 0.70 (1.68) 0.90 (2.10) 0.034 0.337
6 weeks 0.80 (1.75) 0.40 (0.48)* 0.75 (1.55)
CD8 − CD28 + CD57+ (SPC)
Baseline 0.10 (0.40) 0.10 (0.08) 0.10 (0.35) 0.152 0.238
6 weeks 1.00 (0.15) 0.05 (0.10)* 0.10 (0.28)
Note: The values denote median (Interquartile range). CMV cytomegalovirus, SPC senescence-prone T-cells, IST intensive strength training, SET strength-endurancetraining, CON control. T-cell subsets were expressed as percentages within the CD3 + CD8+ or CD3 + CD8− T-cells. aResults of Wilcoxon signed-rank test forchanges between baseline and 6 weeks for the entire CMV+ cohort; that is IST, SET and CON combined. bResults of Kruskal-Wallis test for changes betweenbaseline and 6 weeks (a real numerical value was computed for each individual) among the 3 groups of training. Wilcoxon’s signed-rank test for within groupdifferences: **p < 0.01 and *p < 0.05 significantly different from baseline within group
Cao Dinh et al. Immunity & Ageing (2019) 16:17 Page 7 of 14
[29]. Given that CMV specific T-cells express higherlevels of β-adrenergic receptors [9], it can be expectedthat exercise would induce a more efficient influx ofCMV specific T-cells into the peripheral circulationcompared to the broader T-cell pool. In this light, scantreports have investigated the influence of CMV status onexercise-induced changes in T-cell subset distribution[30], with results indicating a higher exercise-inducedredeployment of highly differentiated T-lymphocytes -mostly specific for CMV - among the CMV positiveparticipants. Therefore, frequent exercise-induced mo-bilization of CMV-specific T-cells - with subsequent apop-tosis of some of them in the peripheral tissues - mayproduce a cumulative reduction in the number of cells withsenescent phenotype over time in participants with CMV.Another obvious potential mechanism by which exer-
cise may diminish circulating senescence-prone cells inparticipants infected with CMV is by lowering inflam-mation. Regular exercise training has been unequivocallyreported to reduce circulating resting levels of the pro-inflammatory cytokines IL-6 and TNF-α in older people[31]. In response to 24 weeks of resistance exercise train-ing, we also observed a significant decrease in the rest-ing levels of IL-6 in community dwelling olderindividuals [32]. On the other hand, chronic low-gradeinflammation has been proposed to perpetuate thereactivation of CMV [33]. Because the reactivation ofCMV infection has been postulated to trigger the im-mune response to generate highly oligoclonal T-cells -which may become senescent over time [34] - reducinginflammation via exercise may limit the opportunitiesfor latent viral agents to reactivate and thereby reducethe accumulation of senescent cells in participants pre-senting with CMV.Finally, our observation could be due to the stress-re-
ducing properties of strength endurance training. Vin-cent et al. reported that older people who underwenttraining at a lower intensity with more repetitions (50%1RM; 13 repetitions per exercise) experienced a morepronounced protective effect against lipid peroxidationthan their counterparts who trained at a higher intensitywith fewer repetitions (80% 1RM; 8 repetitions per exer-cise) [35]. Moreover, oxidative stress is known to triggerthe reactivation of latent CMV infection [36], whichcould lead to the development of senescent phenotypesin the T-cell pool. Thus, strength endurance trainingmay decrease the number of senescence-prone T-cells inCMV positive participants perhaps by lowering oxidativestress. Taken together, strength endurance training maydelay the accumulation of senescence-prone cells inseropositive CMV individuals directly by inducing theapoptosis of senescence-prone cells, or indirectly by lim-iting inflammation and oxidative stress, both of whichdrive viral reactivation.
In the present study, we found a significant increase inthe proportion of memory cells after 6 weeks interven-tion in CMV seropositive participants. In accordancewith this finding, Silva et al. reported a higher propor-tion of highly differentiated effector memory cells inCMV seropositive elderly individuals with an exerciselifestyle, and they concluded that such effects may bebeneficial for the immune response to known antigens,such as pathogens specific to CMV [37]. Regarding thenaive T-cell pool, we found a significantly lower propor-tion of the CD8 + CD28 + CD57– naive T-cells in CMV+compared to CMV– participants at baseline. On theother hand, a higher, albeit not significant, number ofCD8 + CD28 + CD57– naive T-cells was observed inCMV+ compared to CMV– participants at baseline. Therelative lower percentage of naive CD8+ cells in CMV+as opposed to CMV– may be explained by the higherabsolute numbers of memory and senescent T-cell sub-sets in the CD8+ compartment in CMV+ participants.In the CD8− compartment, we observed a very small, al-beit significant, training-induced increase in the absolutecounts of naive T-cells among CMV positive partici-pants. More so, we found a weak inverse correlation be-tween the training-induced changes in the proportion ofCD8 − CD28 + CD57− naive T-cells and the decline inthe proportion of CD8 −CD57+, CD8 −CD28 −CD57+,and CD8 −CD28 + CD57+ senescence-prone phenotypespost-training. However, these results should be inter-preted with caution since the training-induced changesin the absolute counts of CD8 − CD28 + CD57– naiveT-cells did not correlate significantly with the decline inabsolute counts of CD8− senescent T-cells. Moreover, wedid not find any significant changes in CD8 + CD28 +CD57– naive T-cell subset following training and nosignificant relationships were found between the training-in-duced changes in CD8 +CD28 +CD57– naive T-cells andthe decline in CD8+ senescent phenotypes post-training.As expected, our findings support the current know-
ledge that T-cell repertoire are altered - resulting in adecrease of naive cells, with a concomitant accumulationof memory and senescent cells - during ageing. Thisage-dependent shift from T-cells exhibiting predomin-antly naive phenotypes to highly differentiated memoryand senescent phenotypes might reflect lower numbersof haematopoietic stem cells, and thymus involutionwith age [38]. Notwithstanding, when age and CMV IgGwere entered in a model together, we found that onlyCMV IgG was a significant predictor of both the num-ber and percentage of senescence-prone T-cells.Although the overall muscle strength improved signifi-
cantly after both intensive strength training and strengthendurance training, 6 weeks of intensive strength train-ing did not influence significantly the blood counts ofsenescence-prone T-cells in CMV-seropositive or
Cao Dinh et al. Immunity & Ageing (2019) 16:17 Page 8 of 14
-seronegative older women. Since reports addressing theimmune response to resistance training in older individ-uals are lacking, more functional studies are highlyneeded to understand the significance of our observationin the context of immunosenescence. Certainly, more re-search is required to elucidate the possible role playedby the chemokines, cytokines, oxidative stress, gender,lifestyle variables and infection history on the distribu-tion of T-cell phenotypes following exercise.The strengths of this study are many folds. A strong
point is that this study was performed in an older popu-lation with a distinctly different physiologic profile com-pared to younger subjects. Thus far, the scant data inthis field have not addressed the impact of CMV on thelong-term adaption effects of exercise on T-cells. There-fore, this study addresses a gap in the literature by inves-tigating the impact of CMV on exercise-induced T-celladaptation in older women. Further, the available data inthis field have largely used the classical aerobic training.Research pertaining to resistance training - which is verywell suited to older people’s diverse circumstances - hasbeen largely unexploited in the context of the ageing im-mune system. Our observation that long-term strengthendurance training modulates T-cell phenotypes inCMV seropositive, but not seronegative individuals, willact as a guide for future experiments concerning T-cellresponse to exercise in older people. Although thepresent study has a promising setup, the findings shouldbe interpreted within its limitations. First, T-cell subsetswere distinguished based on the expression (or non-ex-pression) of CD28 and CD57. However, the expressionof CD28 by CD8+ and CD8– T-cells indicates differentstages in lymphocyte differentiation as memory CD8+T-cells tend to lose CD28 expression before losingCD27, while the reverse is true for CD4+ T-cells [39].Therefore, additional T-cell markers (e.g. CD45RA,CCR7, CD4 and CD27) might be useful to better definedifferent T-cell subsets and their response to exercise. Asecond limitation is the lack of a young control or malegroup, which might have provided insight into the re-spective effects of ageing and sex on exercise-inducedadaptations of immune cells. Third, we did not deter-mine the CMV specific T-cells. Therefore, we could notverify the share of CMV-specific T-cells in mobilized T-cells in response to strength endurance training. Clearly,more research is needed in this area that employs amore robust measurement of immune competency in-cluding immune cell phenotypes and their functionality(e.g. their capacity to proliferate, and to produce inflam-matory substances), as well as lifestyle measurements(e.g. level of physical activity, nutrition and body com-position) while keeping in mind individuals’ immuneprofiles particularly CMV status (e.g. the IgM class anti-CMV antibodies, PCR assay for CMV and genetic
predisposition to CMV infection). Since reports address-ing the immune response to resistance training in olderindividuals are lacking, more functional studies arehighly needed to understand the significance of our ob-servation in the context of immunosenescence. Thiscould be done for instance by assessing the effects ofSET on vaccine responses. Also, questions as to whethersenescence-prone cells die or track to the marginal poolor tissues should be addressed in future studies.
ConclusionIn conclusion, the results of the present study show thatstrength endurance training leads to a reduction in cir-culating senescence-prone T-cells in seropositive CMVolder women. It remains to be established if monitoringof peripheral senescence-prone T-cells may have utilityas cellular biomarkers of immunosenescence.
MethodsParticipants and study designThe Senior Project Intensive Training (SPRINT) is anongoing randomized controlled trial conducted by theFrailty in Ageing research department of Vrije UniversiteitBrussel to evaluate the effects of resistance training atdifferent intensities on the immune system in elderlypersons. Recruitment was done by advertisement withflyers through day centres, health insurance companies,seniors associations, general practitioners, municipalitiesand other public places. Participants were excluded whenperforming currently or within the past 6 months, on aregular basis, physical exercise at higher intensities thanhabitual daily activity (e.g. fitness classes, strengtheningexercises, cycling club); when presenting contra-indicationfor any of the exercise interventions; when using cortico-steroids; when being unable to understand or execute theexercise instructions due to cognitive impairment (minimental state examination score < 24/30) [40] or physicaldisability. Comorbidity was not an exclusion criterion perse, except for acute uncontrolled conditions and/or acuteinflammation (C-reactive protein (CRP) ≥ 10mg/L). Onehundred apparently healthy older women (aged 65 yearsand above) living independently in the community wereincluded in the present study (see Fig. 4). Among thoserandomized, 3 had no serum for CMV determination, 7were lost to follow up and the results of absolute countsof T-cells could not be retrieved for 6 participants. Thestudy protocol was approved by the local ethics committeein accordance with the Declaration of Helsinki and eachparticipant gave a written informed consent.
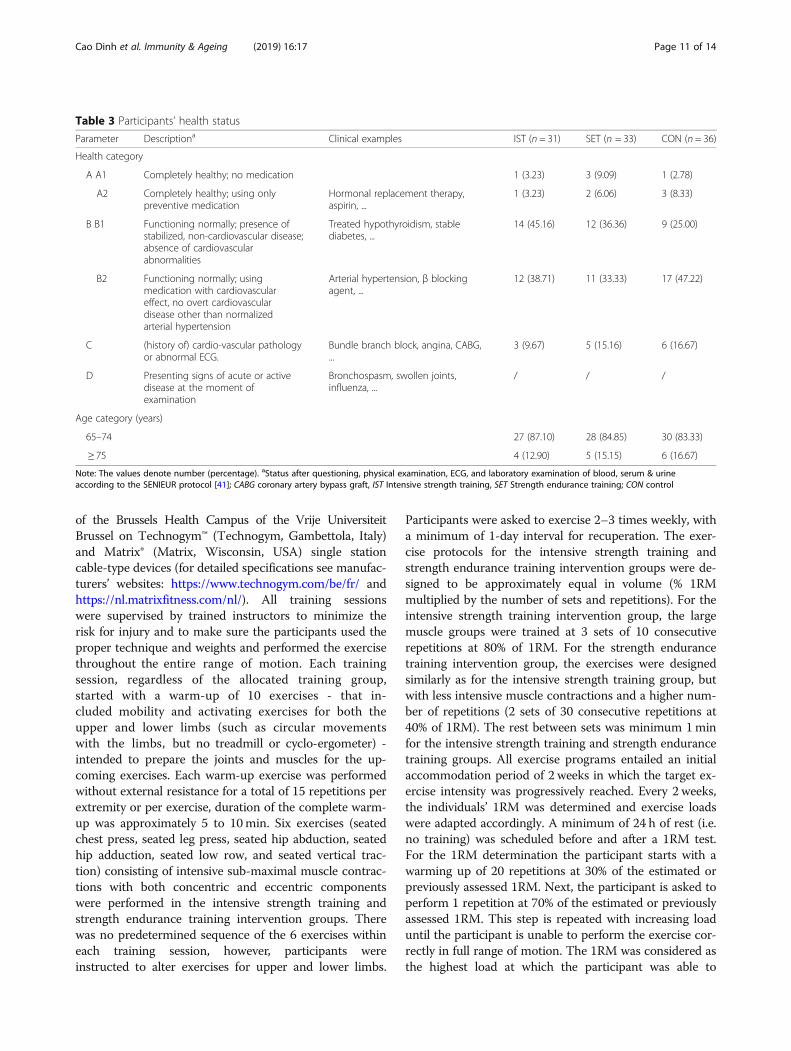
Health categories and randomizationParticipants were initially classified into health categories(see Table 3) based on a modified SENIEUR’s protocoland according to the risk for complications during
Cao Dinh et al. Immunity & Ageing (2019) 16:17 Page 9 of 14
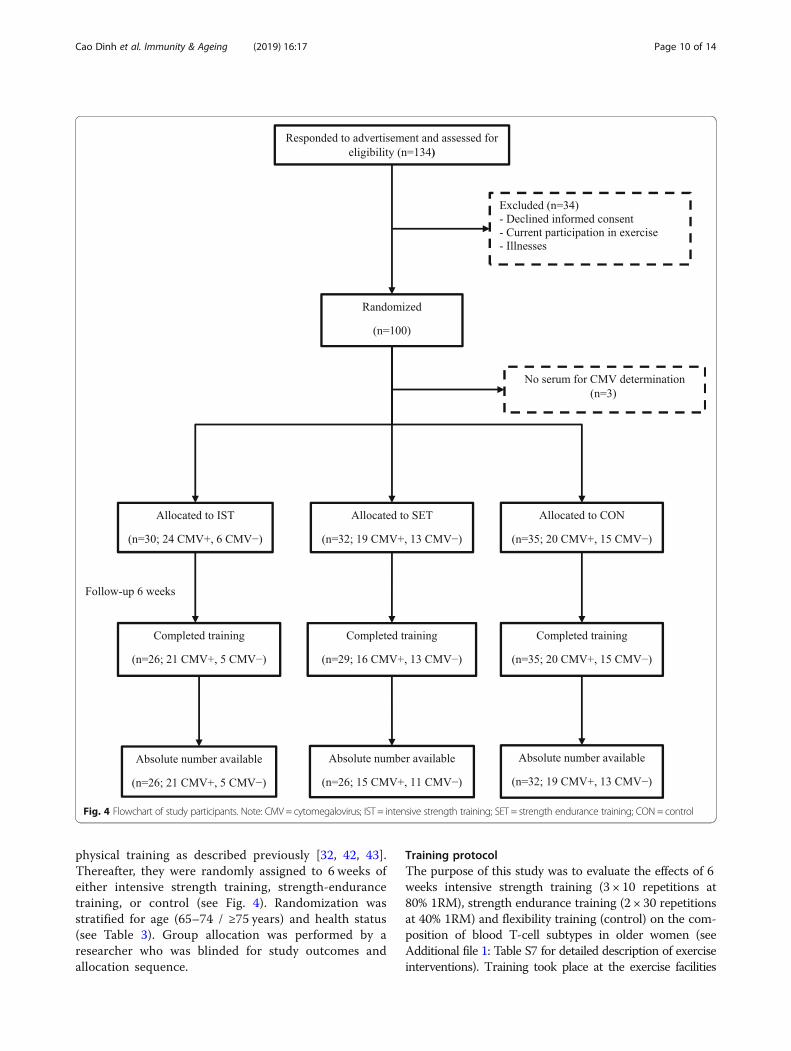
physical training as described previously [32, 42, 43].Thereafter, they were randomly assigned to 6 weeks ofeither intensive strength training, strength-endurancetraining, or control (see Fig. 4). Randomization wasstratified for age (65–74 / ≥75 years) and health status(see Table 3). Group allocation was performed by aresearcher who was blinded for study outcomes andallocation sequence.
Training protocolThe purpose of this study was to evaluate the effects of 6weeks intensive strength training (3 × 10 repetitions at80% 1RM), strength endurance training (2 × 30 repetitionsat 40% 1RM) and flexibility training (control) on the com-position of blood T-cell subtypes in older women (seeAdditional file 1: Table S7 for detailed description of exerciseinterventions). Training took place at the exercise facilities
Fig. 4 Flowchart of study participants. Note: CMV = cytomegalovirus; IST = intensive strength training; SET = strength endurance training; CON= control
Cao Dinh et al. Immunity & Ageing (2019) 16:17 Page 10 of 14
of the Brussels Health Campus of the Vrije UniversiteitBrussel on Technogym™ (Technogym, Gambettola, Italy)and Matrix® (Matrix, Wisconsin, USA) single stationcable-type devices (for detailed specifications see manufac-turers’ websites: https://www.technogym.com/be/fr/ andhttps://nl.matrixfitness.com/nl/). All training sessionswere supervised by trained instructors to minimize therisk for injury and to make sure the participants used theproper technique and weights and performed the exercisethroughout the entire range of motion. Each trainingsession, regardless of the allocated training group,started with a warm-up of 10 exercises - that in-cluded mobility and activating exercises for both theupper and lower limbs (such as circular movementswith the limbs, but no treadmill or cyclo-ergometer) -intended to prepare the joints and muscles for the up-coming exercises. Each warm-up exercise was performedwithout external resistance for a total of 15 repetitions perextremity or per exercise, duration of the complete warm-up was approximately 5 to 10min. Six exercises (seatedchest press, seated leg press, seated hip abduction, seatedhip adduction, seated low row, and seated vertical trac-tion) consisting of intensive sub-maximal muscle contrac-tions with both concentric and eccentric componentswere performed in the intensive strength training andstrength endurance training intervention groups. Therewas no predetermined sequence of the 6 exercises withineach training session, however, participants wereinstructed to alter exercises for upper and lower limbs.
Participants were asked to exercise 2–3 times weekly, witha minimum of 1-day interval for recuperation. The exer-cise protocols for the intensive strength training andstrength endurance training intervention groups were de-signed to be approximately equal in volume (% 1RMmultiplied by the number of sets and repetitions). For theintensive strength training intervention group, the largemuscle groups were trained at 3 sets of 10 consecutiverepetitions at 80% of 1RM. For the strength endurancetraining intervention group, the exercises were designedsimilarly as for the intensive strength training group, butwith less intensive muscle contractions and a higher num-ber of repetitions (2 sets of 30 consecutive repetitions at40% of 1RM). The rest between sets was minimum 1minfor the intensive strength training and strength endurancetraining groups. All exercise programs entailed an initialaccommodation period of 2 weeks in which the target ex-ercise intensity was progressively reached. Every 2 weeks,the individuals’ 1RM was determined and exercise loadswere adapted accordingly. A minimum of 24 h of rest (i.e.no training) was scheduled before and after a 1RM test.For the 1RM determination the participant starts with awarming up of 20 repetitions at 30% of the estimated orpreviously assessed 1RM. Next, the participant is asked toperform 1 repetition at 70% of the estimated or previouslyassessed 1RM. This step is repeated with increasing loaduntil the participant is unable to perform the exercise cor-rectly in full range of motion. The 1RM was considered asthe highest load at which the participant was able to
Table 3 Participants’ health status
Parameter Descriptiona Clinical examples IST (n = 31) SET (n = 33) CON (n = 36)
Health category
A A1 Completely healthy; no medication 1 (3.23) 3 (9.09) 1 (2.78)
A2 Completely healthy; using onlypreventive medication
Hormonal replacement therapy,aspirin, ...
1 (3.23) 2 (6.06) 3 (8.33)
B B1 Functioning normally; presence ofstabilized, non-cardiovascular disease;absence of cardiovascularabnormalities
Treated hypothyroidism, stablediabetes, ...
14 (45.16) 12 (36.36) 9 (25.00)
B2 Functioning normally; usingmedication with cardiovasculareffect, no overt cardiovasculardisease other than normalizedarterial hypertension
Arterial hypertension, β blockingagent, ...
12 (38.71) 11 (33.33) 17 (47.22)
C (history of) cardio-vascular pathologyor abnormal ECG.
Bundle branch block, angina, CABG,...
3 (9.67) 5 (15.16) 6 (16.67)
D Presenting signs of acute or activedisease at the moment ofexamination
Bronchospasm, swollen joints,influenza, ...
/ / /
Age category (years)
65–74 27 (87.10) 28 (84.85) 30 (83.33)
≥ 75 4 (12.90) 5 (15.15) 6 (16.67)
Note: The values denote number (percentage). aStatus after questioning, physical examination, ECG, and laboratory examination of blood, serum & urineaccording to the SENIEUR protocol [41]; CABG coronary artery bypass graft, IST Intensive strength training, SET Strength endurance training; CON control
Cao Dinh et al. Immunity & Ageing (2019) 16:17 Page 11 of 14

perform the exercise correctly in full range of motion. Theload corresponding to 1RM was reached in maximum 4to 5 steps.The control group performed a “placebo” flexibility
training consisting of 3 sets of sustained (30 s) passive,static stretching exercises of the large muscle groups (foradherence purpose). Stretching exercises act principallyby applying mechanical tension on the muscles and ten-dons, leading to improved range of motion [44]. There-fore, this type of exercise - which mainly induces apassive load on the muscles and tendons without musclecontractions or cardiovascular challenge - was chosen asa control intervention.
Anthropometric measurementsWeight was measured using a SECA balance, which wasregularly calibrated to the nearest 0,1 kg. Height was de-termined using a SECA measuring rod to the nearest 0,1 cm. Body mass index was calculated - using the mea-surements of height and weight - as weight divided byheight squared (weight (kg)/ height2 (m2)).
Flow cytometry analysisVenous blood specimens were collected before and after6 weeks (24 h–48 h after the last training session) in themorning for serum (stored at − 80 °C until analysis) andfor EDTA anticoagulated blood. Peripheral blood leuco-cytes were recovered as described previously [3]. Briefly,EDTA blood was exposed to lysis buffer for 10 min.After lysing the red blood cells, the blood leucocytes werecentrifuged at 900×g for 4 min at room temperature.Thereafter, the cells were isolated, washed twice in PBScontaining 1% BSA at 900×g for 3min, and re-suspendedin 200 μl PBS containing 1% BSA.Antibodies were initially titrated to determine the opti-
mal conditions for flow cytometry analysis before stain-ing. About 5 × 10⁵ cells were stained with 3 μL each ofPE-CY5-labelled anti-CD8 (Becton Dickinson, San Jose,CA, USA), PE-CY7-labelled anti-CD3 (Biolegend, SanDiego, CA, USA), FITC-labelled anti-CD28 (Biolegend,San Diego, CA, USA), Dazzel-labelled anti-CD45 andPE-labelled anti-CD57 (Biolegend, San Diego, CA, USA).After 20 min of incubation at room temperature in thedark, cells were washed at 900×g for 3 min, and 500 μLof FACS flow solution (Becton Dickinson, San Jose, CA,USA) were added.The labelled samples were analysed with a Coulter FC
500 flow cytometer (Beckman Coulter, Fullerton, CA,USA). Data acquisition was performed using the CoulterCXP software (Epics). The lymphocyte subpopulationwas gated according to size and granularity in theforward vs. side scattergram, thereby excluding deadcells. Fluorescence-minus-one controls were used to dis-tinguish positive from negative events and the various
lymphocyte clusters were identified according to theirexpression of a combination of surface markers (seeAdditional file 2: Figures S2A-D for the gating procedureand representative dot plots for the delineation of T-cellsub-populations per intervention group). The expression(or non-expression) of CD28 and CD57 are particularlyuseful in distinguishing between subsets of differentiatedT-cells. Based on these surface markers, CD8– andCD8+ T-cells were separated into four distinct sub-pop-ulations including CD28 + CD57–, CD28–CD57–,CD28–CD57+ and CD28 + CD57+. We used the termin-ologies naive (CD28 + CD57–, consisting predominantlyof naive T-cells and perhaps some early differentiatedT-cells), memory (CD28–CD57–), and senescence-prone(CD28–CD57+ and CD28 + CD57+) phenotypes to definethe distinct subsets as previously described [3]. Absoluteblood counts were measured using a dual platform meth-odology (flow cytometry and the Cell-Dyn Sapphirehaematology analyser (Abbott Diagnostics Division, SantaClara, CA)).
Serum CMV IgG and CRP determinationSerum levels of CMV IgG were measured by a chemilu-minescent microparticle immunoassay on the ARCHI-TECT iSystem (Abbott Diagnostics, Abbott Park, Ireland)with an assay sensitivity and specificity of 100 and 99%, re-spectively. Assays were regarded as positive if they had con-centrations of 6.0 arbitrary units (AU)/mL or greater andnegative if they had concentrations of less than 6.0 AU/mL.The detection limit of 6 AU/mL was based on the indica-tions from the manufacturer of the CMV IgG kit. Theintra-assay and inter-assay coefficients of variation rangedfrom 4.39 to 5.67% and from 4.87 to 6.17%, respectively.CRP was quantified by immunonephelometry using thehigh sensitivity CRP kit obtained from Dade Behring(Marburg GmbH, Germany). For CRP determination, thelimit of detection was 0.175mg/L and the intra-assay andinter-assay coefficients of variation ranged from 3.1 to 4.4%and from 2.5 to 5.7%, respectively. All reagents were appliedaccording to the manufacturers’ instructions.
Statistical analysesData distribution was tested by using the Kolmogorov-Smirnov Goodness of Fit test. Most of the parametersdid not follow normal distribution even after log-trans-formation and therefore, nonparametric tests were ap-plied during analysis. The Wilcoxon’s Signed Rank test,Kruskal-Wallis test and Mann-Whitney U test were usedfor continuous variables. Comparisons between categor-ical variables were performed using the chi-square testor Fisher exact test, where appropriate. Associationswere explored by Spearman’s bivariate correlation test.The Kruskal-Wallis test was employed to test for differ-ence among the intervention groups. When a significant
Cao Dinh et al. Immunity & Ageing (2019) 16:17 Page 12 of 14
difference was detected, between-group pairwise compari-sons were performed using the Mann-Whitney U test.Wilcoxon’s Signed Rank test was applied for assessingtime-effects. Changes after 6 weeks intervention were cal-culated and compared among the intensive strength train-ing, strength endurance training and the control groupsusing Kruskal-Wallis test (and Mann-Whitney U test forpost-hoc testing). Statistical analysis was performed usingIBM SPSS version 24.0. Statistical significance was set apriori at two-sided p < 0.05.
Additional files
Additional file 1: Table S1. Linear regression analysis of the associationbetween the levels of baseline CMV IgG and the absolute counts of thesenescence-prone T-cells, adjusted for age. Note: CMV = cytomegalovirus;SEB = standard error of the unstandardized regression coefficient. TableS2. Linear regression analysis of the association between the levels ofbaseline CMV IgG and the proportion of the senescence-prone T-cells,adjusted for age. Note: CMV = cytomegalovirus; SEB = standard error ofthe unstandardized regression coefficient. Table S3. Percentage andabsolute counts of T-cell subsets at baseline in the different interventiongroups with respect to CMV serostatus. Note: The values denote median(Interquartile range). CMV = cytomegalovirus; SPC = senescence-pronecells; IST = intensive strength training; SET = strength-endurance training;CON = control. T-cell subsets were expressed as percentages within theCD3 + CD8+ or CD3 + CD8− T-cells or absolute number of cells inperipheral blood (cells/μL). aResults of Kruskal-Wallis test. Table S4.Training-induced changes in the absolute counts of CD8− T-cellphenotypes at 6 weeks compared to baseline among the differentintervention groups in CMV seropositive participants. Table S5. Training-induced changes in the absolute counts of T-cell subsets among thedifferent intervention groups in CMV seronegative participants. Table S6.Training-induced changes in the percentage of T-cell subsets among thedifferent intervention groups in CMV seronegative participants. Table S7.Detailed description of exercise interventions. Note: 1RM = one repetitionmaximum. (ZIP 102 kb)
Additional file 2: Figure S1. Training-induced changes in the absolutecounts of naive and memory phenotypes stratified for CMV. Note: Dataare median values with error bars representing 95%CI. CMV =cytomegalovirus. *p < 0.05, increased significantly after exercisecompared to baseline. Figure S2. The gating procedure andrepresentative dot plots for the delineation of T-cell sub-populations byflow cytometry. Figure S2A (gating strategy), Figure S2B (representativeplots for the strength endurance training group), Figure S2C(representative plots for the intensive strength training group) and FigureS2D (representative plots for the control group). (ZIP 625 kb)
Abbreviations1RM: 1 repetition maximum; BMI: Body mass index; CABG: Coronary arterybypass graft; CMV: Cytomegalovirus; CRP: C-reactive protein; IL-6: Interleukin-6; PCR: Polymerase chain reaction; SPC: Senescence-prone cells;TNF-α: Tumour necrosis factor-α
AcknowledgementsNot applicable
Authors’ contributionsIB1 conceived the project; IB1, IB2, KL, LDD, AD and VK organized therecruitment of the study participants and the collection of samples; KLsupervised the participants during training; HCD, RN, OOO, WR, SVM and KJwere involved in the flow cytometry experiments and analysis; HCD, RN, andIB1 analysed the data. HCD, RN, and IB1 interpreted the data and wrote themanuscript. All authors read and approved the final version of the manuscript.
FundingThis study was partly funded by the scientific fund Willy Gepts from theUniversity Hospital (UZ Brussel) of the Vrije Universiteit Brussel (grant numberWFWG17). Hung Cao Dinh was supported by PhD scholarship from PeopleCommittee of Hochiminh City, Vietnam (35-QĐ/BTCTU).
Availability of data and materialsAll data generated or analysed during this study are included in thispublished article (and its supplementary information files).
Ethics approval and consent to participateThe study protocol was approved by the local ethics committee inaccordance with the Declaration of Helsinki and each participant gave awritten informed consent. All authors certify that they comply with theethical guidelines for authorship and publishing of “Immunity and Ageing”.
Consent for publicationNot applicable
Competing interestsThe authors declare that they have no competing interests.
Author details1Frailty in Ageing Research Group, Vrije Universiteit Brussel, Laarbeeklaan 103,B-1090 Brussels, Belgium. 2Gerontology Department, Vrije Universiteit Brussel,Laarbeeklaan 103, B-1090 Brussels, Belgium. 3Department of GeriatricMedicine, Universitair Ziekenhuis Brussel, Laarbeeklaan 101, B-1090 Brussels,Belgium. 4Laboratory of Hematology, Universitair Ziekenhuis Brussel,Laarbeeklaan 101, B-1090 Brussels, Belgium. 5Department of InternalMedicine, Pham Ngoc Thach University of Medicine, Ho Chi Minh City,Vietnam.
Received: 23 December 2018 Accepted: 12 July 2019
References1. Harman D. The aging process: major risk factor for disease and death. Proc
Natl Acad Sci U S A. 1991;88(12):5360–3.2. Ponnappan S, Ponnappan U. Aging and immune function: molecular
mechanisms to interventions. Antioxid Redox Signal. 2011;14(8):1551–85.3. Onyema OO, Njemini R, Bautmans I, Renmans W, De Waele M, Mets T.
Cellular aging and senescence characteristics of human T-lymphocytes.Biogerontology. 2012;13(2):169–81.
4. Castle SC. Clinical relevance of age-related immune dysfunction. Clin InfectDis. 2000;31(2):578–85.
5. Fagnoni FF, Vescovini R, Passeri G, Bologna G, Pedrazzoni M, Lavagetto G, etal. Shortage of circulating naive CD8(+) T cells provides new insights onimmunodeficiency in aging. Blood. 2000;95(9):2860–8.
6. Freund A, Orjalo AV, Desprez PY, Campisi J. Inflammatory networksduring cellular senescence: causes and consequences. Trends Mol Med.2010;16(5):238–46.
7. van Deursen JM. The role of senescent cells in ageing. Nature.2014;509(7501):439–46.
8. Davalos AR, Coppe JP, Campisi J, Desprez PY. Senescent cells as a sourceof inflammatory factors for tumor progression. Cancer Metastasis Rev.2010;29(2):273–83.
9. Simpson RJ, Bigley AB, Spielmann G, LaVoy EC, Kunz H, Bollard CM. Humancytomegalovirus infection and the immune response to exercise. ExercImmunol Rev. 2016;22:8–27.
10. Pawelec G, Koch S, Franceschi C, Wikby A. Human immunosenescence:does it have an infectious component? Ann N Y Acad Sci. 2006;1067:56–65.
11. van Boven M, van de Kassteele J, Korndewal MJ, van Dorp CH, KretzschmarM, van der Klis F, et al. Infectious reactivation of cytomegalovirus explainingage- and sex-specific patterns of seroprevalence. PLoS Comput Biol.2017;13(9):e1005719.
12. Stowe RP, Kozlova EV, Yetman DL, Walling DM, Goodwin JS, Glaser R.Chronic herpesvirus reactivation occurs in aging. Exp Gerontol.2007;42(6):563–70.
13. Khan N, Shariff N, Cobbold M, Bruton R, Ainsworth JA, Sinclair AJ, et al.Cytomegalovirus seropositivity drives the CD8 T cell repertoire
Cao Dinh et al. Immunity & Ageing (2019) 16:17 Page 13 of 14
toward greater clonality in healthy elderly individuals. J Immunol.2002;169(4):1984–92.
14. Strioga M, Pasukoniene V, Characiejus D. CD8+ CD28- and CD8+ CD57+ Tcells and their role in health and disease. Immunology. 2011;134(1):17–32.
15. Bautmans I, Njemini R, Vasseur S, Chabert H, Moens L, Demanet C, et al.Biochemical changes in response to intensive resistance exercise training inthe elderly. Gerontology. 2005;51(4):253–65.
16. Liberman K, Forti LN, Beyer I, Bautmans I. The effects of exercise on musclestrength, body composition, physical functioning and the inflammatoryprofile of older adults: a systematic review. Curr Opin Clin Nutr Metab Care.2017;20(1):30–53.
17. Forti LN, Van Roie E, Njemini R, Coudyzer W, Beyer I, Delecluse C, et al.Effects of resistance training at different loads on inflammatory markers inyoung adults. Eur J Appl Physiol. 2017;117(3):511–9.
18. Forti LN, Van Roie E, Njemini R, Coudyzer W, Beyer I, Delecluse C, et al.Load-specific inflammation mediating effects of resistance training in olderpersons. J Am Med Dir Assoc. 2016;17(6):547–52.
19. McFarlin BK, Flynn MG, Campbell WW, Craig BA, Robinson JP, Stewart LK, etal. Physical activity status, but not age, influences inflammatory biomarkersand toll-like receptor 4. J Gerontol A Biol Sci Med Sci.2006;61(4):388–93.
20. Simpson RJ, Lowder TW, Spielmann G, Bigley AB, LaVoy EC, Kunz H. Exerciseand the aging immune system. Ageing Res Rev. 2012;11(3):404–20.
21. Krüger K, Lechtermann A, Fobker M, Völker K, Mooren F. Exercise-inducedredistribution of T lymphocytes is regulated by adrenergic mechanisms.Brain Behav Immun. 2008;22(3):324–38.
22. Mooren FC, Kruger K. Apoptotic lymphocytes induce progenitor cellmobilization after exercise. J Appl Physiol. 2015;119(2):135–9.
23. Silva LC, de Araujo AL, Fernandes JR, Matias Mde S, Silva PR, Duarte AJ, et al.Moderate and intense exercise lifestyles attenuate the effects of aging ontelomere length and the survival and composition of T cell subpopulations.Age (Dordr). 2016;38(1):24.
24. Kapasi ZF, Ouslander JG, Schnelle JF, Kutner M, Fahey JL. Effects of anexercise intervention on immunologic parameters in frail elderly nursinghome residents. J Gerontol A Biol Sci Med Sci. 2003;58(7):636–43.
25. Allison DJ, Ditor DS. The common inflammatory etiology of depressionand cognitive impairment: a therapeutic target. J Neuroinflammation.2014;11:151.
26. Cao Dinh H, Bautmans I, Beyer I, Mets T, Onyema OO, Forti LN, et al.Association between Immunosenescence phenotypes and pre-frailty in oldersubjects: does Cytomegalovirus play a role? J Gerontol A Biol Sci Med Sci.2018;74:480–8.
27. Simpson RJ, Cosgrove C, Chee MM, McFarlin BK, Bartlett DB, Spielmann G,et al. Senescent phenotypes and telomere lengths of peripheral bloodT-cells mobilized by acute exercise in humans. Exerc Immunol Rev.2010;16:40–55.
28. Wielemborek-Musial K, Szmigielska K, Leszczynska J, Jegier A. Bloodpressure response to submaximal exercise test in adults. Biomed Res Int.2016;2016:5607507.
29. Murray DR, Irwin M, Rearden CA, Ziegler M, Motulsky H, Maisel AS.Sympathetic and immune interactions during dynamic exercise. Mediationvia a beta 2-adrenergic-dependent mechanism. Circulation. 1992;86:203–13.
30. Lavoy EC, Bigley AB, Spielmann G, Rector JL, Morrison MR, O'Connor DP, etal. CMV amplifies T-cell redeployment to acute exercise independently ofHSV-1 serostatus. Med Sci Sports Exerc. 2014;46(2):257–67.
31. Nicklas BJ, Hsu FC, Brinkley TJ, Church T, Goodpaster BH, Kritchevsky SB, etal. Exercise training and plasma C-reactive protein and interleukin-6 inelderly people. J Am Geriatr Soc. 2008;56(11):2045–52.
32. Forti LN, Njemini R, Beyer I, Eelbode E, Meeusen R, Mets T, et al. Strengthtraining reduces circulating interleukin-6 but not brain-derived neurotrophicfactor in community-dwelling elderly individuals. Age (Dordr).2014;36(5):9704.
33. Pawelec G, Akbar A, Beverley P, Caruso C, Derhovanessian E, Fulop T, et al.Immunosenescence and Cytomegalovirus: where do we stand after adecade? Immun Ageing. 2010;7:13.
34. Klenerman P, Oxenius A. T cell responses to cytomegalovirus. Nat RevImmunol. 2016;16(6):367–77.
35. Vincent KR, Vincent HK, Braith RW, Lennon SL, Lowenthal DT. Resistanceexercise training attenuates exercise-induced lipid peroxidation in theelderly. Eur J Appl Physiol. 2002;87(4–5):416–23.
36. Speir E. Cytomegalovirus gene regulation by reactive oxygen species.Agents in atherosclerosis. Ann N Y Acad Sci. 2000;899:363–74.
37. Silva LCR, de Araújo AL, Fernandes JR, Matias MST, Silva PR, Duarte AJ, et al.Moderate and intense exercise lifestyles attenuate the effects of aging ontelomere length and the survival and composition of T cell subpopulations.Age. 2016;38(1):24.
38. Geiger H, de Haan G, Florian MC. The ageing haematopoietic stem cellcompartment. Nat Rev Immunol. 2013;13(5):376–89.
39. Larbi A, Fulop T. From “truly naive” to “exhausted senescent” T cells: whenmarkers predict functionality. Cytometry A. 2014;85(1):25–35.
40. Folstein MF, Folstein SE, McHugh PR. Mini-mental state: a practical methodfor grading the cognitive state of patients for the clinician. J Psychiatr Res.1975;12(3):189–98.
41. Ligthart GJ, Corberand JX, Fournier C, Galanaud P, Hijmans W, Kennes B, etal. Admission criteria for immunogerontological studies in man: theSENIEUR protocol. Mech Ageing Dev. 1984;28(1):47–55.
42. Bautmans I, Lambert M, Mets T. The six-minute walk test in communitydwelling elderly: influence of health status. BMC Geriatr. 2004;4(1):6.
43. Beckwée D, Bautmans I, Scheerlinck T, Vaes P. Exercise in kneeosteoarthritis–preliminary findings: exercise-induced pain and health statusdiffers between drop-outs and retainers. Exp Gerontol. 2015;72:29–37.
44. Johnson EG, Bradley BD, Witkowski KR, McKee RY, Telesmanic CL, Chavez AS, etal. Effect of a static calf muscle-tendon unit stretching program onankle dorsiflexion range of motion of older women. J Geriatr Phys Ther.2007;30(2):49–52.
Publisher’s NoteSpringer Nature remains neutral with regard to jurisdictional claims inpublished maps and institutional affiliations.
Cao Dinh et al. Immunity & Ageing (2019) 16:17 Page 14 of 14


![€¦ · Web view2009. 4. 23. · [Cr2O72-] Reverse Rate. A. increases increases. B. increases decreases. C. decreases decreases. D. decreases increases. 31. A small amount of H2SO4](https://img.pdfslide.us/doc/110x75/608f2c47b9e3f5096f2e5efc/web-view-2009-4-23-cr2o72-reverse-rate-a-increases-increases-b-increases.jpg)