Embed Size (px)
Citation preview
8/8/2019 Six Sigma Introduction & Application_031020
http://slidepdf.com/reader/full/six-sigma-introduction-application031020 1/50
Six Sigma Introduction
& Application John Lu
MK3300
2003/10/10
8/8/2019 Six Sigma Introduction & Application_031020
http://slidepdf.com/reader/full/six-sigma-introduction-application031020 2/50
2 Six Sigma Introduction & Application
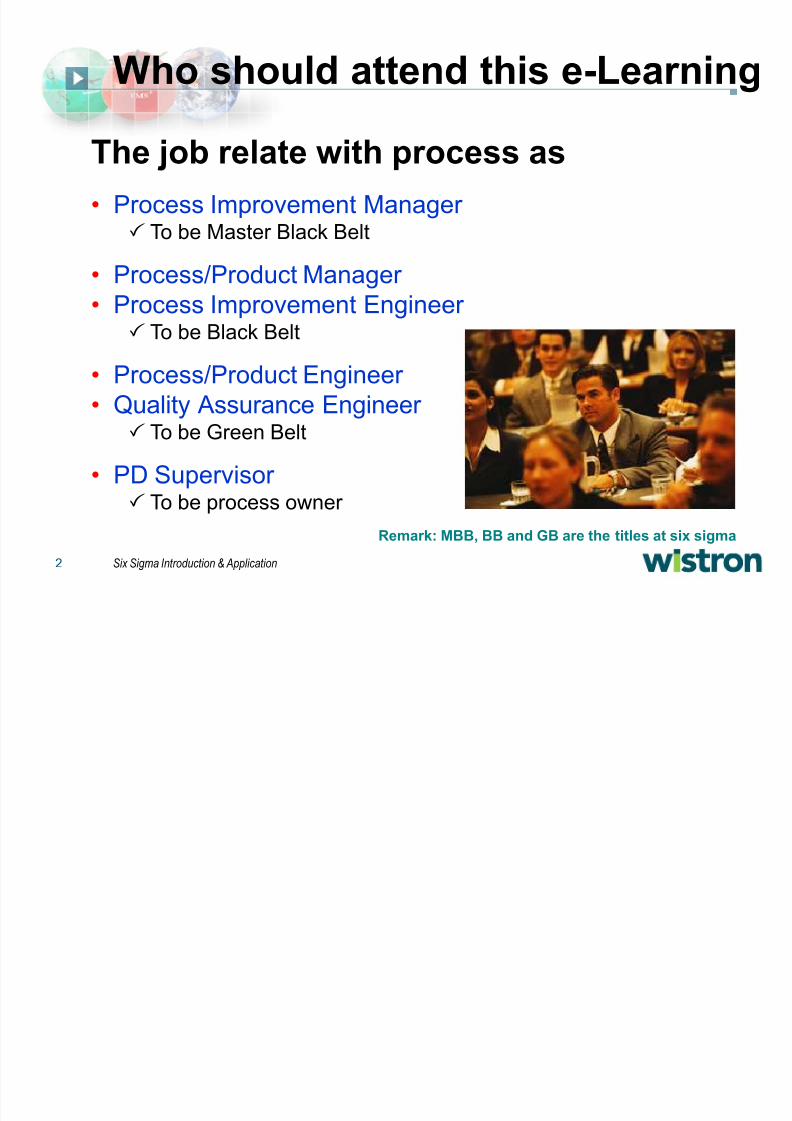
Who should attend this e-Learning
The job relate with process as
Process Improvement Manager To be Master Black Belt
Process/Product Manager Process Improvement Engineer
To be Black Belt
Process/Product Engineer
Quality Assurance Engineer To be Green Belt
PD Supervisor To be process owner
Remark: MBB, BB and GB are the titles at six sigma
8/8/2019 Six Sigma Introduction & Application_031020
http://slidepdf.com/reader/full/six-sigma-introduction-application031020 3/50
3 Six Sigma Introduction & Application
Outline of Six Sigma e-Learning
0. Over view ± 0.1. What¶s six sigma
± 0.2. Defect impact for process
1. Theory
± 1.1. Build up a six sigma project ± 1.2. Operation flow v.s. DMAIC
± 1.3. Apply statistics approach in the step of six sigma project
2. Practical Operation ± 2.1. Implement timing
± 2.2. Project Team member ± 2.3. Six Sigma Configuration
3. Case Study ± 3.1. E-CAT 500DPPM project
4. Appendix
8/8/2019 Six Sigma Introduction & Application_031020
http://slidepdf.com/reader/full/six-sigma-introduction-application031020 4/50
4 Six Sigma Introduction & Application
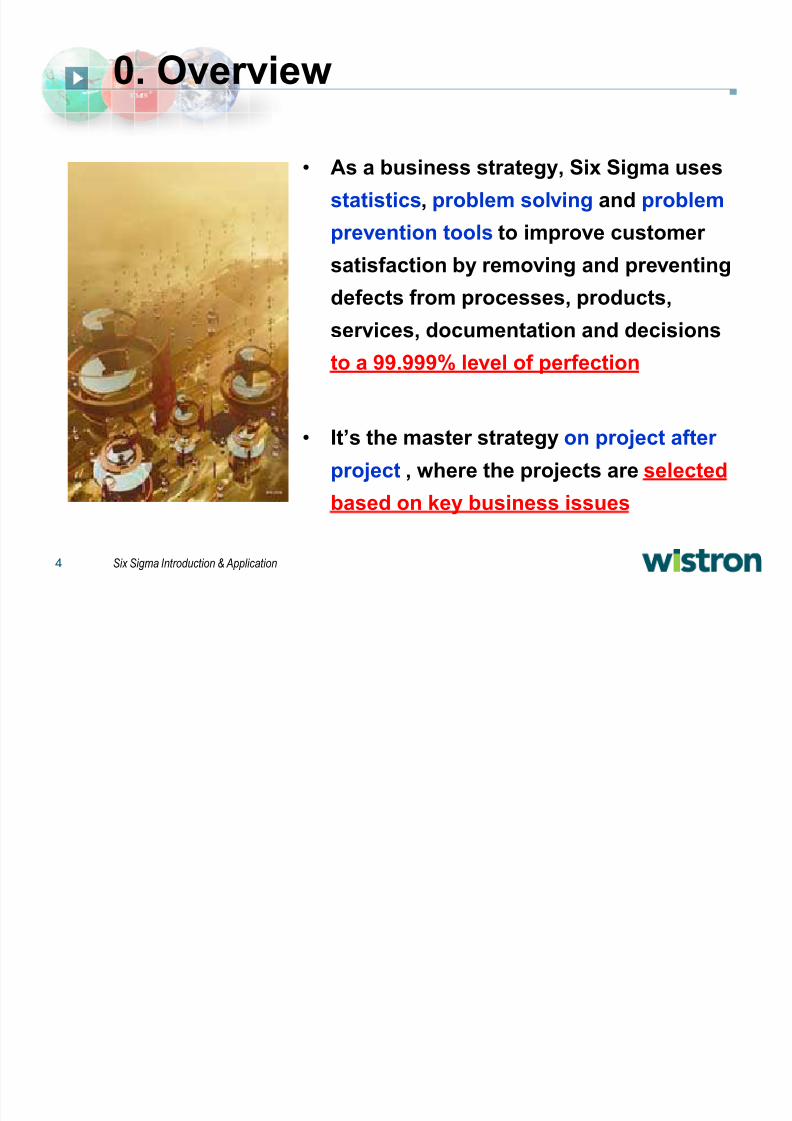
0. Over view
As a business strategy, Six Sigma uses
statistics, problem solving and problem
prevention tools to improve customer
satisfaction by removing and pre
venting
defects from processes, products,
ser vices, documentation and decisions
to a 99.999% level of perfection
It¶s the master strategy on project after
project , where the projects are selected
based on key business issues
8/8/2019 Six Sigma Introduction & Application_031020
http://slidepdf.com/reader/full/six-sigma-introduction-application031020 5/50
5 Six Sigma Introduction & Application
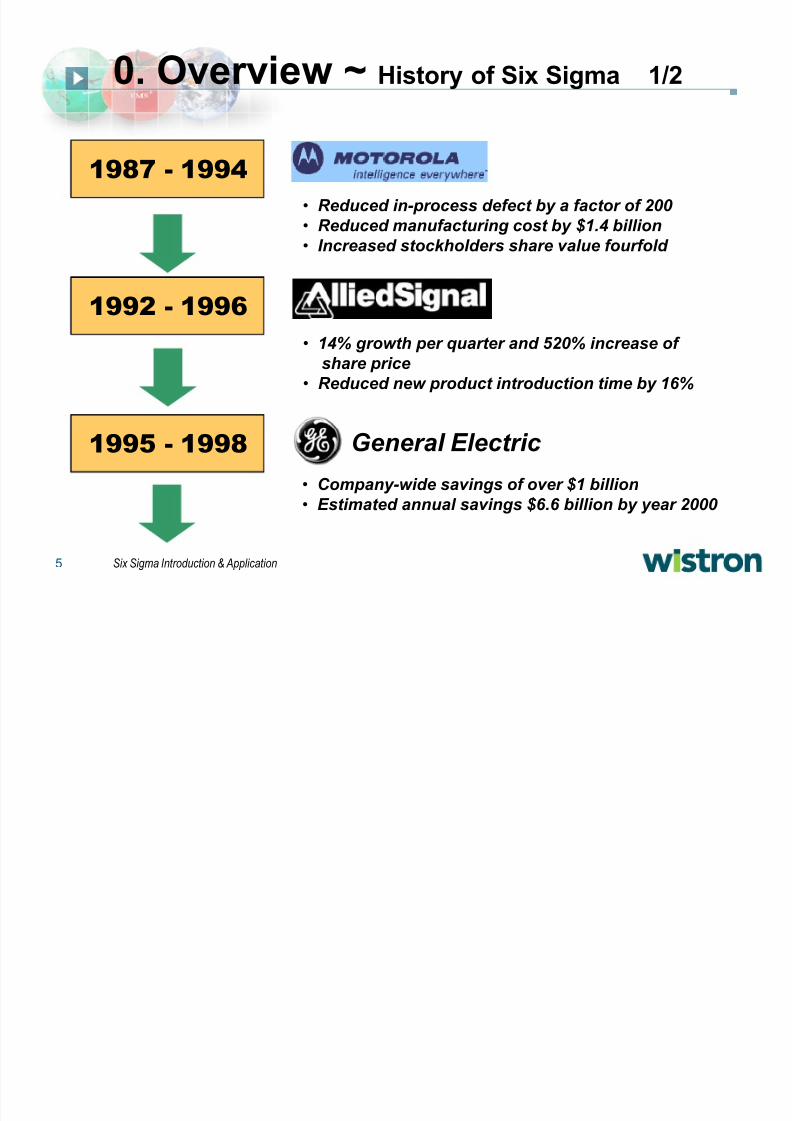
0. Over view ~ History of Six Sigma 1/2
1987 - 1994
1992 - 1996
1995 - 1998 General Electric
Reduced in-process defect by a factor of 200 Reduced manufacturing cost by $1.4 billion Increased stockholders share value fourfold
14% growth per quarter and 520% increase of share price
Reduced new product introduction time by 16%
Company-wide savings of over $1 billion Estimated annual savings $6.6 billion by year 2000

8/8/2019 Six Sigma Introduction & Application_031020
http://slidepdf.com/reader/full/six-sigma-introduction-application031020 6/50
8/8/2019 Six Sigma Introduction & Application_031020
http://slidepdf.com/reader/full/six-sigma-introduction-application031020 7/50
7 Six Sigma Introduction & Application
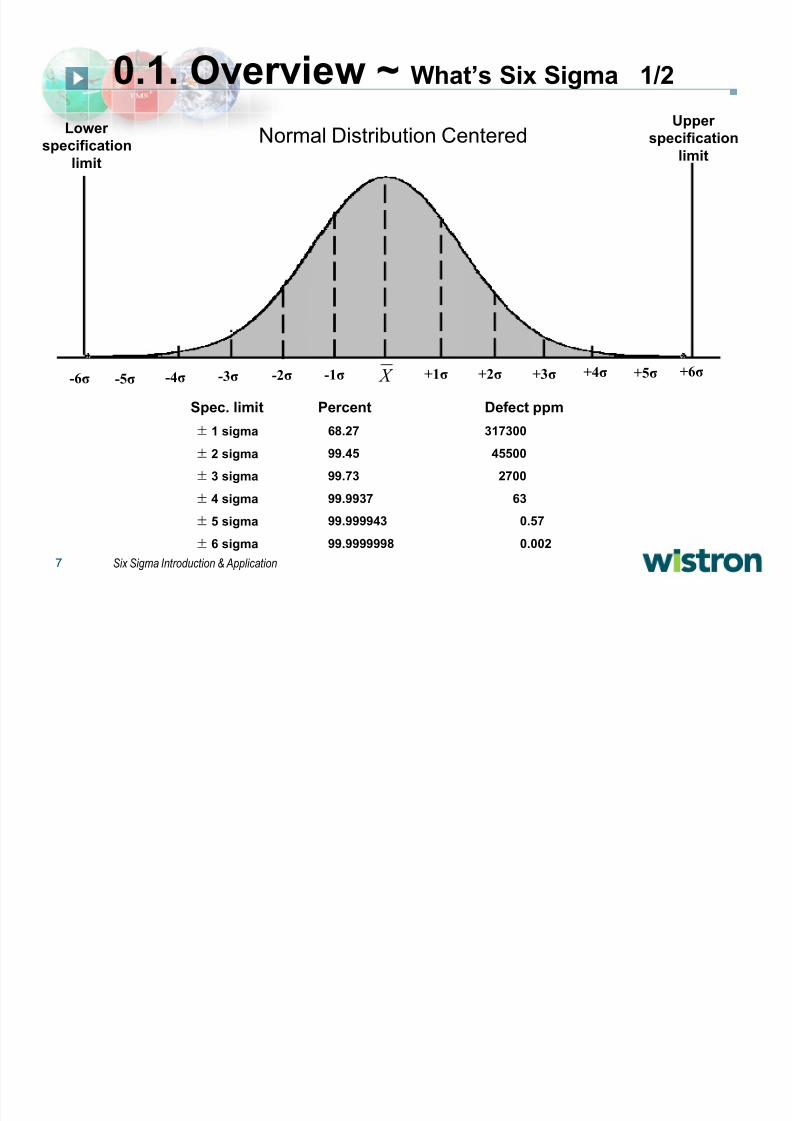
0.1. Over view ~ What¶s Six Sigma 1/2
-6+6-1 X -2-3-4-5 +1 +2 +3 +4 +5
Spec. limit Percent Defect ppm± 1 sigma 68.27 317300
± 2 sigma 99.45 45500
± 3 sigma 99.73 2700
± 4 sigma 99.9937 63
± 5 sigma 99.999943 0.57
± 6 sigma 99.9999998 0.002
Normal Distribution CenteredLower
specification
limit
Upper
specificationlimit
8/8/2019 Six Sigma Introduction & Application_031020
http://slidepdf.com/reader/full/six-sigma-introduction-application031020 8/50
8 Six Sigma Introduction & Application
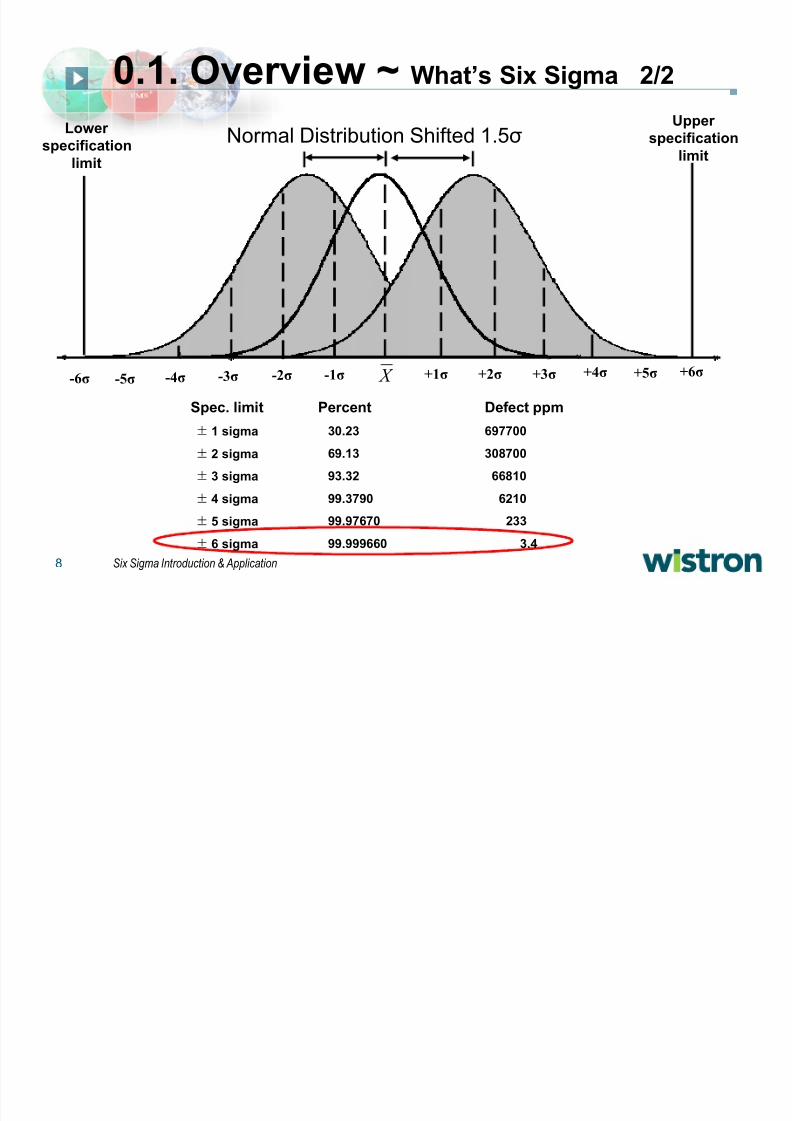
0.1. Over view ~ What¶s Six Sigma 2/2
-6+6-1 X -2-3-4-5 +1 +2 +3 +4 +5
Spec. limit Percent Defect ppm± 1 sigma 30.23 697700
± 2 sigma 69.13 308700
± 3 sigma 93.32 66810
± 4 sigma 99.3790 6210
± 5 sigma 99.97670 233
± 6 sigma 99.999660 3.4
Normal Distribution Shifted 1.5Lower
specification
limit
Upper
specificationlimit
8/8/2019 Six Sigma Introduction & Application_031020
http://slidepdf.com/reader/full/six-sigma-introduction-application031020 9/50
9 Six Sigma Introduction & Application
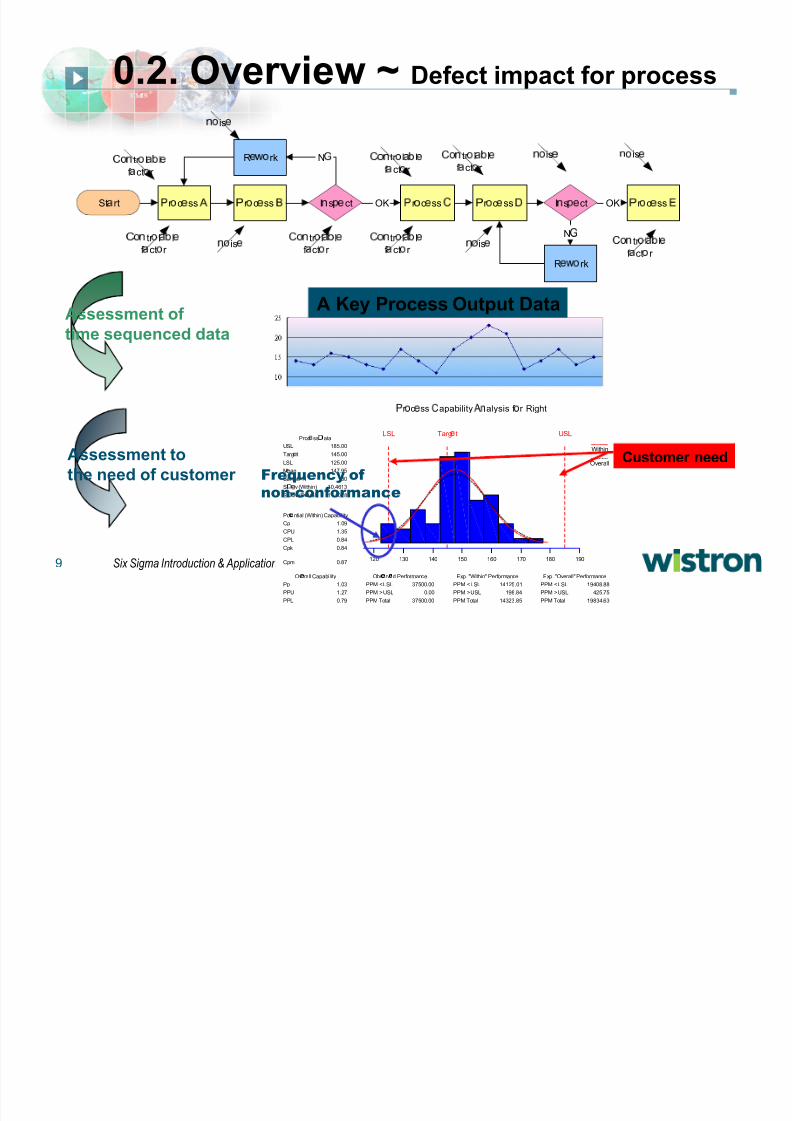
0.2. Over view ~ Defect impact for process
St
rt¡
r ¢
c£
ss¤ ¡
r ¢
c£
ss ¥ I ¦ s §
£
ct¡
r ¢
c£
ss ̈
¡
r ¢
c£
ss © I ¦ s §
£
ct
R£ ¢
rk
OK
N
N
R£
¢
rk
¡
r ¢
c£
ss OK
¦
¢
is£
¦
¢
is£
̈
¢
¦ tr ¢
l
l£
f
ct¢
r
̈
¢
¦ tr ¢
l
l£
f
ct¢
r ̈
¢
¦ tr ¢
l
l£
f
ct¢
r
̈
¢
¦ tr ¢
l
l£
f
ct¢
r
¦
¢
is£
̈
¢
¦ tr ¢
l
l£
f
ct¢
r
̈
¢
¦ tr ¢
l
l£
f
ct¢
r ¦
¢
is£
̈
¢
¦ tr ¢
l
l£
f
ct¢
r
¦
¢
is£
A Key Process Output DataAssessment of
time sequenced data
Assessment to
the need of customer
120 130 140 150 160 170 180 190
LSL USLTarg t
r c ss apability
alysis f r Right
USL
Targ! t
LSL
M! an
Sampl! N
St" !
v (Within)
St" !
v (Ov! r all)
Cp
CPU
CPL
Cpk
Cpm
Pp
PPU
PPL
PPM < LSL
PPM > USL
PPM Total
PPM < LSL
PPM > USL
PPM Total
PPM < LSL
PPM > USL
PPM Total
185.00
145.00
125.00
147.95
80
10.4613
11.1078
1.09
1.35
0.84
0.84
0.87
1.03
1.27
0.79
37500.00
0.00
37500.00
14125.01
198.84
14323.85
19408.88
425.75
19834.63
Pr oc ! ss " ata
Pot! ntial (Within) Capability
Ov! r all Capability Obs ! rv! d Perf ormance Exp. "Within" Perf ormance Exp. "Over all" Perf ormance
Within
Over allCustomer need
Frequency of
non-conformance
8/8/2019 Six Sigma Introduction & Application_031020
http://slidepdf.com/reader/full/six-sigma-introduction-application031020 10/50
10 Six Sigma Introduction & Application
1. Theory
To reduce variance under particular
level, and let six sigma (6) more
narrow to meet customer specification
1. To create a close loop system and it issensitive enough to reduce the waver for company from outside
2. Using a lot of statistics technique toassist project team for
Analyzing currentAnalyzing current situationsituation
Taking improvement planTaking improvement plan
Key conceptKey concept
PurposePurpose
8/8/2019 Six Sigma Introduction & Application_031020
http://slidepdf.com/reader/full/six-sigma-introduction-application031020 11/50
11 Six Sigma Introduction & Application
1.1. Build up a six sigma project
Choice a workable project
± Outer source
Customer voice, market voice,
opponent competition
± Inner/ Outer source
Help enterprise to overcome the
challenge from make a strategy or
customer tactic
± Inner source
Current operation¶s frustration,
event, issue or opportunity
8/8/2019 Six Sigma Introduction & Application_031020
http://slidepdf.com/reader/full/six-sigma-introduction-application031020 12/50
12 Six Sigma Introduction & Application
1.1. Build up a six sigma project
Define a project¶s rule
± Base on current demandcurrent demand,
abilityability and targettarget to choicemost suitable project
± Does this project have
mean? Can we manage it?
8/8/2019 Six Sigma Introduction & Application_031020
http://slidepdf.com/reader/full/six-sigma-introduction-application031020 13/50
13 Six Sigma Introduction & Application
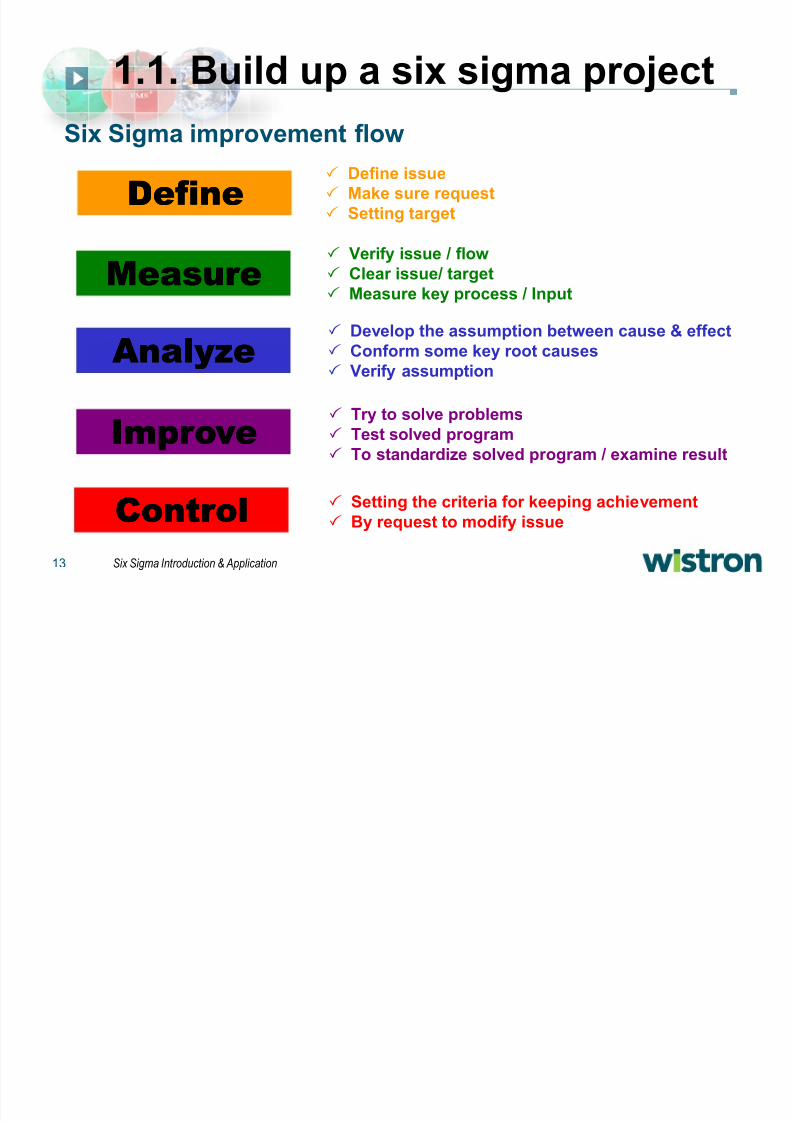
1.1. Build up a six sigma project
DefineDefine
MeasureMeasure
AnalyzeAnalyze
Impr oveImpr ove
Contr olContr ol
Six Sigma improvement flow Define issue
Make sure request
Setting target
Verify issue / flow
Clear issue/ target Measure key process / Input
Develop the assumption between cause & effect
Conform some key root causes
Verify assumption
Try to solve problems Test solved program
To standardize solved program / examine result
Setting the criteria for keeping achievement
By request to modify issue
8/8/2019 Six Sigma Introduction & Application_031020
http://slidepdf.com/reader/full/six-sigma-introduction-application031020 14/50
14 Six Sigma Introduction & Application
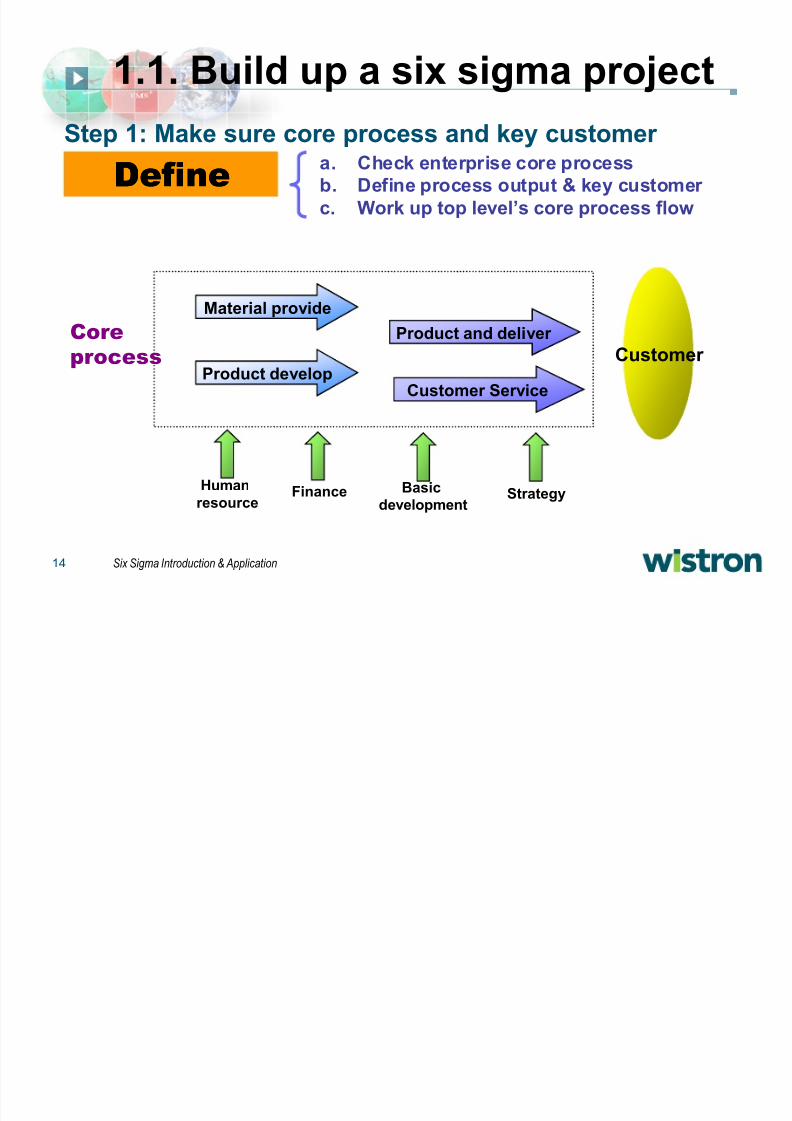
1.1. Build up a six sigma project
Step 1: Make sure core process and key customer DefineDefine
a. Check enterprise core process
b. Define process output & key customer
c. Work up top level¶s core process flow
Material provide
Product develop
Product and deliver
Customer Ser vice
Core
pr ocess Customer
Human
resourceFinance Basic
developmentStrategy
8/8/2019 Six Sigma Introduction & Application_031020
http://slidepdf.com/reader/full/six-sigma-introduction-application031020 15/50
15 Six Sigma Introduction & Application
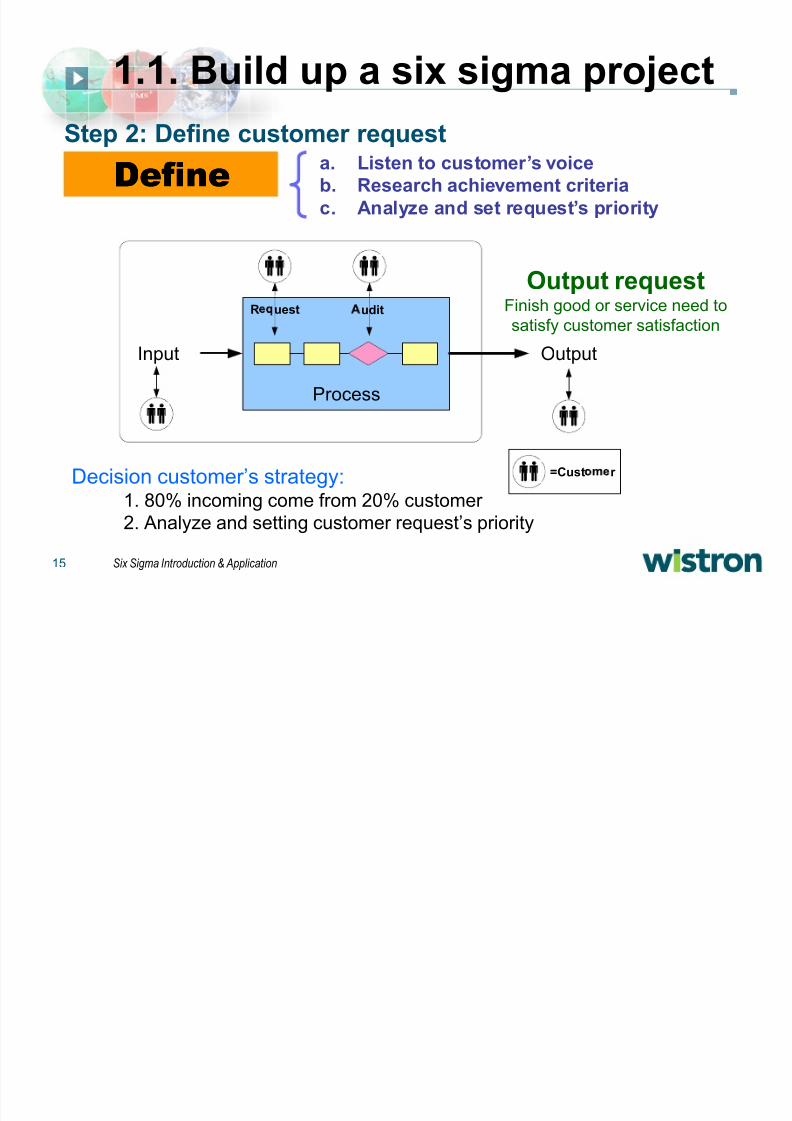
1.1. Build up a six sigma project
Step 2: Define customer requesta. Listen to customer¶s voice
b. Research achievement criteria
c. Analyze and set request¶s priority
DefineDefine
Output requestFinish good or service need to
satisfy customer satisfaction
Decision customer¶s strategy:1. 80% incoming come from 20% customer
2. Analyze and setting customer request¶s priority
Process
Input Output
=Cust r
R uest udit
8/8/2019 Six Sigma Introduction & Application_031020
http://slidepdf.com/reader/full/six-sigma-introduction-application031020 16/50
16 Six Sigma Introduction & Application
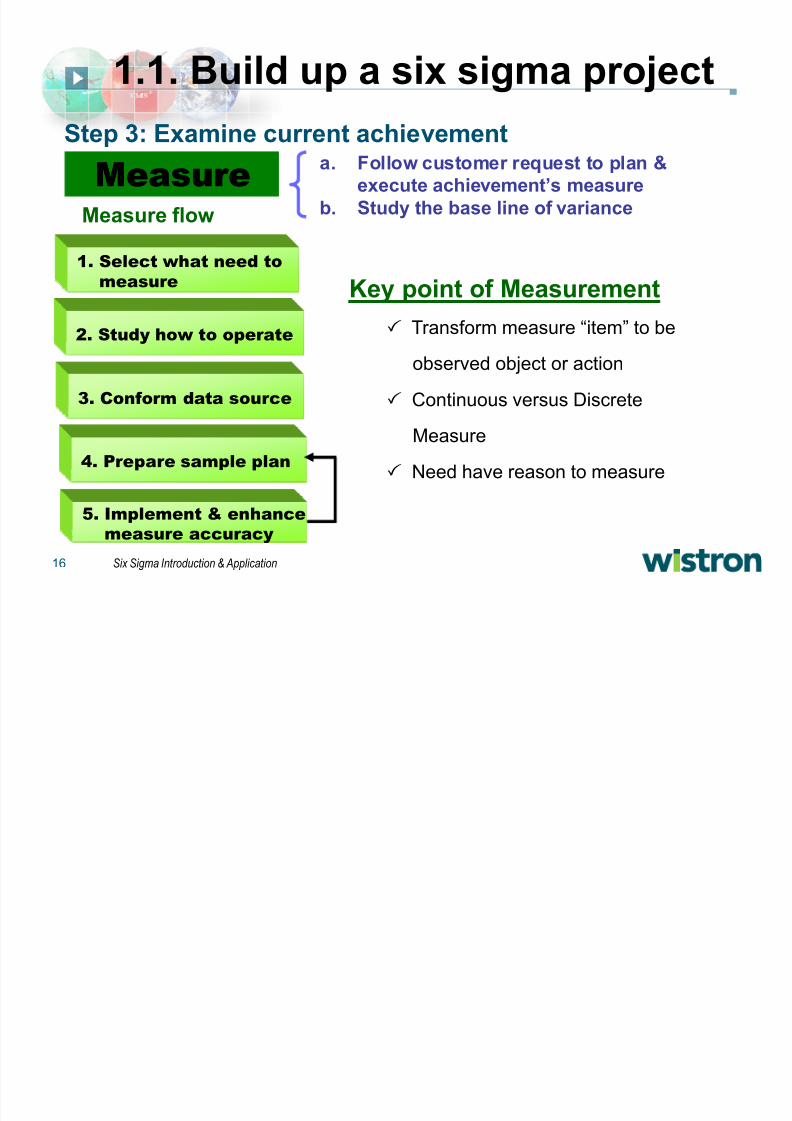
1.1. Build up a six sigma project
Step 3: Examine current achievementa. Follow customer request to plan &
execute achievement¶s measure
b. Study the base line of variance
MeasureMeasureMeasure flow
1. Select what need to
measure
2. Study how to operate
3. Conform data source
4. Prepare sample plan
5. Implement & enhance
measure accuracy
Key point of Measurement
Transform measure ³item´ to be
observed object or action
Continuous versus Discrete
Measure
Need have reason to measure
8/8/2019 Six Sigma Introduction & Application_031020
http://slidepdf.com/reader/full/six-sigma-introduction-application031020 17/50
17 Six Sigma Introduction & Application
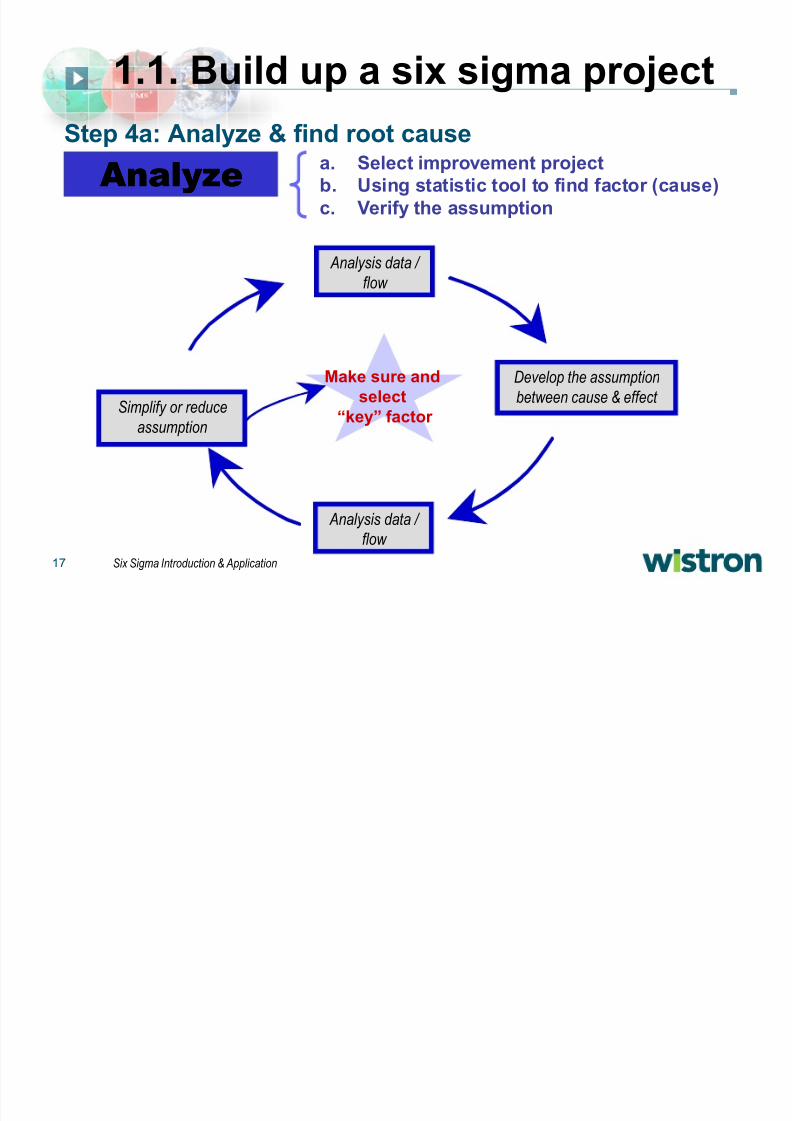
AnalyzeAnalyze
1.1. Build up a six sigma project
Step 4a: Analyze & find root causea. Select improvement project
b. Using statistic tool to find factor (cause)
c. Verify the assumption
Simplify or reduce
assumption
Develop the assumption
between cause & effect
Analysis data /
flow
Analysis data /
flow
Make sure and
select
³key´ factor
8/8/2019 Six Sigma Introduction & Application_031020
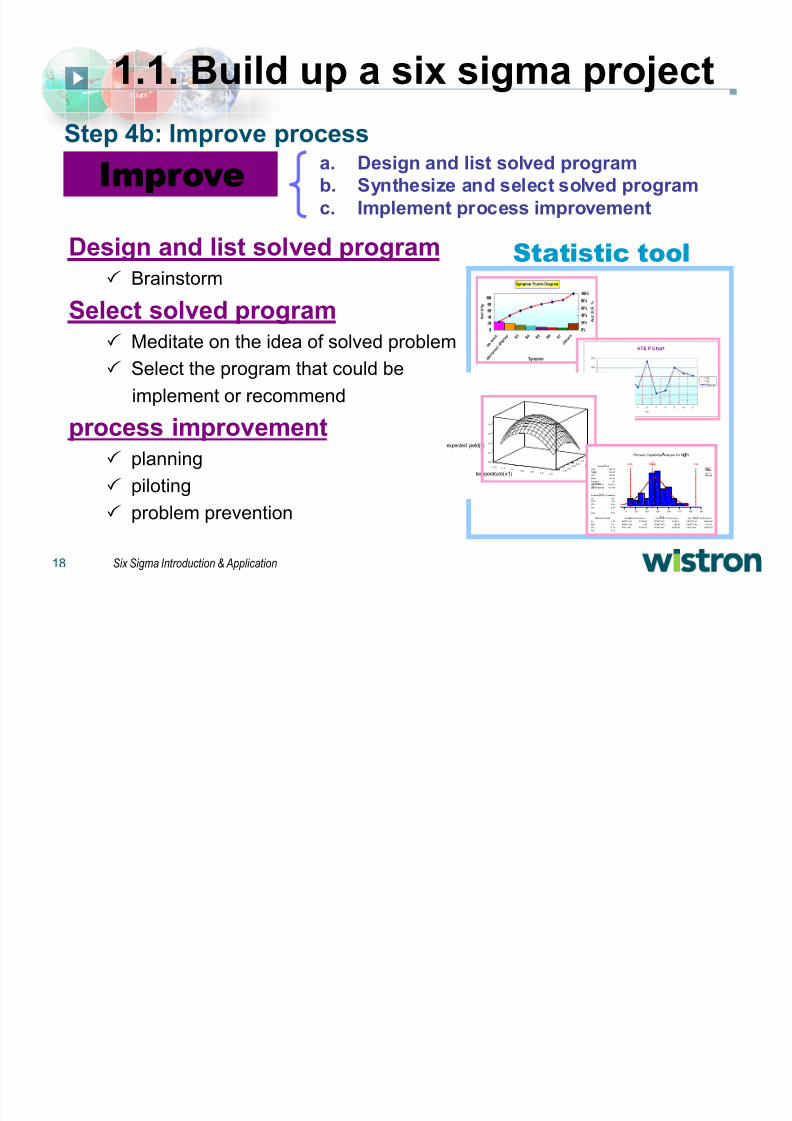
http://slidepdf.com/reader/full/six-sigma-introduction-application031020 18/50
8/8/2019 Six Sigma Introduction & Application_031020
http://slidepdf.com/reader/full/six-sigma-introduction-application031020 19/50
19 Six Sigma Introduction & Application
1.1. Build up a six sigma project
Step 5: Expand and integrate six sigma systemContr olContr ol
a. Implement close loop management and
go to six sigma
b. Define process owner & manage duty
Continuous measure & keep achievement Keep innovation and new approach
To do the effective scale and chart
To establish flow response plan
Define process owner & manage duty
Using process management
Implement close loop management and go to six sigma
Using process management tool
Process marker
Customer report card
8/8/2019 Six Sigma Introduction & Application_031020
http://slidepdf.com/reader/full/six-sigma-introduction-application031020 20/50
20 Six Sigma Introduction & Application
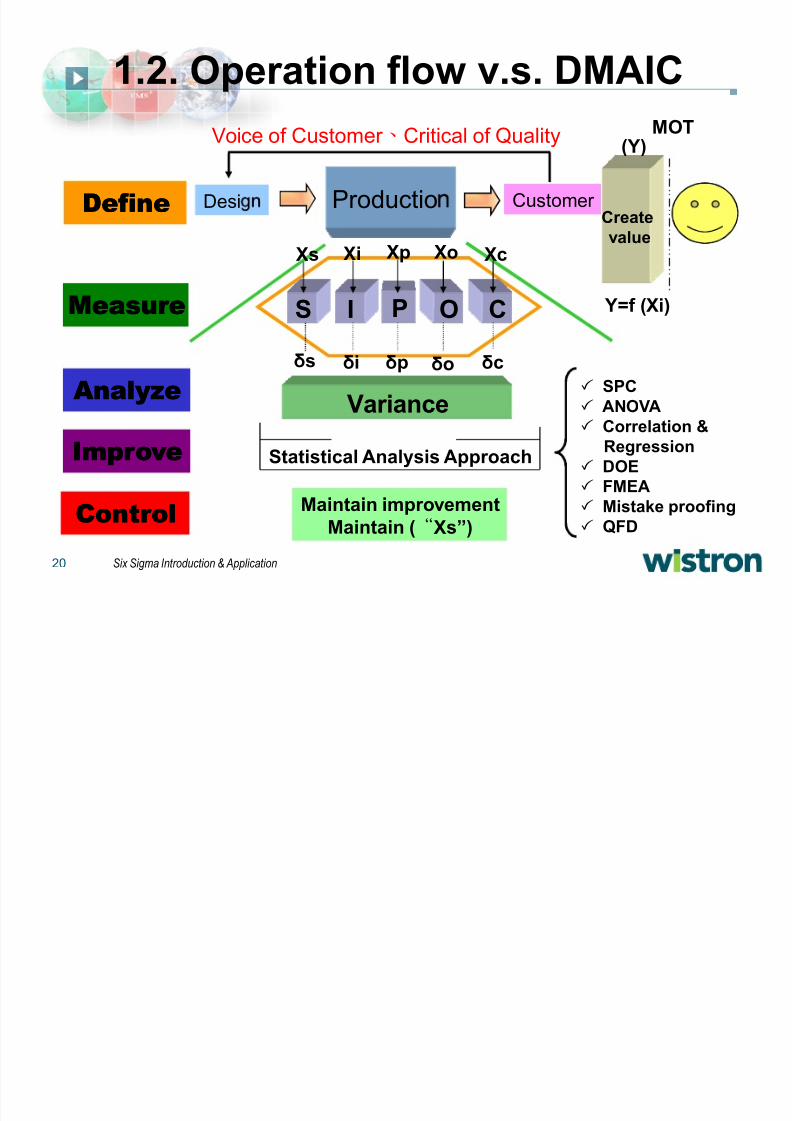
1.2. Operation flow v.s. DMAIC
Desi Productio Customer
Voice of Customer Critical of Quality
Xs Xi Xp Xo Xc
S I P O C
s i p o c
Statistical Analysis Approach
Maintain improvement
Maintain (Xs´)
Create
value
(Y)MOT
Y=f (Xi)
SPC
ANOVA
Correlation &
Regression
DOE
FMEA
Mistake proofing
QFD
DefineDefine
MeasureMeasure
AnalyzeAnalyze
Impr oveImpr ove
Contr olContr ol
Variance
8/8/2019 Six Sigma Introduction & Application_031020
http://slidepdf.com/reader/full/six-sigma-introduction-application031020 21/50
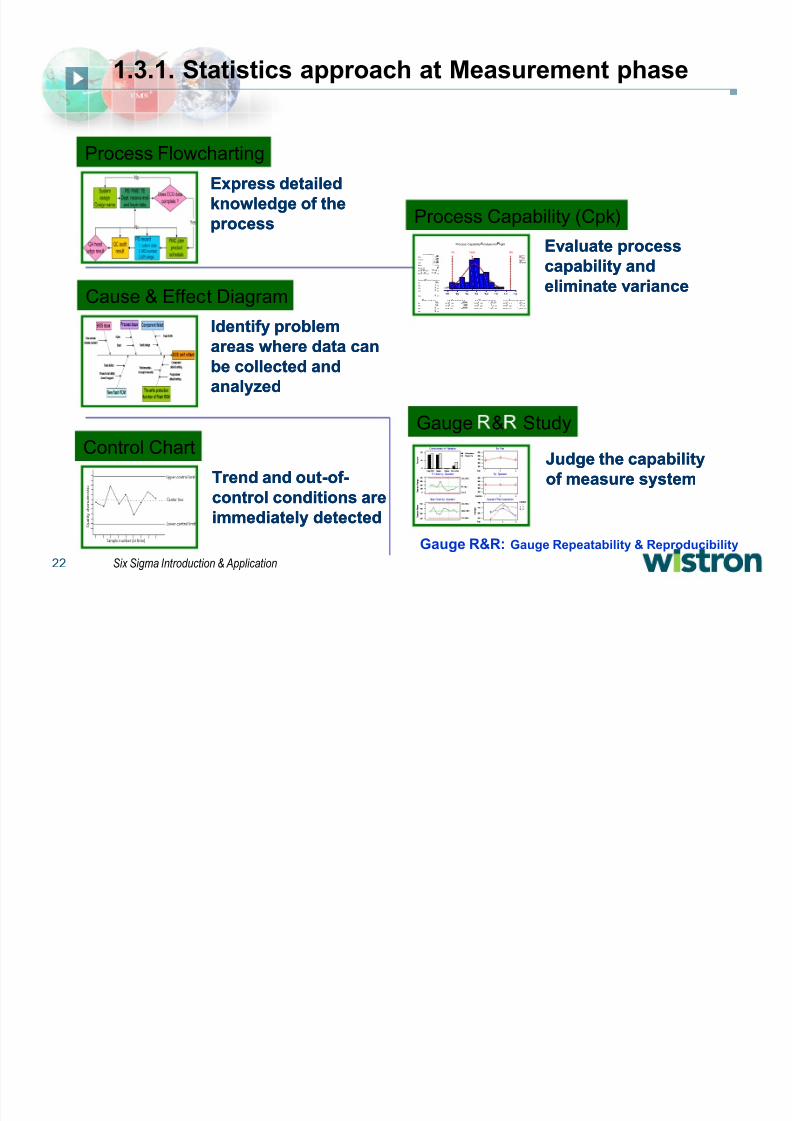
21 Six Sigma Introduction & Application
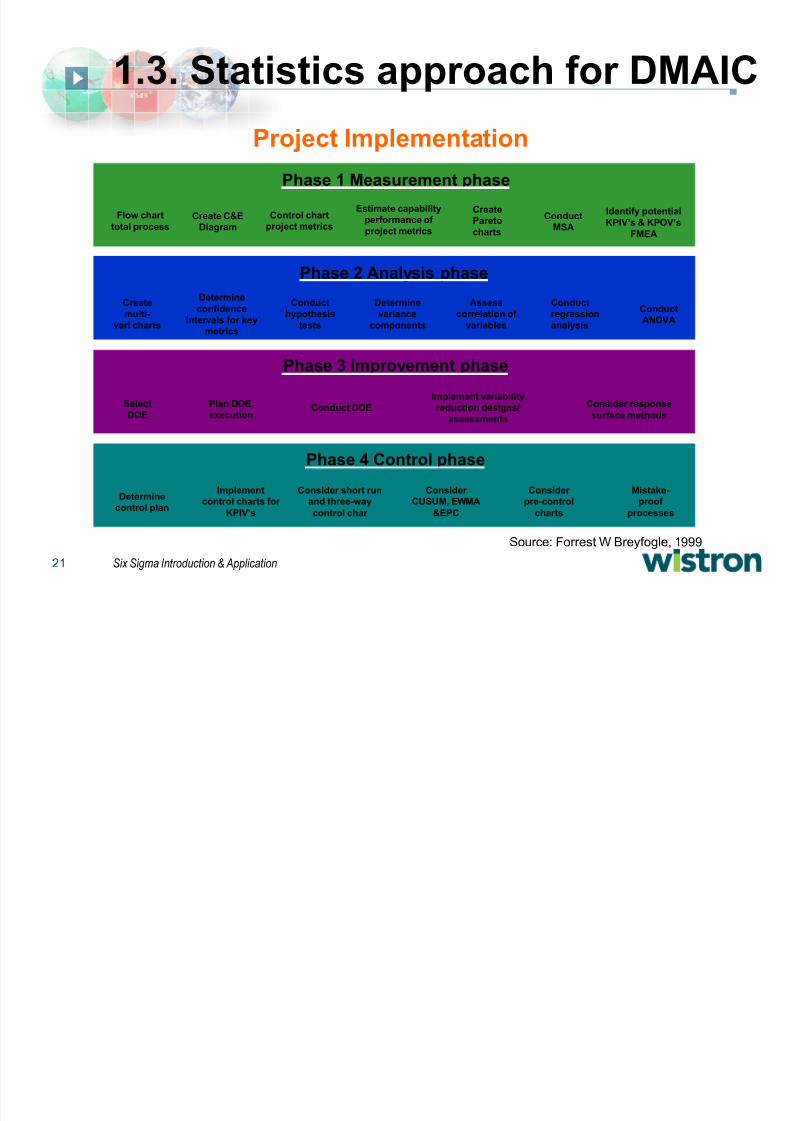
1.3. Statistics approach for DMAIC
Flow chart
total processCreate C&E
Diagram
Control chart
project metrics
Estimate capability
performance of
project metrics
Create
Pareto
charts
Conduct
MSA
Identify potential
KPIV¶s & KPOV¶s
FMEA
Create
multi-
vari charts
Determine
confidence
inter vals for key
metrics
Conduct
hypothesis
tests
Determine
variance
components
Assess
correlation of
variables
Conduct
regression
analysis
Conduct
ANOVA
Select
DOE
Plan DOE
execution
Conduct DOE
Implement variability
reduction designs/
assessments
Consider response
surface methods
Determine
control plan
Implement
control charts for
KPIV¶s
Consider short run
and three-way
control char
Consider
CUSUM, EWMA
&EPC
Consider
pre-control
charts
Mistake-
proof
processes
Phase 1 Measurement phase
Phase 2 Analysis phase
Phase 3 Improvement phase
Phase 4 Control phase
Project Implementation
Source: Forrest W Breyfogle, 1999
8/8/2019 Six Sigma Introduction & Application_031020
http://slidepdf.com/reader/full/six-sigma-introduction-application031020 22/50
8/8/2019 Six Sigma Introduction & Application_031020
http://slidepdf.com/reader/full/six-sigma-introduction-application031020 23/50
23 Six Sigma Introduction & Application
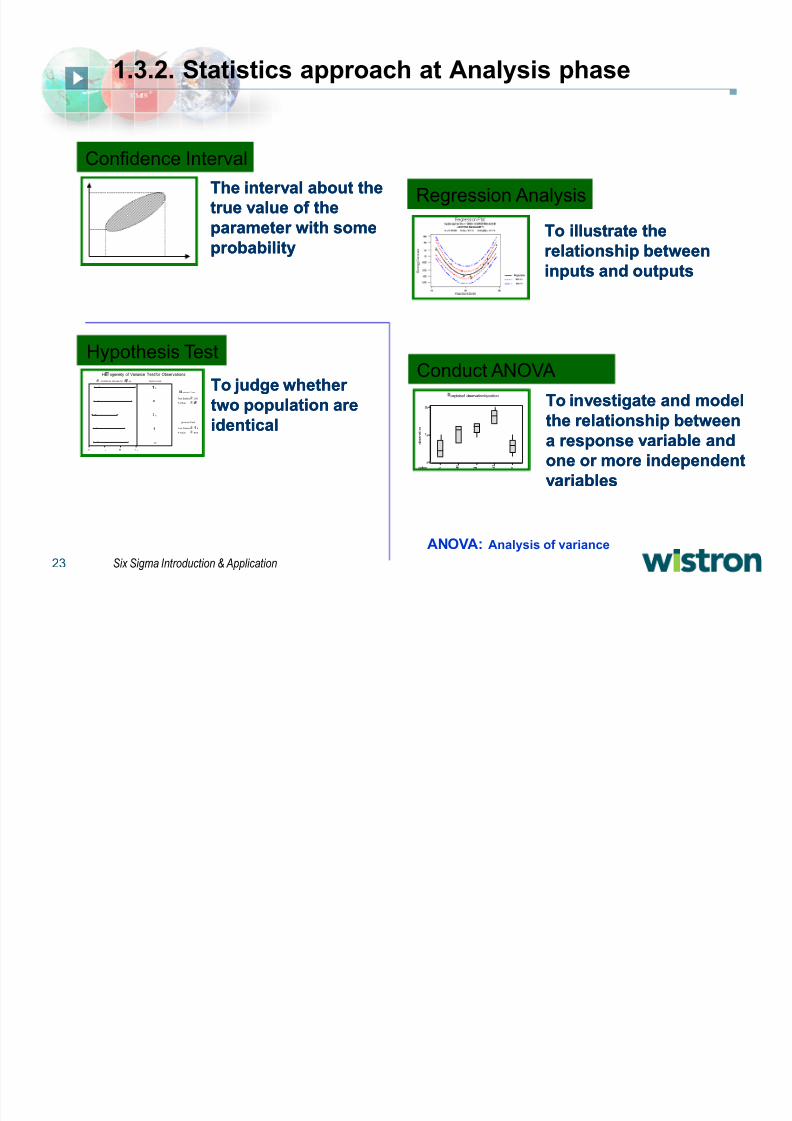
1.3.2. Statistics approach at Analysis phase
To illustrate theTo illustrate the
relationship betweenrelationship between
inputs and outputsinputs and outputs
To judge whether To judge whether
two population aretwo population are
identicalidentical
The inter val about theThe inter val about the
true value of thetrue value of the
parameter with someparameter with some
probabilityprobability
To investigate and modelTo investigate and model
the relationship betweenthe relationship betweena response variable anda response variable and
one or more independentone or more independent
variablesvariables
Regression Analysis
Conduct ANOVAHypothesis Test
Confidence Interval
R
5S
T
S5
3
T
3 5
5
U
5
V
5
cotton
o b s e r v a t i o n
W
oxplotsof observation bycotton
X
5Y X Y
5
95 ̀
Confidence Intervals for Siga
as
b artlett's T est
Test Statistic:c .933
P-Value : c .9d c
Levene'sT est
Test Statistic: c .3e
8
P-Value : c .863
Factor Levels
f 5
gh
g
5
3h
35
Hoi ogeneity of Variance Test for Observations
ANOVA: Analysis of variance
8/8/2019 Six Sigma Introduction & Application_031020
http://slidepdf.com/reader/full/six-sigma-introduction-application031020 24/50
8/8/2019 Six Sigma Introduction & Application_031020
http://slidepdf.com/reader/full/six-sigma-introduction-application031020 25/50
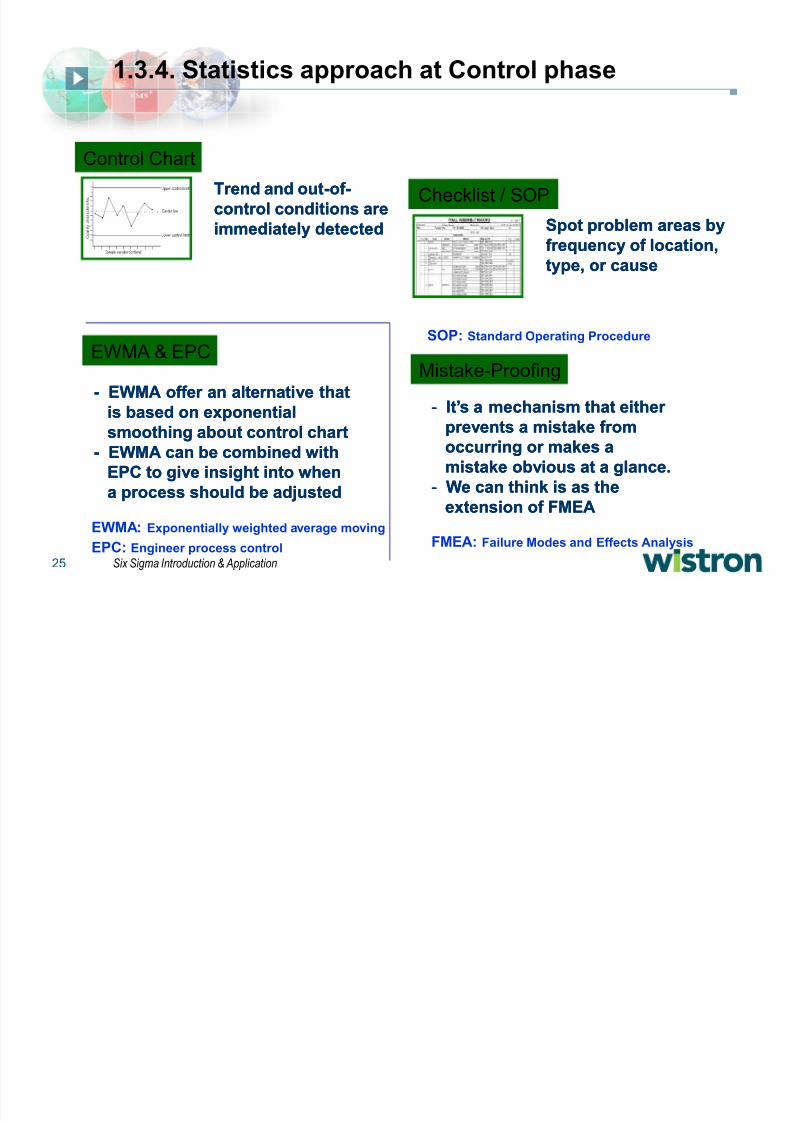
25 Six Sigma Introduction & Application
1.3.4. Statistics approach at Control phase
-- EWMA offer an alternative thatEWMA offer an alternative that
is based on exponentialis based on exponentialsmoothing about control chartsmoothing about control chart
-- EWMA can be combined withEWMA can be combined with
EPC to give insight into whenEPC to give insight into when
a process should be adjusteda process should be adjusted
Trend and outTrend and out--of of--
control conditions arecontrol conditions are
immediately detectedimmediately detected
Checklist / SOP
EWMA & EPC
Control Chart
Spot problem areas bySpot problem areas by
frequency of location,frequency of location,
type, or causetype, or cause
-- It¶s a mechanism that either It¶s a mechanism that either
prevents a mistake fromprevents a mistake from
occurring or makes aoccurring or makes a
mistake obvious at a glance.mistake obvious at a glance.
-- We can think is as theWe can think is as the
extension of FMEAextension of FMEA
Mistake-Proofing
EWMA: Exponentially weighted average moving
EPC: Engineer process control
SOP: Standard Operating Procedure
FMEA: Failure Modes and Effects Analysis
8/8/2019 Six Sigma Introduction & Application_031020
http://slidepdf.com/reader/full/six-sigma-introduction-application031020 26/50
8/8/2019 Six Sigma Introduction & Application_031020
http://slidepdf.com/reader/full/six-sigma-introduction-application031020 27/50
8/8/2019 Six Sigma Introduction & Application_031020
http://slidepdf.com/reader/full/six-sigma-introduction-application031020 28/50
28 Six Sigma Introduction & Application
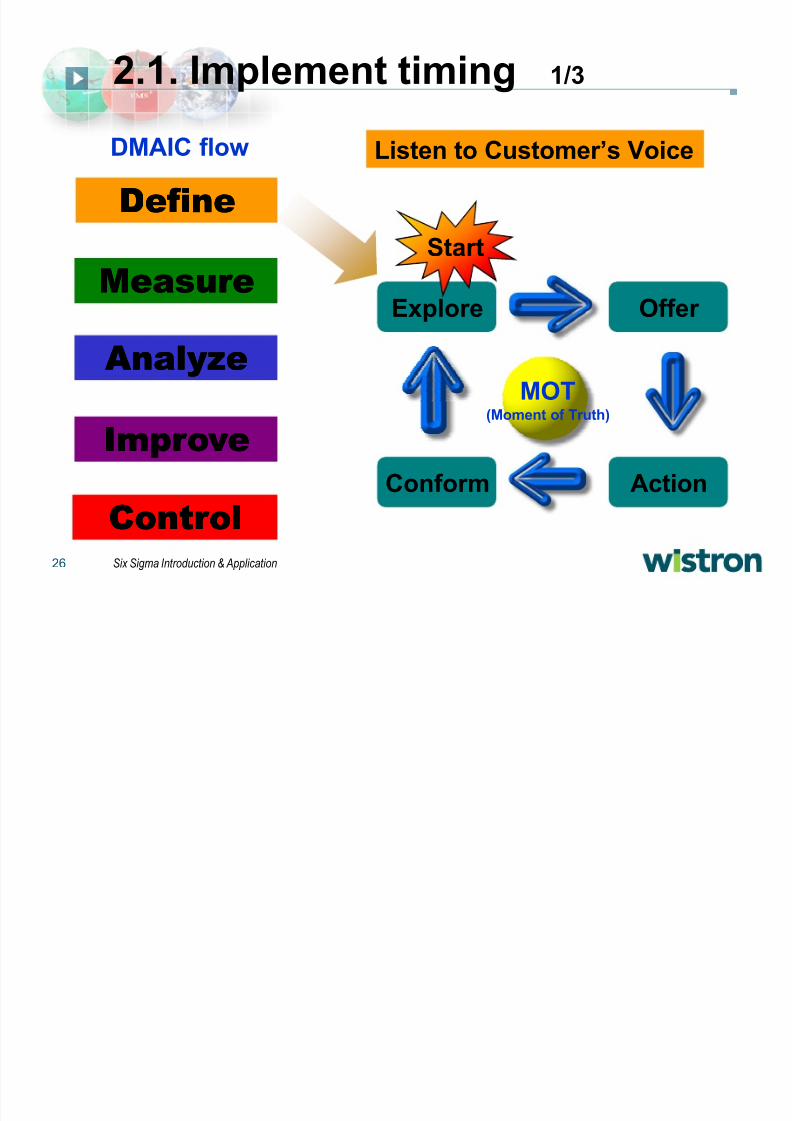
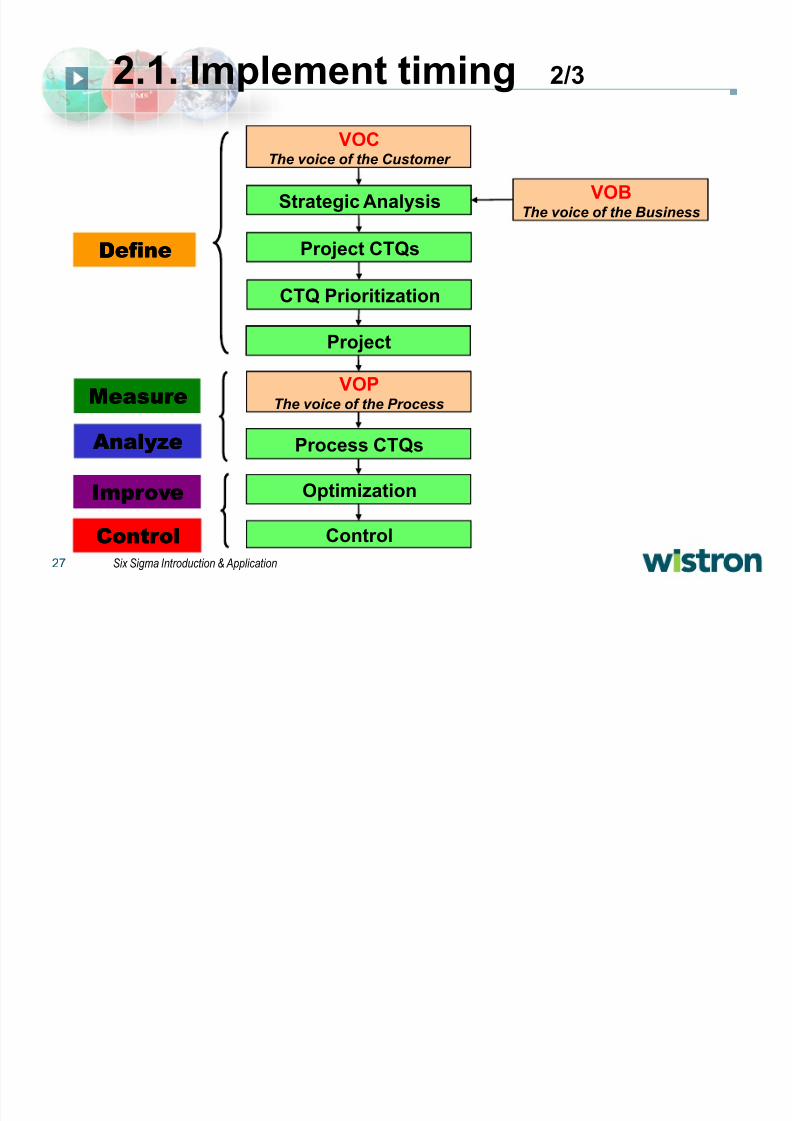
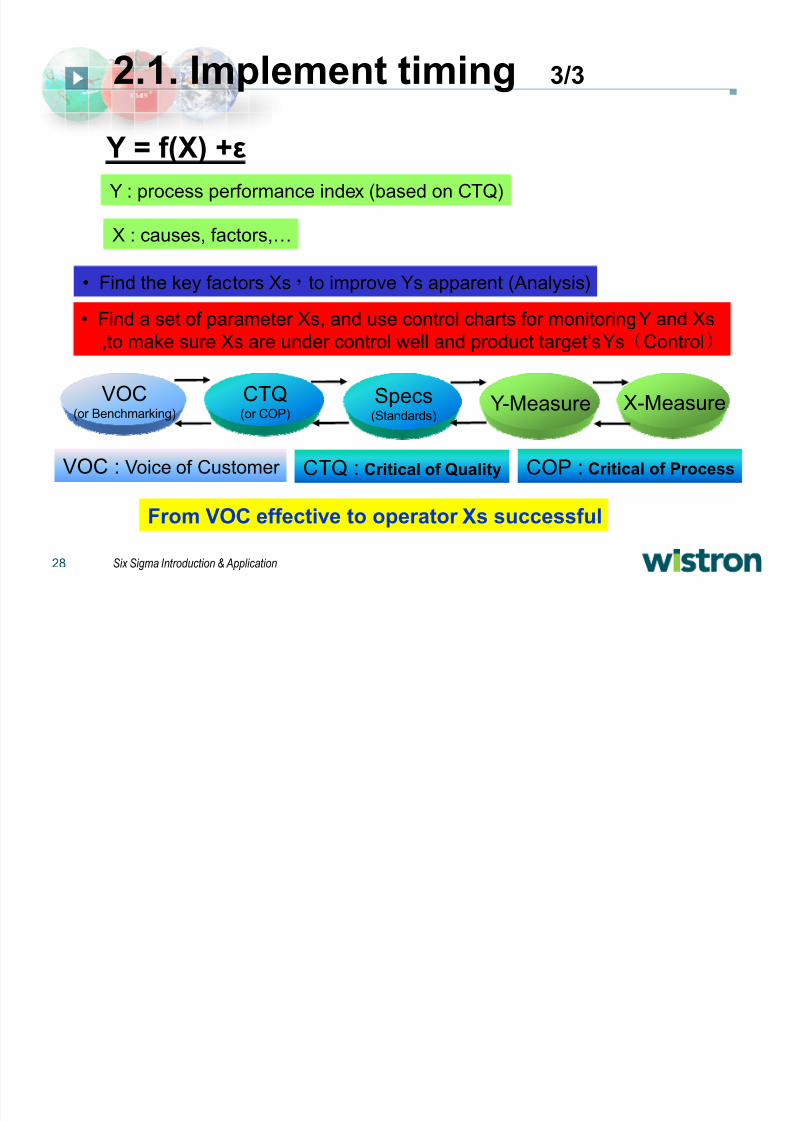
2.1. Implement timing 3/3
VOC
(or Benchmarking)
CTQ
(or COP)
Specs
(Standards)
Y-Measure X-Measure
VOC : Voice of Customer CTQ : Critical of Quality COP : Critical of Process
From VOC effective to operator Xs successful
Y = f(X) +Y : process performance index (based on CTQ)Y : process performance index (based on CTQ)
X : causes, factors,«X : causes, factors,«
Find the key factors Xsto improve Ys apparent (Analysis)
Find a set of parameter Xs, and use control charts for monitoring Y and Xs
,to make sure Xs are under control well and product target¶s YsControl
8/8/2019 Six Sigma Introduction & Application_031020
http://slidepdf.com/reader/full/six-sigma-introduction-application031020 29/50
29 Six Sigma Introduction & Application
Champion
Executive Champion
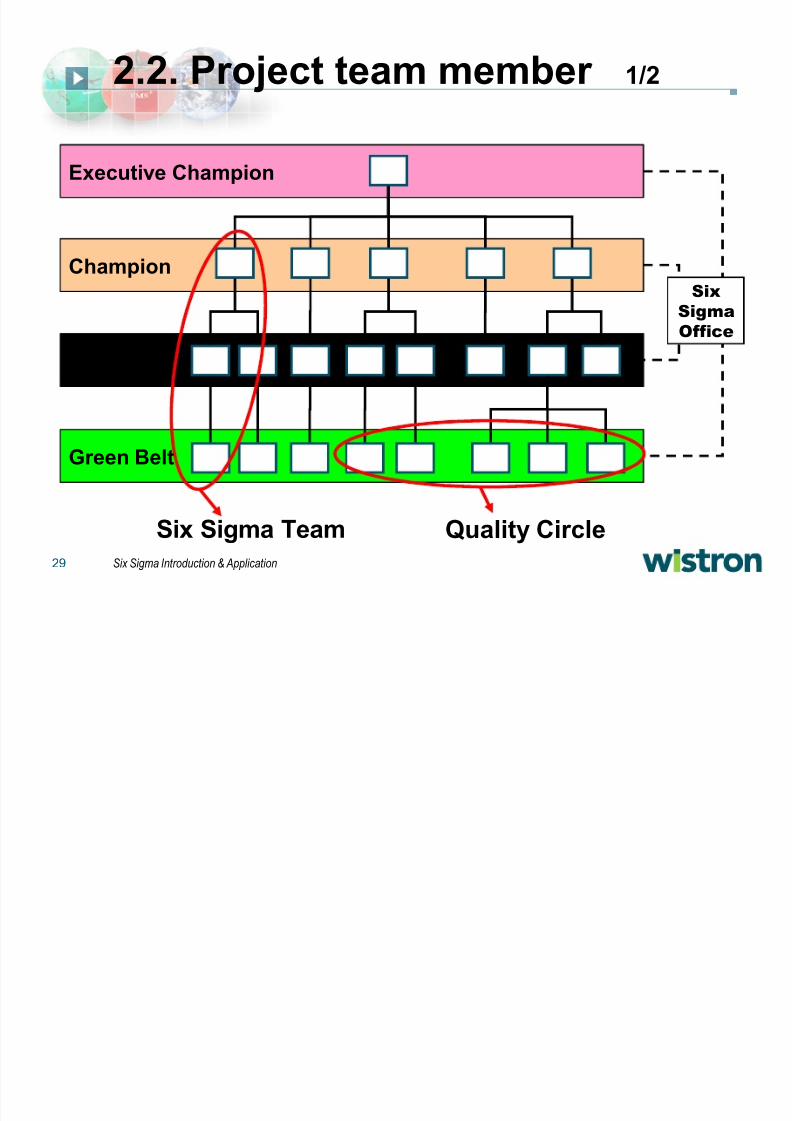
2.2. Project team member 1/2
Black Belt
Green Belt
Six
Sigma
Office
Six Sigma Team Quality Circle
8/8/2019 Six Sigma Introduction & Application_031020
http://slidepdf.com/reader/full/six-sigma-introduction-application031020 30/50
30 Six Sigma Introduction & Application
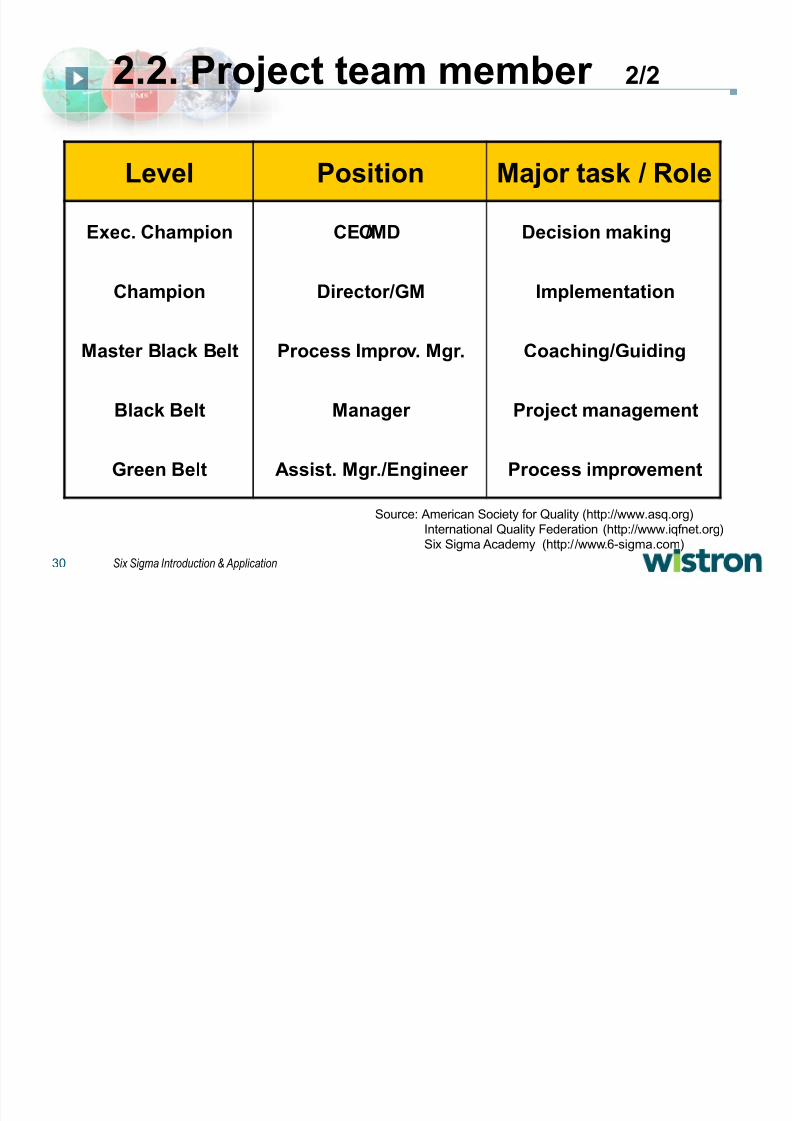
2.2. Project team member 2/2
Level Position Major task / Role
Exec. Champion CEO /MD Decision making
Champion Director/GM Implementation
Master Black Belt Process Improv. Mgr. Coaching/Guiding
Black Belt Manager Project management
Green Belt Assist. Mgr./Engineer Process improvement
Source: American Society for Quality (http://www.asq.org)International Quality Federation (http://www.iqfnet.org)Six Sigma Academy (http://www.6-sigma.com)
8/8/2019 Six Sigma Introduction & Application_031020
http://slidepdf.com/reader/full/six-sigma-introduction-application031020 31/50
31 Six Sigma Introduction & Application
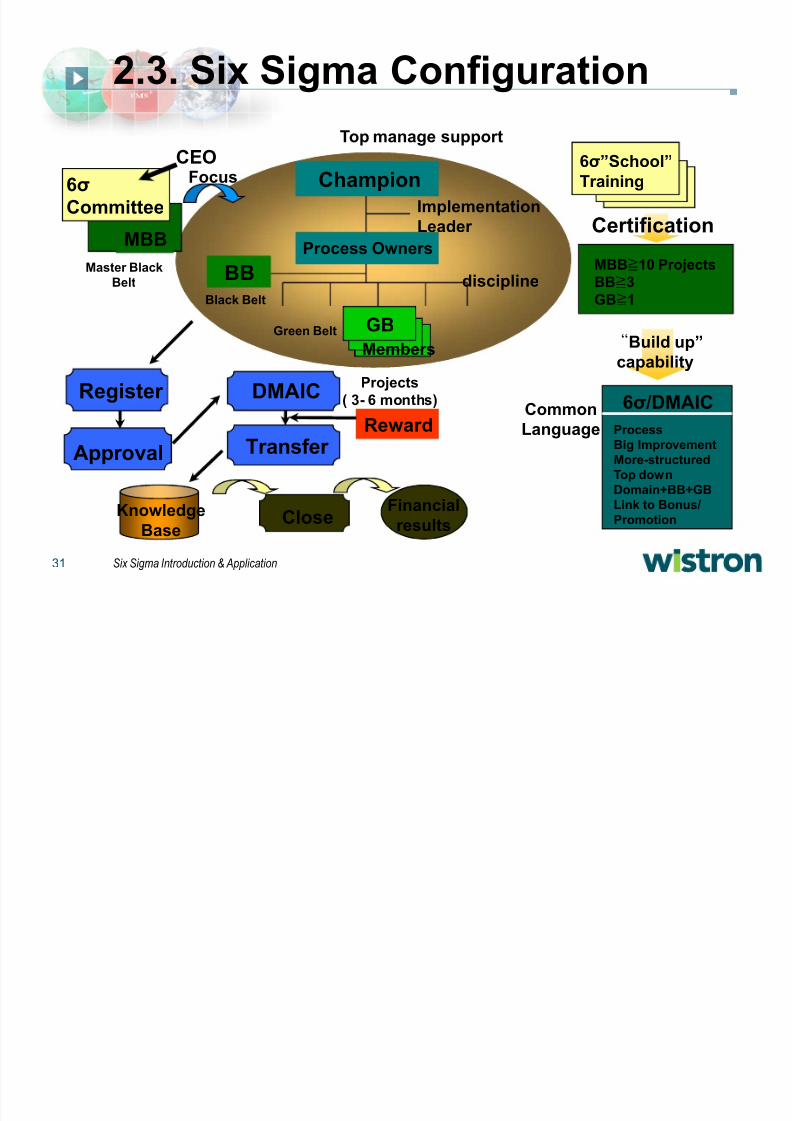
2.3. Six Sigma Configuration
Top manage support
Champion
DMAIC
Transfer
Register
Approval
Close
6
Committee
CEO
MBB
Master Black
Belt
Focus
Projects
( 3- 6 months)
Knowledge
Base
Financial
results
6´School´
Training
MBB10 Projects
BB3GB1
Certification
Build up´
capability
Common
Language
6/DMAIC
Process
Big Improvement
More-structured
Top down
Domain+BB+GB
Link to Bonus/
Promotion
Process Owners
GB
Members
BB
Green Belt
Black Beltdiscipline
Reward
Implementation
Leader
8/8/2019 Six Sigma Introduction & Application_031020
http://slidepdf.com/reader/full/six-sigma-introduction-application031020 32/50
32 Six Sigma Introduction & Application
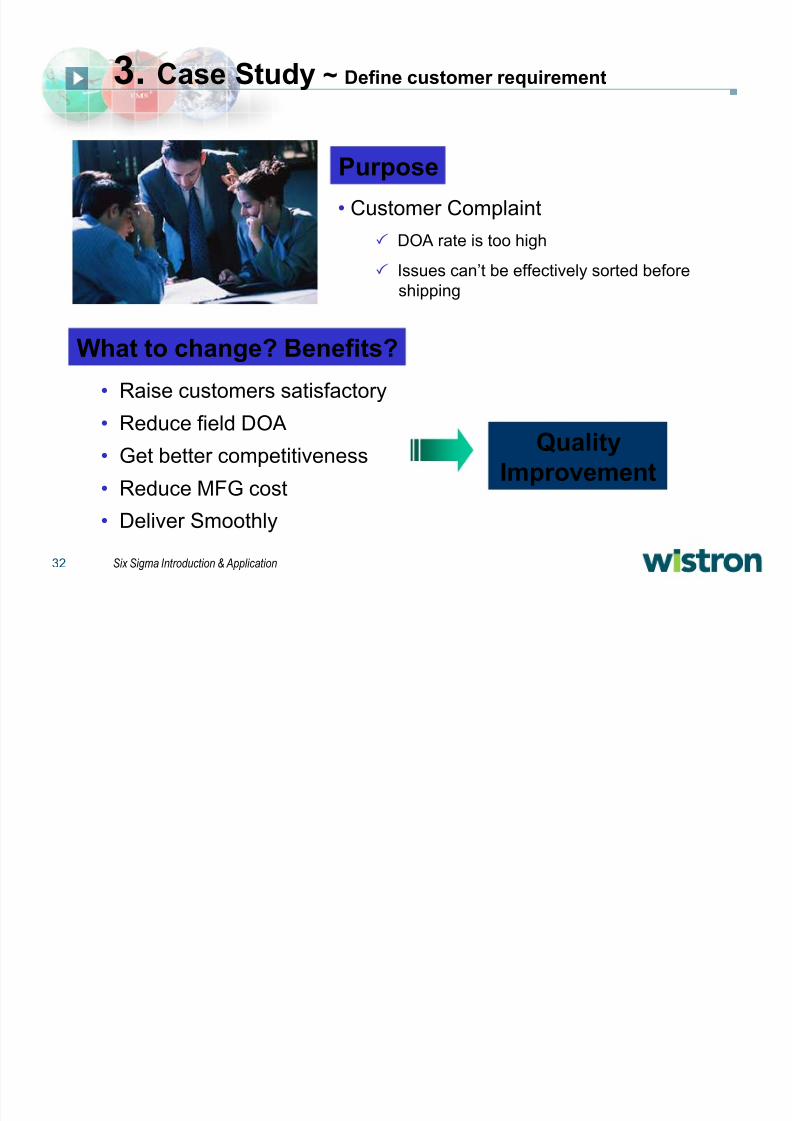
3. Case Study ~ Define customer requirement
Purpose
Customer Complaint
DO A rate is too high
Issues can¶t be effectively sorted before
shipping
What to change? Benefits?
Raise customers satisfactory
Reduce field DO A
Get better competitiveness
Reduce MFG cost
Deliver Smoothly
Quality
Improvement
8/8/2019 Six Sigma Introduction & Application_031020
http://slidepdf.com/reader/full/six-sigma-introduction-application031020 33/50
33 Six Sigma Introduction & Application
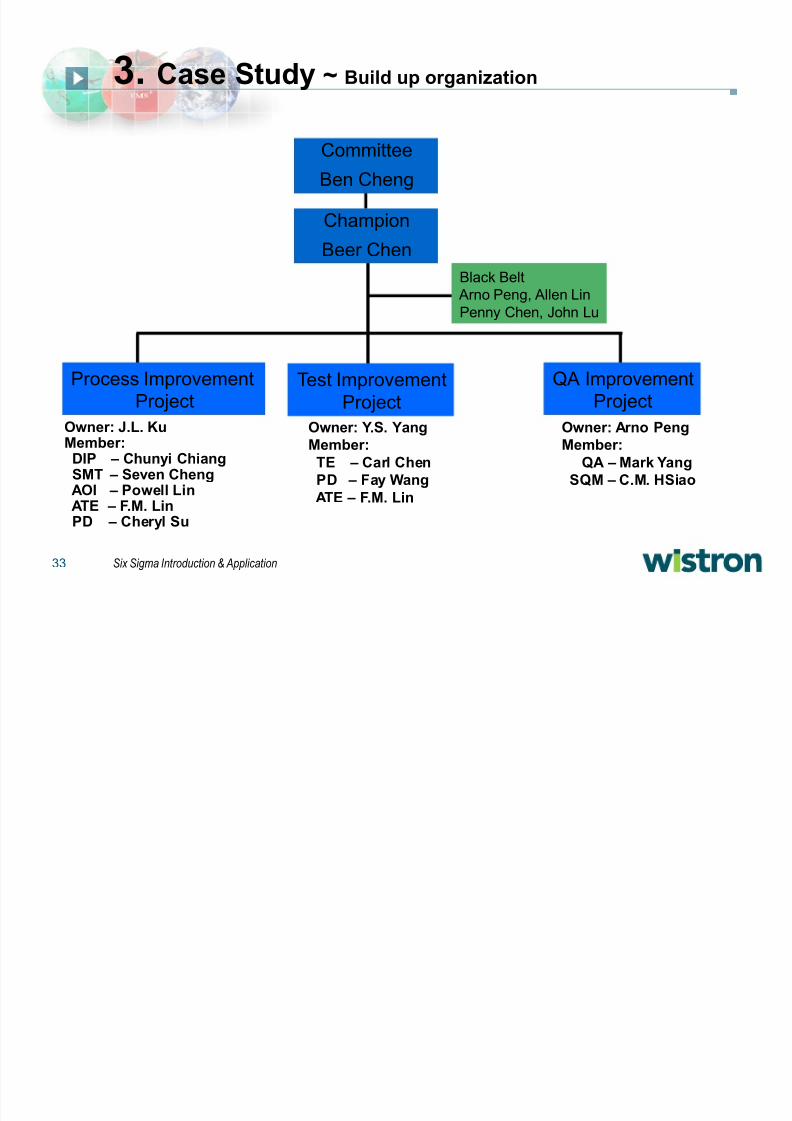
3. Case Study ~ Build up organization
Committee
Ben Cheng
Black Belt Arno Peng, Allen Lin
Penny Chen, John Lu
Process Improvement
ProjectTest Improvement
Project
QA Improvement
Project
Champion
Beer Chen
Owner: J.L. KuMember:DIP ± Chunyi ChiangSMT ± Seven ChengAOI ± Powell LinATE ± F.M. LinPD ± Cheryl Su
Owner: Y.S. Yang
Member:
TE ± Carl Chen
PD ± Fay Wang
ATE ± F.M. Lin
Owner: Arno Peng
Member:
QA ± Mark Yang
SQM ± C.M. HSiao
8/8/2019 Six Sigma Introduction & Application_031020
http://slidepdf.com/reader/full/six-sigma-introduction-application031020 34/50
34 Six Sigma Introduction & Application
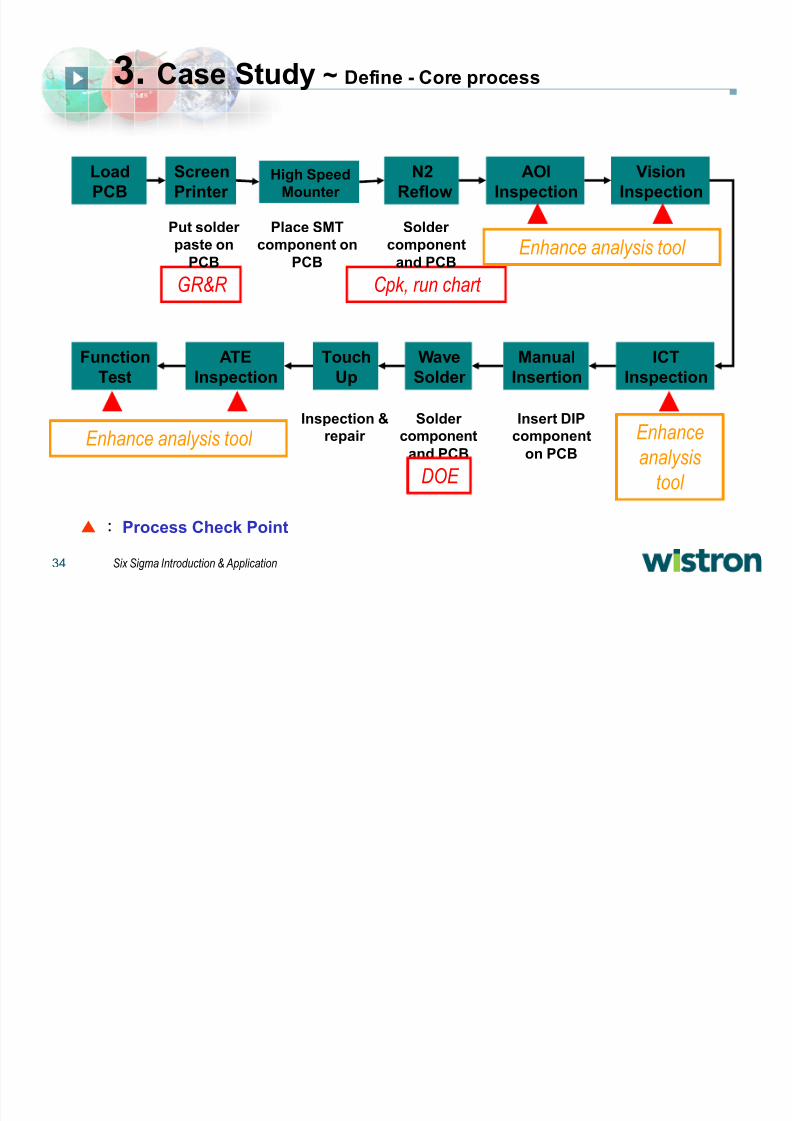
3. Case Study ~ Define - Core process
Load
PCB
Screen
Printer High Speed
Mounter
N2
Reflow
AOI
Inspection
Vision
Inspection
ICT
Inspection
Manual
Insertion
Wave
Solder
Touch
Up
ATE
Inspection
Function
Test
Process Check Point
Put solder
paste on
PCB
Place SMT
component on
PCB
Solder
component
and PCB
Insert DIPcomponent
on PCB
Solder component
and PCB
Inspection &repair
GR&R C pk, run chart
DOE
Enhance analysis tool
Enhance analysis tool Enhance
analysis
tool
8/8/2019 Six Sigma Introduction & Application_031020
http://slidepdf.com/reader/full/six-sigma-introduction-application031020 35/50
35 Six Sigma Introduction & Application
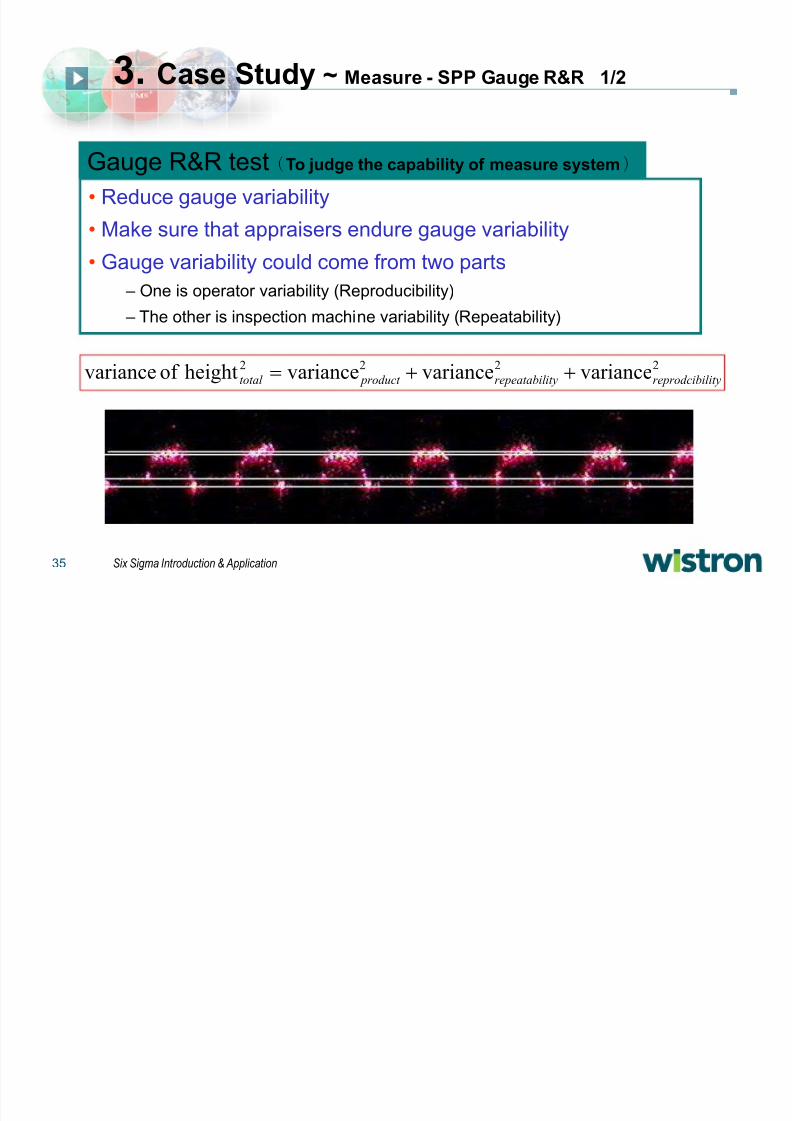
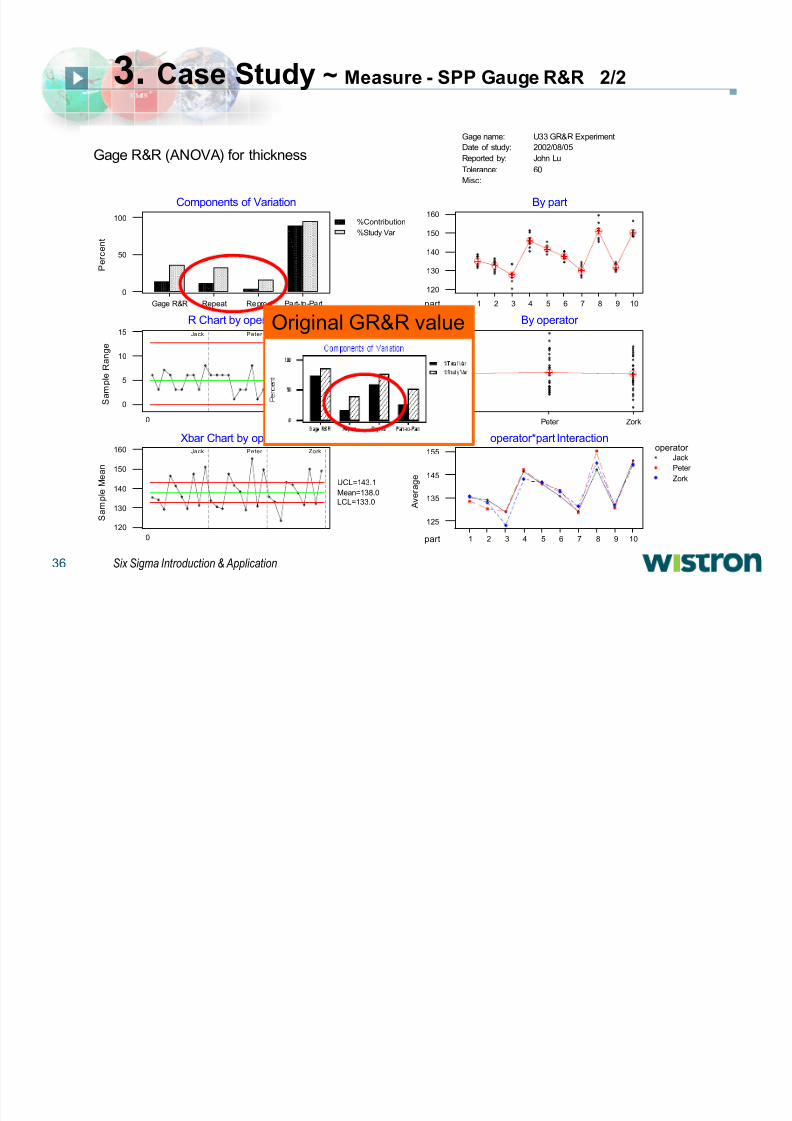
3. Case Study ~ Measure - SPP Gauge R&R 1/2
Gauge R&R testTo judge the capability of measure system
2222 variancevariancevarianceheightof variance lityreprodcibiityrepeatabil product total !
Reduce gauge variability
Make sure that appraisers endure gauge variability
Gauge variability could come from two parts
± One is operator variability (Reproducibility)
± The other is inspection machine variability (Repeatability)
8/8/2019 Six Sigma Introduction & Application_031020
http://slidepdf.com/reader/full/six-sigma-introduction-application031020 36/50
8/8/2019 Six Sigma Introduction & Application_031020
http://slidepdf.com/reader/full/six-sigma-introduction-application031020 37/50
37 Six Sigma Introduction & Application
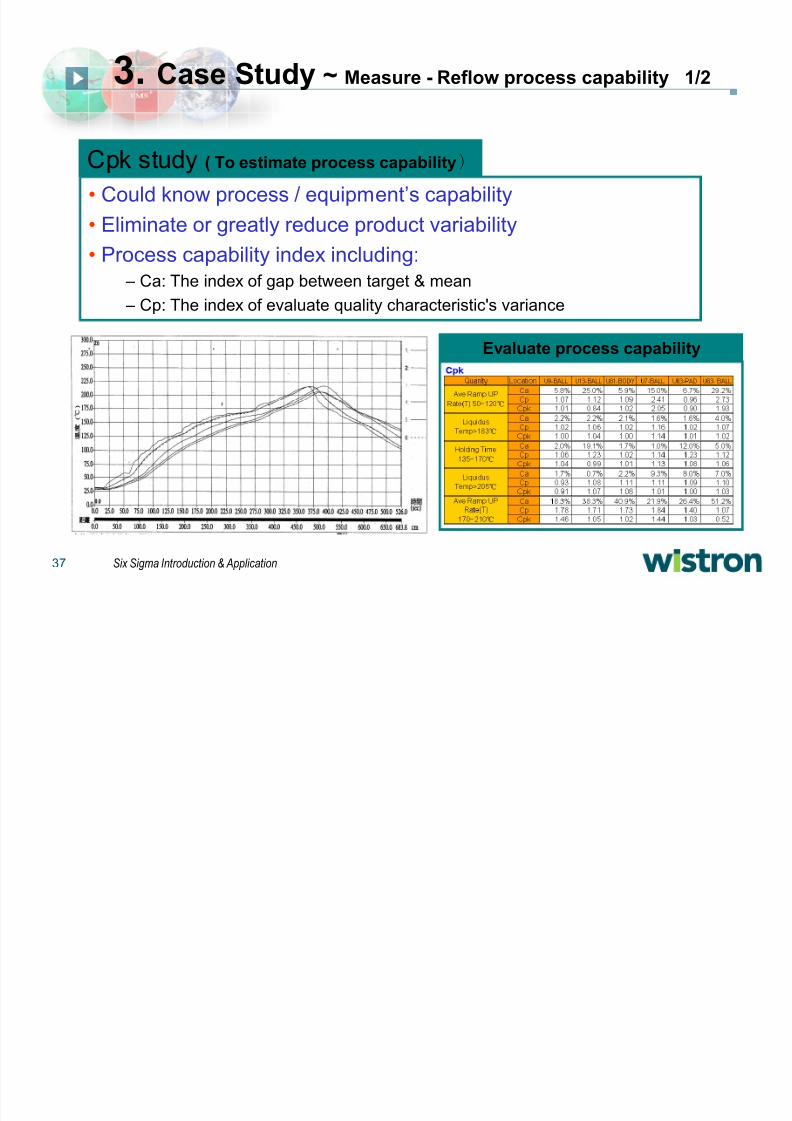
3. Case Study ~ Measure - Reflow process capability 1/2
Cpk study ( To estimate process capability
Could know process / equipment¶s capability
Eliminate or greatly reduce product variability
Process capability index including:
± Ca: The index of gap between target & mean ± Cp: The index of evaluate quality characteristic's variance
Evaluate process capability
8/8/2019 Six Sigma Introduction & Application_031020
http://slidepdf.com/reader/full/six-sigma-introduction-application031020 38/50
38 Six Sigma Introduction & Application
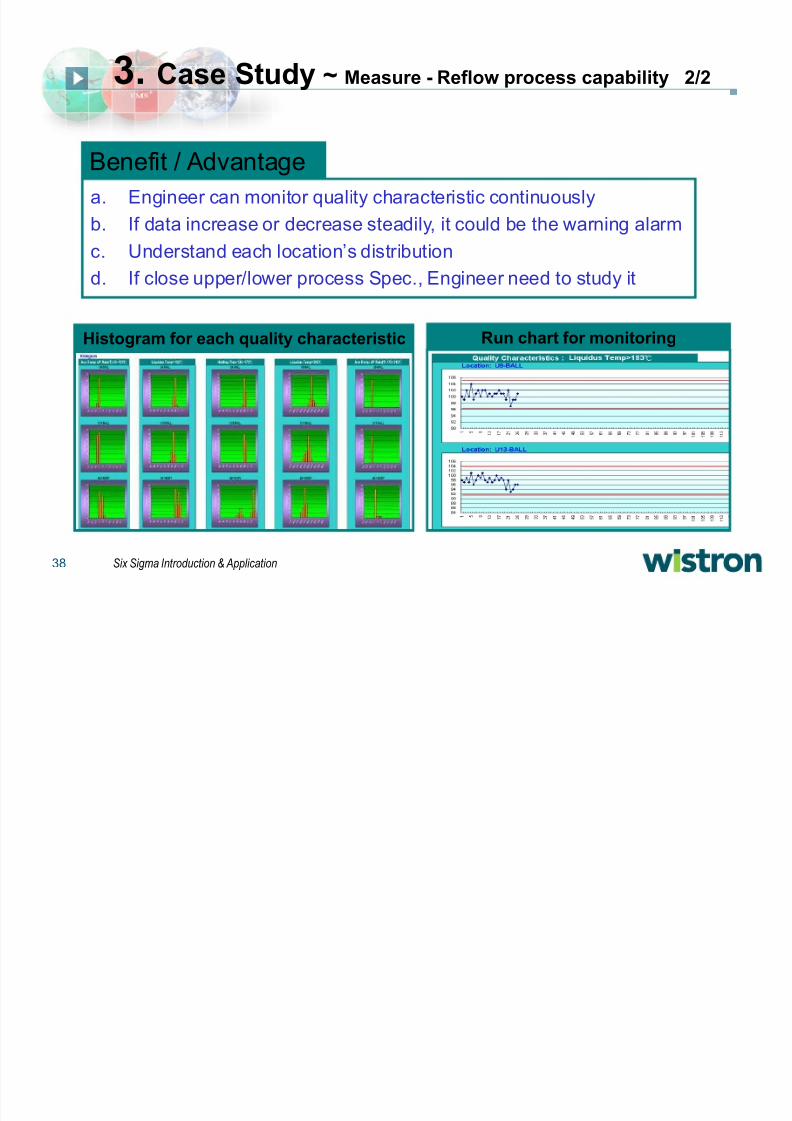
3. Case Study ~ Measure - Reflow process capability 2/2
Histogram for each quality characteristic Run chart for monitoring
a. Engineer can monitor quality characteristic continuously
b. If data increase or decrease steadily, it could be the warning alarm
c. Understand each location¶s distribution
d. If close upper/lower process Spec., Engineer need to study it
Benefit / Advantage
8/8/2019 Six Sigma Introduction & Application_031020
http://slidepdf.com/reader/full/six-sigma-introduction-application031020 39/50
39 Six Sigma Introduction & Application
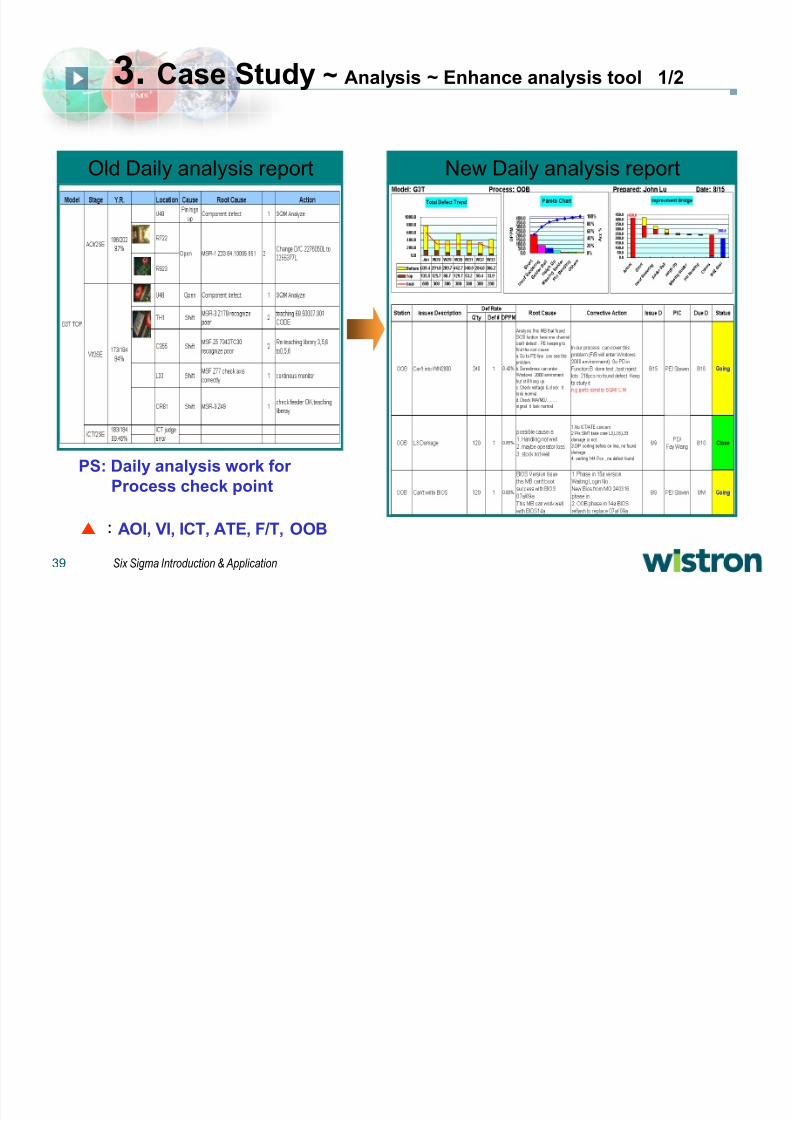
3. Case Study ~ Analysis ~ Enhance analysis tool 1/2
Old Daily analysis report New Daily analysis report
AOI, VI, ICT, ATE, F/T, OOB
PS: Daily analysis work for
Process check point
8/8/2019 Six Sigma Introduction & Application_031020
http://slidepdf.com/reader/full/six-sigma-introduction-application031020 40/50
40 Six Sigma Introduction & Application
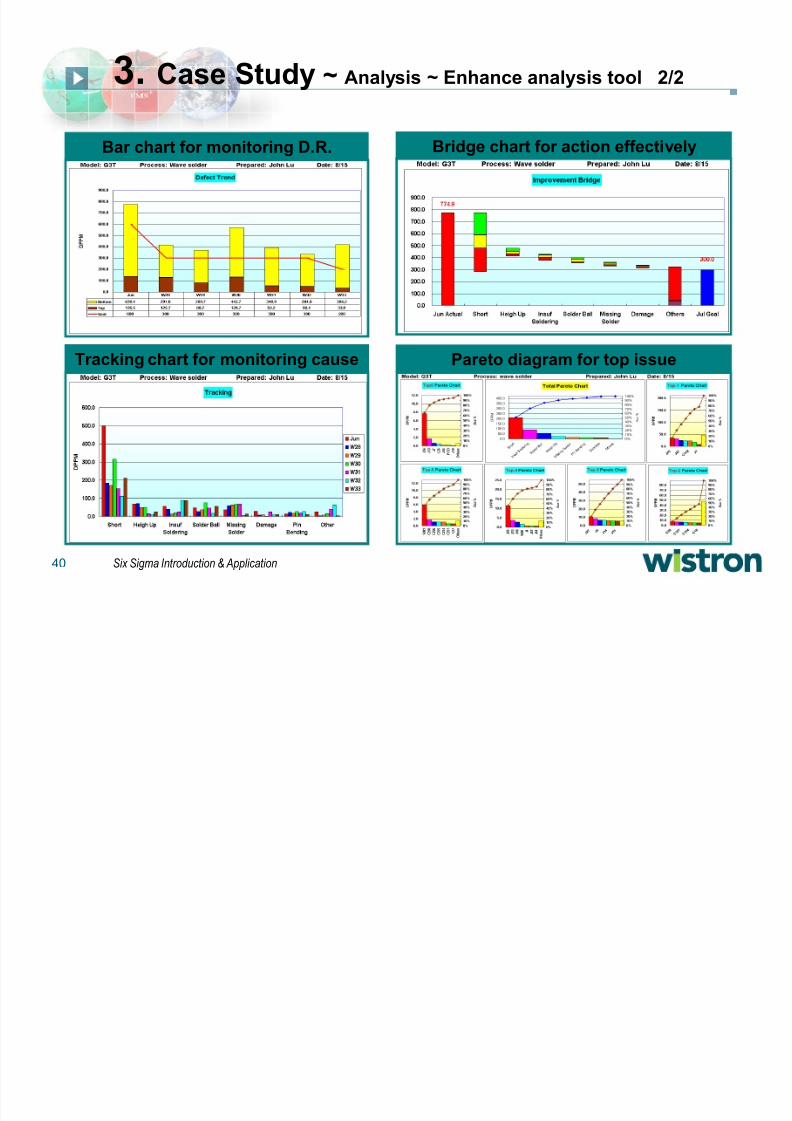
3. Case Study ~ Analysis ~ Enhance analysis tool 2/2
Bar chart for monitoring D.R. Bridge chart for action effectively
Tracking chart for monitoring cause Pareto diagram for top issue
8/8/2019 Six Sigma Introduction & Application_031020
http://slidepdf.com/reader/full/six-sigma-introduction-application031020 41/50
41 Six Sigma Introduction & Application
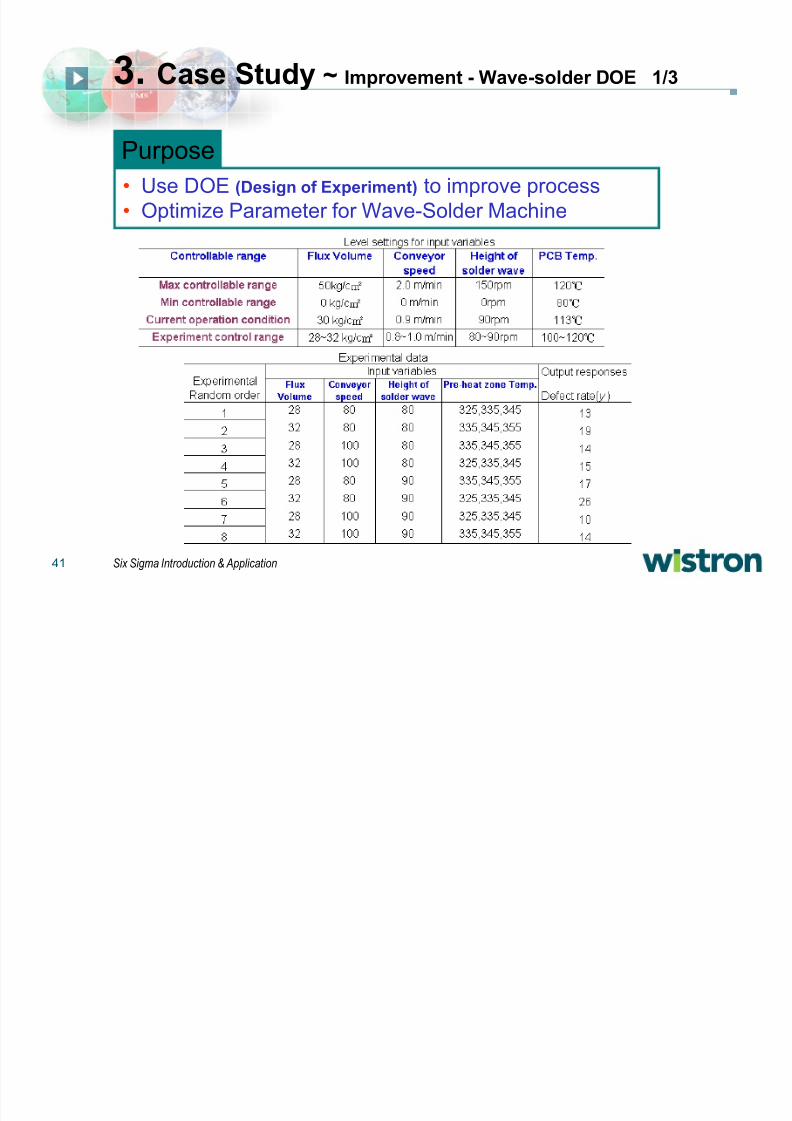
3. Case Study ~ Improvement - Wave-solder DOE 1/3
Purpose
Use DOE (Design of Experiment) to improve process
Optimize Parameter for Wave-Solder Machine
8/8/2019 Six Sigma Introduction & Application_031020
http://slidepdf.com/reader/full/six-sigma-introduction-application031020 42/50
42 Six Sigma Introduction & Application
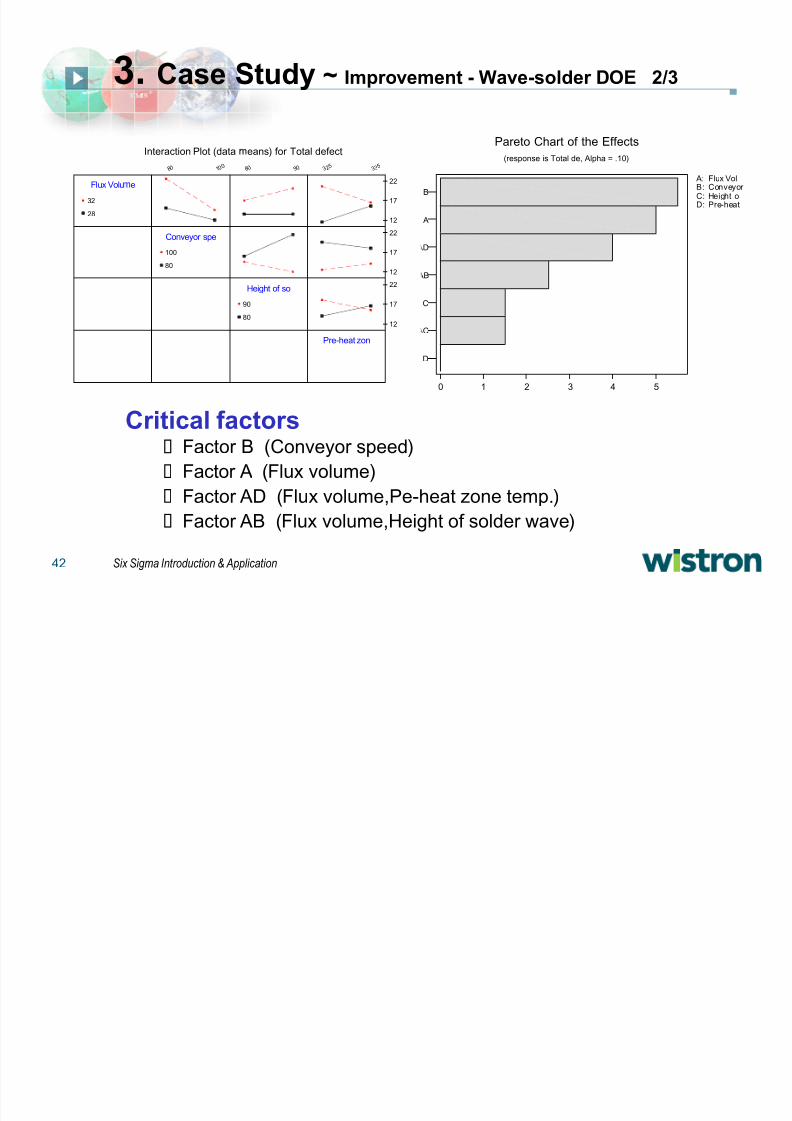
3. Case Study ~ Improvement - Wave-solder DOE 2/3
0 1 2 3 4 5
D
AC
C
AB
AD
A
B
Pareto Chart of the Effects(response is Total de, Alpha = .10)
A: Flux VolB: Conveyor C: Height oD: Pre-heat
8 0 1 0 0
8 0 9 0 3 2 5
3 3 5
12
17
22
12
17
22
12
17
22Flux Volu v e
Conveyor spe
Height of so
Pre-heat zon
28
32
80
100
80
90
Interaction Plot (data eans) for Total defect
Critical factors Factor B (Conveyor speed)
Factor A (Flux volume)
Factor AD (Flux volume,Pe-heat zone temp.)
Factor AB (Flux volume,Height of solder wave)
8/8/2019 Six Sigma Introduction & Application_031020
http://slidepdf.com/reader/full/six-sigma-introduction-application031020 43/50
8/8/2019 Six Sigma Introduction & Application_031020
http://slidepdf.com/reader/full/six-sigma-introduction-application031020 44/50
44 Six Sigma Introduction & Application
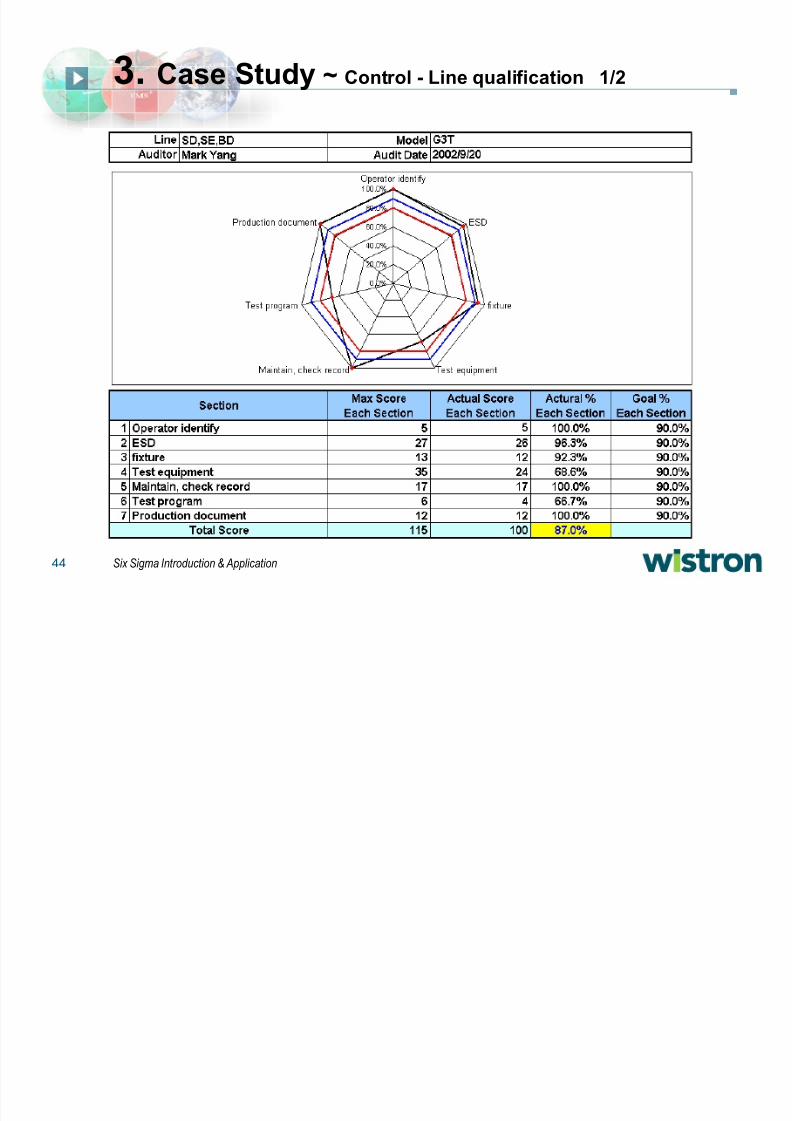
3. Case Study ~ Control - Line qualification 1/2
8/8/2019 Six Sigma Introduction & Application_031020
http://slidepdf.com/reader/full/six-sigma-introduction-application031020 45/50
45 Six Sigma Introduction & Application
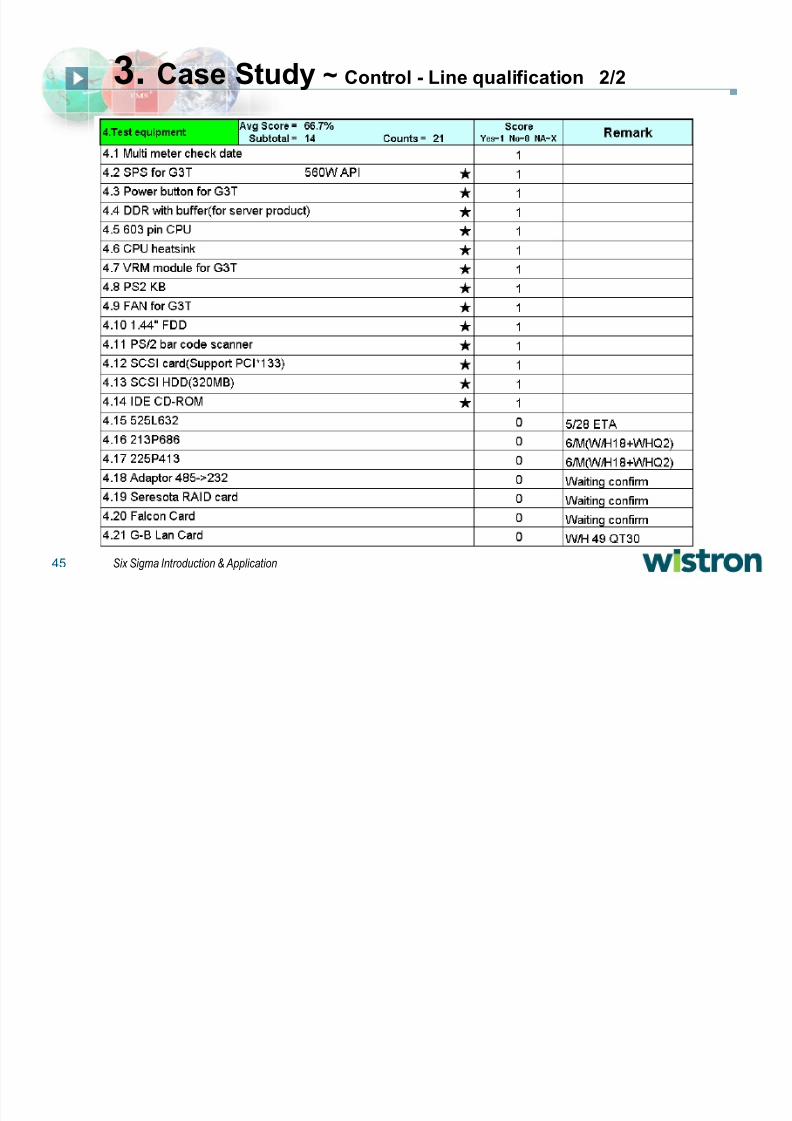
3. Case Study ~ Control - Line qualification 2/2
8/8/2019 Six Sigma Introduction & Application_031020
http://slidepdf.com/reader/full/six-sigma-introduction-application031020 46/50
46 Six Sigma Introduction & Application
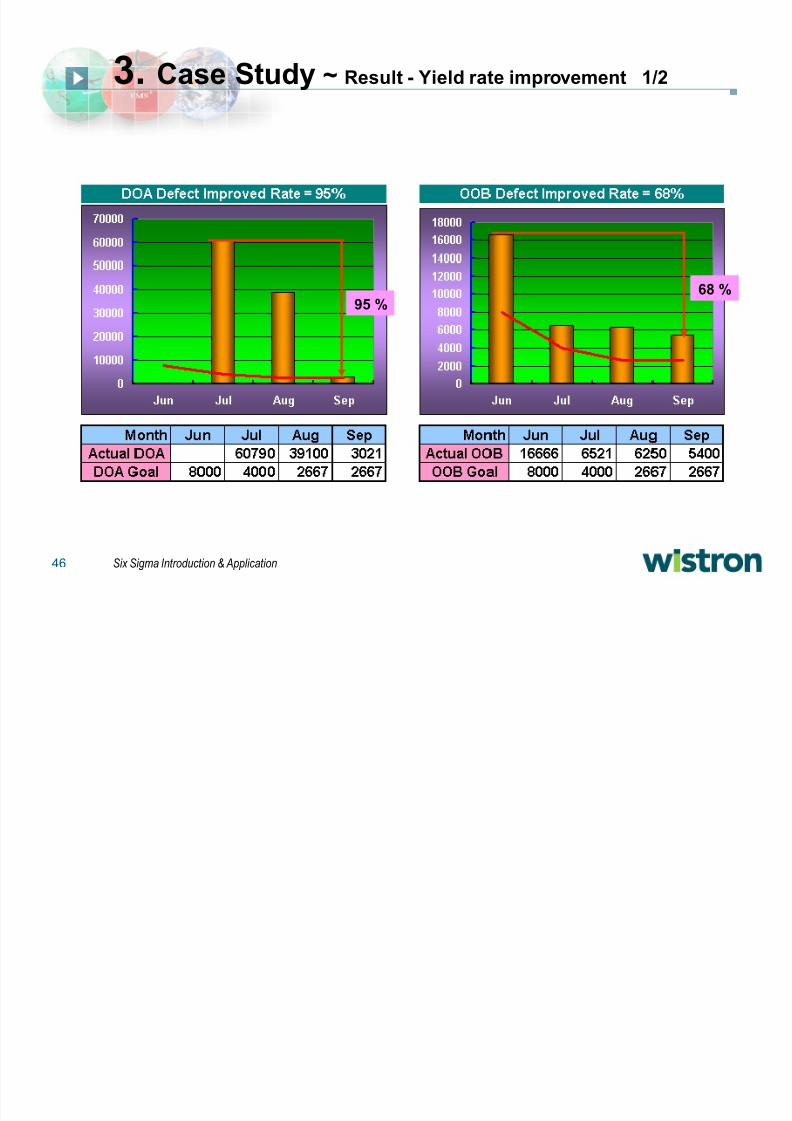
3. Case Study ~ Result - Yield rate improvement 1/2
95 %68 %
8/8/2019 Six Sigma Introduction & Application_031020
http://slidepdf.com/reader/full/six-sigma-introduction-application031020 47/50
47 Six Sigma Introduction & Application
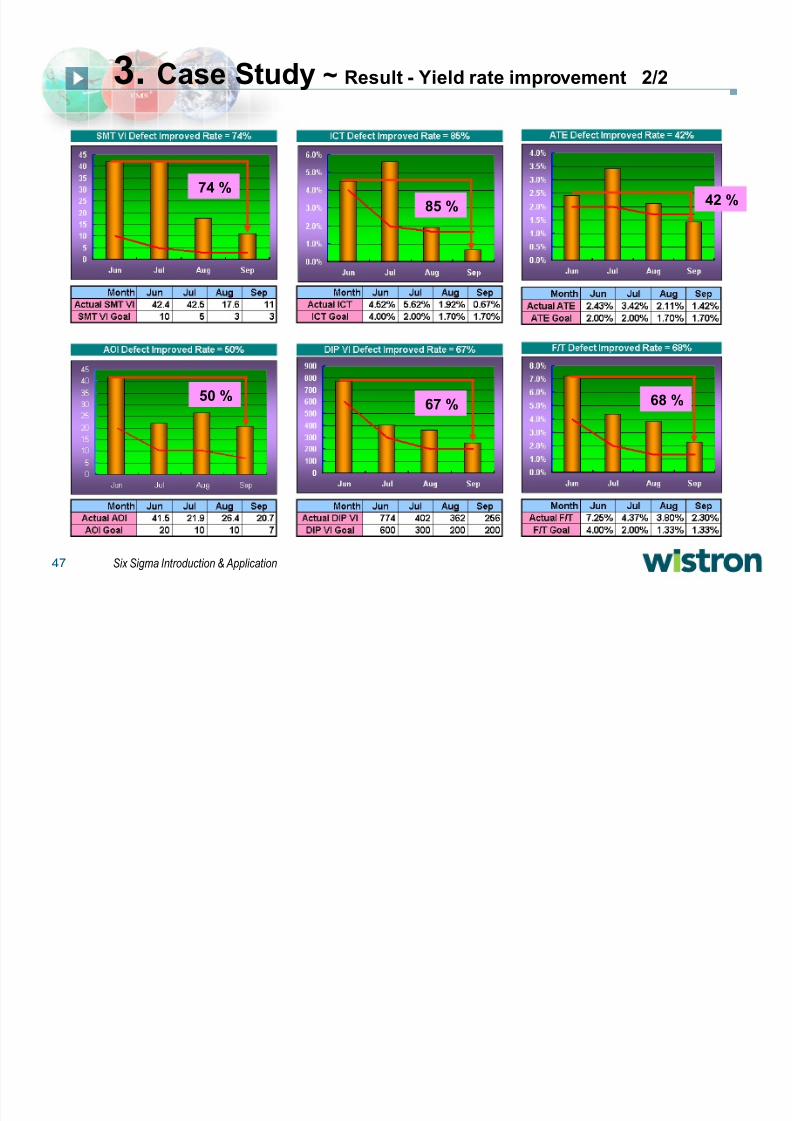
3. Case Study ~ Result - Yield rate improvement 2/2
68 %
42 %
67 %
85 %
74 %
50 %
8/8/2019 Six Sigma Introduction & Application_031020
http://slidepdf.com/reader/full/six-sigma-introduction-application031020 48/50
48 Six Sigma Introduction & Application
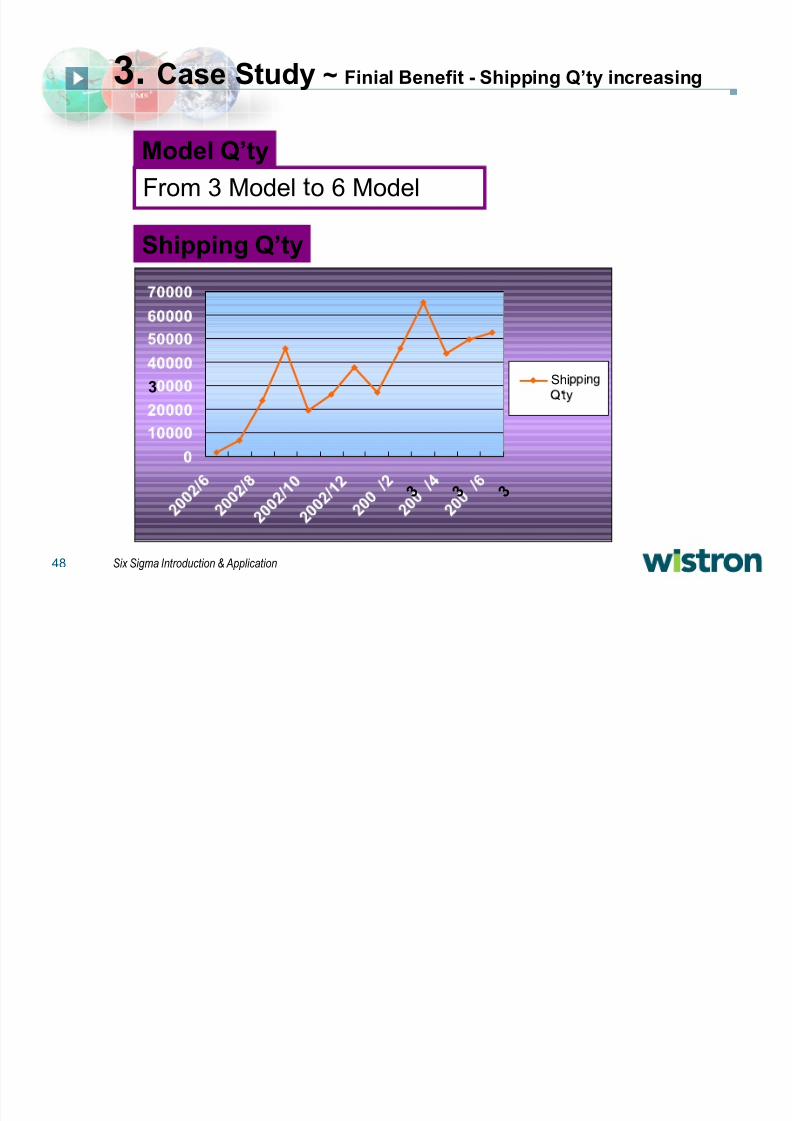
3. Case Study ~ Finial Benefit - Shipping Q¶ty increasing
3
3 3 3
Shi i
'
Shipping Q¶ty
Model Q¶ty
From 3 Model o 6 Model
8/8/2019 Six Sigma Introduction & Application_031020
http://slidepdf.com/reader/full/six-sigma-introduction-application031020 49/50
49 Six Sigma Introduction & Application
4. Appendix
Reference book / homepage
1. American Society for Quality (ASQ) http://www.asq.org
2. Breyfogle, F.W. (1997). Im plement Si x Sig ma. 1st ed., John Wiley &
Sons, New York, NY.
3. GE company http://www.ge.com/sixsigma/
4. International Quality Federation (IQF) http://www.iqfnet.org
5. Montogomery, D.C. (2001). I ntroduction to Statistical Quality Control .
4th ed., John Wiley & Sons, New York, NY.
6. Pande, P.S., R.P., Neuman, and Cavanagh, R. R. (2000). The Si x Sig ma
way: how GE, Motorola, and other top com panies honing their
perfor mance. 1st ed., McGraw-Hill Companies, Inc., New York, NY
7. Six Sigma Academy http://www.6-sigma.com

8/8/2019 Six Sigma Introduction & Application_031020
http://slidepdf.com/reader/full/six-sigma-introduction-application031020 50/50
50 Six Sigma Introduction & Application
Thank You !E-mail address: [email protected]


![Introduction to Six Sigma[1]](https://img.pdfslide.us/doc/110x75/577cdeb21a28ab9e78afa1f5/introduction-to-six-sigma1.jpg)