Embed Size (px)
Citation preview
Lean
Six
Sig
ma
Bla
ck B
elt
Lean Six Sigma Black Belt Week 3
Institute of Industrial Engineers
3577 Parkway Place Suite 200
Norcross, GA 30092
Chapter 3-2: Lean VSM and FLOW
Lean
Six
Sig
ma
Bla
ck B
elt
Value Stream Mapping
3-2-2 © 2014 Institute of Industrial Engineers.
Lean
Six
Sig
ma
Bla
ck B
elt
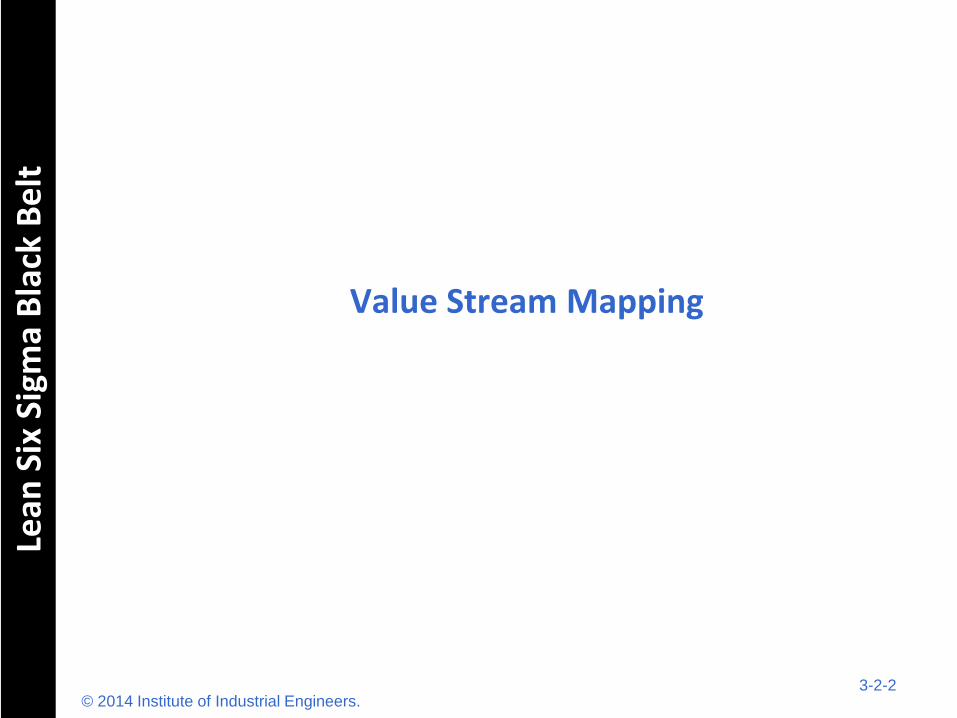
Value Stream Improvement
Value stream is all steps, value-added and non-value added, that are required to bring a product from raw material to the customer.
Machining Packaging Assembly Inventory Inventory Inventory Inventory
Raw
Material Finished
Product
Customer
Simple Model
3-2-3 © 2014 Institute of Industrial Engineers.
Lean
Six
Sig
ma
Bla
ck B
elt
Value Stream Mapping
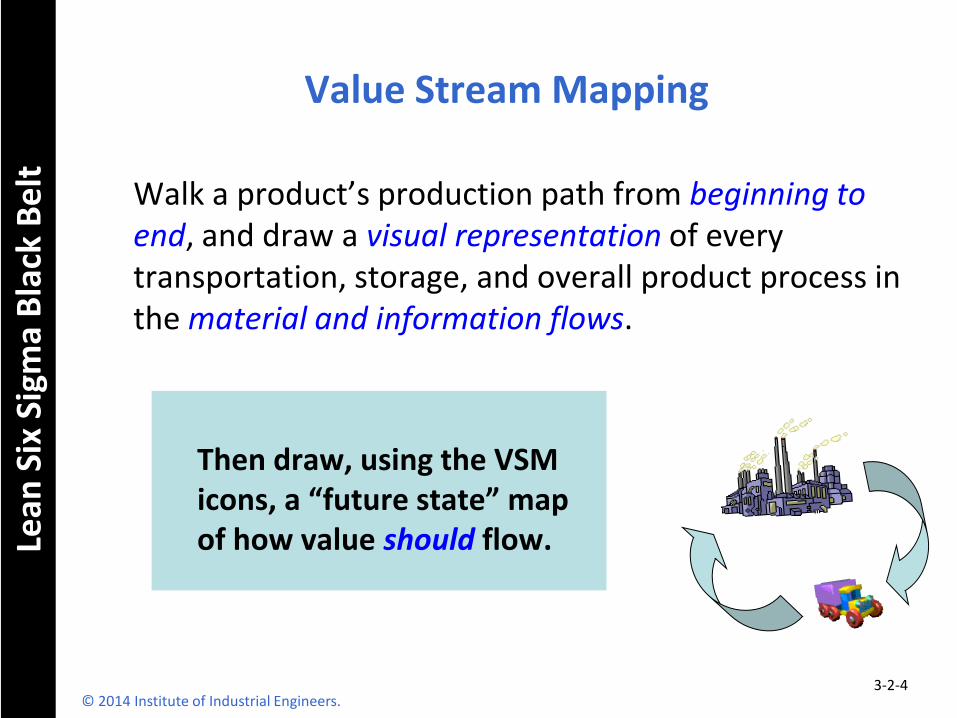
Walk a product’s production path from beginning to end, and draw a visual representation of every transportation, storage, and overall product process in the material and information flows.
Then draw, using the VSM icons, a “future state” map of how value should flow.
3-2-4 © 2014 Institute of Industrial Engineers.
Lean
Six
Sig
ma
Bla
ck B
elt
Value Stream Mapping
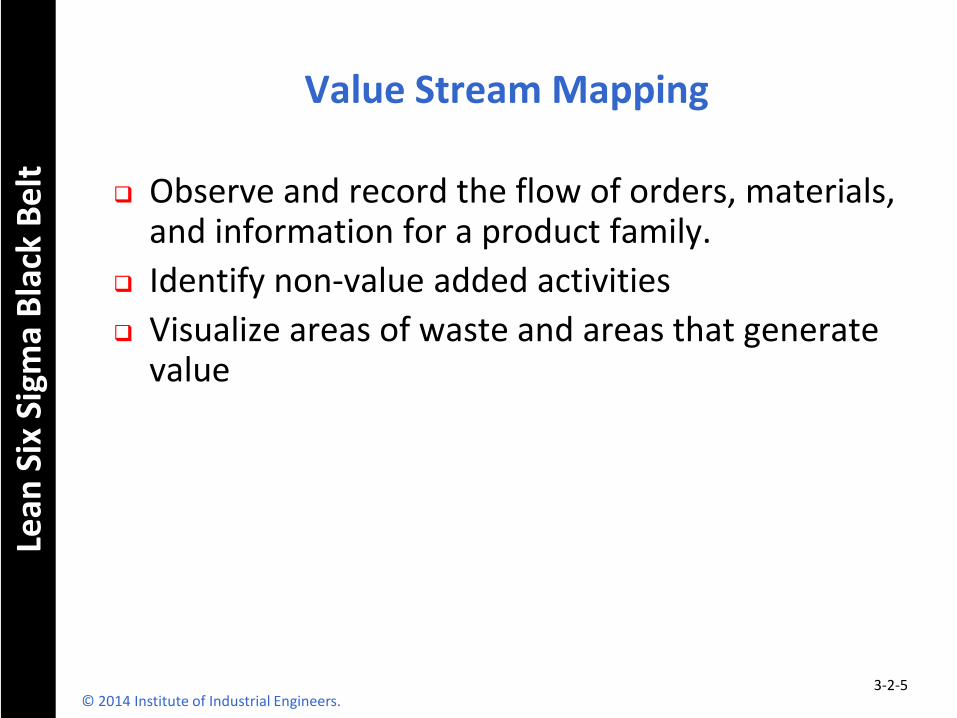
Observe and record the flow of orders, materials, and information for a product family.
Identify non-value added activities
Visualize areas of waste and areas that generate value
3-2-5 © 2014 Institute of Industrial Engineers.
Lean
Six
Sig
ma
Bla
ck B
elt
Map the Supply Chain
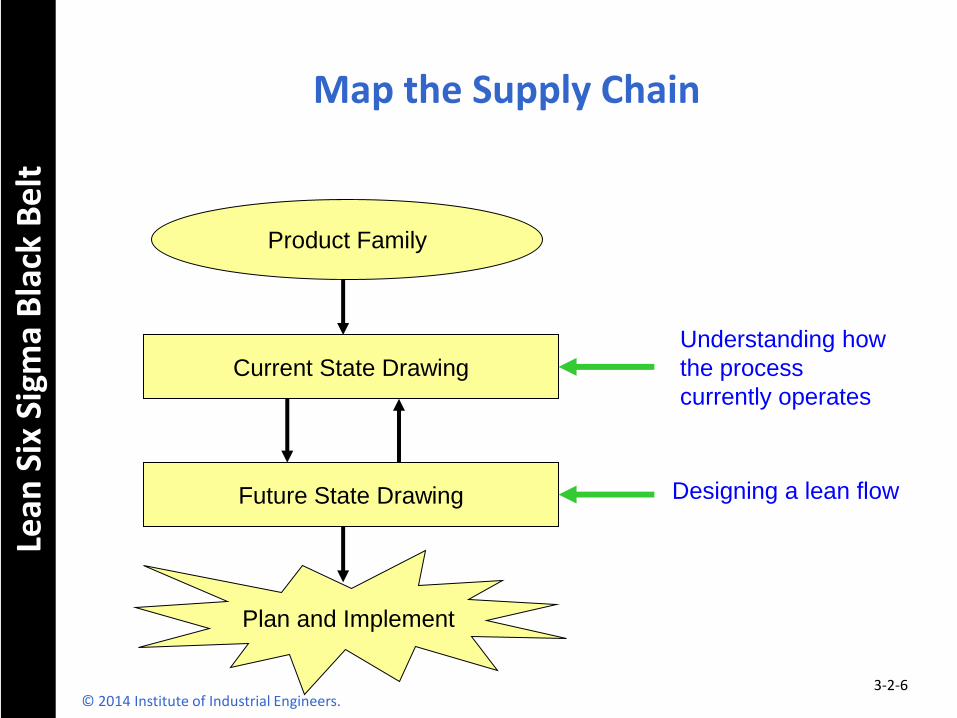
Product Family
Current State Drawing
Future State Drawing
Plan and Implement
Understanding how
the process
currently operates
Designing a lean flow
3-2-6 © 2014 Institute of Industrial Engineers.
Lean
Six
Sig
ma
Bla
ck B
elt
Product/Service Family
A group of products/services that use similar processing steps and/or common equipment.
Healthcare “Value” Examples?
Healthcare “Value Support” Examples?
Healthcare “Supplier” Examples?
3-2-7 © 2014 Institute of Industrial Engineers.
Lean
Six
Sig
ma
Bla
ck B
elt
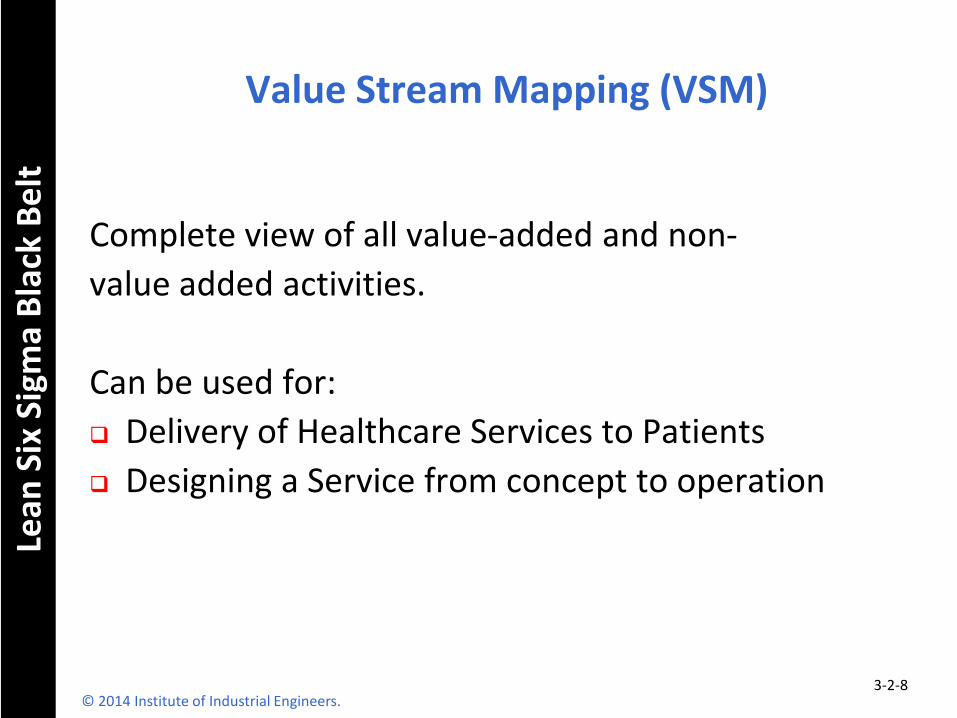
Value Stream Mapping (VSM)
Complete view of all value-added and non-
value added activities.
Can be used for:
Delivery of Healthcare Services to Patients
Designing a Service from concept to operation
3-2-8 © 2014 Institute of Industrial Engineers.
Lean
Six
Sig
ma
Bla
ck B
elt
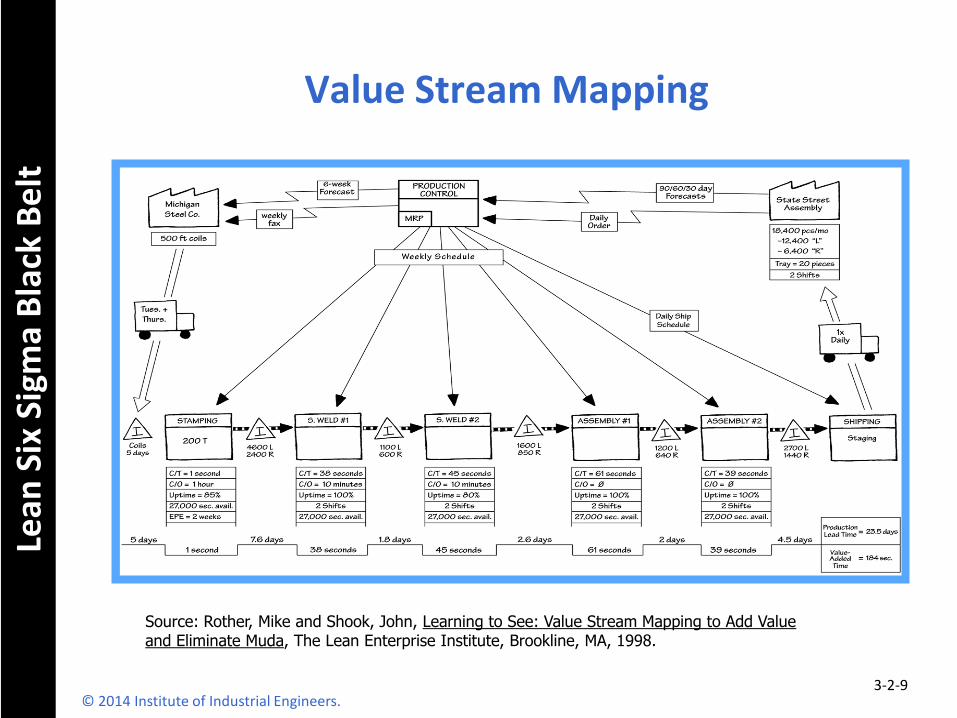
Value Stream Mapping
Source: Rother, Mike and Shook, John, Learning to See: Value Stream Mapping to Add Value and Eliminate Muda, The Lean Enterprise Institute, Brookline, MA, 1998.
3-2-9 © 2014 Institute of Industrial Engineers.
Lean
Six
Sig
ma
Bla
ck B
elt
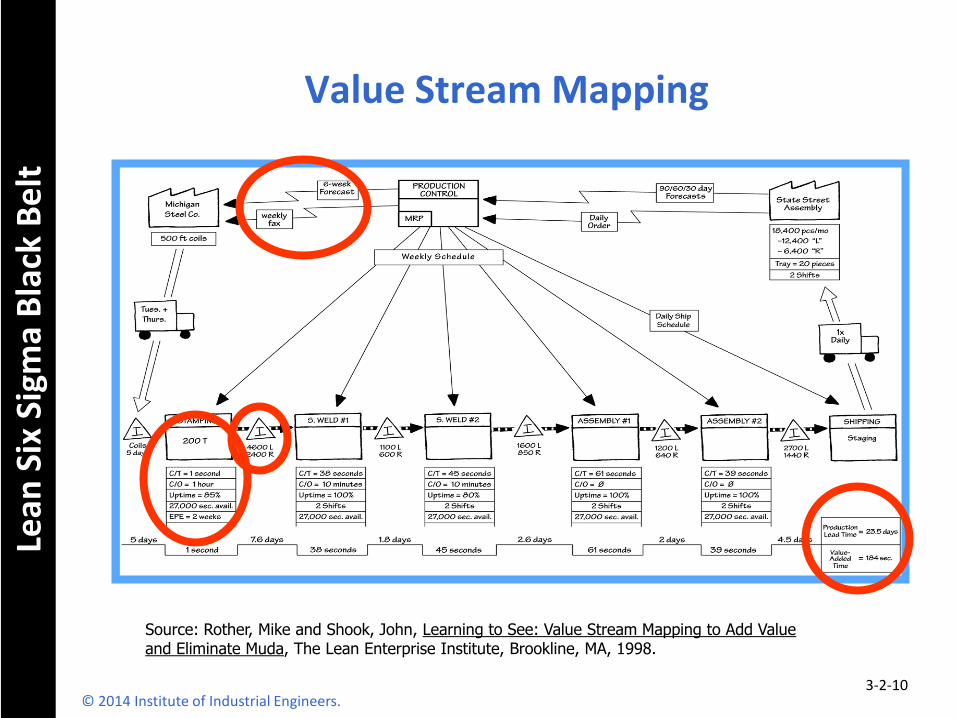
Value Stream Mapping
Source: Rother, Mike and Shook, John, Learning to See: Value Stream Mapping to Add Value and Eliminate Muda, The Lean Enterprise Institute, Brookline, MA, 1998.
3-2-10 © 2014 Institute of Industrial Engineers.
Lean
Six
Sig
ma
Bla
ck B
elt
History of VSM
Toyota Production System method “Material and Information Flow Mapping”
Focus at Toyota is to establish flow, eliminate muda (waste) and add value
Toyota teaches flows of material, information, and people/process
3-2-11 © 2014 Institute of Industrial Engineers.
Lean
Six
Sig
ma
Bla
ck B
elt
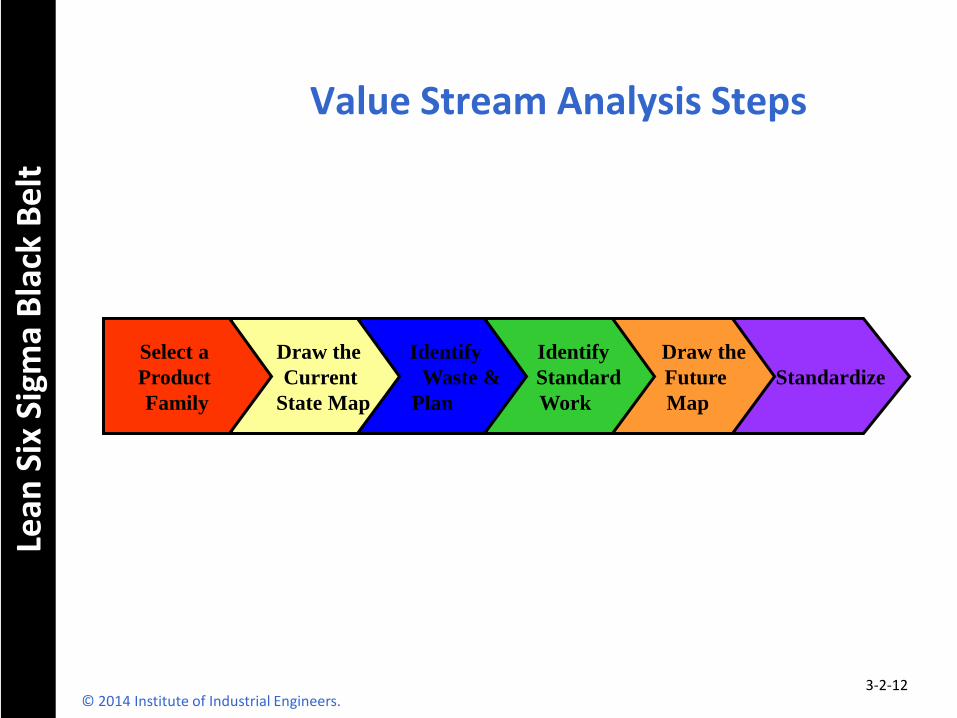
Value Stream Analysis Steps
Standardize
Draw the
Future
Map
Identify
Standard
Work
Identify
Waste &
Plan
Draw the
Current
State Map
Select a
Product
Family
3-2-12 © 2014 Institute of Industrial Engineers.
Lean
Six
Sig
ma
Bla
ck B
elt
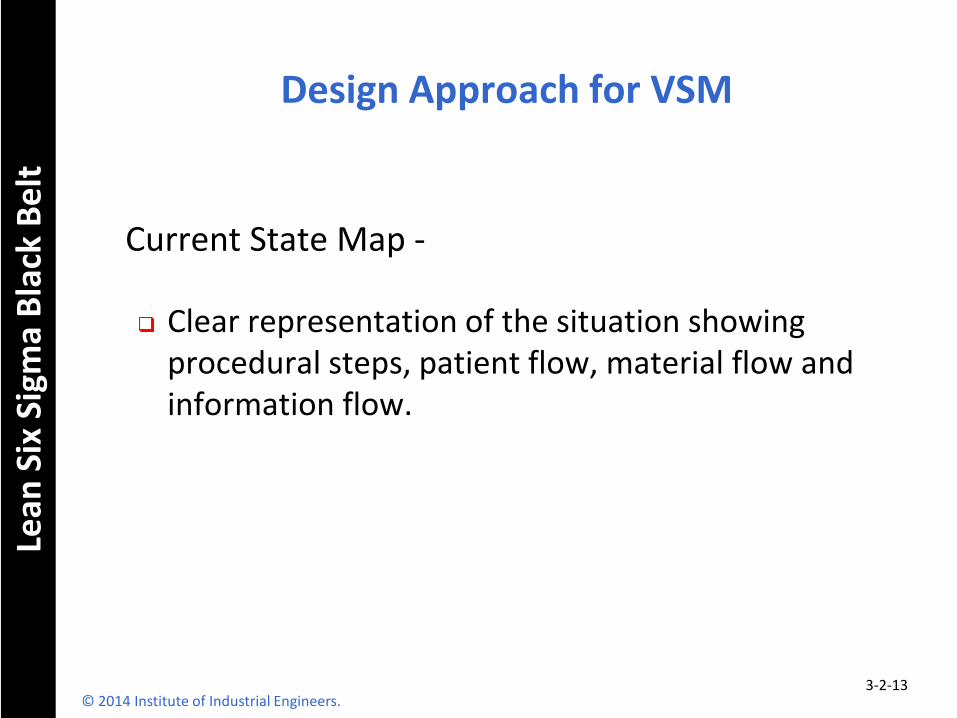
Design Approach for VSM
Current State Map -
Clear representation of the situation showing procedural steps, patient flow, material flow and information flow.
3-2-13 © 2014 Institute of Industrial Engineers.
Lean
Six
Sig
ma
Bla
ck B
elt
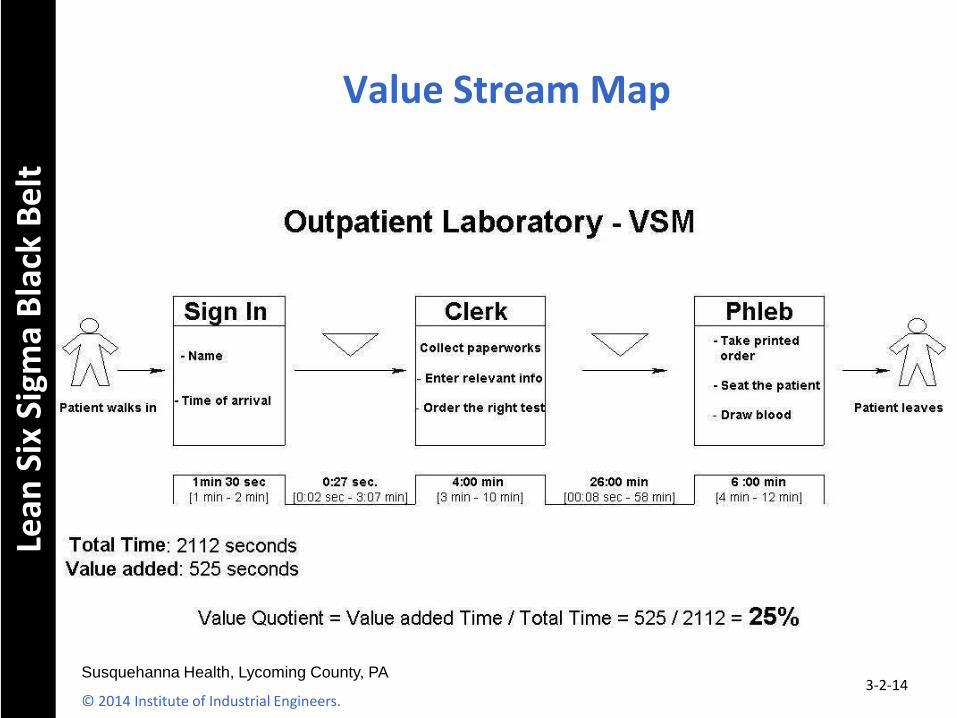
Value Stream Map
© 2014 Institute of Industrial Engineers. 3-2-14
Susquehanna Health, Lycoming County, PA
Lean
Six
Sig
ma
Bla
ck B
elt
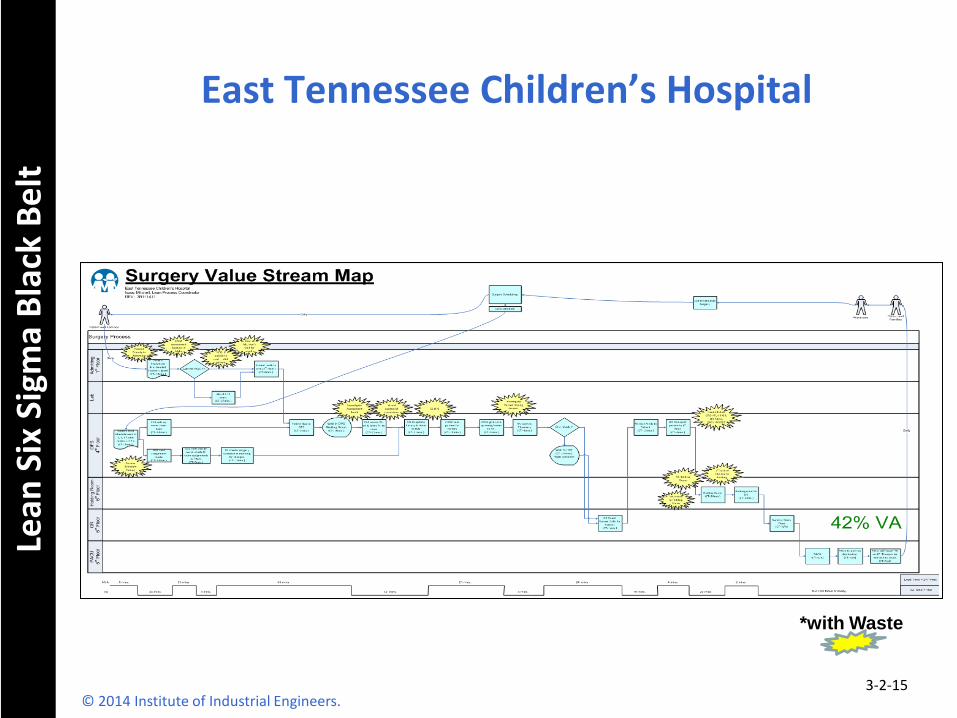
East Tennessee Children’s Hospital
3-2-15
*with Waste
© 2014 Institute of Industrial Engineers.
Lean
Six
Sig
ma
Bla
ck B
elt
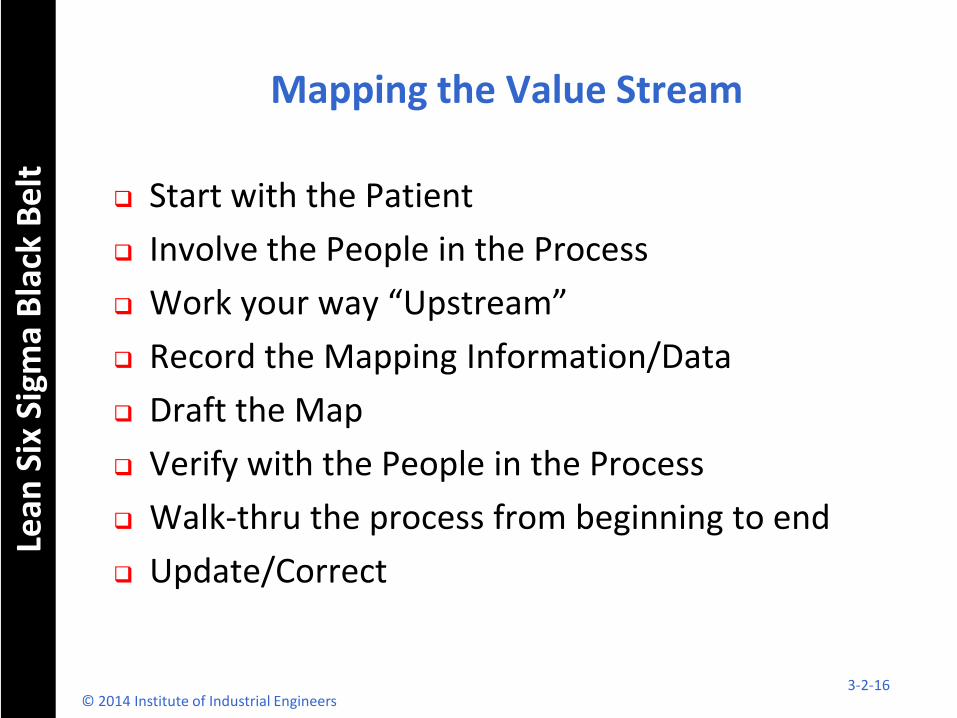
Mapping the Value Stream
Start with the Patient
Involve the People in the Process
Work your way “Upstream”
Record the Mapping Information/Data
Draft the Map
Verify with the People in the Process
Walk-thru the process from beginning to end
Update/Correct
© 2014 Institute of Industrial Engineers 3-2-16
Lean
Six
Sig
ma
Bla
ck B
elt
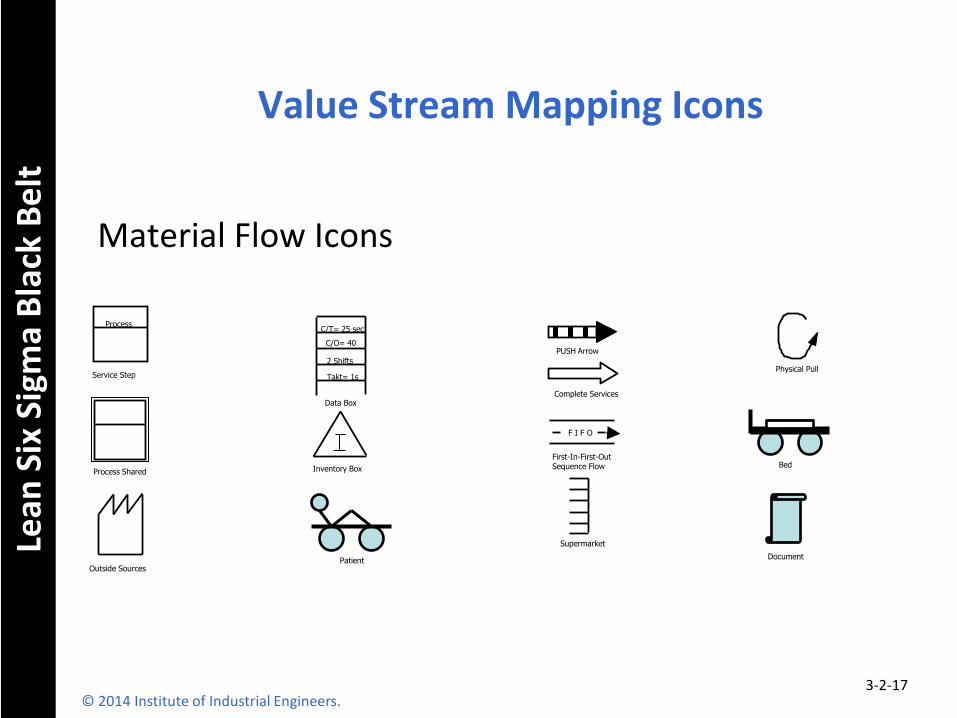
Value Stream Mapping Icons
Material Flow Icons
Process
Service Step
Process Shared
Outside Sources
C/T= 25 sec
C/O= 40
2 Shifts
Takt= 1s
Data Box
Inventory Box
Patient
PUSH Arrow
Complete Services
Supermarket
First-In-First-Out Sequence Flow
F I F O
Physical Pull
Document
3-2-17
Bed
© 2014 Institute of Industrial Engineers.
Lean
Six
Sig
ma
Bla
ck B
elt
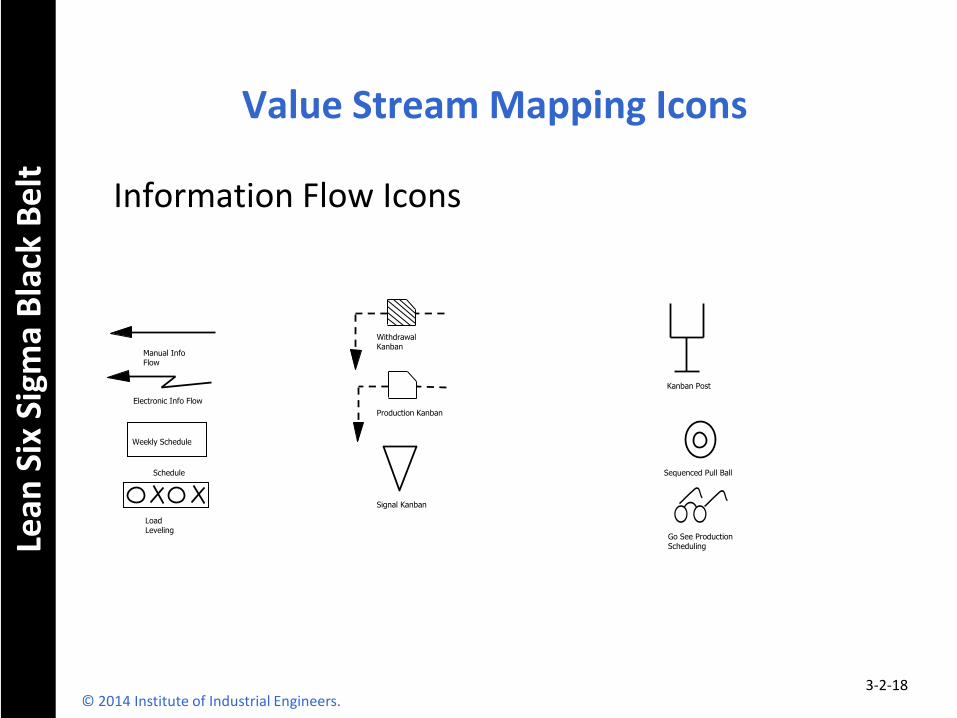
Value Stream Mapping Icons
Information Flow Icons
Manual Info Flow
Electronic Info Flow
Weekly Schedule
Schedule
Load Leveling
Withdrawal Kanban
Production Kanban
Signal Kanban
Kanban Post
Sequenced Pull Ball
Go See Production Scheduling
3-2-18 © 2014 Institute of Industrial Engineers.
Lean
Six
Sig
ma
Bla
ck B
elt
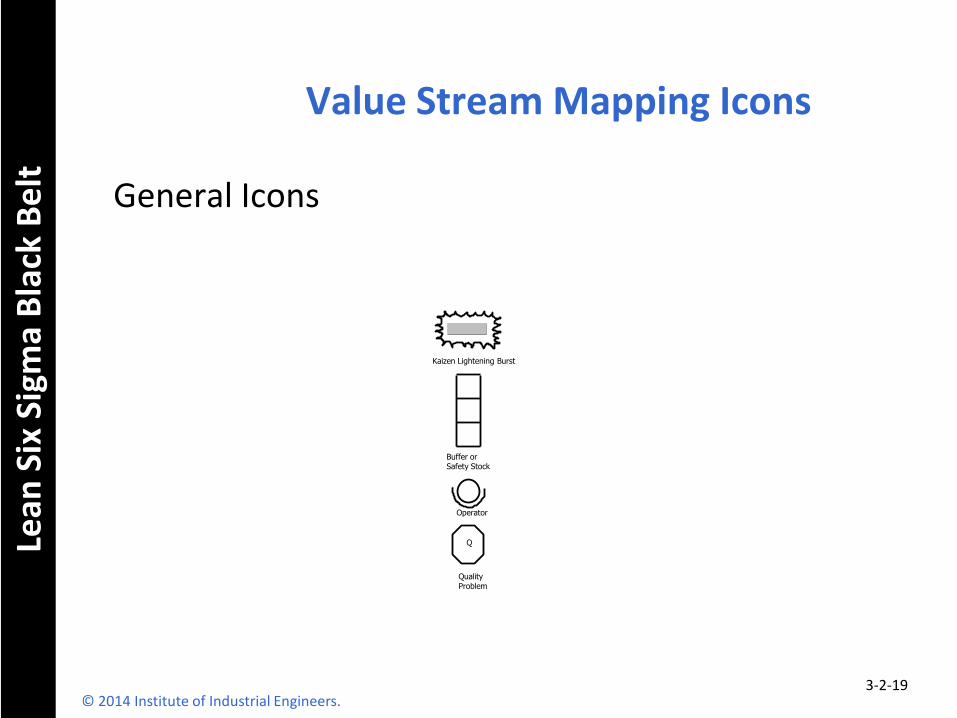
Value Stream Mapping Icons
General Icons
Kaizen Lightening Burst
Buffer or Safety Stock
Operator
Q
Quality Problem
3-2-19 © 2014 Institute of Industrial Engineers.
Lean
Six
Sig
ma
Bla
ck B
elt
© 2014 Institute of Industrial Engineers
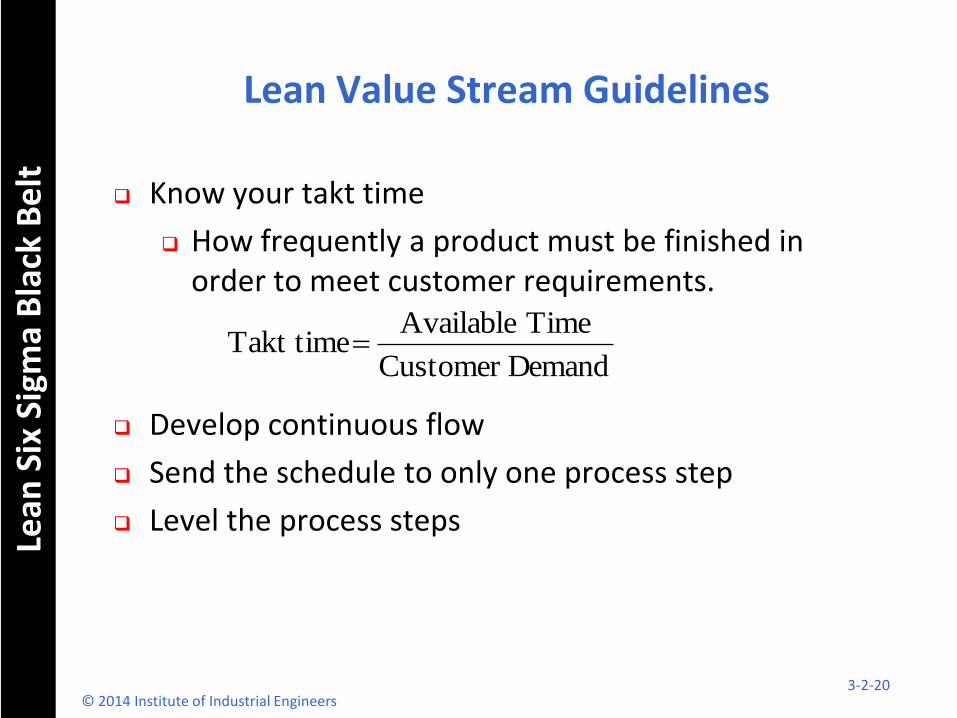
Lean Value Stream Guidelines
Know your takt time
How frequently a product must be finished in order to meet customer requirements.
Develop continuous flow
Send the schedule to only one process step
Level the process steps
emandCustomer D
Time Available Takt time
3-2-20
Lean
Six
Sig
ma
Bla
ck B
elt
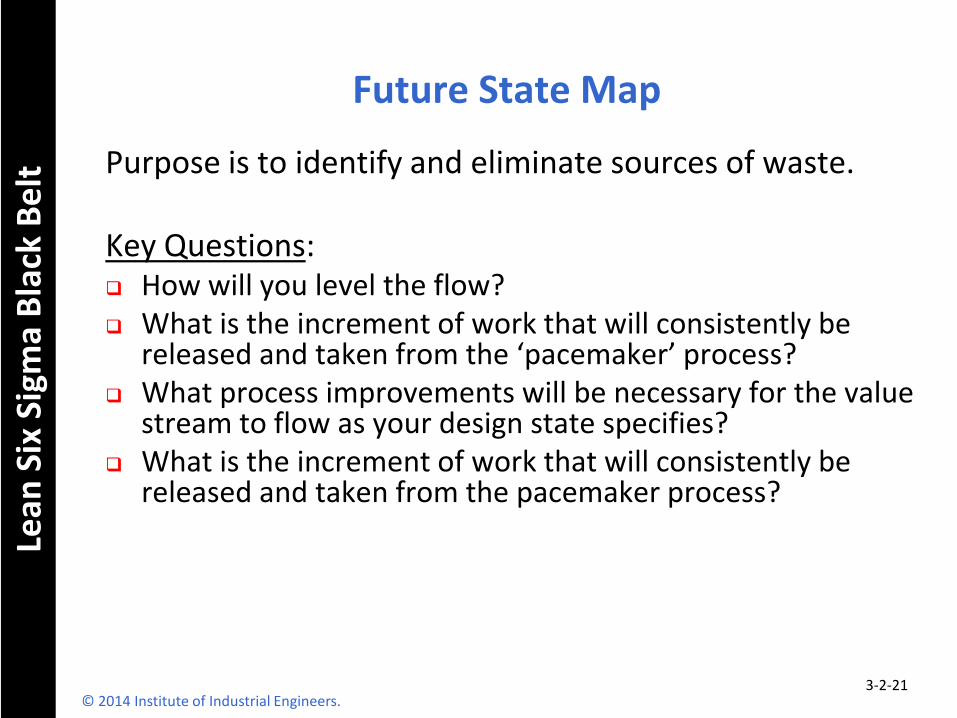
Future State Map
Purpose is to identify and eliminate sources of waste. Key Questions: How will you level the flow? What is the increment of work that will consistently be
released and taken from the ‘pacemaker’ process? What process improvements will be necessary for the value
stream to flow as your design state specifies? What is the increment of work that will consistently be
released and taken from the pacemaker process?
3-2-21 © 2014 Institute of Industrial Engineers.
Lean
Six
Sig
ma
Bla
ck B
elt
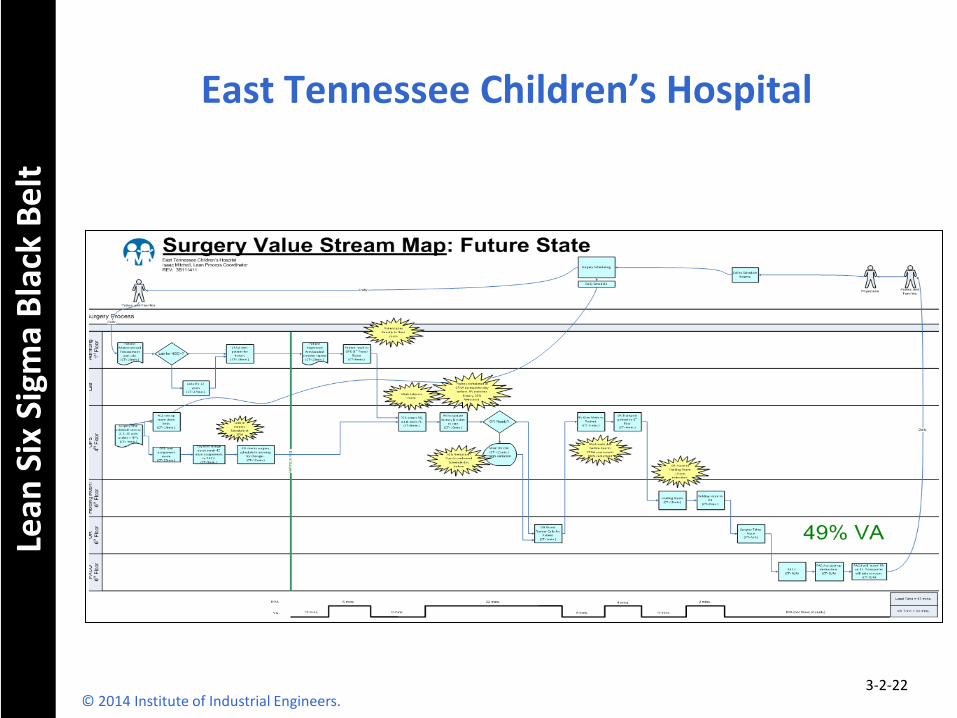
East Tennessee Children’s Hospital
3-2-22 © 2014 Institute of Industrial Engineers.
Lean
Six
Sig
ma
Bla
ck B
elt
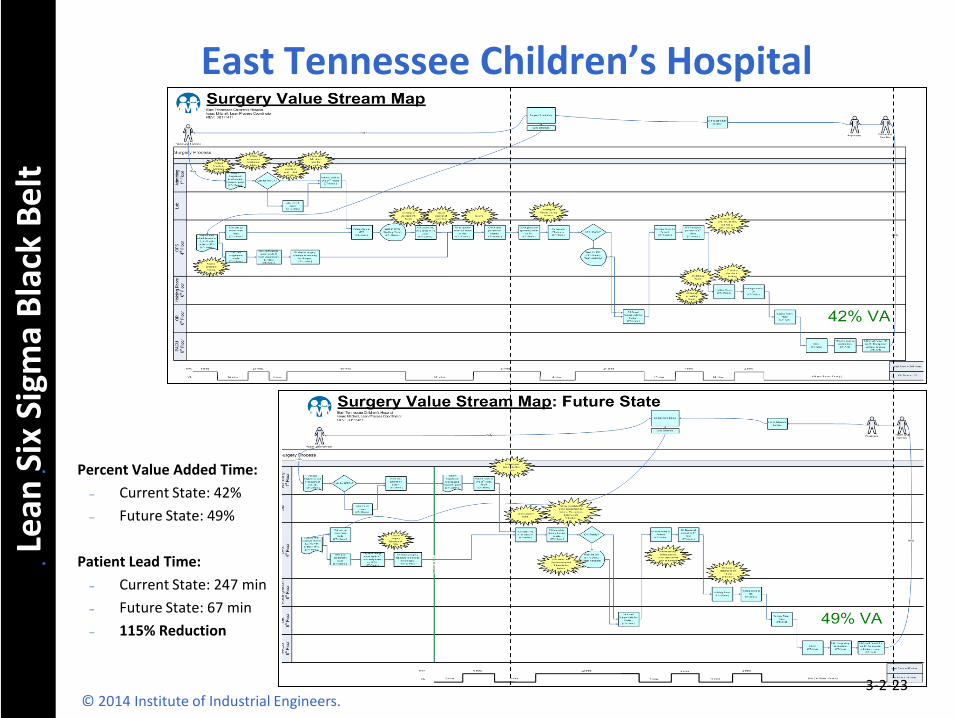
• Percent Value Added Time:
– Current State: 42%
– Future State: 49%
• Patient Lead Time:
– Current State: 247 min
– Future State: 67 min
– 115% Reduction
East Tennessee Children’s Hospital
3-2-23 © 2014 Institute of Industrial Engineers.
Lean
Six
Sig
ma
Bla
ck B
elt
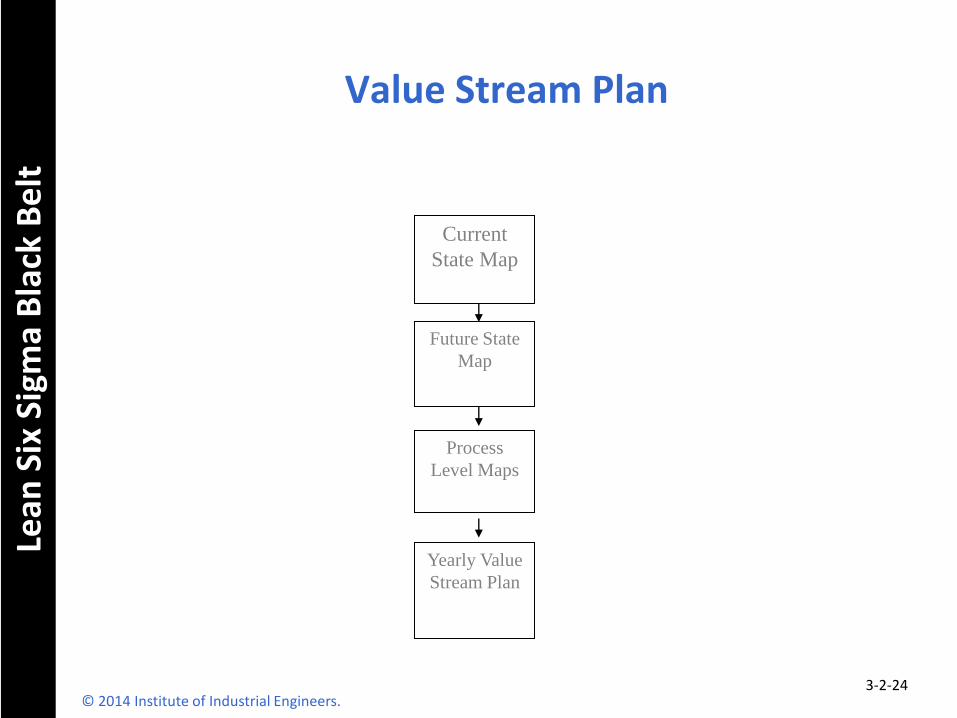
Value Stream Plan
Current
State Map
Future State
Map
Process
Level Maps
Yearly Value
Stream Plan
3-2-24 © 2014 Institute of Industrial Engineers.
Lean
Six
Sig
ma
Bla
ck B
elt
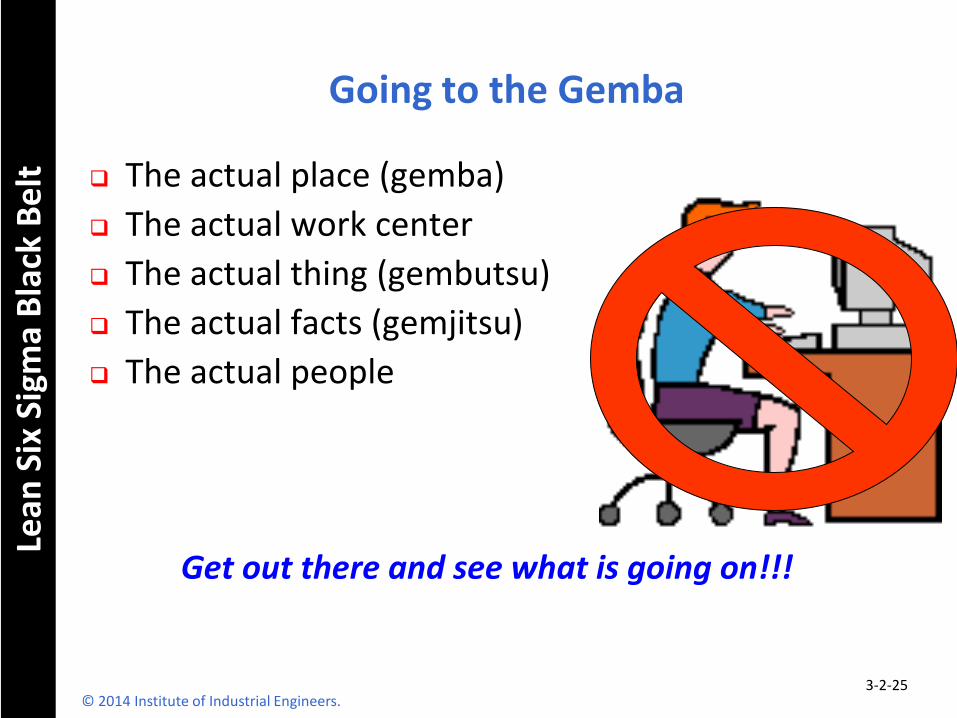
Going to the Gemba
The actual place (gemba)
The actual work center
The actual thing (gembutsu)
The actual facts (gemjitsu)
The actual people
Get out there and see what is going on!!!
3-2-25 © 2014 Institute of Industrial Engineers.
Lean
Six
Sig
ma
Bla
ck B
elt
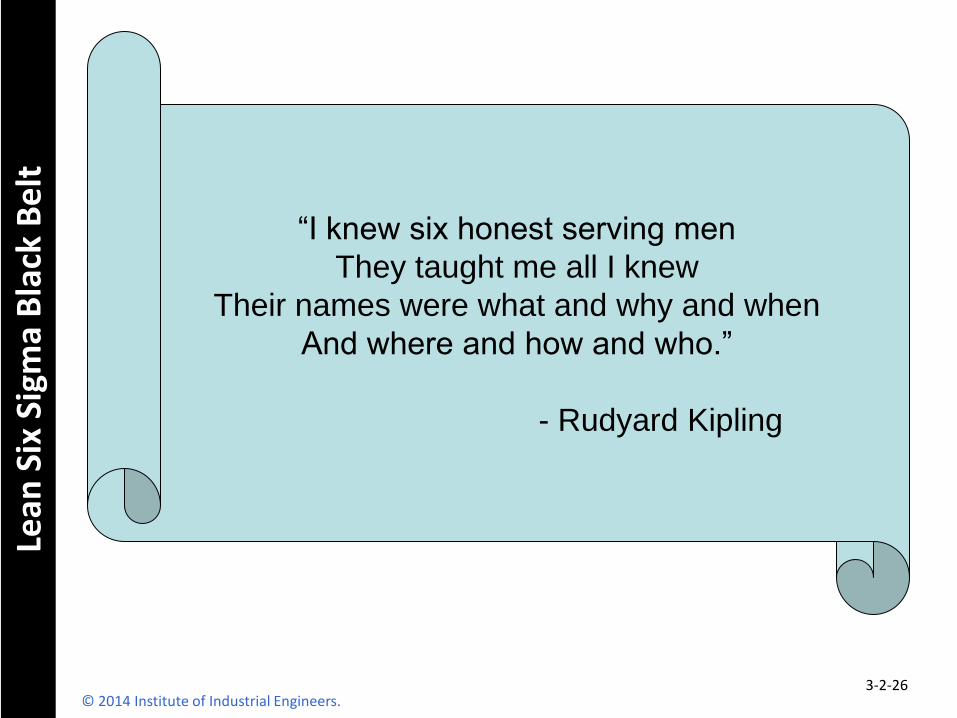
“I knew six honest serving men
They taught me all I knew
Their names were what and why and when
And where and how and who.”
- Rudyard Kipling
3-2-26 © 2014 Institute of Industrial Engineers.
Lean
Six
Sig
ma
Bla
ck B
elt
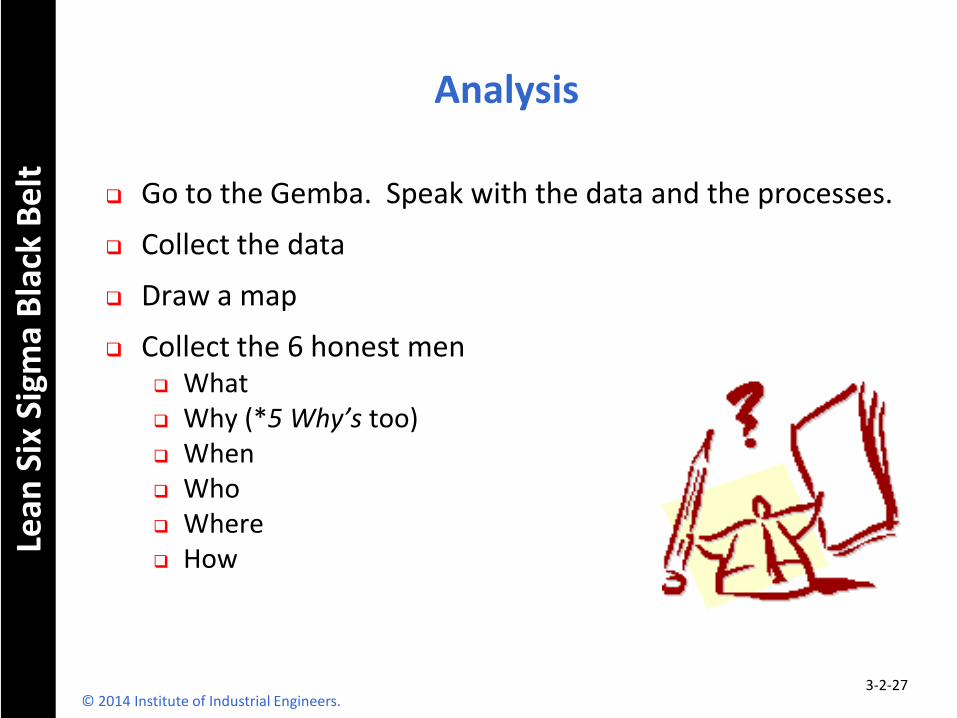
Analysis
Go to the Gemba. Speak with the data and the processes.
Collect the data
Draw a map
Collect the 6 honest men What Why (*5 Why’s too) When Who Where How
3-2-27 © 2014 Institute of Industrial Engineers.
Lean
Six
Sig
ma
Bla
ck B
elt
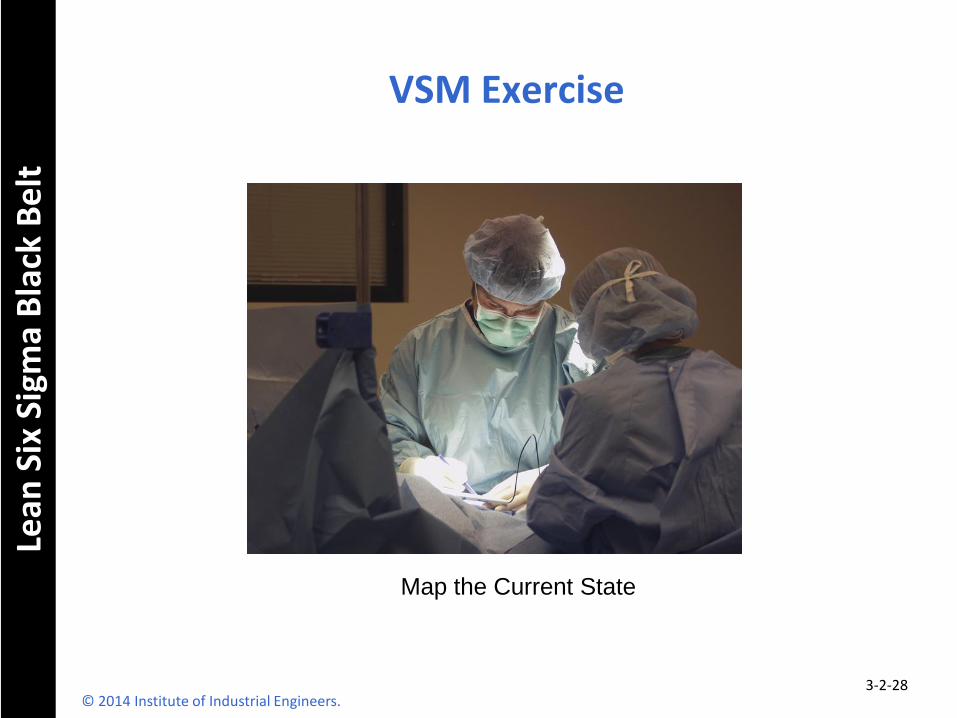
VSM Exercise
© 2014 Institute of Industrial Engineers. 3-2-28
Map the Current State
Lean
Six
Sig
ma
Bla
ck B
elt
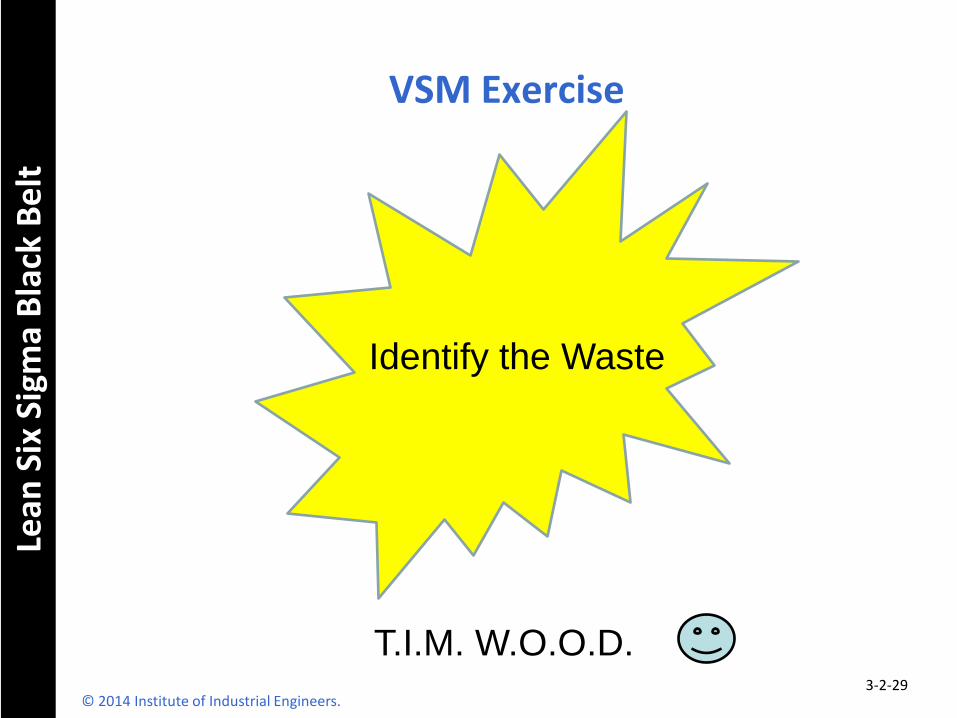
VSM Exercise
© 2014 Institute of Industrial Engineers. 3-2-29
Identify the Waste
T.I.M. W.O.O.D.
Lean
Six
Sig
ma
Bla
ck B
elt
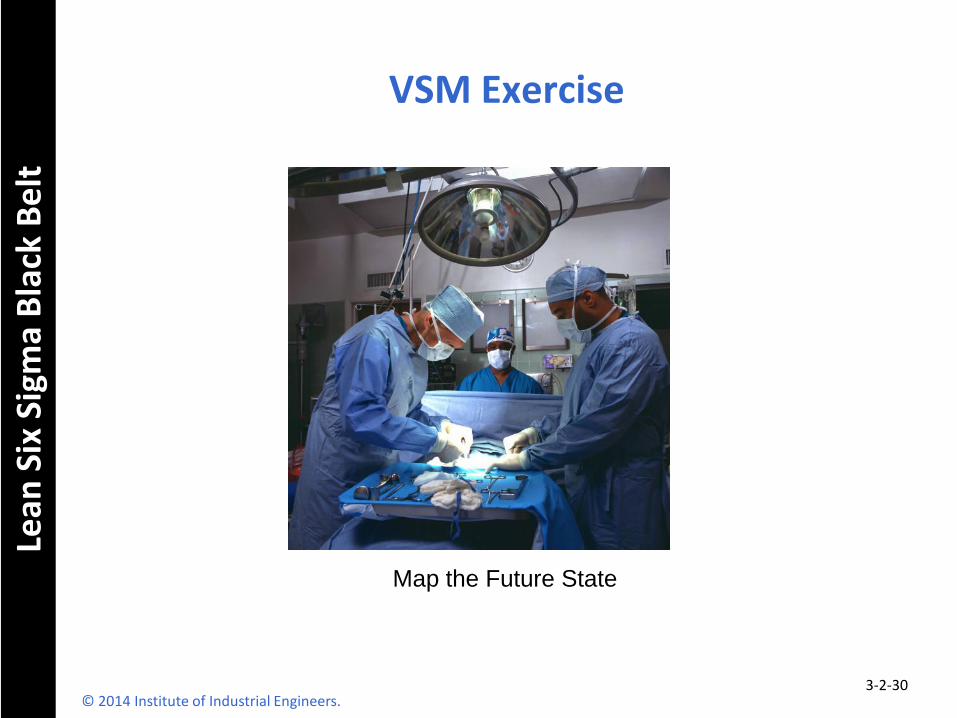
VSM Exercise
© 2014 Institute of Industrial Engineers. 3-2-30
Map the Future State
Lean
Six
Sig
ma
Bla
ck B
elt
© 2014 Institute of Industrial Engineers
Value Stream Plan
DATE SIGNATURES
FACILITY
MANAGER
PLANT
MGR
ENG
VALUE STREAM
MANAGERMONTHLY SCHEDULE UNION MFG
PLANT LEVEL
OBJECTIVE
VS
LOOP
VALUE STREAM
OBJECTIVE
GOAL
MEASURABLE
J
A
N
F
E
B
M
A
R
A
P
R
M
A
Y
J
U
N
J
U
L
A
U
G
S
E
P
O
C
T
N
O
V
D
E
C
RESP TEAM REVIEWER DATE
3-2-31
Lean
Six
Sig
ma
Bla
ck B
elt
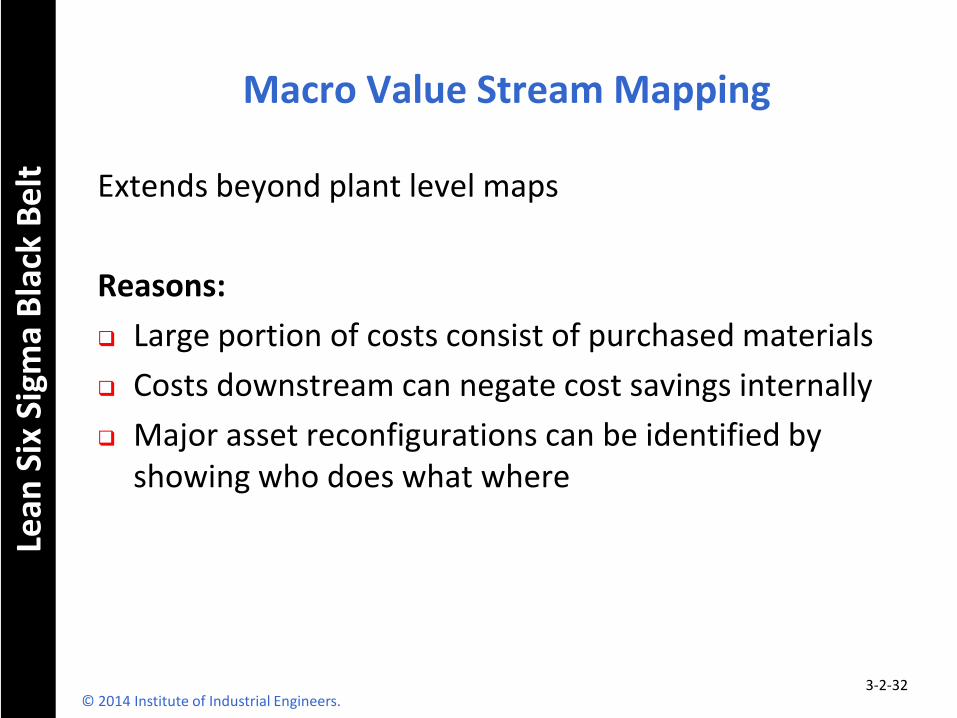
Macro Value Stream Mapping
Extends beyond plant level maps
Reasons:
Large portion of costs consist of purchased materials
Costs downstream can negate cost savings internally
Major asset reconfigurations can be identified by showing who does what where
3-2-32 © 2014 Institute of Industrial Engineers.
Lean
Six
Sig
ma
Bla
ck B
elt
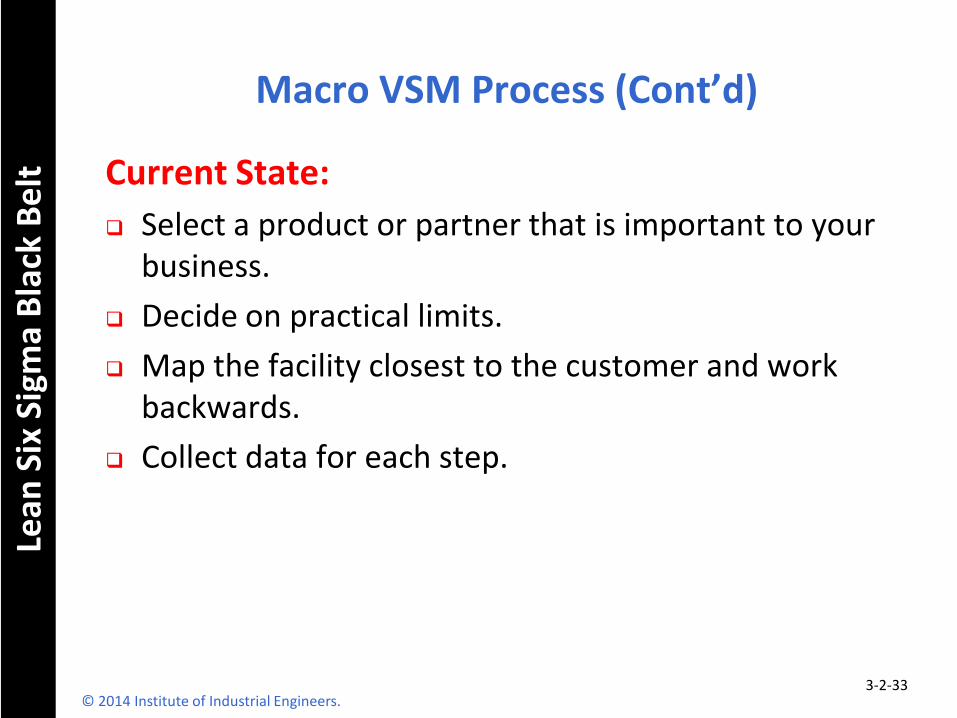
Macro VSM Process (Cont’d)
Current State:
Select a product or partner that is important to your business.
Decide on practical limits.
Map the facility closest to the customer and work backwards.
Collect data for each step.
3-2-33 © 2014 Institute of Industrial Engineers.
Lean
Six
Sig
ma
Bla
ck B
elt
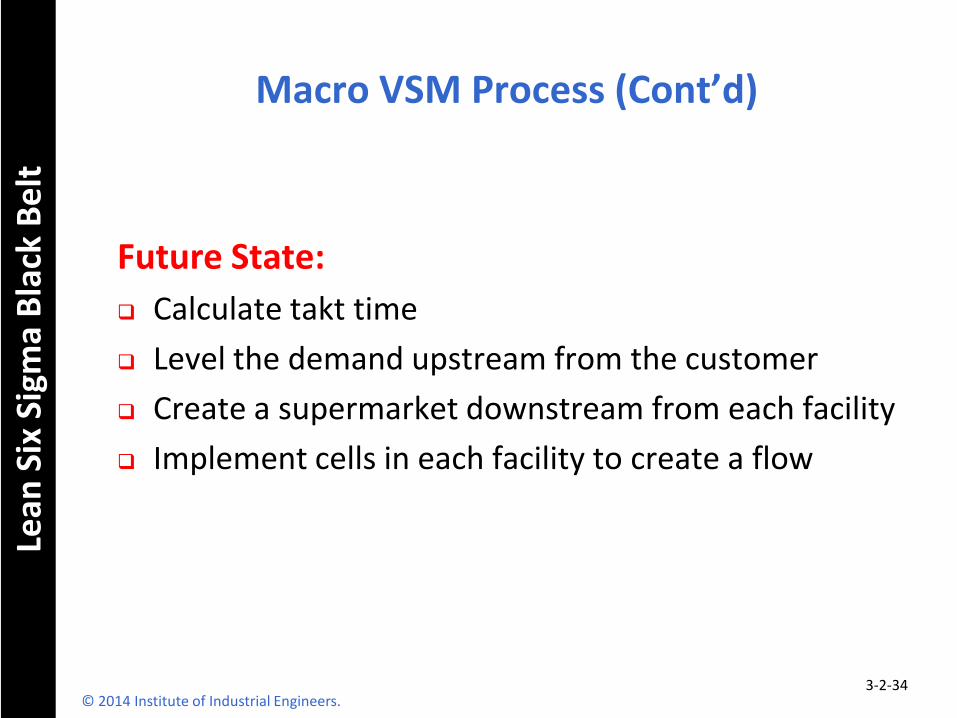
Macro VSM Process (Cont’d)
Future State:
Calculate takt time
Level the demand upstream from the customer
Create a supermarket downstream from each facility
Implement cells in each facility to create a flow
3-2-34 © 2014 Institute of Industrial Engineers.
Lean
Six
Sig
ma
Bla
ck B
elt
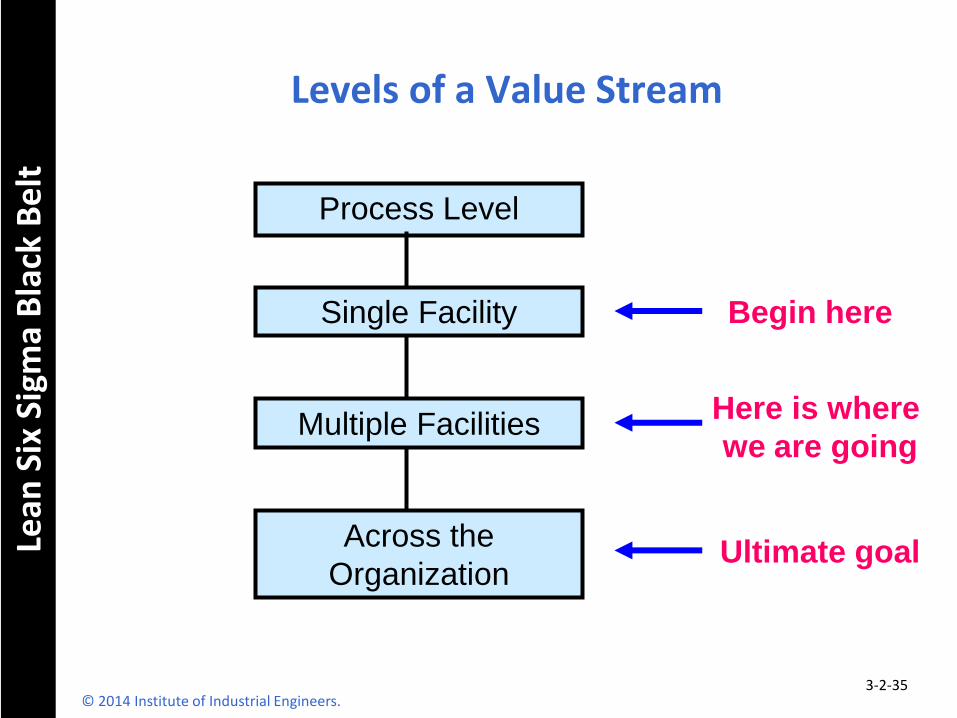
Levels of a Value Stream
Process Level
Single Facility
Multiple Facilities
Across the
Organization
Begin here
Here is where
we are going
Ultimate goal
© 2014 Institute of Industrial Engineers. 3-2-35
Lean
Six
Sig
ma
Bla
ck B
elt
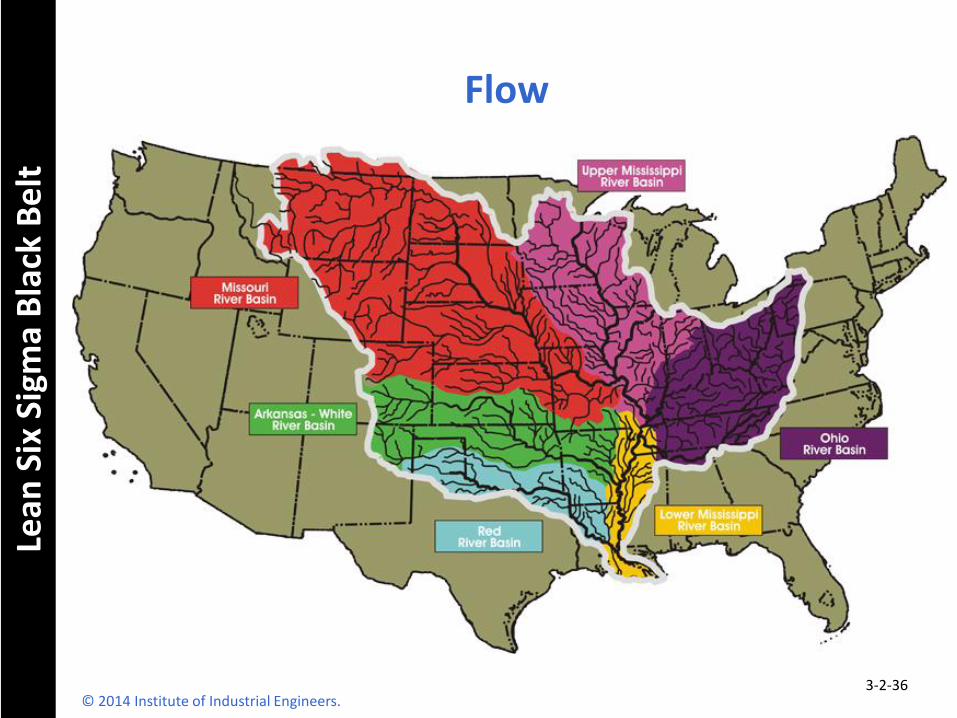
Flow
© 2014 Institute of Industrial Engineers. 3-2-36
Lean
Six
Sig
ma
Bla
ck B
elt
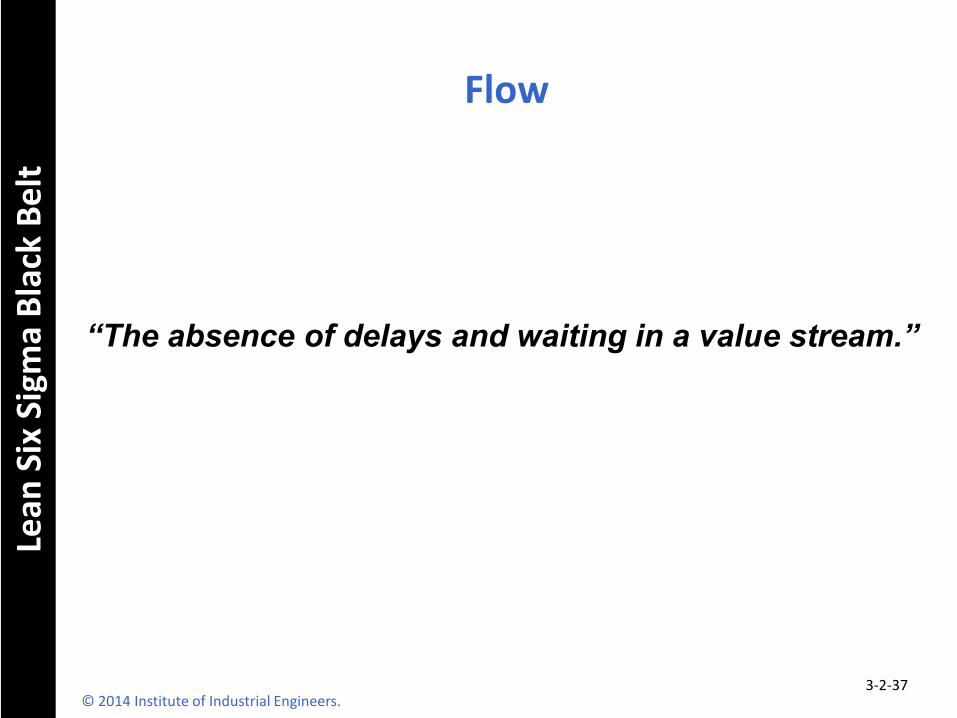
Flow
© 2014 Institute of Industrial Engineers. 3-2-37
“The absence of delays and waiting in a value stream.”
Lean
Six
Sig
ma
Bla
ck B
elt
Flow: The Many Views
Physical (Floor Layout)
Logical (VSM)
Functional (Process Flowchart)
Varieties
Patient
Personnel
Material
Information
© 2014 Institute of Industrial Engineers. 3-2-38
Lean
Six
Sig
ma
Bla
ck B
elt
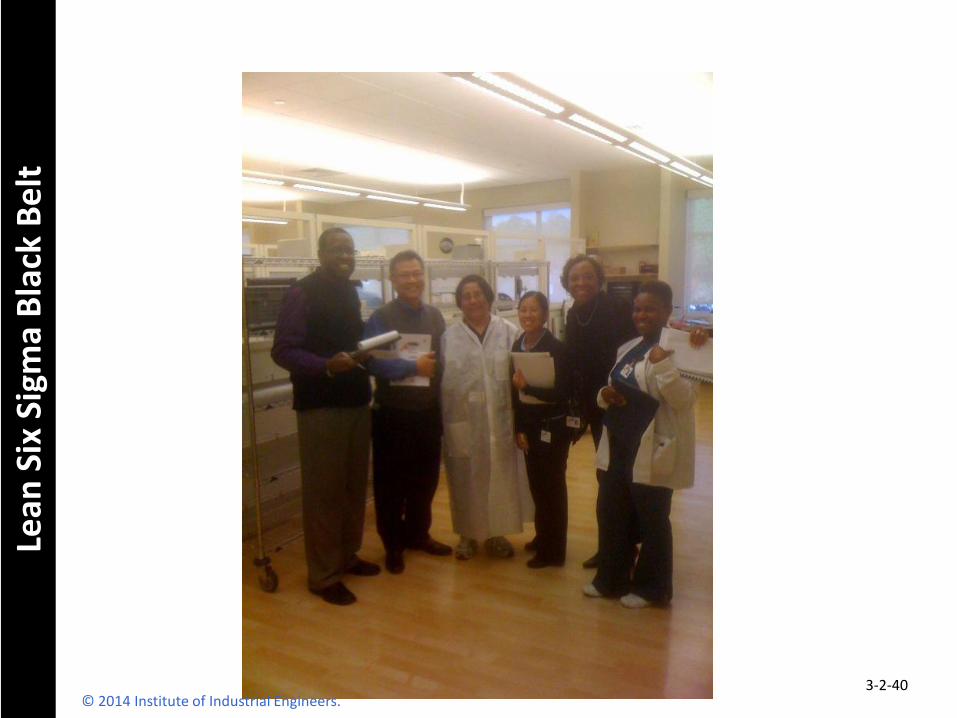
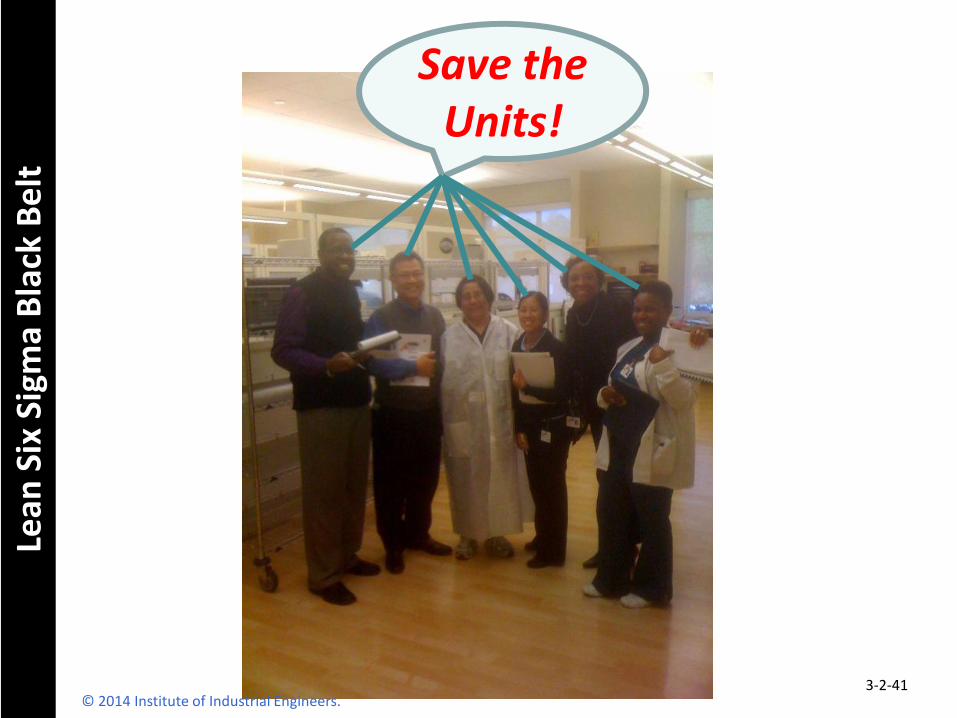
Components Receiving
Save the Units!
© 2014 Institute of Industrial Engineers. 3-2-39
Lean
Six
Sig
ma
Bla
ck B
elt
© 2014 Institute of Industrial Engineers. 3-2-40
Lean
Six
Sig
ma
Bla
ck B
elt
Save the
Units!
© 2014 Institute of Industrial Engineers. 3-2-41
Lean
Six
Sig
ma
Bla
ck B
elt
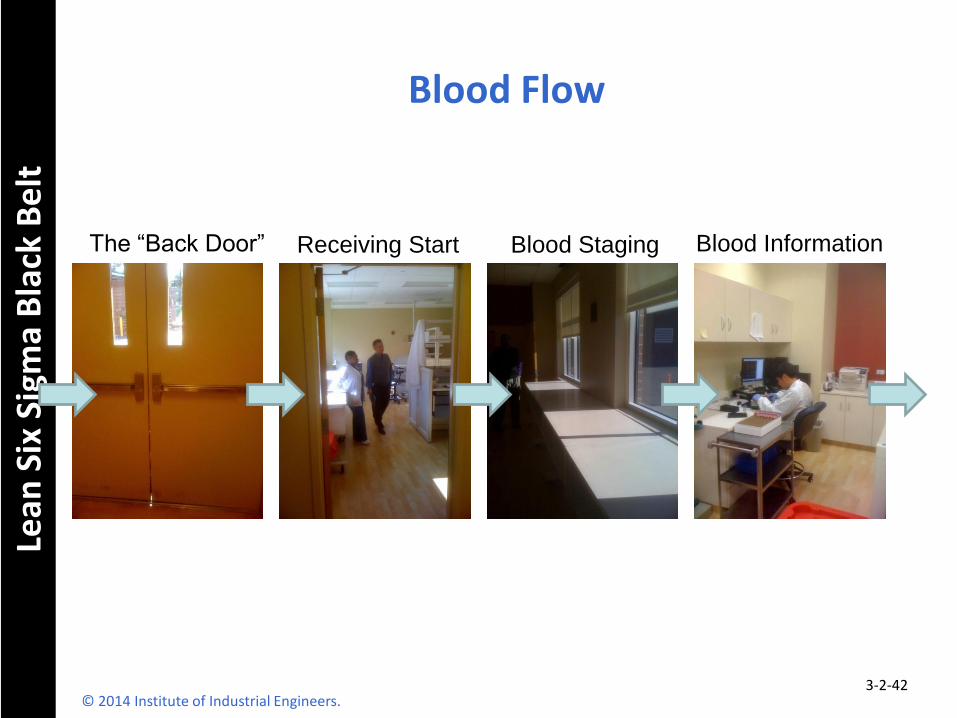
The “Back Door” Receiving Start Blood Staging Blood Information
© 2014 Institute of Industrial Engineers. 3-2-42
Blood Flow
Lean
Six
Sig
ma
Bla
ck B
elt
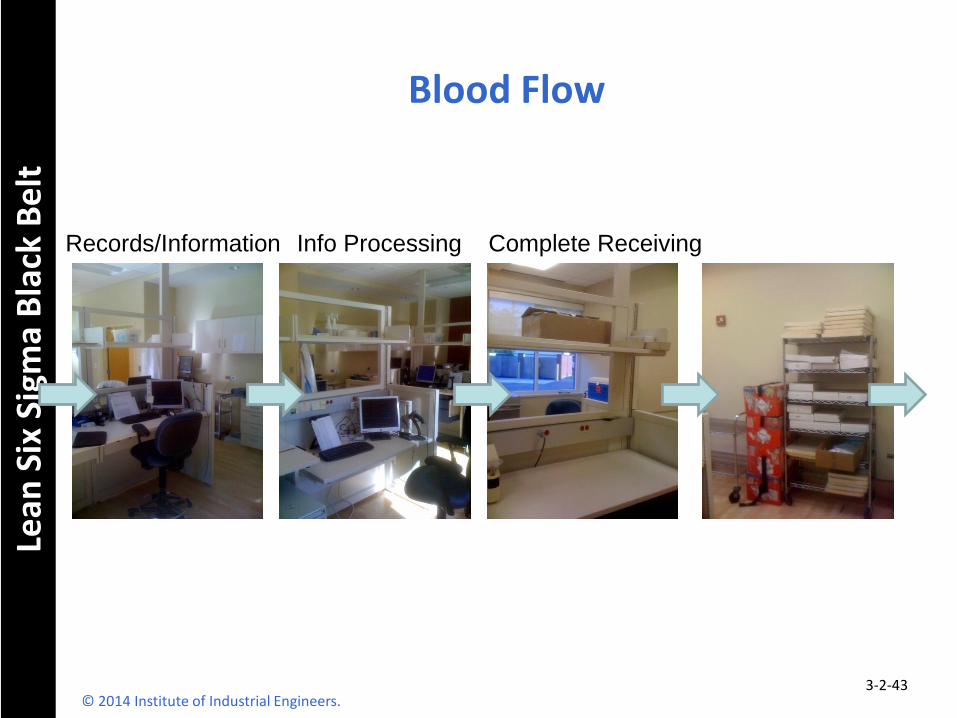
Records/Information Complete Receiving Info Processing
© 2014 Institute of Industrial Engineers. 3-2-43
Blood Flow
Lean
Six
Sig
ma
Bla
ck B
elt
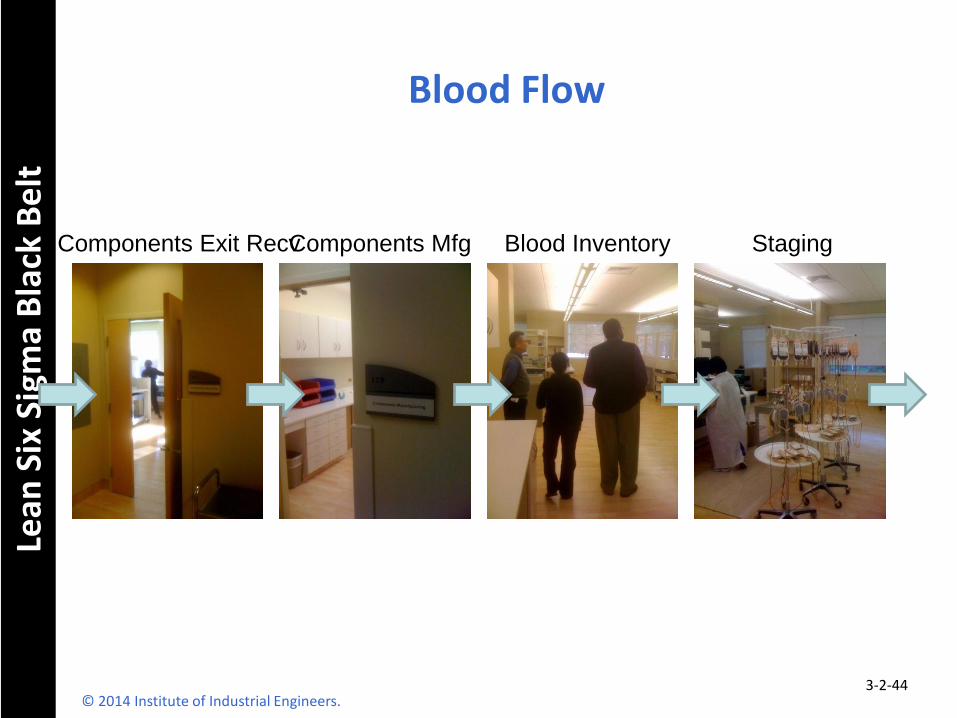
Staging Components Mfg Blood Inventory Components Exit Recv
© 2014 Institute of Industrial Engineers. 3-2-44
Blood Flow
Lean
Six
Sig
ma
Bla
ck B
elt
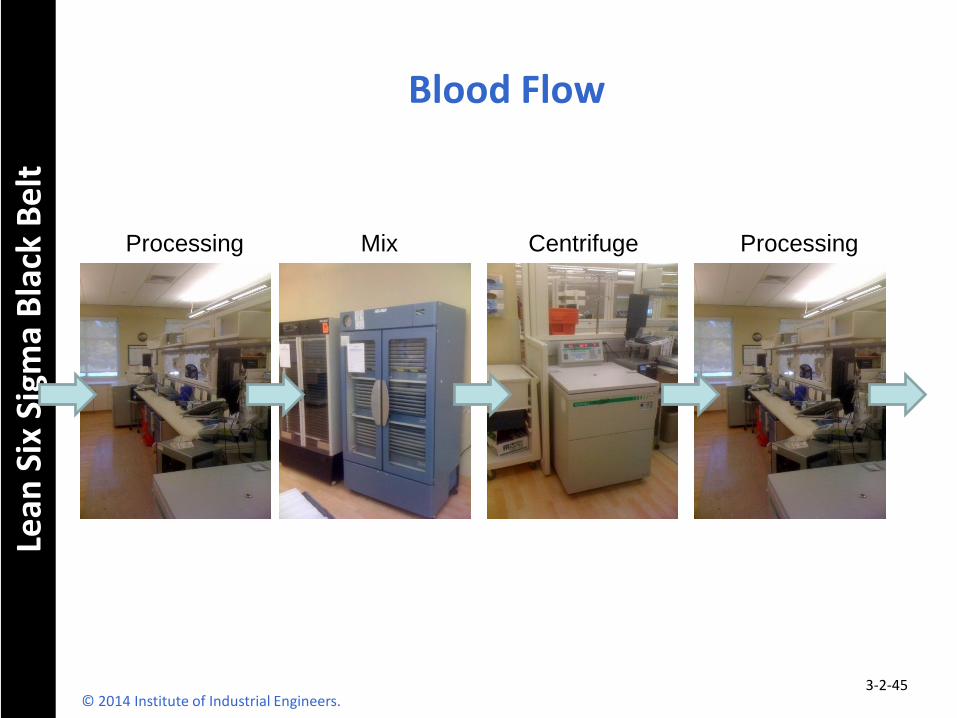
Processing Centrifuge Processing Mix
© 2014 Institute of Industrial Engineers. 3-2-45
Blood Flow
Lean
Six
Sig
ma
Bla
ck B
elt
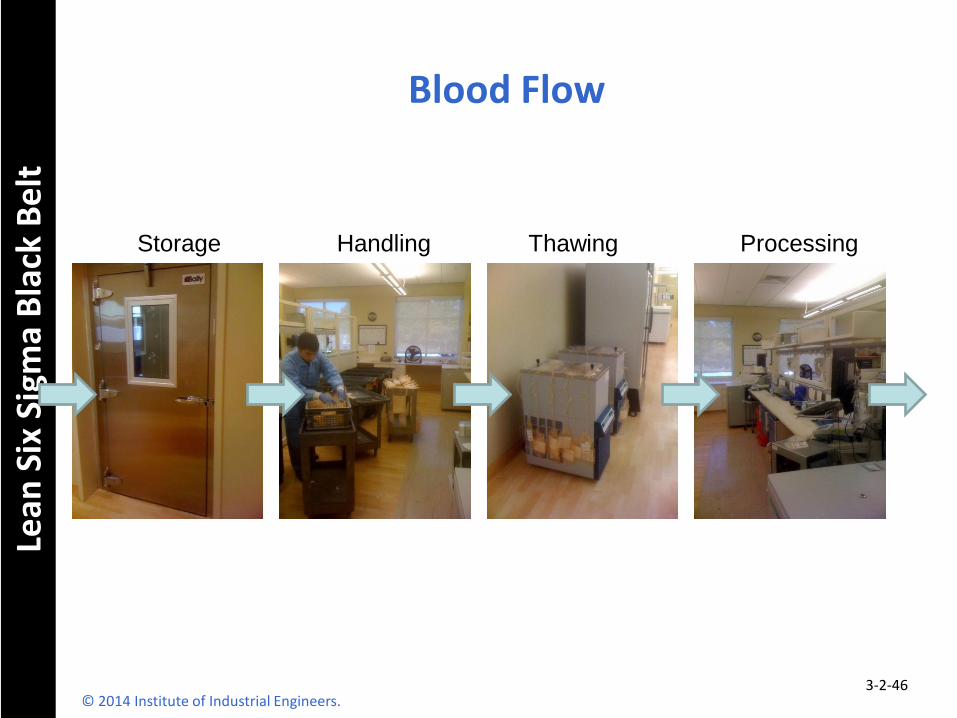
Processing Thawing Handling Storage
© 2014 Institute of Industrial Engineers. 3-2-46
Blood Flow
Lean
Six
Sig
ma
Bla
ck B
elt
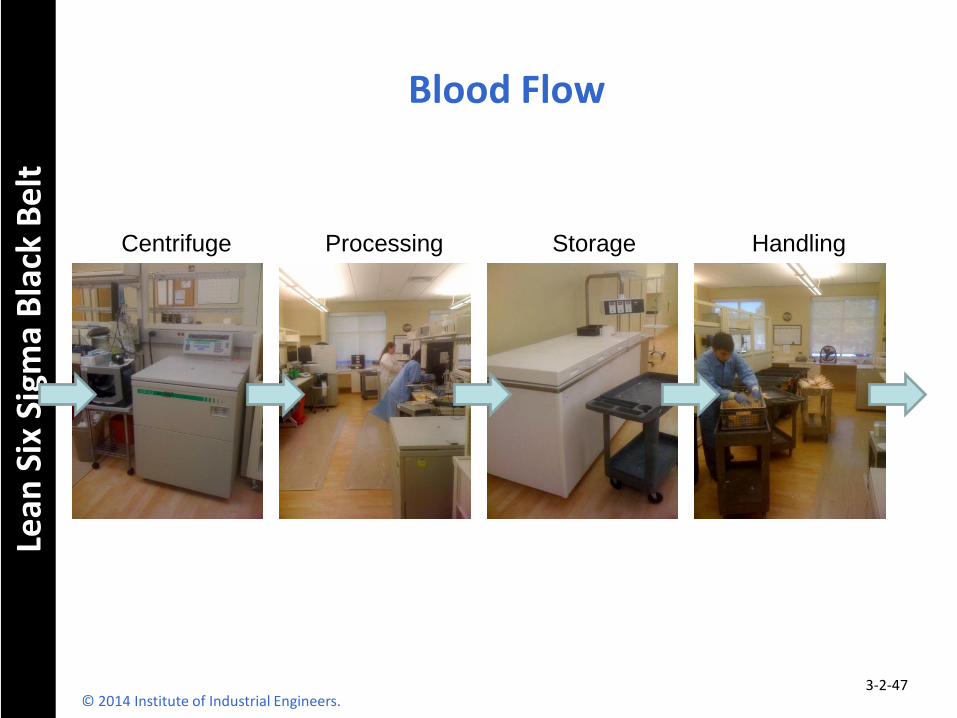
Centrifuge Processing Storage Handling
© 2014 Institute of Industrial Engineers. 3-2-47
Blood Flow
Lean
Six
Sig
ma
Bla
ck B
elt
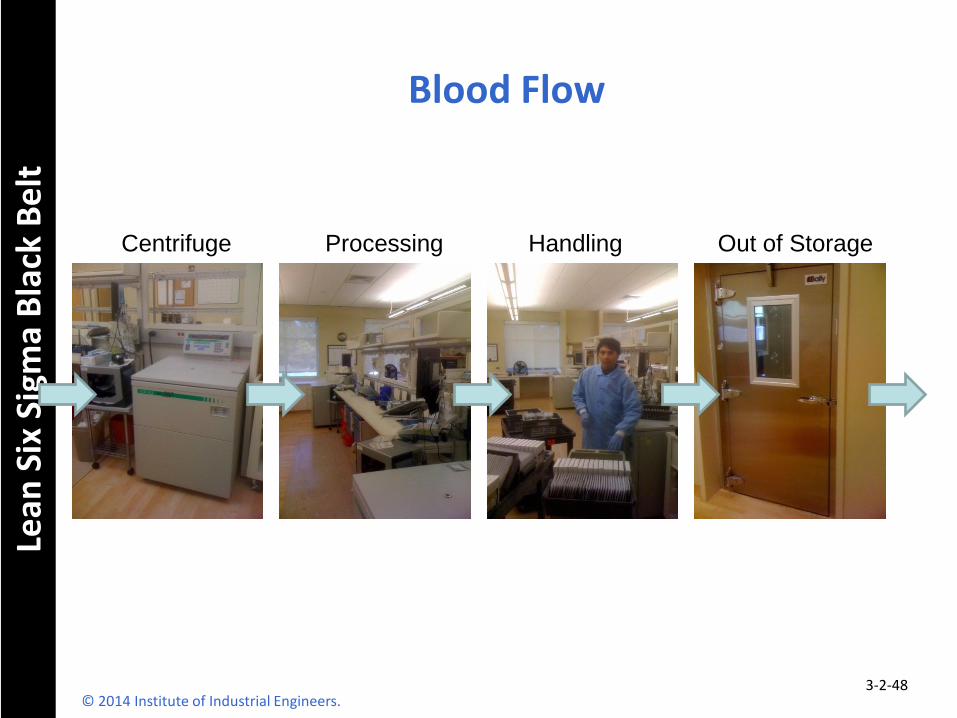
Processing Out of Storage Centrifuge Handling
© 2014 Institute of Industrial Engineers. 3-2-48
Blood Flow
Lean
Six
Sig
ma
Bla
ck B
elt
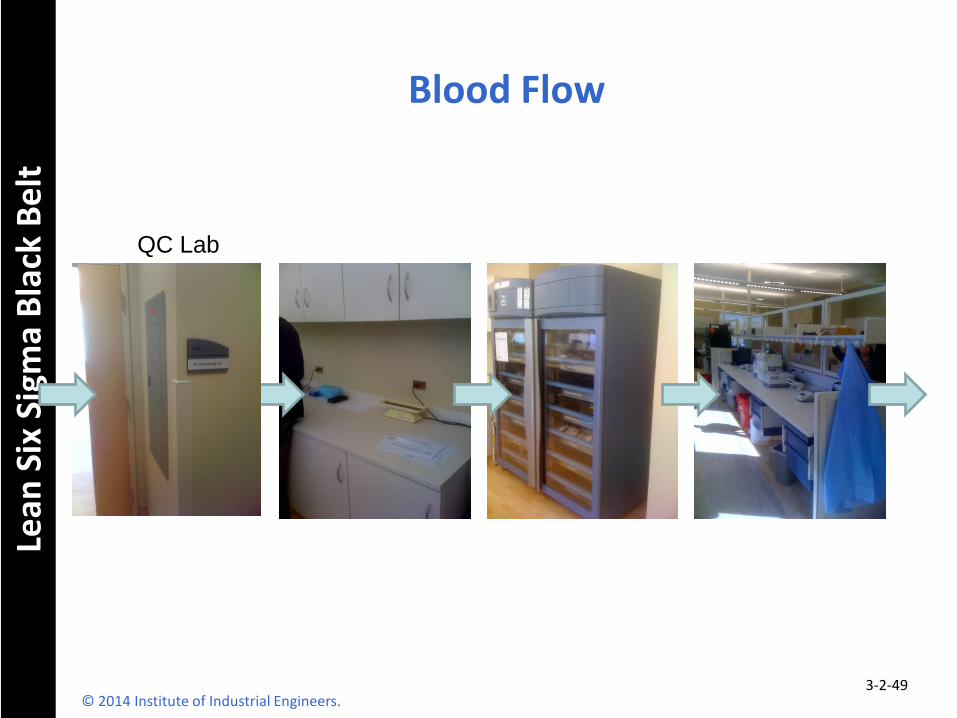
QC Lab
© 2014 Institute of Industrial Engineers. 3-2-49
Blood Flow
Lean
Six
Sig
ma
Bla
ck B
elt
© 2014 Institute of Industrial Engineers. 3-2-50
Blood Flow
Lean
Six
Sig
ma
Bla
ck B
elt
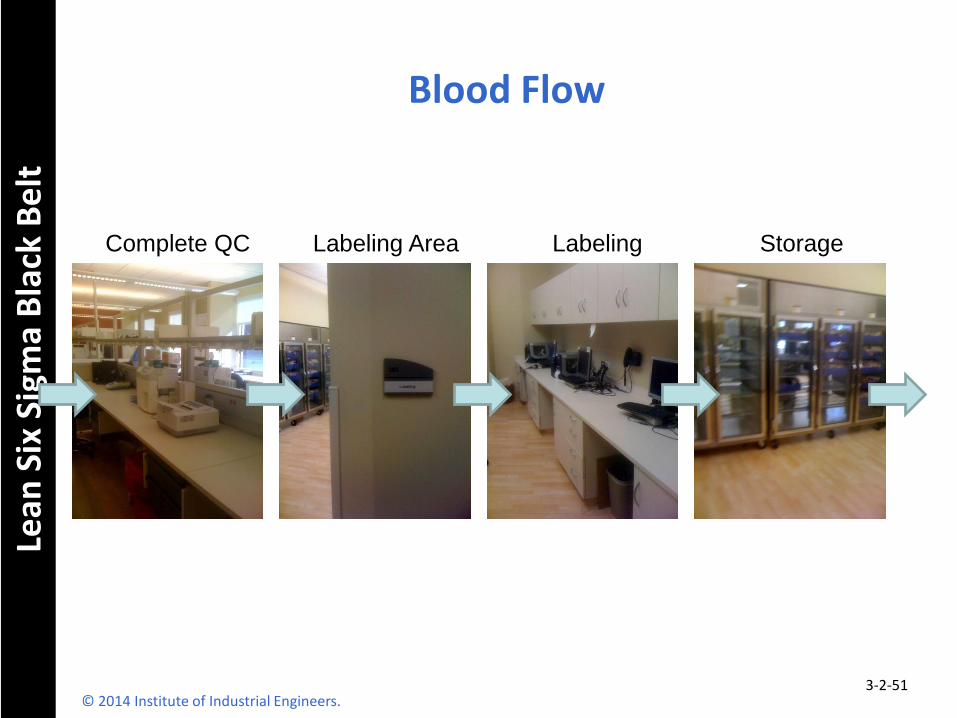
Labeling Storage Labeling Area Complete QC
© 2014 Institute of Industrial Engineers. 3-2-51
Blood Flow
Lean
Six
Sig
ma
Bla
ck B
elt
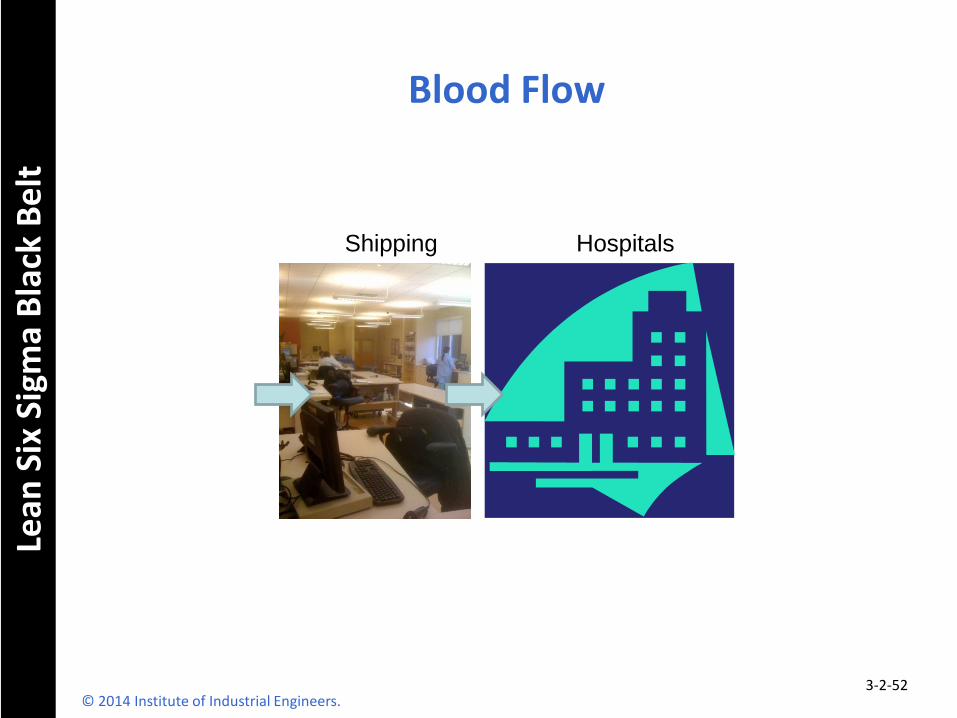
Hospitals Shipping
© 2014 Institute of Industrial Engineers. 3-2-52
Blood Flow
Lean
Six
Sig
ma
Bla
ck B
elt
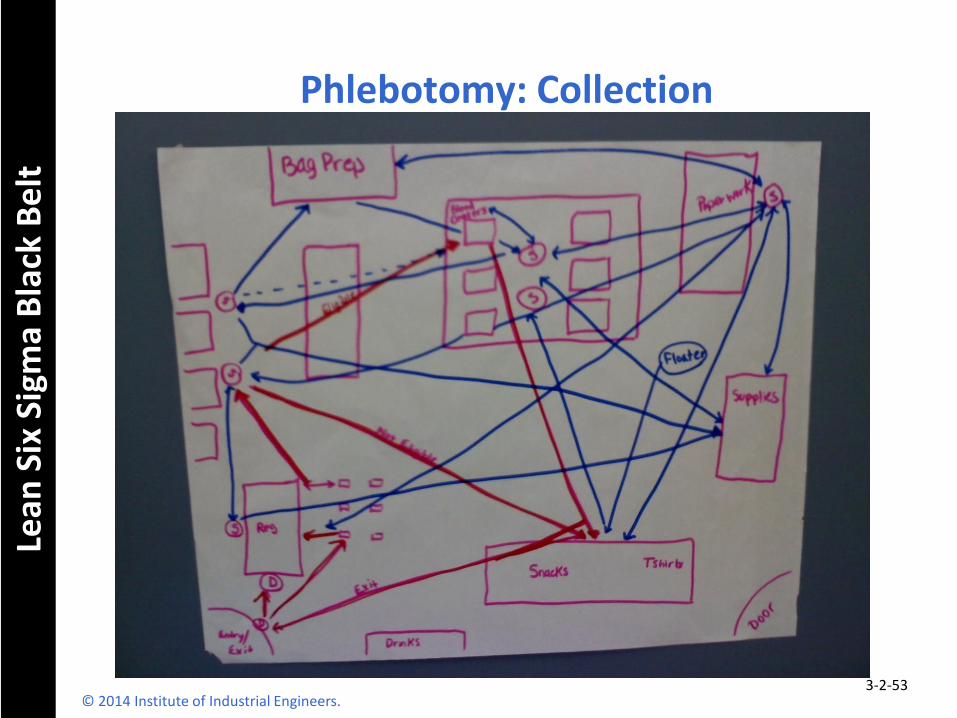
Phlebotomy: Collection
© 2014 Institute of Industrial Engineers. 3-2-53
Lean
Six
Sig
ma
Bla
ck B
elt
© 2014 Institute of Industrial Engineers. 3-2-54
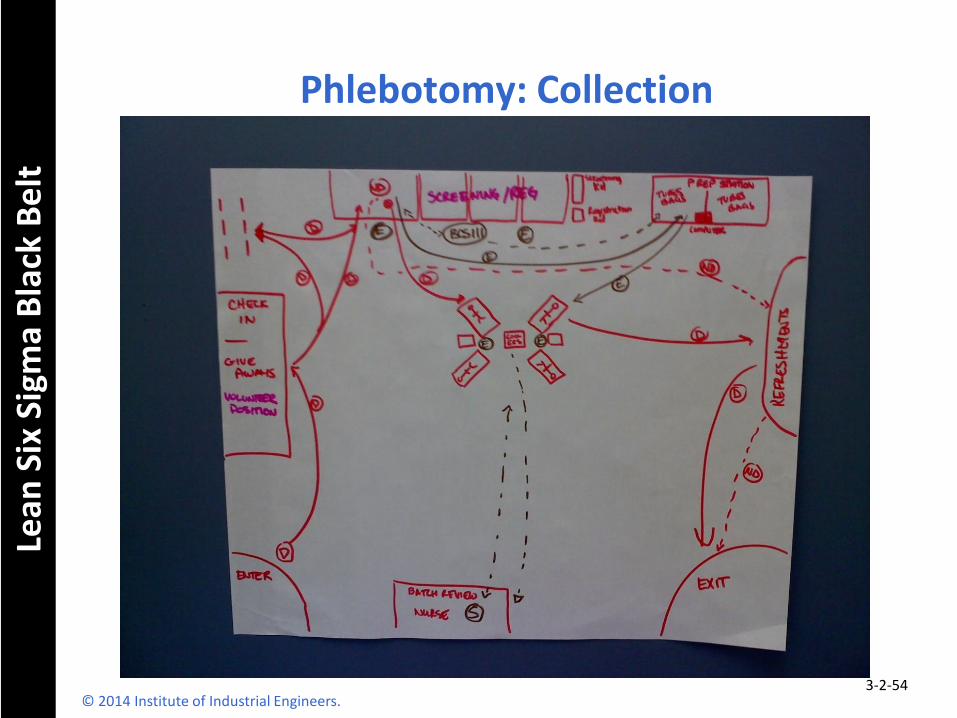
Phlebotomy: Collection
Lean
Six
Sig
ma
Bla
ck B
elt
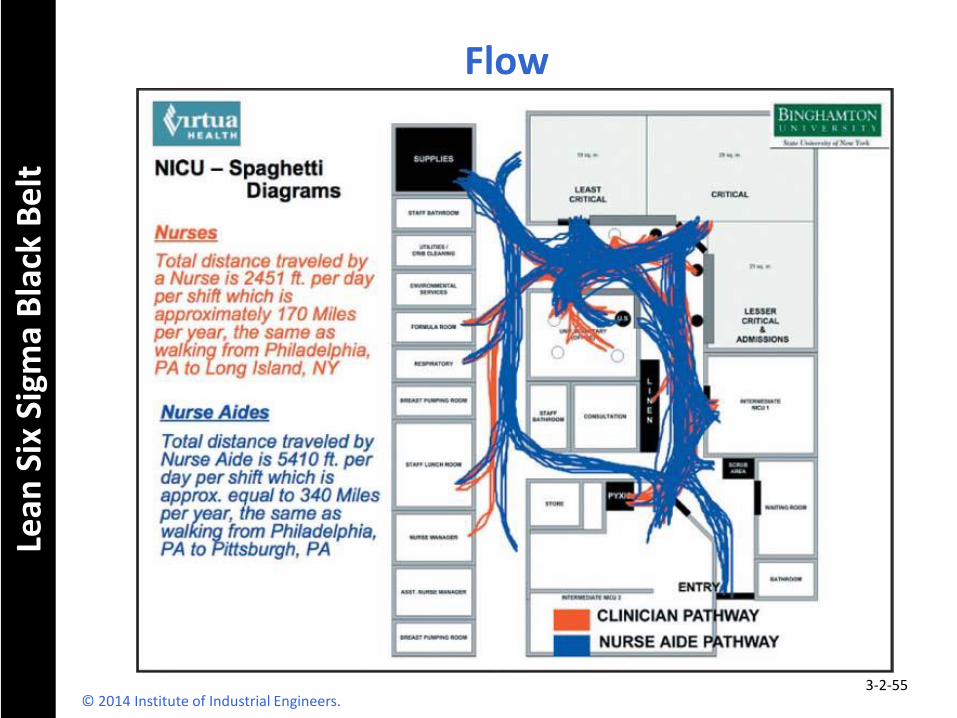
Flow
© 2014 Institute of Industrial Engineers. 3-2-55
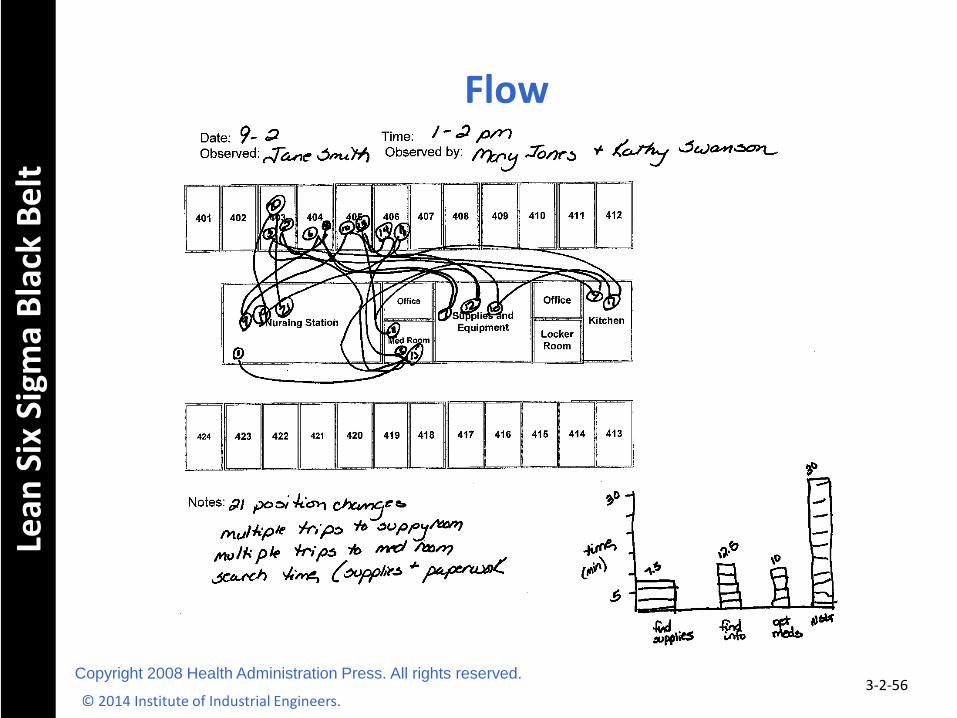
Lean
Six
Sig
ma
Bla
ck B
elt
Flow
© 2014 Institute of Industrial Engineers. 3-2-56
Copyright 2008 Health Administration Press. All rights reserved.
Lean
Six
Sig
ma
Bla
ck B
elt
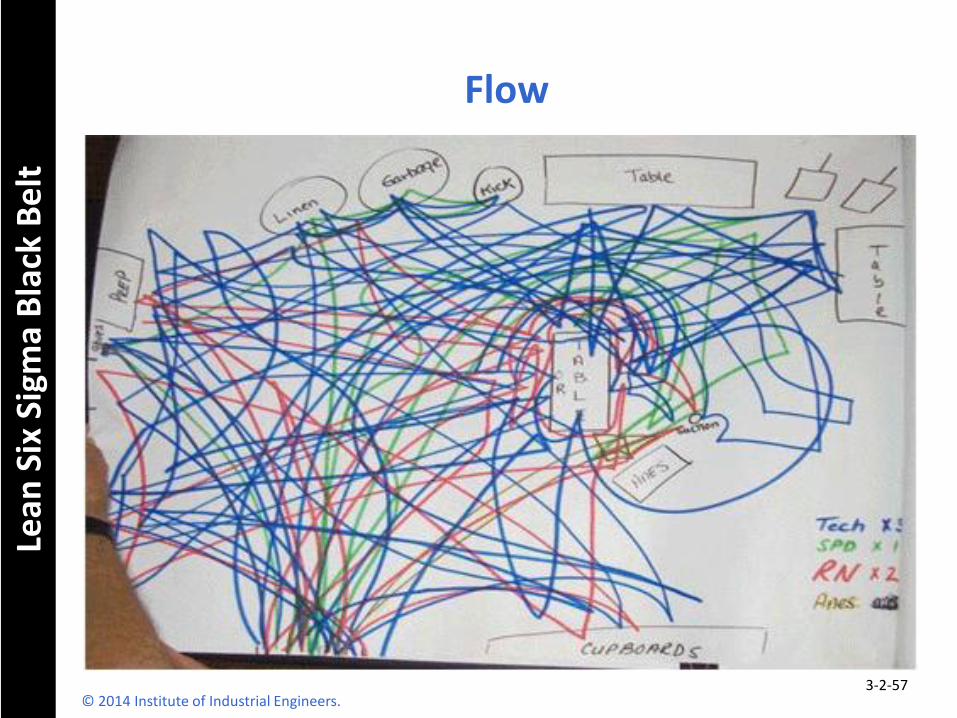
Flow
© 2014 Institute of Industrial Engineers. 3-2-57
Lean
Six
Sig
ma
Bla
ck B
elt
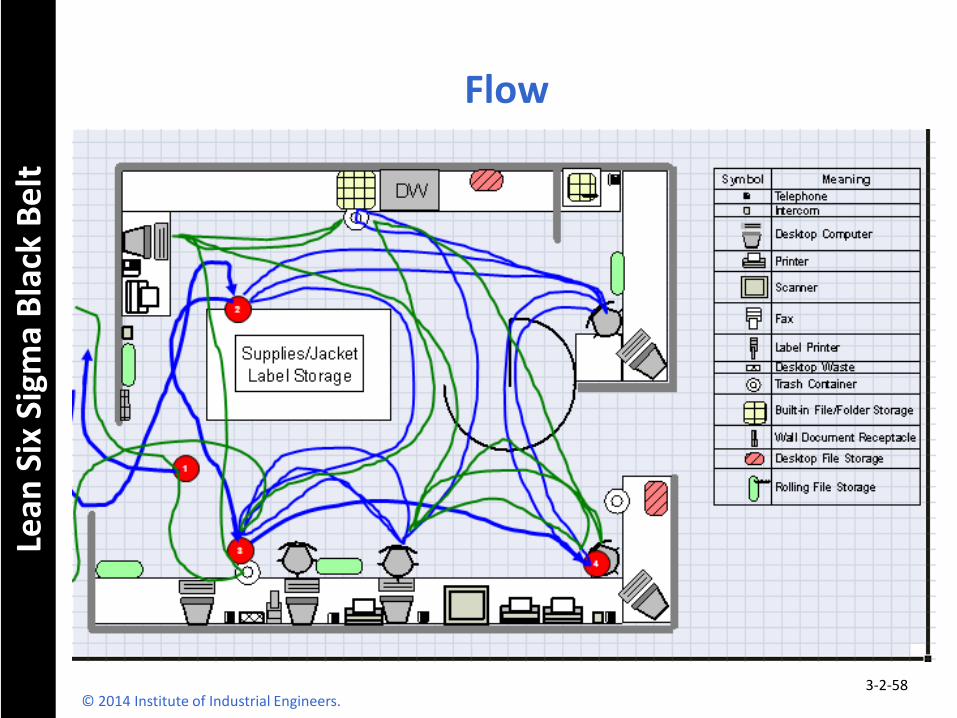
Flow
© 2014 Institute of Industrial Engineers. 3-2-58
Lean
Six
Sig
ma
Bla
ck B
elt
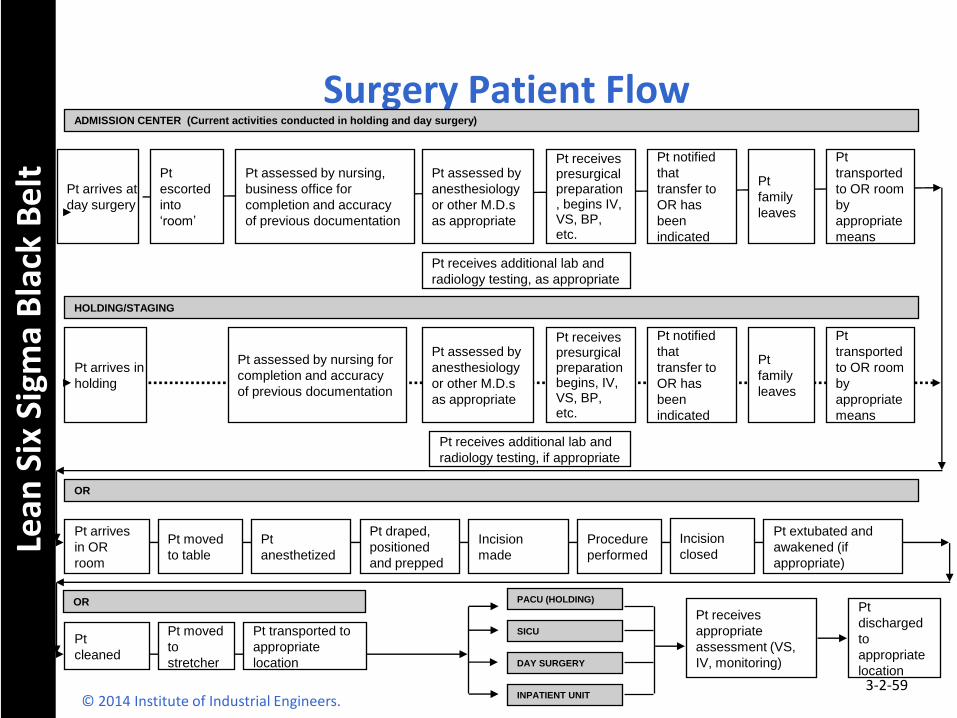
Surgery Patient Flow
© 2014 Institute of Industrial Engineers. 3-2-59
ADMISSION CENTER (Current activities conducted in holding and day surgery)
Pt arrives at
day surgery
Pt
escorted
into
‘room’
Pt assessed by nursing,
business office for
completion and accuracy
of previous documentation
Pt assessed by
anesthesiology
or other M.D.s
as appropriate
Pt receives presurgical preparation, begins IV, VS, BP, etc.
Pt receives additional lab and
radiology testing, as appropriate
Pt notified
that
transfer to
OR has
been
indicated
Pt
family
leaves
Pt
transported
to OR room
by
appropriate
means
HOLDING/STAGING
Pt arrives in
holding
Pt assessed by nursing for
completion and accuracy
of previous documentation
Pt assessed by
anesthesiology
or other M.D.s
as appropriate
Pt receives presurgical preparation begins, IV, VS, BP, etc.
Pt receives additional lab and
radiology testing, if appropriate
Pt notified
that
transfer to
OR has
been
indicated
Pt
family
leaves
Pt
transported
to OR room
by
appropriate
means
OR
Pt arrives
in OR
room
Pt moved
to table
Pt
anesthetized
Pt draped,
positioned
and prepped
Incision
made
Procedure
performed
Incision
closed
Pt extubated and
awakened (if
appropriate)
Pt
cleaned
Pt transported to
appropriate
location
Pt receives
appropriate
assessment (VS,
IV, monitoring)
Pt
discharged
to
appropriate
location
Pt moved
to
stretcher
PACU (HOLDING) OR
SICU
DAY SURGERY
INPATIENT UNIT
Lean
Six
Sig
ma
Bla
ck B
elt
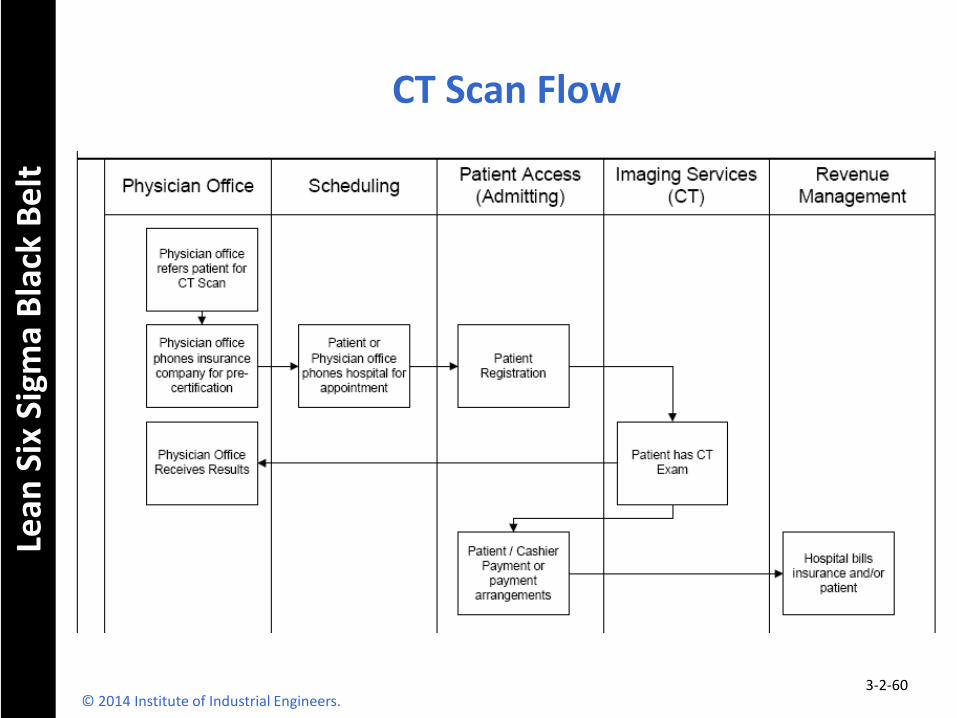
CT Scan Flow
© 2014 Institute of Industrial Engineers. 3-2-60
Lean
Six
Sig
ma
Bla
ck B
elt
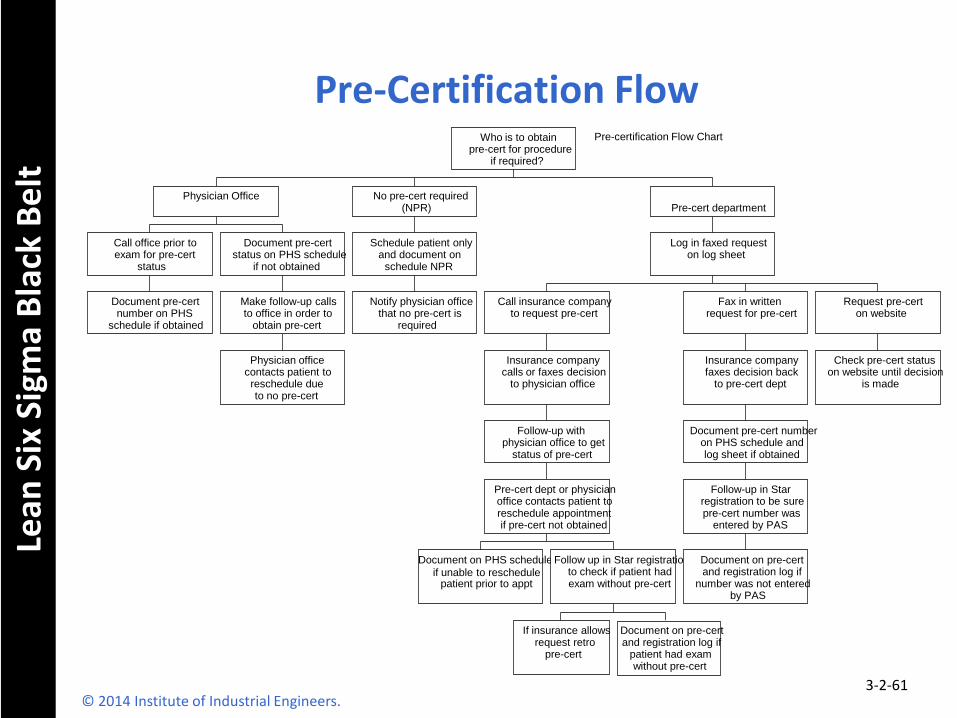
Pre-Certification Flow
© 2014 Institute of Industrial Engineers. 3-2-61
Pre-certification Flow Chart
Document pre-cert number on PHS
schedule if obtained
Call office prior to exam for pre-cert
status
Physician office contacts patient to reschedule due to no pre-cert
Make follow-up calls to office in order to
obtain pre-cert
Document pre-cert status on PHS schedule
if not obtained
Physician Office
Notify physician office that no pre-cert is
required
Schedule patient only and document on
schedule NPR
No pre-cert required (NPR)
Document on PHS schedule
if unable to reschedule patient prior to appt
If insurance allows request retro
pre-cert
Document on pre-cert and registration log if
patient had exam without pre-cert
Follow up in Star registration to check if patient had exam without pre-cert
Pre-cert dept or physician office contacts patient to reschedule appointment if pre-cert not obtained
Follow-up with physician office to get
status of pre-cert
Insurance company calls or faxes decision
to physician office
Call insurance company to request pre-cert
Document on pre-cert and registration log if
number was not entered by PAS
Follow-up in Star registration to be sure pre-cert number was
entered by PAS
Document pre-cert number on PHS schedule and log sheet if obtained
Insurance company faxes decision back
to pre-cert dept
Fax in written request for pre-cert
Check pre-cert status on website until decision
is made
Request pre-cert on website
Log in faxed request on log sheet
Pre-cert department
Who is to obtain pre-cert for procedure
if required?
Lean
Six
Sig
ma
Bla
ck B
elt
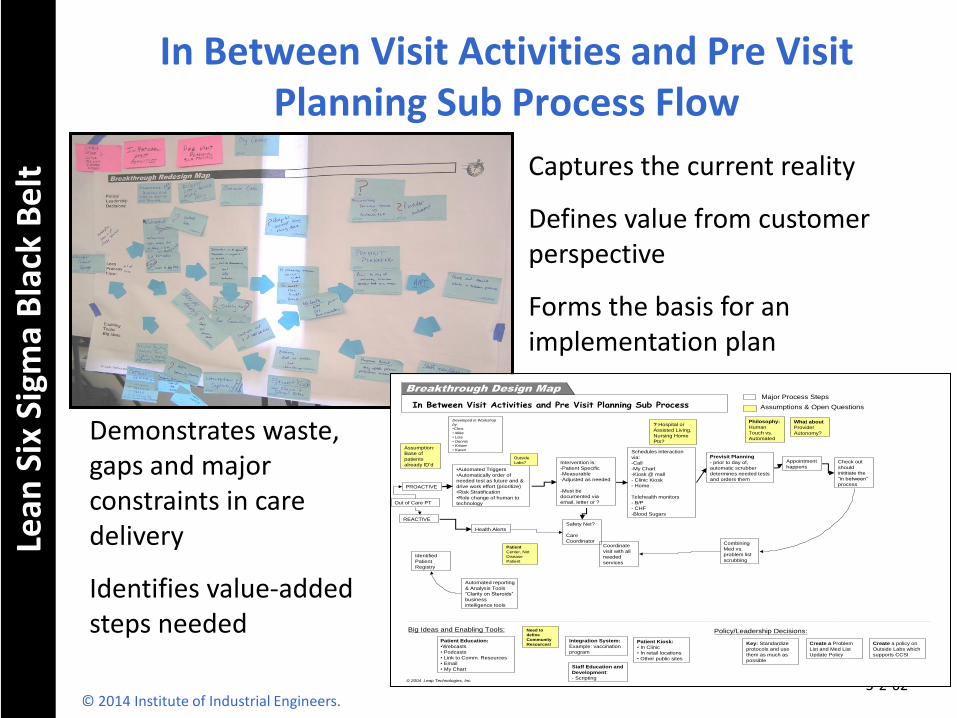
In Between Visit Activities and Pre Visit
Planning Sub Process Flow
© 2014 Institute of Industrial Engineers. 3-2-62
Breakthrough Design Map
© 2004 Leap Technologies, Inc.
In Between Visit Activities and Pre Visit Planning Sub Process
Big Ideas and Enabling Tools:
PROACTIVE
Schedules interaction
via:
-Call
-My Chart
-Kiosk @ mall
- Clinic Kiosk
- Home
Telehealth monitors
- B/P
- CHF
-Blood Sugars
•Automated Triggers
•Automatically order of
needed test as future and &
drive work effort (prioritize)
•Risk Stratification
•Role change of human to
technology
Intervention is:
-Patient Specific
-Measurable
-Adjusted as needed
-Must be
documented via
email, letter or ?
Previsit Planning
- prior to day of,
automatic scrubber
determines needed tests
and orders them
Major Process Steps
Assumptions & Open Questions
Assumption:
Base of
patients
already ID’d
Philosophy:
Human
Touch vs.
Automated
Outside
Labs? Appointment
happensCheck out
should
inititiate the
“in between”
process
Combining
Med vs.
problem list
scrubbing
Coordinate
visit with all
needed
services
Safety Net?
Care
Coordinator
Health Alerts
Developed in Workshop
by:
•Chris
• Mike
• Lisa
• Dennis
• Krister
• Karen
Identified
Patient
Registry
Automated reporting
& Analysis Tools
“Clarity on Steroids”
business
intelligence tools
Patient Education:
•Webcasts
• Podcasts
• Link to Comm. Resources
• My Chart
Patient
Center, Not
Disease
Patient
REACTIVE
What about
Provider
Autonomy?
Out of Care PT
Patient Kiosk:
• In Clinic
• In retail locations
• Other public sites
Integration System:
Example: vaccination
program
Staff Education and
Development:
- Scripting
Need to
define
Community
Resources!
Policy/Leadership Decisions:
Key: Standardize
protocols and use
them as much as
possible
Create a Problem
List and Med List
Update Policy
Create a policy on
Outside Labs which
supports CCSI
? Hospital or
Assisted Living,
Nursing Home
Pts?
Captures the current reality
Defines value from customer perspective
Forms the basis for an implementation plan
Demonstrates waste, gaps and major constraints in care delivery
Identifies value-added steps needed
Lean
Six
Sig
ma
Bla
ck B
elt
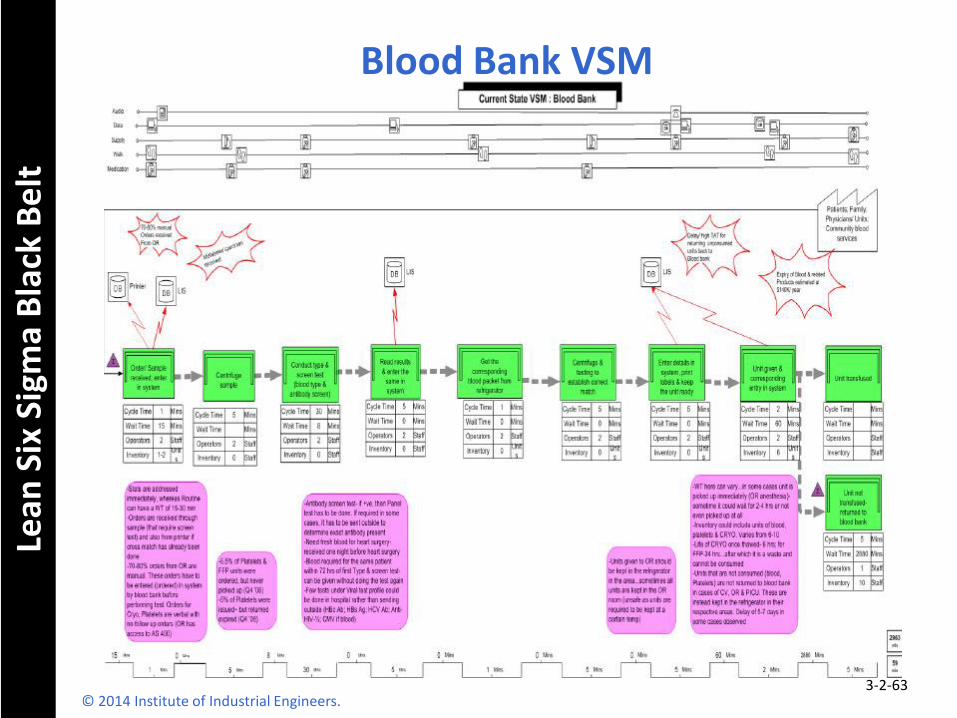
Blood Bank VSM
© 2014 Institute of Industrial Engineers. 3-2-63
Lean
Six
Sig
ma
Bla
ck B
elt
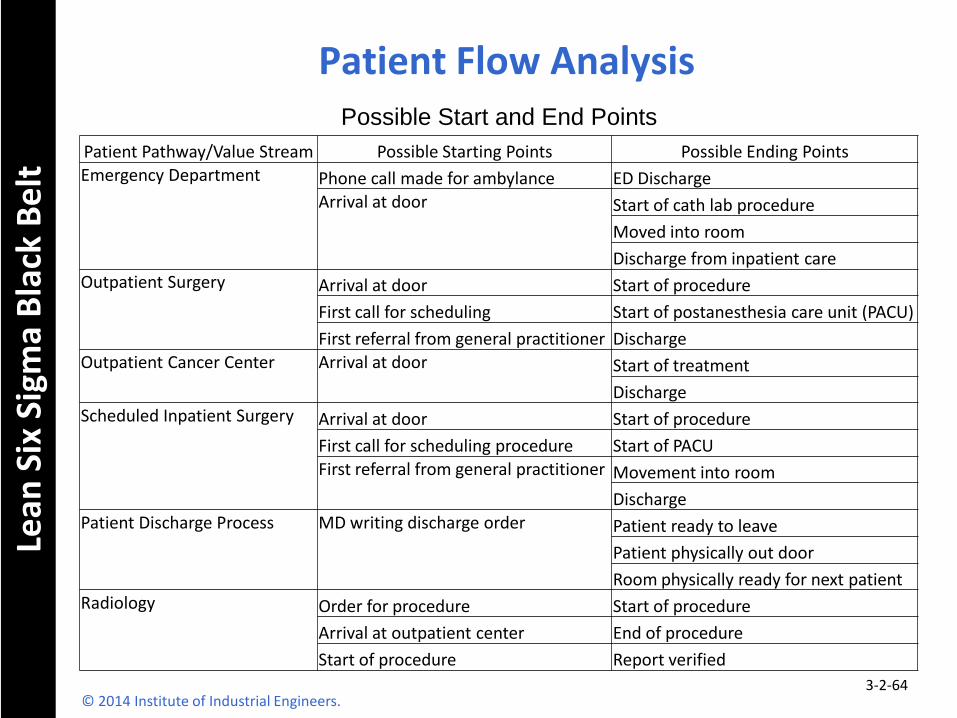
Patient Flow Analysis
© 2014 Institute of Industrial Engineers. 3-2-64
Patient Pathway/Value Stream Possible Starting Points Possible Ending Points
Emergency Department Phone call made for ambylance ED Discharge
Arrival at door Start of cath lab procedure
Moved into room
Discharge from inpatient care
Outpatient Surgery Arrival at door Start of procedure
First call for scheduling Start of postanesthesia care unit (PACU)
First referral from general practitioner Discharge
Outpatient Cancer Center Arrival at door Start of treatment
Discharge
Scheduled Inpatient Surgery Arrival at door Start of procedure
First call for scheduling procedure Start of PACU
First referral from general practitioner Movement into room
Discharge
Patient Discharge Process MD writing discharge order Patient ready to leave
Patient physically out door
Room physically ready for next patient
Radiology Order for procedure Start of procedure
Arrival at outpatient center End of procedure
Start of procedure Report verified
Possible Start and End Points
Lean
Six
Sig
ma
Bla
ck B
elt
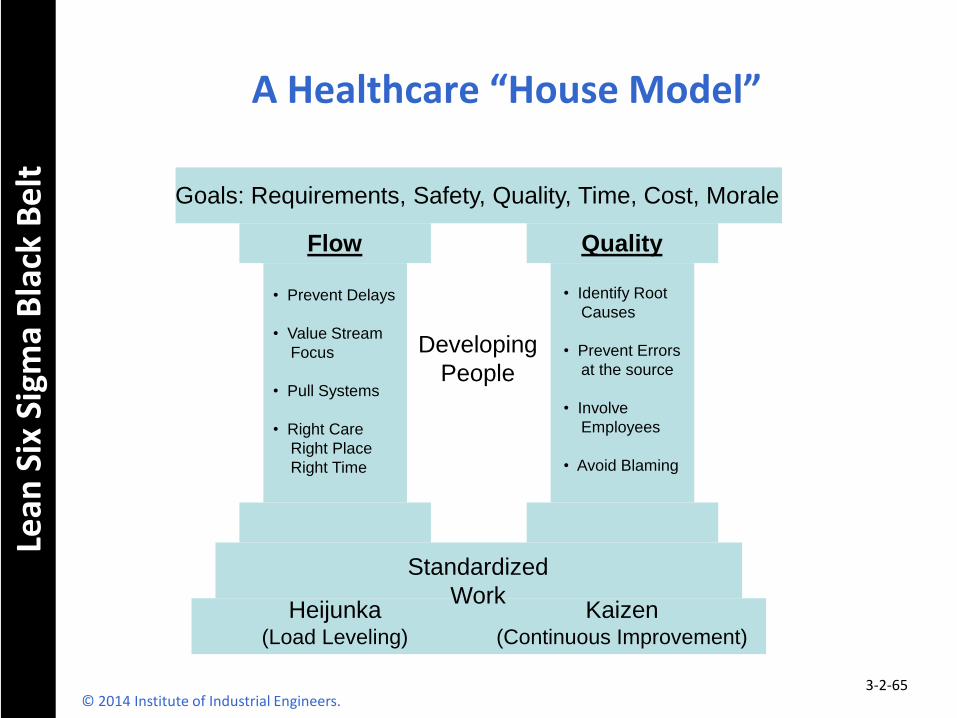
A Healthcare “House Model”
© 2014 Institute of Industrial Engineers. 3-2-65
Flow Quality
Goals: Requirements, Safety, Quality, Time, Cost, Morale
Heijunka (Load Leveling)
Kaizen (Continuous Improvement)
Standardized
Work
Developing
People
• Prevent Delays
• Value Stream
Focus
• Pull Systems
• Right Care
Right Place
Right Time
• Identify Root
Causes
• Prevent Errors
at the source
• Involve
Employees
• Avoid Blaming
Lean
Six
Sig
ma
Bla
ck B
elt
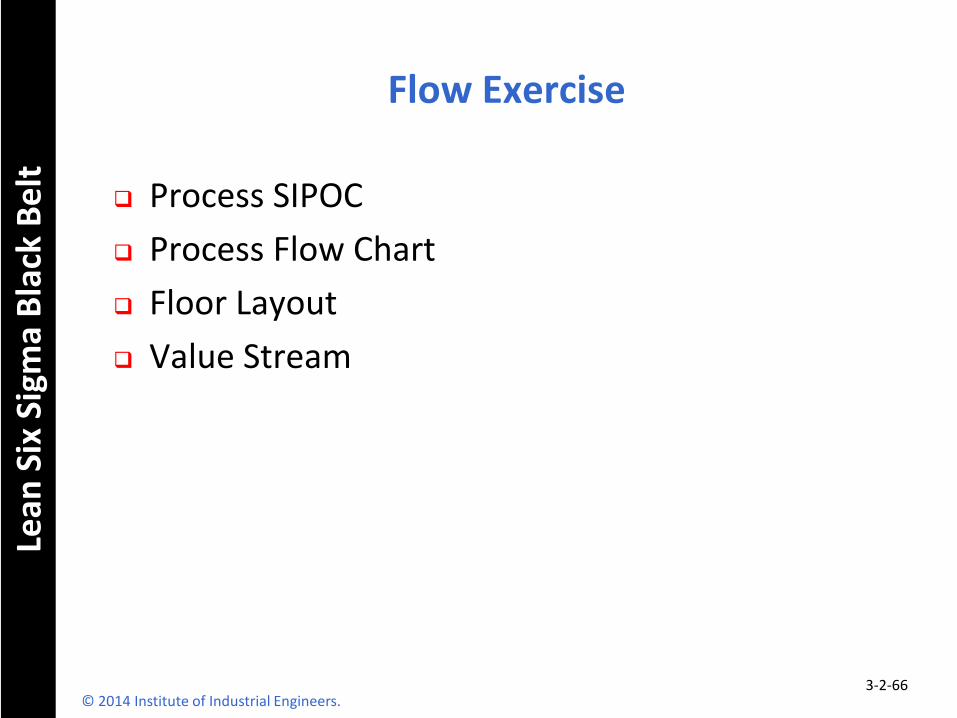
Flow Exercise
Process SIPOC
Process Flow Chart
Floor Layout
Value Stream
© 2014 Institute of Industrial Engineers. 3-2-66
Lean
Six
Sig
ma
Bla
ck B
elt
Closing thoughts on VSM and Flow?
© 2014 Institute of Industrial Engineers. 3-2-67