Embed Size (px)
Citation preview

November 2015
Six Sigma and Statistical Tools

2 September 2015
• Lean Six Sigma
• What is Six Sigma?
• Understanding Six Sigma
• DMAIC Process
• Statistical Tools
Agenda

3 September 2015
Lean Six Sigma is a methodology which combines process speed with
quality.
Lean focuses on speed and emphasizes reducing the amount of time
between activities, events, and cycles. Lean eliminates waste found in a
process.
Six Sigma is a methodology which focuses on reducing the number of
errors in a process by identifying and reducing variation.
Ideally, Lean and Six Sigma are utilized together. After all, what good is it
to complete a process quickly if the information is incorrectly entered?!
Lean Six Sigma
4 September 2015
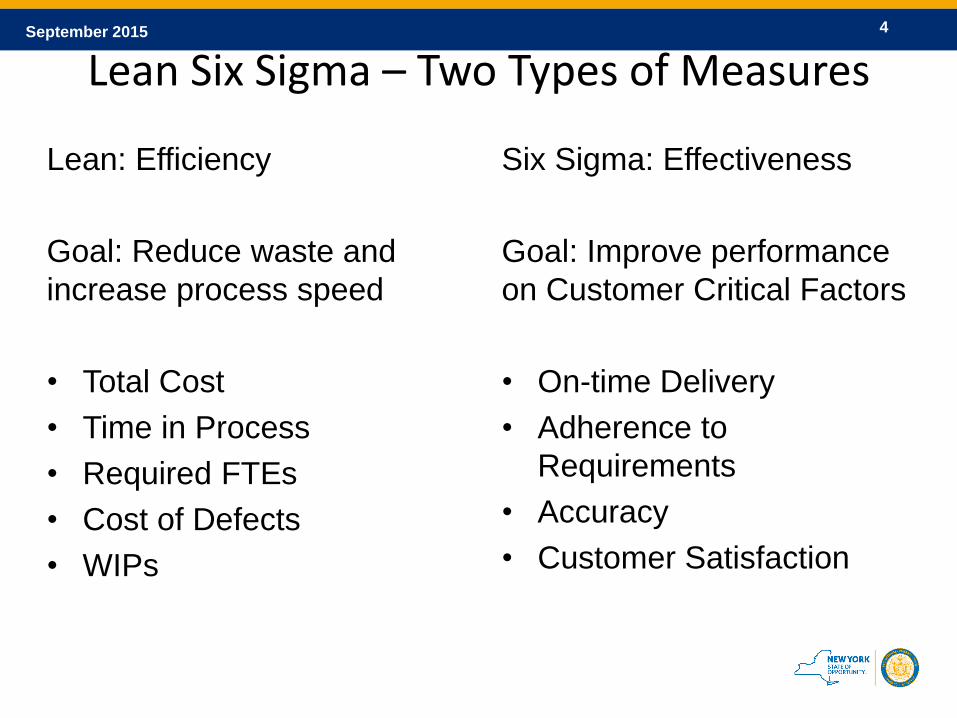
Lean: Efficiency
Goal: Reduce waste and
increase process speed
• Total Cost
• Time in Process
• Required FTEs
• Cost of Defects
• WIPs
Lean Six Sigma – Two Types of Measures
Six Sigma: Effectiveness
Goal: Improve performance
on Customer Critical Factors
• On-time Delivery
• Adherence to
Requirements
• Accuracy
• Customer Satisfaction

5 September 2015
• It is a methodology for continuous improvement.
• It is a methodology for creating products/processes that
perform at high standards
• It is a set of statistical and other quality tools
• It is a way of understanding where you are, where you
want to be, and how to get there
What is Six Sigma?

6 September 2015
Four Ways to Look at Six Sigma
1. Statistical Meaning
2. Practical Meaning
3. Business Philosophy
4. Problem Solving Methodology
Six Sigma
7 September 2015
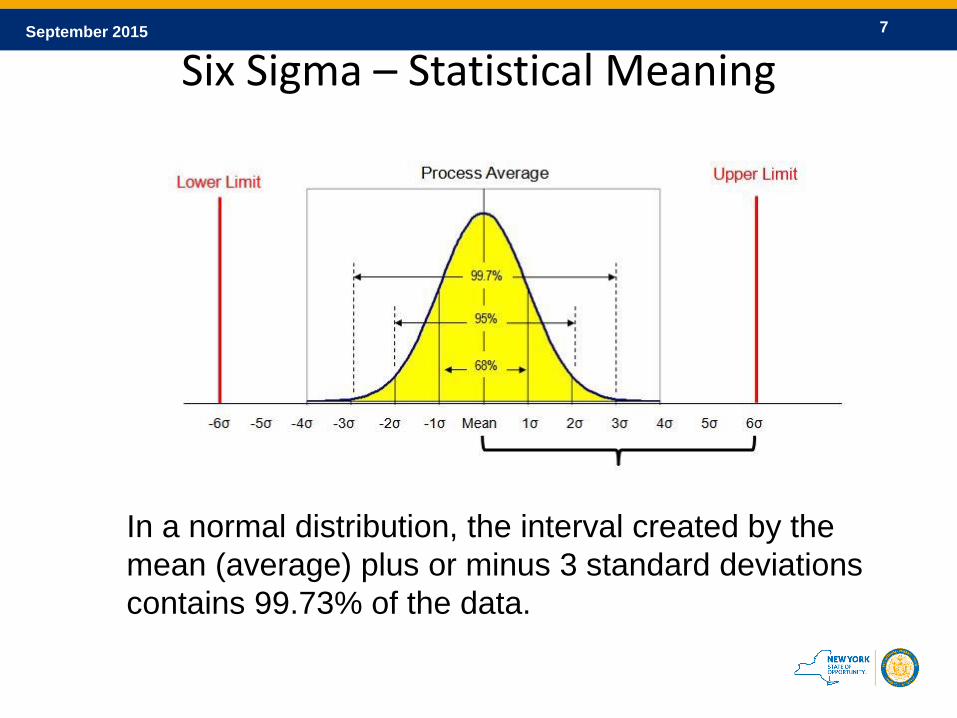
In a normal distribution, the interval created by the
mean (average) plus or minus 3 standard deviations
contains 99.73% of the data.
Six Sigma – Statistical Meaning
8 September 2015
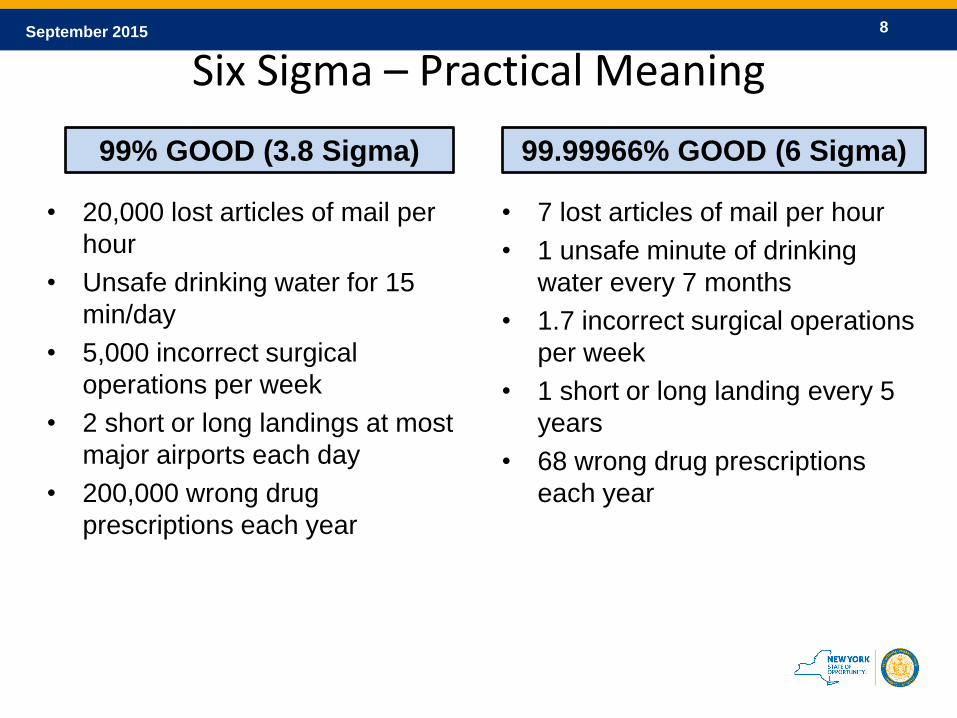
• 20,000 lost articles of mail per
hour
• Unsafe drinking water for 15
min/day
• 5,000 incorrect surgical
operations per week
• 2 short or long landings at most
major airports each day
• 200,000 wrong drug
prescriptions each year
Six Sigma – Practical Meaning
• 7 lost articles of mail per hour
• 1 unsafe minute of drinking
water every 7 months
• 1.7 incorrect surgical operations
per week
• 1 short or long landing every 5
years
• 68 wrong drug prescriptions
each year
99% GOOD (3.8 Sigma) 99.99966% GOOD (6 Sigma)
9 September 2015
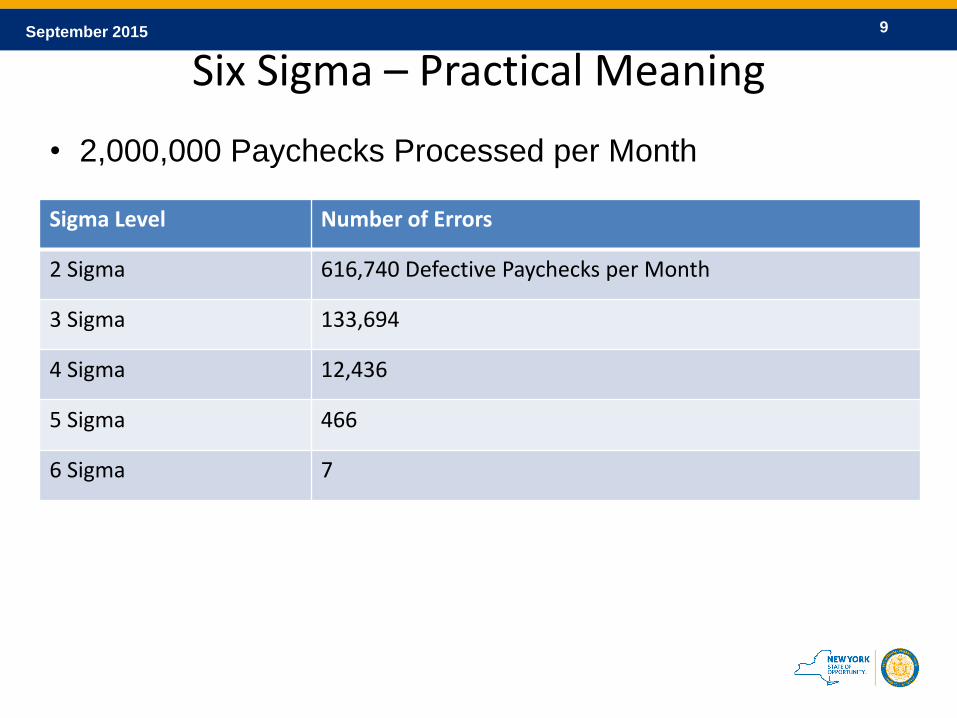
Sigma Level Number of Errors
2 Sigma 616,740 Defective Paychecks per Month
3 Sigma 133,694
4 Sigma 12,436
5 Sigma 466
6 Sigma 7
Six Sigma – Practical Meaning
• 2,000,000 Paychecks Processed per Month
10 September 2015
• Customer Focused
• Customer Defines Quality
• Variability is the Enemy – Get it right the first time
• Act on Fact – Make data driven decisions
• Measure – What you can’t/don’t measure, you don’t know
or understand
• Invest in Employees
Six Sigma – Business Philosophy
Six Sigma Begins and Ends with the Customer!!!

11 September 2015
DMAIC Methodology for Problem Solving
Six Sigma – Problem Solving Methodology
Define Measure Analyze Improve Control
• DEFINE: Project purpose and scope
• MEASURE: Current performance
• ANALYZE: Root cause & propose solution set
• IMPROVE: By removing variation and non-value added
activities
• CONTROL: The gains into the Future

12 September 2015
Purpose: Define business problem and opportunity; Lay the
ground work for the project
Key Tools:
• Charter
– Problem Statement
– Goal - SMART
– In Scope / Out of Scope
– Team Members
• Project Plan – VSM, Kaizen, Implementation
• Value Stream Mapping
• Potential Project Impact
Define

13 September 2015
Purpose: Measure the problem, assess process
performance
Key Tools:
• Data Collection
• Voice of Customer
• Fishbone Diagram
• FMEA
• Graphical Representation
• Revised Value Stream Map
• Just-Do-Its
Measure
14 September 2015
Analyze
Purpose: Often intertwined with the Measure Phase, the
purpose of the Analyze Phase is to understand the data
Key Tools:
• Data Analysis
• Value Add Analysis – Looking at the process through the
customer’s eyes
• Root Cause Analysis – Understand and verify the cause of
the problem
• Value Stream Mapping (Future State)

15 September 2015
Improve
Purpose: Develop Solutions to improve process capability
and compare the results to the baseline performance. Often
times the Improve phase includes a pilot.
Key Tools:
• Waste Elimination (5S)
• Poka-Yoke – Mistake Proofing
• Standardized Operating Procedures
• Training
• Documented Improvement or Action Plan

16 September 2015
Control
Purpose: Roll out solution, execute control plan and
transition to process owners. This ensures that any gains
and improvements will be sustained after the Empire Belt has
moved on to another project.
Key Tools:
• Training
• Improvement Plan
• Control Plan
• Celebrate Success!

17 September 2015
1. FMEA
2. Bar Charts
3. Histograms
4. Pareto Charts
5. Variance and Control Charts
Six Sigma Tools

18 September 2015
• Identify the ways in which a product or process could
potentially fail
• Estimate the risk associated with causes
• Prioritize the actions to reduce the risk
• Evaluate the current control plan
• Improve the process in a preemptive manner
• Prioritize Resources to ensure process improvement
efforts are beneficial
Failure Mode Effect Analysis

19 September 2015
• Define/Measure – To develop ways in which a process
could fail
• Analyze – To determine root cause and develop potential
solutions
• Improve/Control – Evaluate improvement plan
When to Use FEMA

20 September 2015
1. Identify Process Element – What process step is creating
the most defects?
2. Identify Failure Mode – Manner in which a desired result
is not achieved
3. Identify the Failure Effect – What is the effect on the
process?
4. Identify Failure Cause – What brought about failure
mode?
5. Identify Control Factors – What can be put in place to
prevent the failure?
FMEA Steps

21 September 2015
Purpose: Used for direct comparison of magnitude for
descriptively labeled categories.
How to Make: Separate data into groups (e.g. stratifications
from your data collection plan. Plot groups on the horizontal
axis and counts on the vertical axis.
Questions Answered: How do various groups compare to
one another
Bar Charts

22 September 2015
Bar Charts
Stacked Bar Chart – Shows the
relationship of individual items
to the whole.
Clustered Bar or Clustered Column

23 September 2015
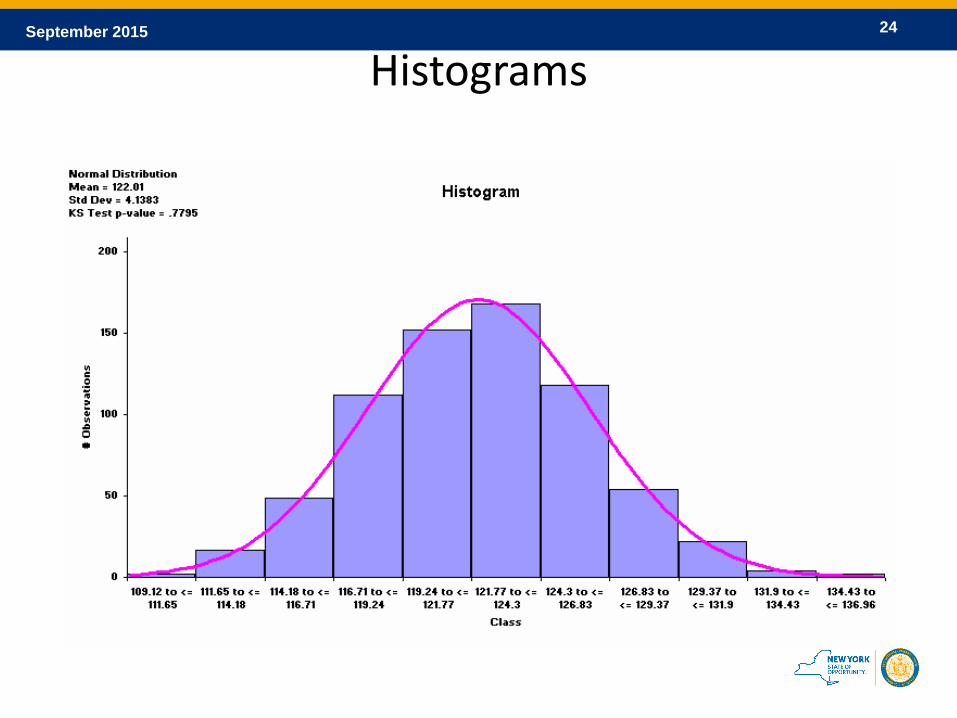
Purpose: Used to display the distribution of a data set.
How to Make:
Divide the data into equally sized groups.
Group Size = (highest – lowest) / number of groups
Plot frequency on vertical axis.
Questions Answered:
• What is the most common system response?
• What distribution does the data have?
• Is the data symmetric or skewed?
• Does the data contain outliers?
Histograms
24 September 2015
Histograms

25 September 2015
Pareto Chart
Purpose: Used to focus efforts on problems that have the
greatest potential for improvement.
How to Make: Order the categories from highest to lowest
(represented by bars). A line graph is used to represent the
cumulative total.
Questions Answered:
• What are the largest issues facing our team or business?
• What 20% of sources are responsible for 80% of the
problem (80/20 Rule)?
• Where should we focus our efforts to achieve the greatest
improvements?

26 September 2015
Pareto Chart
27 September 2015
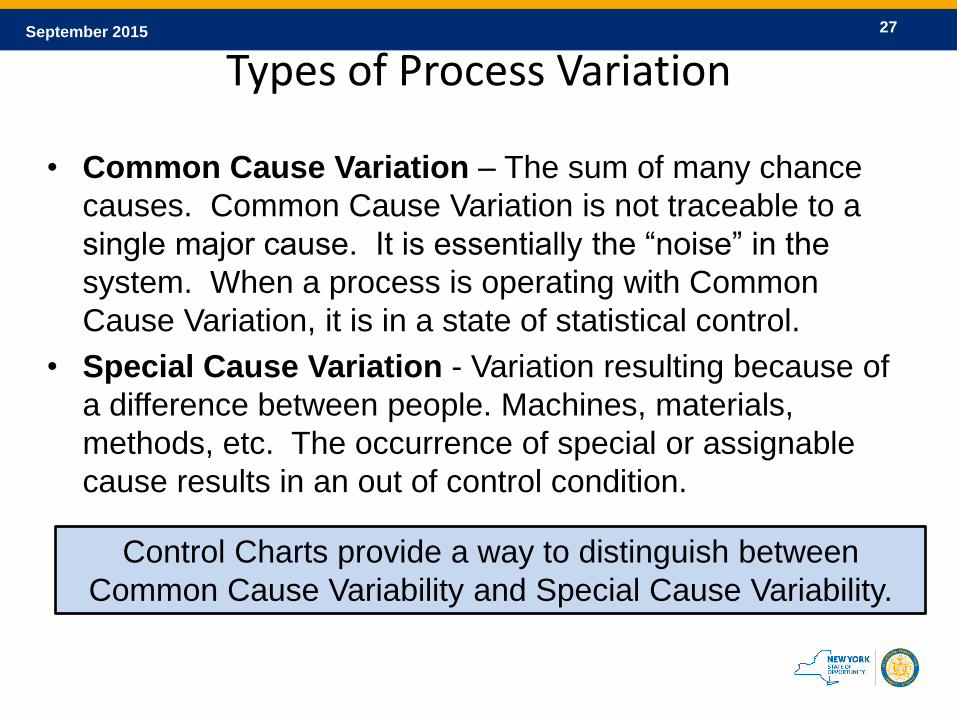
• Common Cause Variation – The sum of many chance
causes. Common Cause Variation is not traceable to a
single major cause. It is essentially the “noise” in the
system. When a process is operating with Common
Cause Variation, it is in a state of statistical control.
• Special Cause Variation - Variation resulting because of
a difference between people. Machines, materials,
methods, etc. The occurrence of special or assignable
cause results in an out of control condition.
Types of Process Variation
Control Charts provide a way to distinguish between
Common Cause Variability and Special Cause Variability.

28 September 2015
Control Chart
Common Cause Variation
Special Cause
Variation

29 September 2015
Q u e s t i o n s ?