Embed Size (px)
Citation preview
THE SCOTTISH DIET: IT NEEDS TO CHANGE 2018 UPDATE1
Situation Report:
The Scottish Diet:It needs to change 2018 update
foodstandards.gov.scot
THE SCOTTISH DIET: IT NEEDS TO CHANGE 2018 UPDATE2
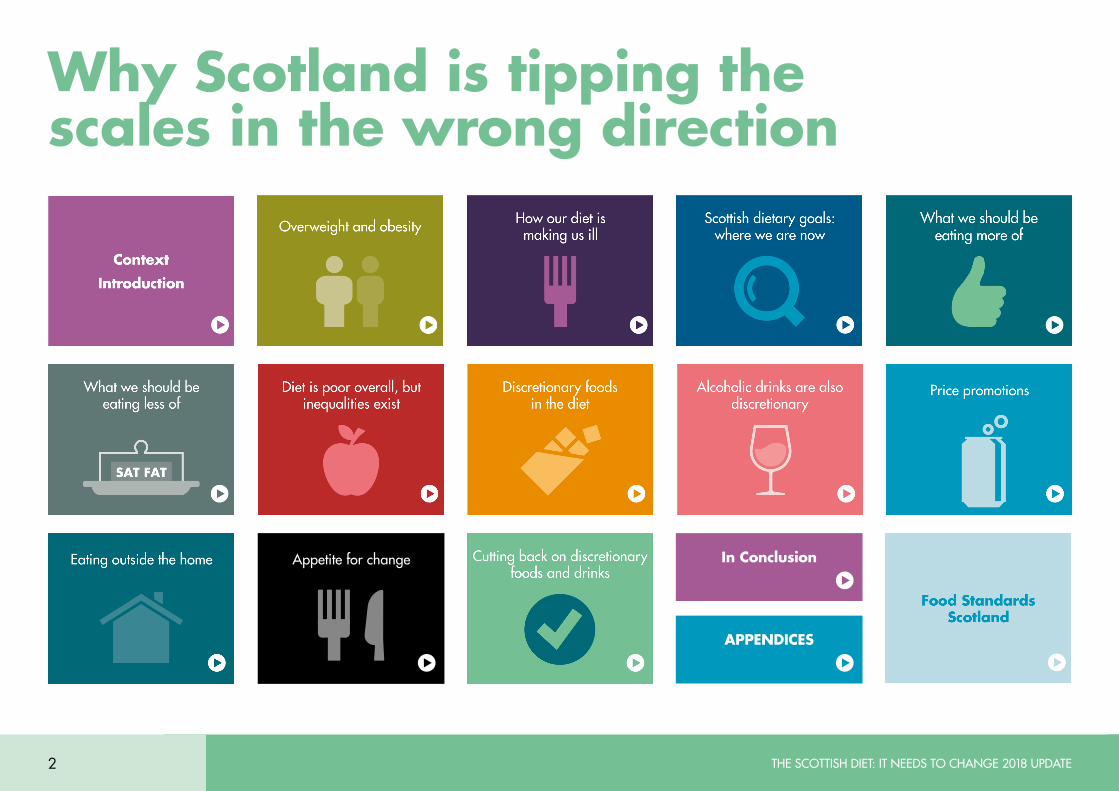
Why Scotland is tipping the scales in the wrong direction
Appetite for change
APPENDICES
In Conclusion
THE SCOTTISH DIET: IT NEEDS TO CHANGE 2018 UPDATE 3
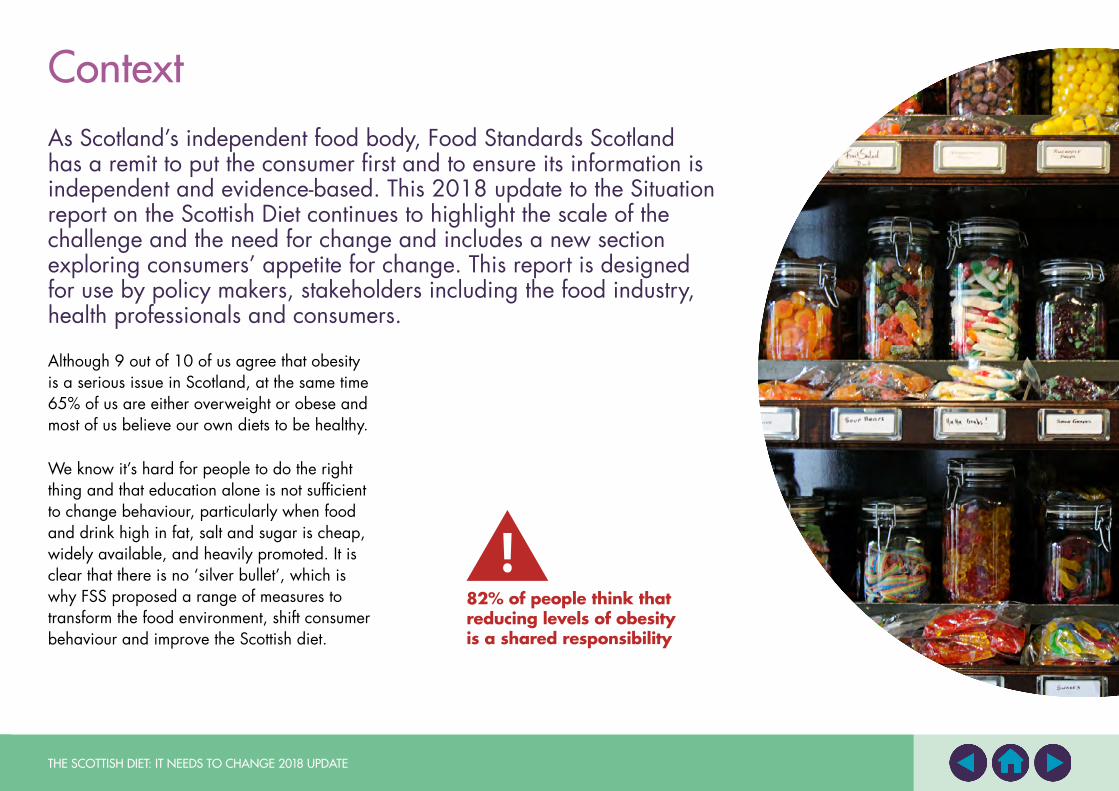
ContextAs Scotland’s independent food body, Food Standards Scotland has a remit to put the consumer first and to ensure its information is independent and evidence-based. This 2018 update to the Situation report on the Scottish Diet continues to highlight the scale of the challenge and the need for change and includes a new section exploring consumers’ appetite for change. This report is designed for use by policy makers, stakeholders including the food industry, health professionals and consumers.
Although 9 out of 10 of us agree that obesity is a serious issue in Scotland, at the same time 65% of us are either overweight or obese and most of us believe our own diets to be healthy.
We know it’s hard for people to do the right thing and that education alone is not sufficient to change behaviour, particularly when food and drink high in fat, salt and sugar is cheap, widely available, and heavily promoted. It is clear that there is no ‘silver bullet’, which is why FSS proposed a range of measures to transform the food environment, shift consumer behaviour and improve the Scottish diet.
82% of people think that reducing levels of obesity is a shared responsibility
THE SCOTTISH DIET: IT NEEDS TO CHANGE 2018 UPDATE4
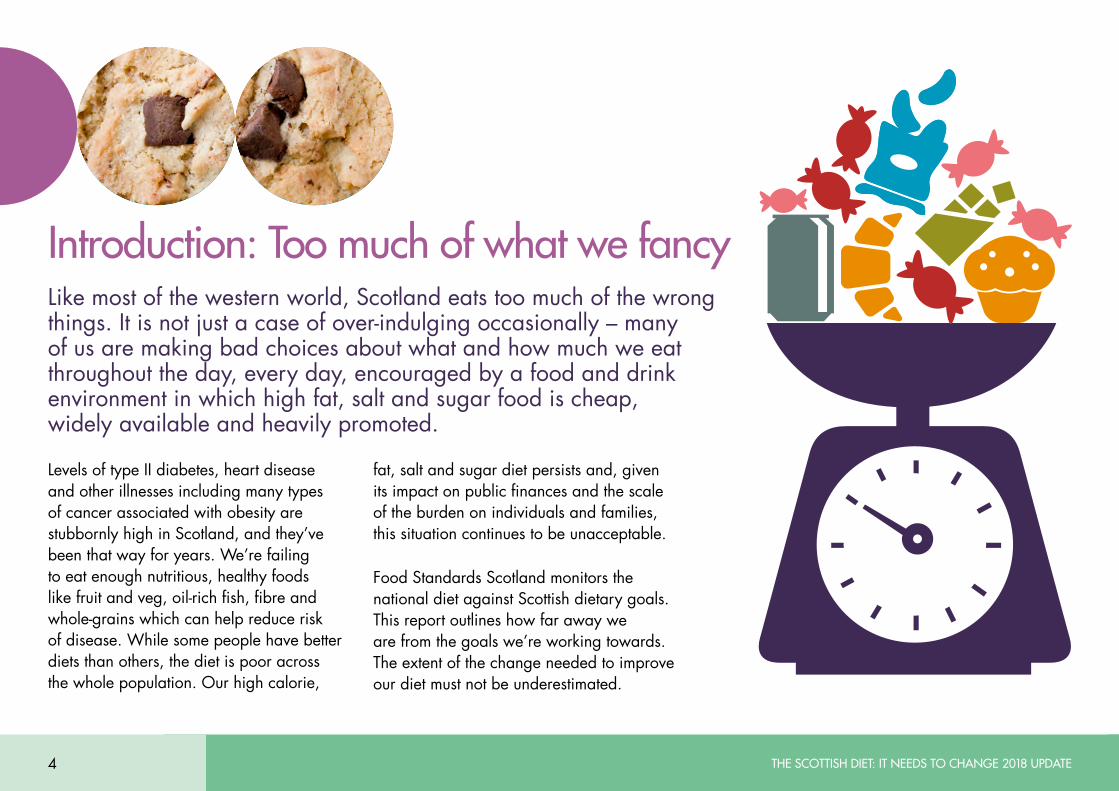
Introduction: Too much of what we fancyLike most of the western world, Scotland eats too much of the wrong things. It is not just a case of over-indulging occasionally – many of us are making bad choices about what and how much we eat throughout the day, every day, encouraged by a food and drink environment in which high fat, salt and sugar food is cheap, widely available and heavily promoted.
Levels of type II diabetes, heart disease and other illnesses including many types of cancer associated with obesity are stubbornly high in Scotland, and they’ve been that way for years. We’re failing to eat enough nutritious, healthy foods like fruit and veg, oil-rich fish, fibre and whole-grains which can help reduce risk of disease. While some people have better diets than others, the diet is poor across the whole population. Our high calorie,
fat, salt and sugar diet persists and, given its impact on public finances and the scale of the burden on individuals and families, this situation continues to be unacceptable.
Food Standards Scotland monitors the national diet against Scottish dietary goals. This report outlines how far away we are from the goals we’re working towards. The extent of the change needed to improve our diet must not be underestimated.
THE SCOTTISH DIET: IT NEEDS TO CHANGE 2018 UPDATE 5
The Scottish diet remains too high in calories, fats, sugar and salt, and too low in fibre, fruit and veg, and other healthy foods like oil-rich fish.
Our poor diet is deep-rooted and hasn’t changed significantly in the last seventeen years.
Poor diet exists across all socio-economic groups but the most deprived tend to have the poorest diets.
Discretionary foods and drinks,1 including alcohol, are high in calories, low in nutritional value and are not necessary for our health. They tend to be heavily promoted and represent an unhealthy proportion of our overall diet.
It’s essential that we reduce the consumption of discretionary foods and drinks if we are to make significant and measurable improvements to diet and health.
1Discretionaryfoodsanddrinksinthisreportinclude:confectionery,cakes,biscuits,pastries,savourysnacksandsugarydrinks
Our diet – at a glance
THE SCOTTISH DIET: IT NEEDS TO CHANGE 2018 UPDATE6
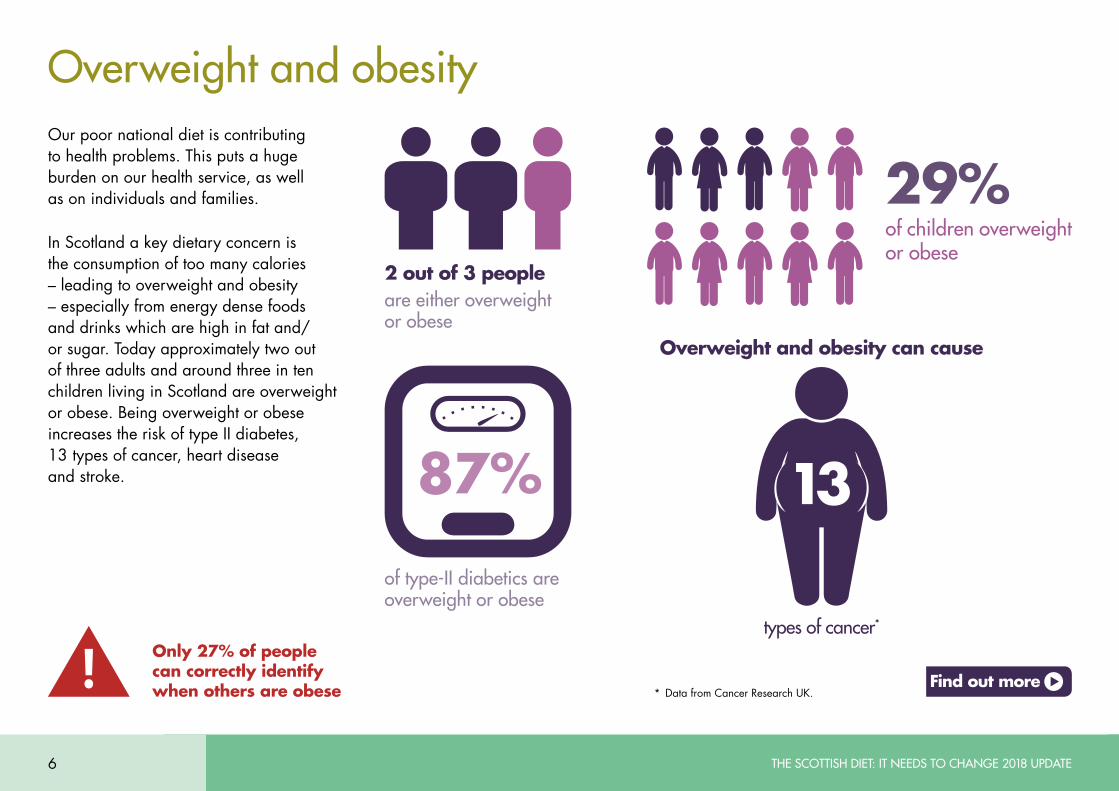
Overweight and obesityOur poor national diet is contributing to health problems. This puts a huge burden on our health service, as well as on individuals and families.
In Scotland a key dietary concern is the consumption of too many calories – leading to overweight and obesity – especially from energy dense foods and drinks which are high in fat and/or sugar. Today approximately two out of three adults and around three in ten children living in Scotland are overweight or obese. Being overweight or obese increases the risk of type II diabetes, 13 types of cancer, heart disease and stroke.
Only 27% of people can correctly identify when others are obese
are either overweight or obese
2 out of 3 people
Overweight and obesity can cause
types of cancer*
of type-II diabetics are overweight or obese
87%
* DatafromCancerResearchUK.
of children overweight or obese
29%
13
Find out more
THE SCOTTISH DIET: IT NEEDS TO CHANGE 2018 UPDATE 7
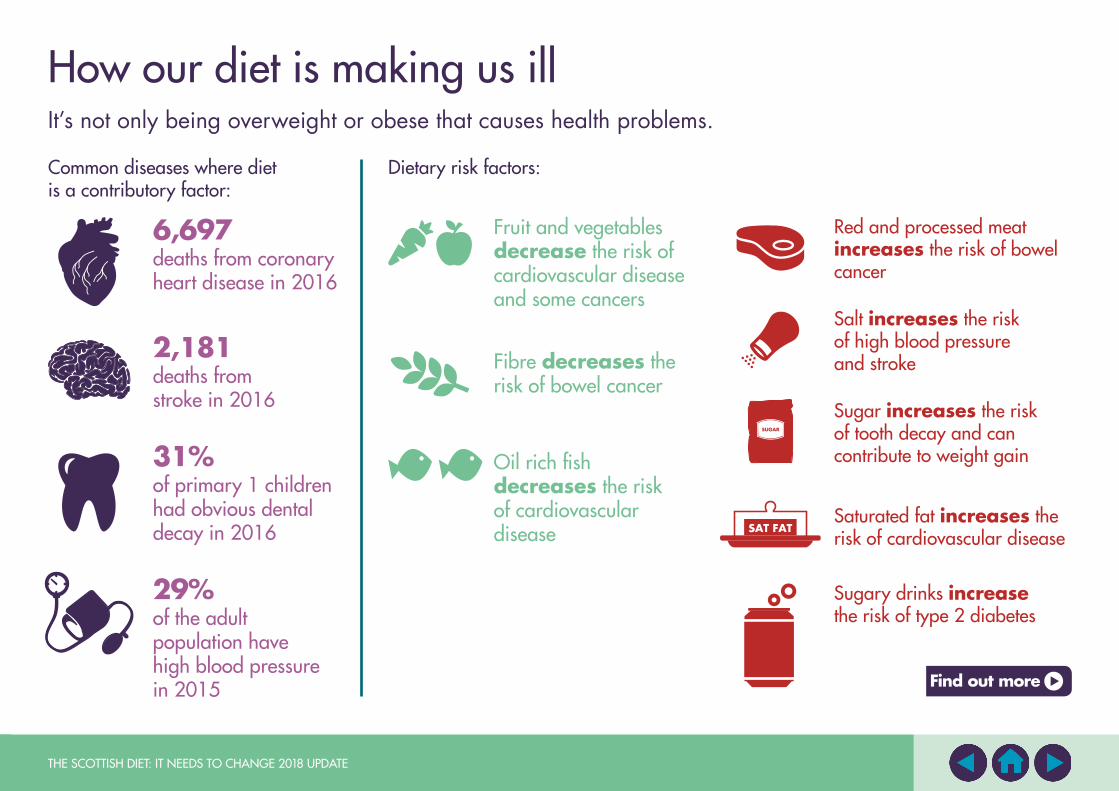
How our diet is making us illIt’s not only being overweight or obese that causes health problems.
deaths from coronary heart disease in 2016
deaths from stroke in 2016
of primary 1 children had obvious dental decay in 2016
of the adult population have high blood pressure in 2015
6,697
2,181
31%
29%
Salt increases the risk of high blood pressure and stroke
Sugar increases the risk of tooth decay and can contribute to weight gain
Saturated fat increases the risk of cardiovascular disease
Sugary drinks increase the risk of type 2 diabetes
Red and processed meat increases the risk of bowel cancer
Fruit and vegetables decrease the risk of cardiovascular disease and some cancers
Fibre decreases the risk of bowel cancer
Oil rich fish decreases the risk of cardiovascular disease
Common diseases where diet is a contributory factor:
Dietary risk factors:
Find out more
THE SCOTTISH DIET: IT NEEDS TO CHANGE 2018 UPDATE8
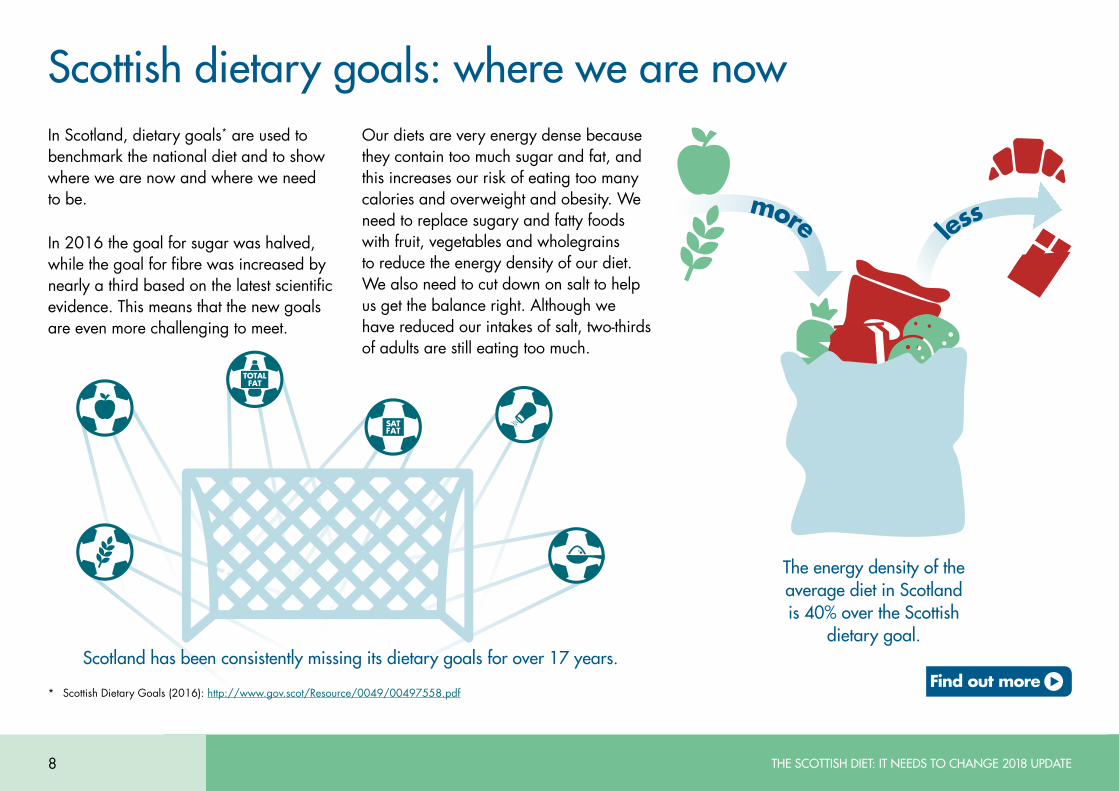
Scottish dietary goals: where we are nowIn Scotland, dietary goals* are used to benchmark the national diet and to show where we are now and where we need to be.
In 2016 the goal for sugar was halved, while the goal for fibre was increased by nearly a third based on the latest scientific evidence. This means that the new goals are even more challenging to meet.
The energy density of the average diet in Scotland is 40% over the Scottish
dietary goal.
more less
Our diets are very energy dense because they contain too much sugar and fat, and this increases our risk of eating too many calories and overweight and obesity. We need to replace sugary and fatty foods with fruit, vegetables and wholegrains to reduce the energy density of our diet. We also need to cut down on salt to help us get the balance right. Although we have reduced our intakes of salt, two-thirds of adults are still eating too much.
Scotland has been consistently missing its dietary goals for over 17 years.
* Scottish Dietary Goals (2016): http://www.gov.scot/Resource/0049/00497558.pdfFind out more
THE SCOTTISH DIET: IT NEEDS TO CHANGE 2018 UPDATE 9
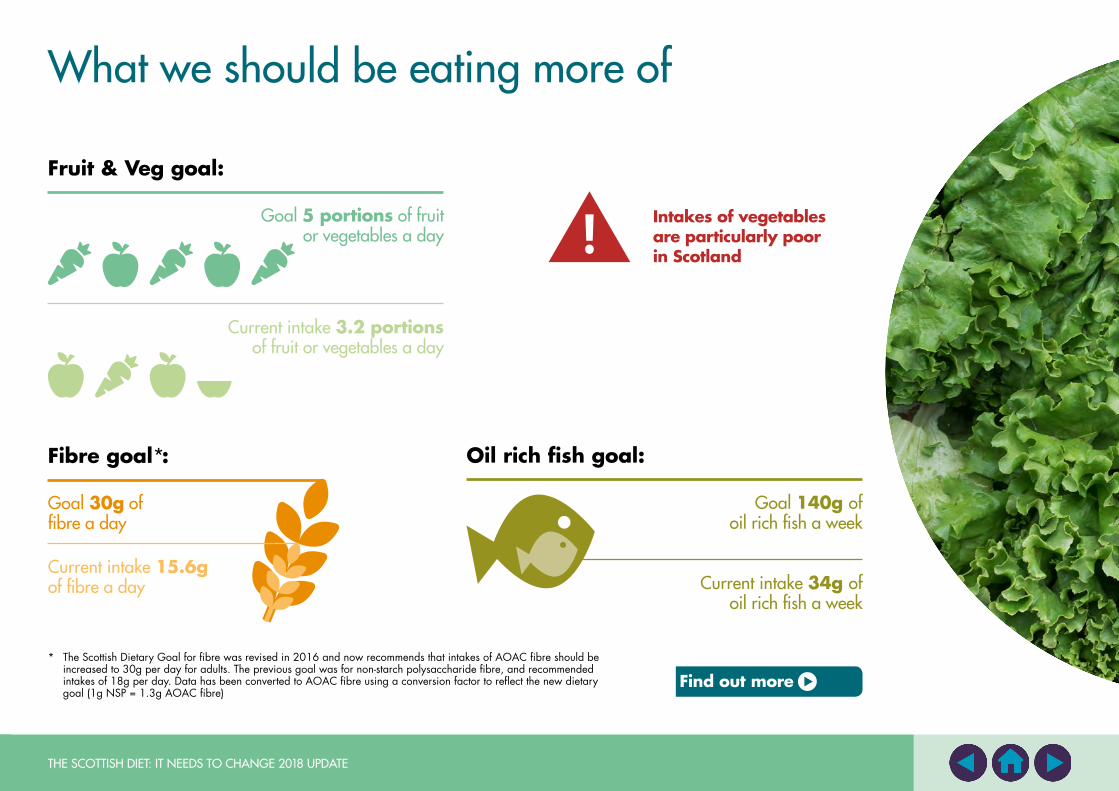
What we should be eating more of
* The Scottish Dietary Goal for fibre was revised in 2016 and now recommends that intakes of AOAC fibre should be increased to 30g per day for adults. The previous goal was for non-starch polysaccharide fibre, and recommended intakes of 18g per day. Data has been converted to AOAC fibre using a conversion factor to reflect the new dietary goal (1g NSP = 1.3g AOAC fibre)
Fruit & Veg goal:
Goal 30g of fibre a day
Current intake 15.6g of fibre a day
Fibre goal*:
Goal 5 portions of fruit or vegetables a day
Intakes of vegetables are particularly poor in Scotland
Current intake 3.2 portions of fruit or vegetables a day
Oil rich fish goal:
Goal 140g ofoil rich fish a week
Current intake 34g of oil rich fish a week
Find out more
THE SCOTTISH DIET: IT NEEDS TO CHANGE 2018 UPDATE10
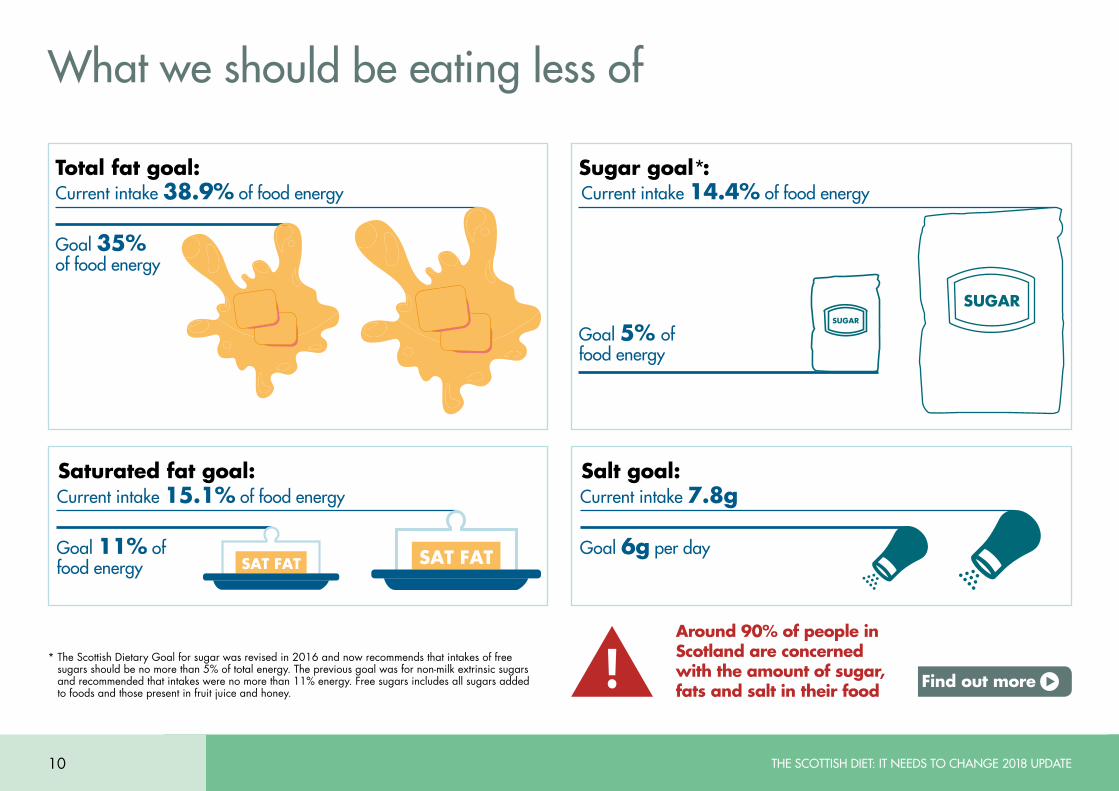
What we should be eating less of
Around 90% of people in Scotland are concerned with the amount of sugar, fats and salt in their food
* The Scottish Dietary Goal for sugar was revised in 2016 and now recommends that intakes of free sugars should be no more than 5% of total energy. The previous goal was for non-milk extrinsic sugars and recommended that intakes were no more than 11% energy. Free sugars includes all sugars added to foods and those present in fruit juice and honey.
Total fat goal: Sugar goal*:Current intake 38.9% of food energy
Goal 35% of food energy
Current intake 14.4% of food energy
Goal 5% of food energy
Saturated fat goal:Current intake 15.1% of food energy
Goal 11% of food energy
Salt goal:Current intake 7.8g
Goal 6g per day
Find out more
THE SCOTTISH DIET: IT NEEDS TO CHANGE 2018 UPDATE 11
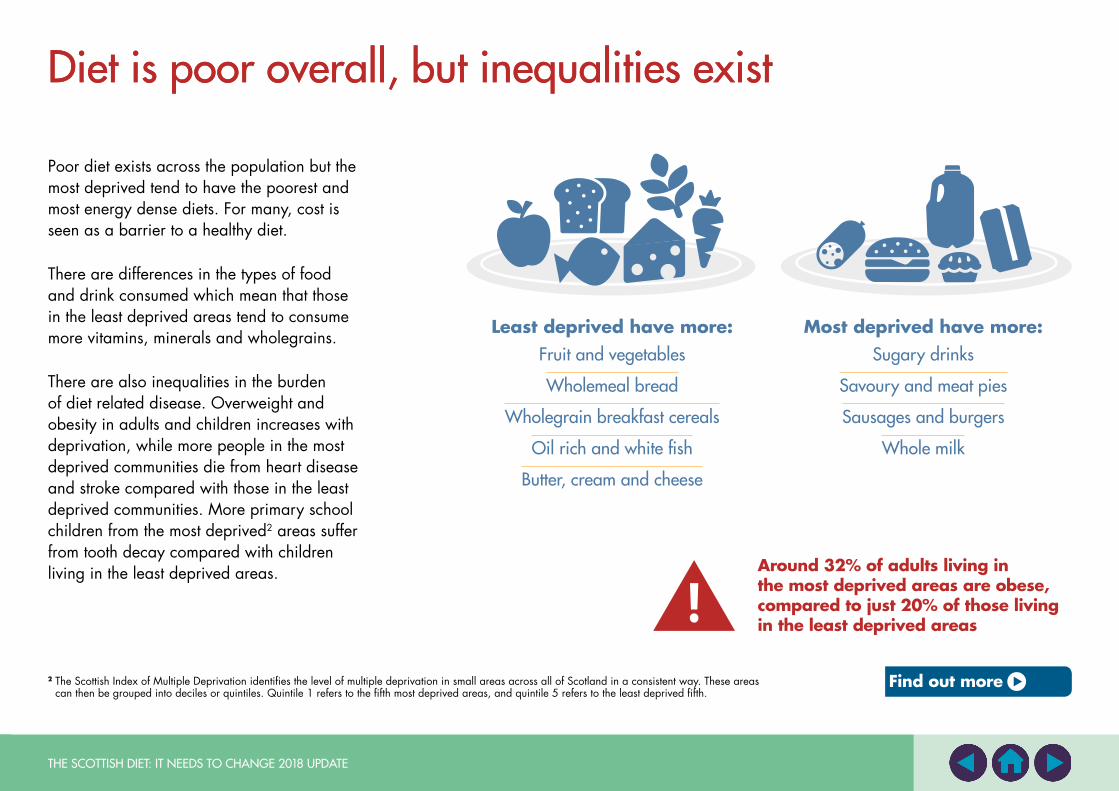
Diet is poor overall, but inequalities existDiet is poor overall, but inequalities exist
Poor diet exists across the population but the most deprived tend to have the poorest and most energy dense diets. For many, cost is seen as a barrier to a healthy diet.
There are differences in the types of food and drink consumed which mean that those in the least deprived areas tend to consume more vitamins, minerals and wholegrains.
There are also inequalities in the burden of diet related disease. Overweight and obesity in adults and children increases with deprivation, while more people in the most deprived communities die from heart disease and stroke compared with those in the least deprived communities. More primary school children from the most deprived2 areas suffer from tooth decay compared with children living in the least deprived areas.
2 The Scottish Index of Multiple Deprivation identifies the level of multiple deprivation in small areas across all of Scotland in a consistent way. These areas can then be grouped into deciles or quintiles. Quintile 1 refers to the fifth most deprived areas, and quintile 5 refers to the least deprived fifth.
Around 32% of adults living in the most deprived areas are obese, compared to just 20% of those living in the least deprived areas
Most deprived have more:Sugary drinks
Savoury and meat pies
Sausages and burgers
Whole milk
Least deprived have more:Fruit and vegetables
Wholemeal bread
Wholegrain breakfast cereals
Oil rich and white fish
Butter, cream and cheese
Find out more
THE SCOTTISH DIET: IT NEEDS TO CHANGE 2018 UPDATE12
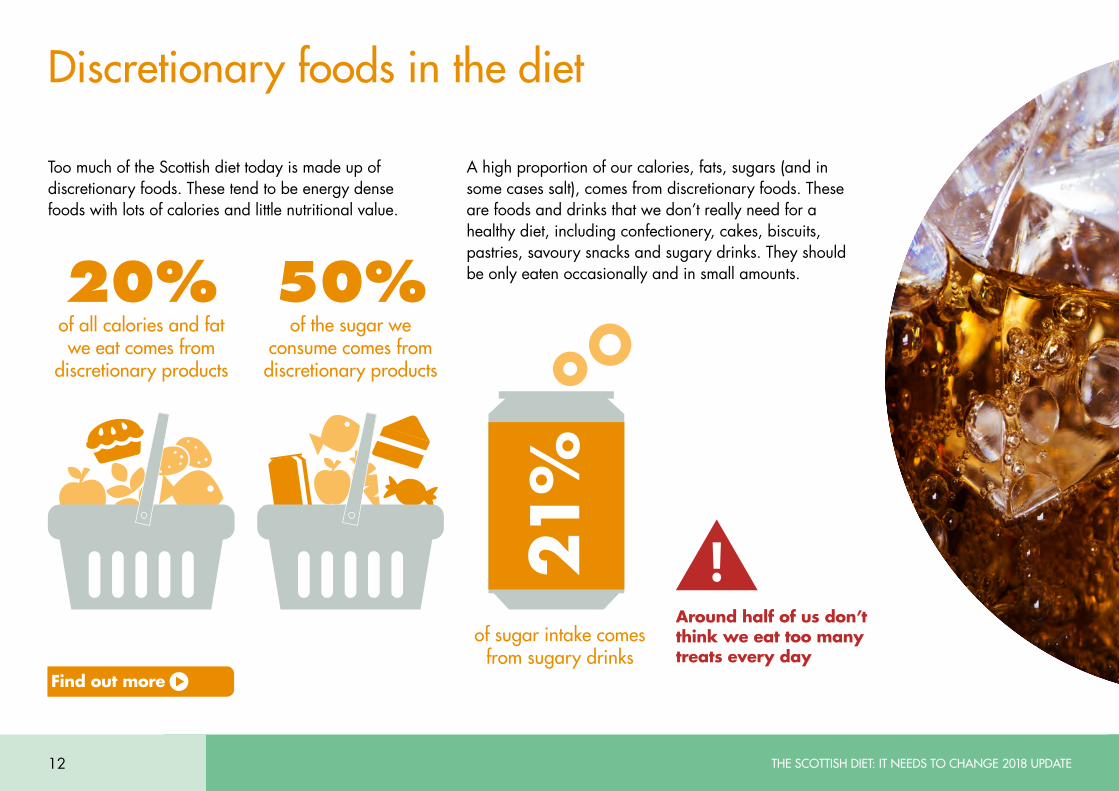
Discretionary foods in the diet
Too much of the Scottish diet today is made up of discretionary foods. These tend to be energy dense foods with lots of calories and little nutritional value.
A high proportion of our calories, fats, sugars (and in some cases salt), comes from discretionary foods. These are foods and drinks that we don’t really need for a healthy diet, including confectionery, cakes, biscuits, pastries, savoury snacks and sugary drinks. They should be only eaten occasionally and in small amounts.20% 50%
of all calories and fat we eat comes from
discretionary products
of the sugar we consume comes from discretionary products
of sugar intake comes from sugary drinks
21%
Around half of us don’t think we eat too many treats every day
Find out more
THE SCOTTISH DIET: IT NEEDS TO CHANGE 2018 UPDATE 13
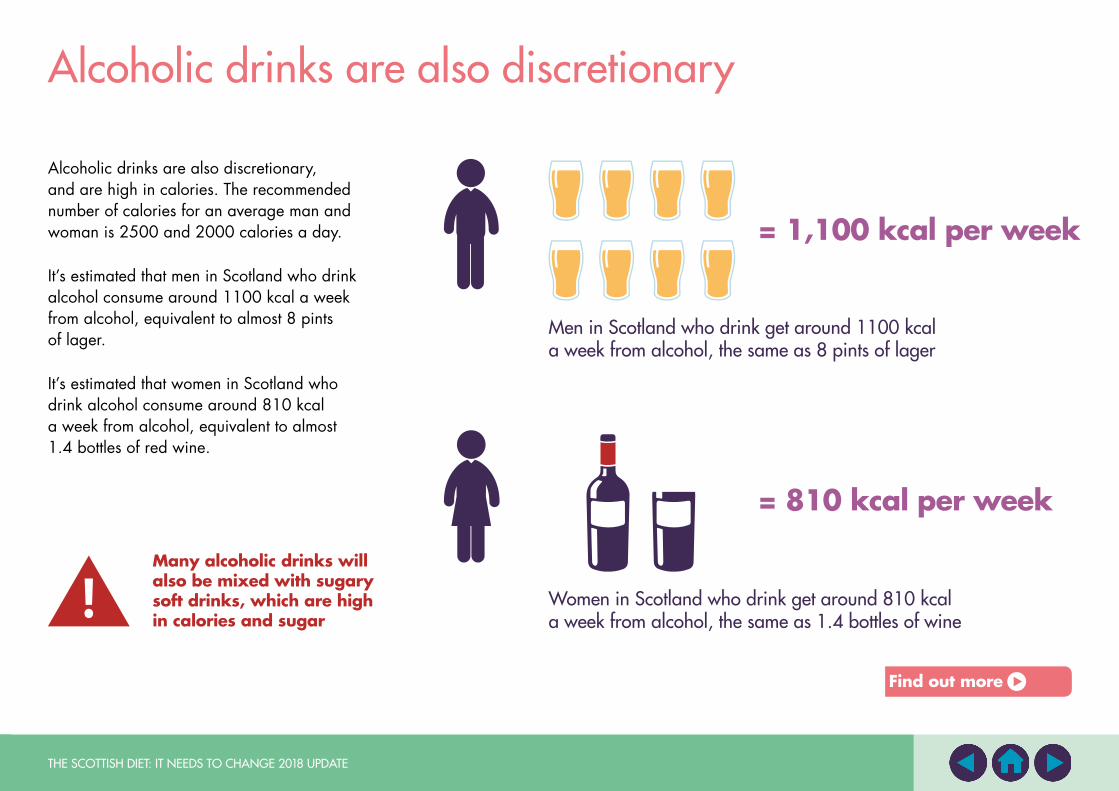
Alcoholic drinks are also discretionary
Many alcoholic drinks will also be mixed with sugary soft drinks, which are high in calories and sugar
Alcoholic drinks are also discretionary, and are high in calories. The recommended number of calories for an average man and woman is 2500 and 2000 calories a day.
It’s estimated that men in Scotland who drink alcohol consume around 1100 kcal a week from alcohol, equivalent to almost 8 pints of lager.
It’s estimated that women in Scotland who drink alcohol consume around 810 kcal a week from alcohol, equivalent to almost 1.4 bottles of red wine.
Men in Scotland who drink get around 1100 kcal a week from alcohol, the same as 8 pints of lager
Women in Scotland who drink get around 810 kcal a week from alcohol, the same as 1.4 bottles of wine
= 1,100 kcal per week
= 810 kcal per week
Find out more
THE SCOTTISH DIET: IT NEEDS TO CHANGE 2018 UPDATE14
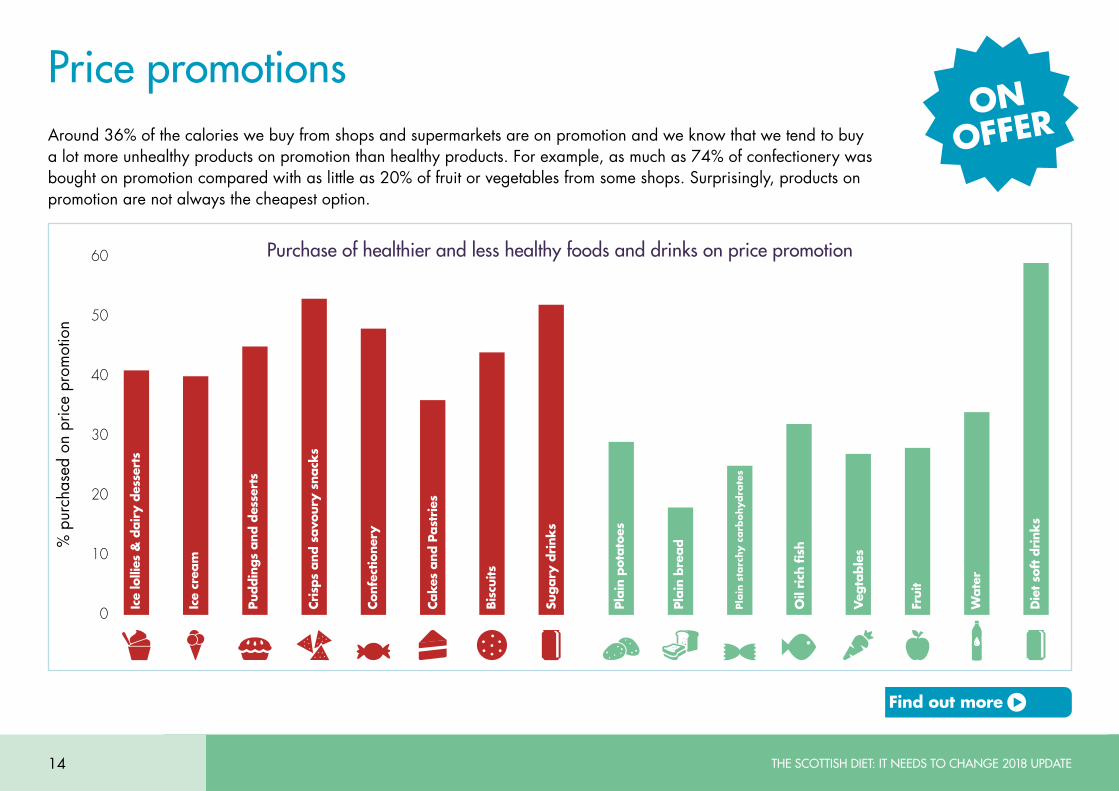
Price promotionsAround 36% of the calories we buy from shops and supermarkets are on promotion and we know that we tend to buy a lot more unhealthy products on promotion than healthy products. For example, as much as 74% of confectionery was bought on promotion compared with as little as 20% of fruit or vegetables from some shops. Surprisingly, products on promotion are not always the cheapest option.
ON OFFER
0
10
20
30
40
50
60 Purchase of healthier and less healthy foods and drinks on price promotion
% p
urch
ased
on
pric
e pr
omot
ion
Ice
lolli
es &
dair
y des
sert
s
Ice
crea
m
Puddin
gs
and
des
sert
s
Cris
ps a
nd s
avo
ury
snack
s
Conf
ectio
nery
Cake
s and
Past
ries
Bis
cuits
Sugary
dri
nks
Plain
pot
ato
es
Plain
bre
ad
Pla
in s
tarc
hy c
arb
ohyd
rate
s
Oil
rich
fish
Veg
table
s
Frui
t
Wate
r
Die
t so
ft d
rink
s
Find out more
THE SCOTTISH DIET: IT NEEDS TO CHANGE 2018 UPDATE 15
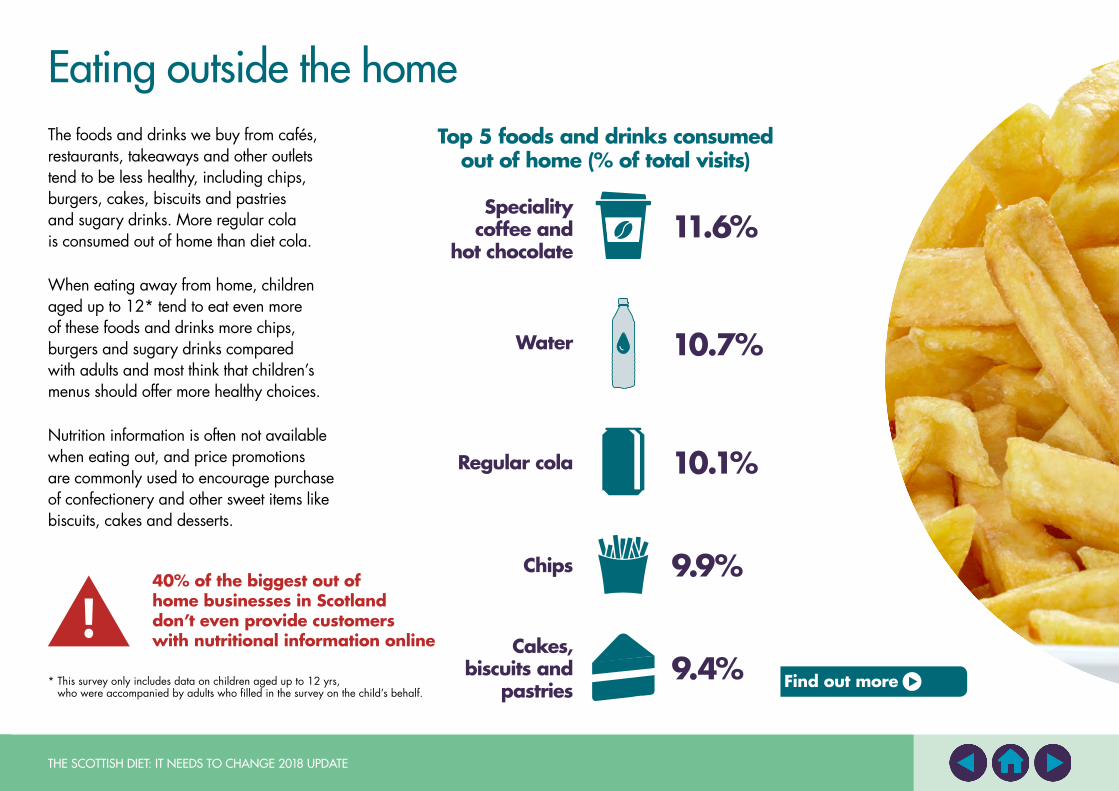
Eating outside the homeThe foods and drinks we buy from cafés, restaurants, takeaways and other outlets tend to be less healthy, including chips, burgers, cakes, biscuits and pastries and sugary drinks. More regular cola is consumed out of home than diet cola.
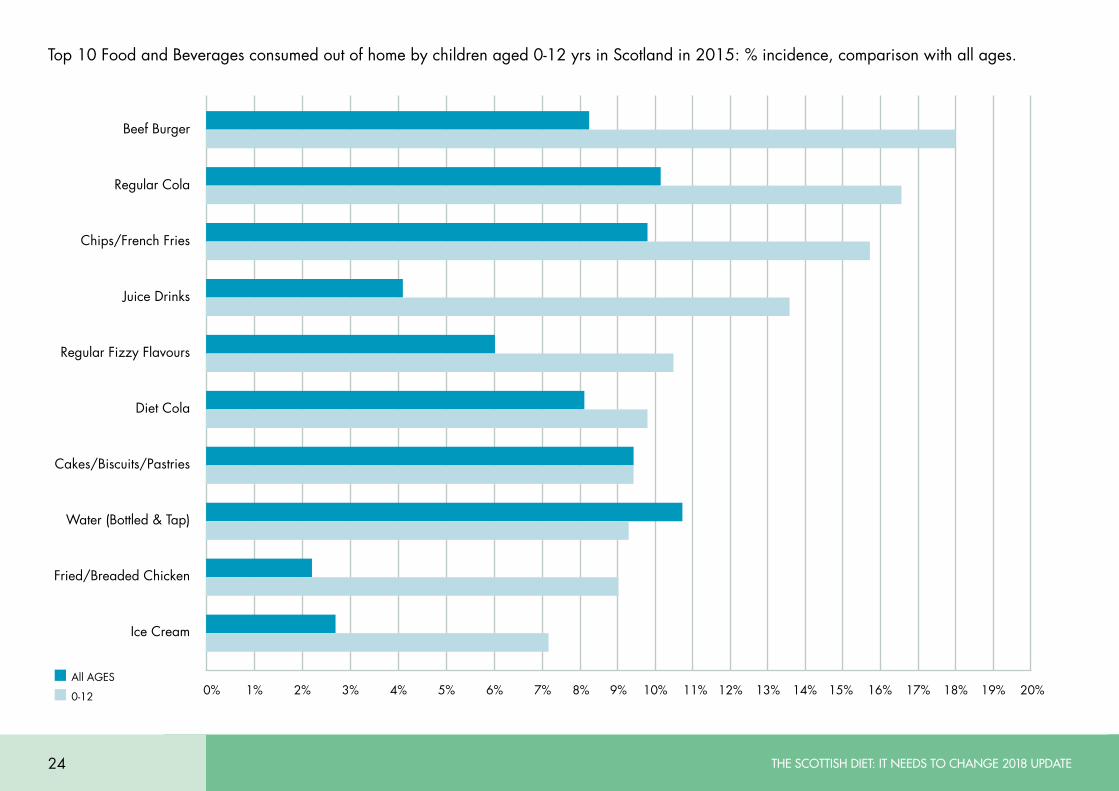
When eating away from home, children aged up to 12* tend to eat even more of these foods and drinks more chips, burgers and sugary drinks compared with adults and most think that children’s menus should offer more healthy choices.
Nutrition information is often not available when eating out, and price promotions are commonly used to encourage purchase of confectionery and other sweet items like biscuits, cakes and desserts.
40% of the biggest out of home businesses in Scotland don’t even provide customers with nutritional information online
* This survey only includes data on children aged up to 12 yrs, who were accompanied by adults who filled in the survey on the child’s behalf.
Top 5 foods and drinks consumed out of home (% of total visits)
11.6%Speciality
coffee and hot chocolate
Water
Regular cola
Chips
Cakes, biscuits and
pastries
10.7%
10.1%
9.9%
9.4% Find out more
THE SCOTTISH DIET: IT NEEDS TO CHANGE 2018 UPDATE16
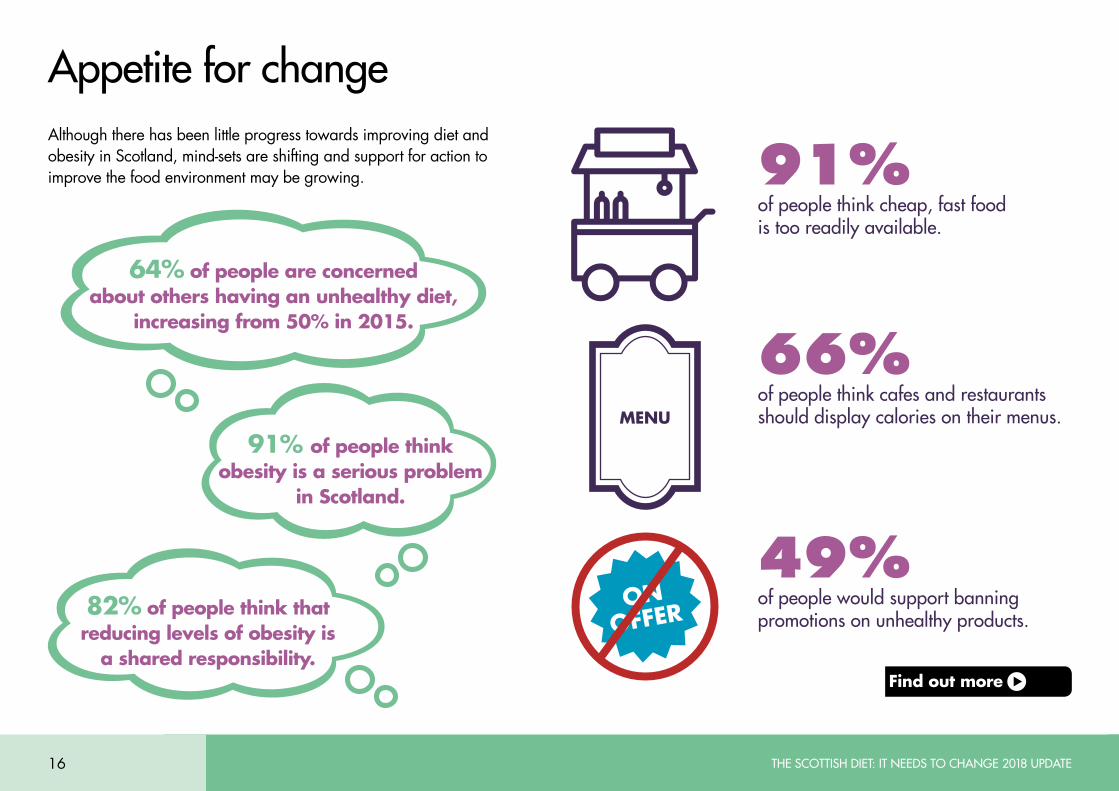
Appetite for change
of people would support banning promotions on unhealthy products.
Although there has been little progress towards improving diet and obesity in Scotland, mind-sets are shifting and support for action to improve the food environment may be growing.
of people think cheap, fast food is too readily available.
of people think cafes and restaurants should display calories on their menus.
ON OFFER
91% of people think obesity is a serious problem
in Scotland.
82% of people think that reducing levels of obesity is
a shared responsibility.
91%
66%
49%
64% of people are concerned about others having an unhealthy diet,
increasing from 50% in 2015.
MENU
Find out more
THE SCOTTISH DIET: IT NEEDS TO CHANGE 2018 UPDATE 17
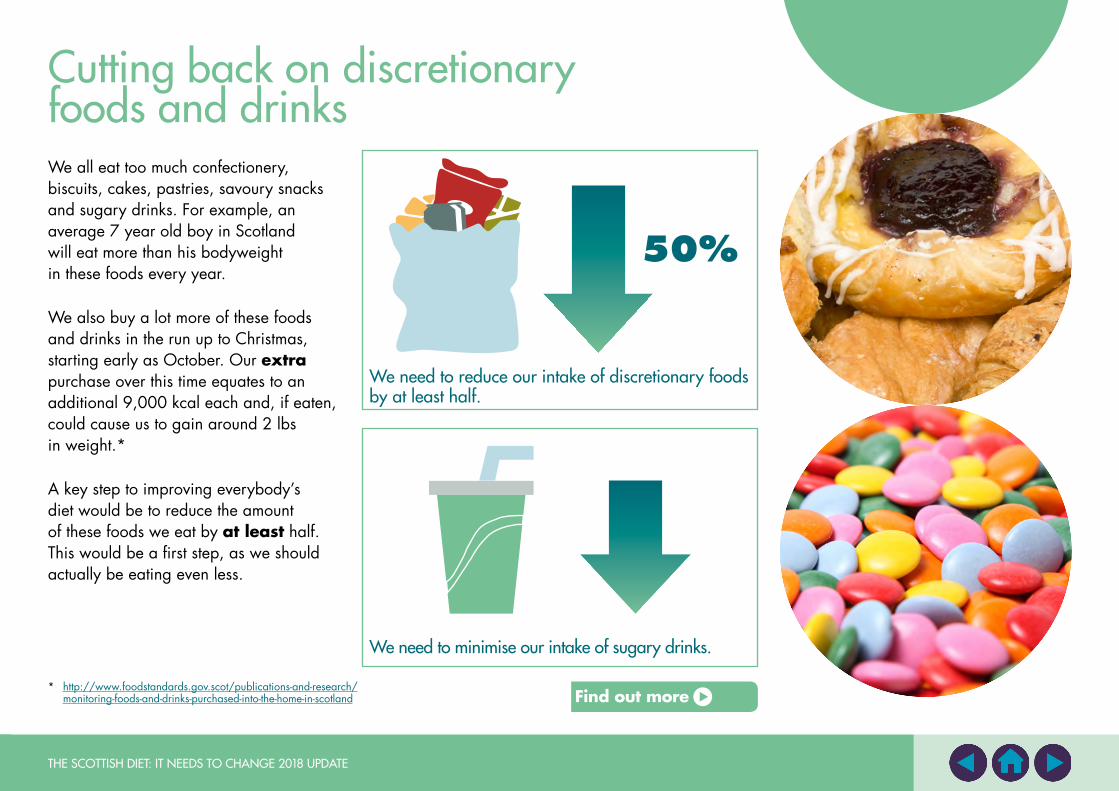
Cutting back on discretionary foods and drinksWe all eat too much confectionery, biscuits, cakes, pastries, savoury snacks and sugary drinks. For example, an average 7 year old boy in Scotland will eat more than his bodyweight in these foods every year.
We also buy a lot more of these foods and drinks in the run up to Christmas, starting early as October. Our extra purchase over this time equates to an additional 9,000 kcal each and, if eaten, could cause us to gain around 2 lbs in weight.*
A key step to improving everybody’s diet would be to reduce the amount of these foods we eat by at least half. This would be a first step, as we should actually be eating even less.
* http://www.foodstandards.gov.scot/publications-and-research/ monitoring-foods-and-drinks-purchased-into-the-home-in-scotland
We need to reduce our intake of discretionary foods by at least half.
We need to minimise our intake of sugary drinks.
50%
Find out more
THE SCOTTISH DIET: IT NEEDS TO CHANGE 2018 UPDATE18
In conclusion
A key step to improving our diets is to cut down on discretionary foods and drinks by at least half. To achieve this, the food environment must change to make it easier for people to choose a healthier diet, including fewer discretionary foods and more fruit, vegetables and fibre. Everyone, including the food and drink industry, media and government needs to play their part.
Over recent years, retailers and manufacturers have gone some way in response to government calls for change, for example on salt reduction and front of pack labelling. However, much more needs to be done to tackle eating ‘out and on the go’ which can contribute up to 25% of our calorie intake and is skewed towards less healthy food.
“Consumers in Scotland are now beginning to recognise the problem and their support is essential. We all need to work together – consumers, industry, Government – to provide a legacy of a healthier Scotland and that is something we must aim for.”
Geoff Ogle, Chief Executive Officer, Food Standards Scotland
Levels of obesity are not reducing and Scotland’s poor diet persists. However, mind-sets are beginning to shift and people are becoming increasingly concerned about obesity, poor diet and its health consequences.
THE SCOTTISH DIET: IT NEEDS TO CHANGE 2018 UPDATE 19
1 Energydensity,alsoknownascaloriedensity,istheamountofcaloriesinaspecificweightoffood,e.g.kcalspergramorper100g.Eatinganenergydensedietincreasestheriskofoverweightandobesity.
2 FoodStandardsScotland.EstimationoffoodandnutrientintakesfromLivingCostsandFoodSurveydatainScotland(2001–2015),interimreport:http://www.foodstandards.gov.scot/publications-and-research/latest-estimation-of-food-and-nutrient-intakes-interim-report
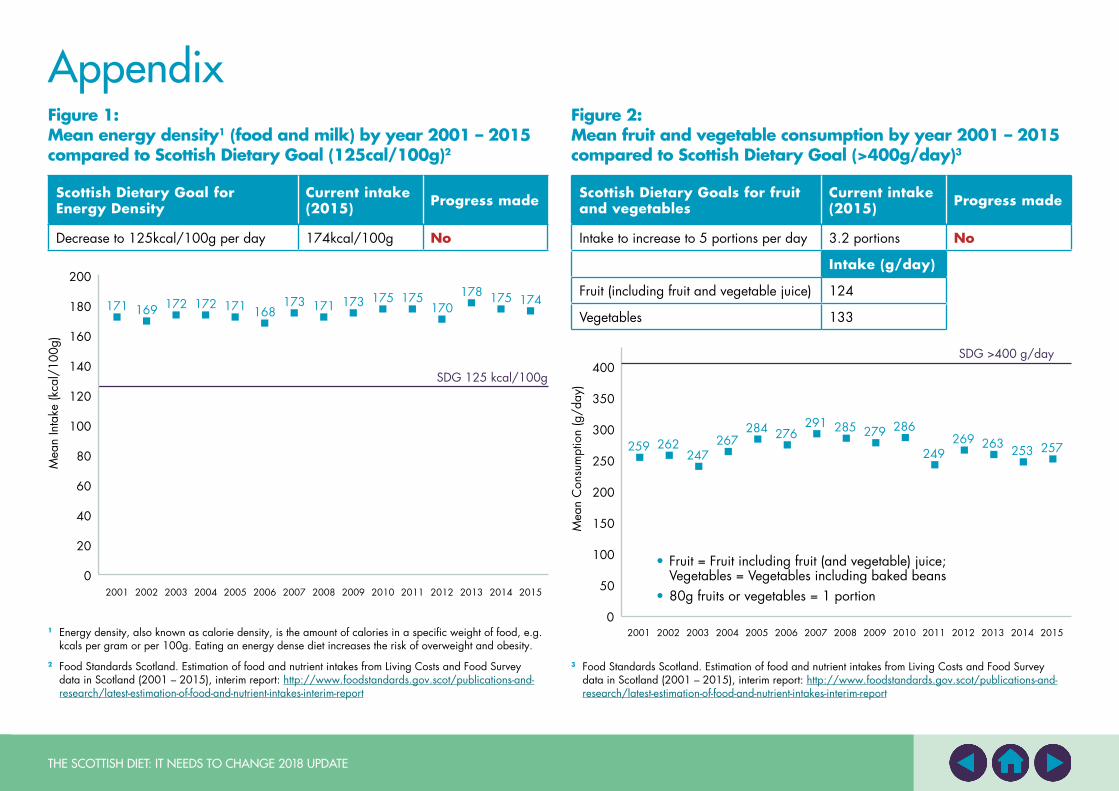
Figure 2: Mean fruit and vegetable consumption by year 2001 – 2015 compared to Scottish Dietary Goal (>400g/day)3
Scottish Dietary Goals for fruit and vegetables
Current intake (2015) Progress made
Intake to increase to 5 portions per day 3.2 portions No
Intake (g/day)
Fruit (including fruit and vegetable juice) 124
Vegetables 133
400
350
300
250
200
150
100
50
0
Mea
n C
onsu
mpt
ion
(g/d
ay)
SDG >400 g/day
2001
259
2002
262
2003
247
2004
267
2005
284
2006
276
2007
291
2008
285
2009
279
2010
286
2011
249
2012
269
2013
263
2014
253
2015
257
• Fruit = Fruit including fruit (and vegetable) juice; Vegetables = Vegetables including baked beans
• 80g fruits or vegetables = 1 portion
Figure 1: Mean energy density1 (food and milk) by year 2001 – 2015 compared to Scottish Dietary Goal (125cal/100g)2
Scottish Dietary Goal for Energy Density
Current intake (2015) Progress made
Decrease to 125kcal/100g per day 174kcal/100g No
2001 2002 2003 2004 2005 2006 2007 2008 2009 2010 2011 2012 2013 2014 2015
200
180
160
140
120
100
80
60
40
20
Mea
n In
take
(kca
l/10
0g)
SDG 125 kcal/100g
0
171 169 172 172 171 168173 171 173 175 175
170178 175 174
Appendix
3 FoodStandardsScotland.EstimationoffoodandnutrientintakesfromLivingCostsandFoodSurveydatainScotland(2001–2015),interimreport:http://www.foodstandards.gov.scot/publications-and-research/latest-estimation-of-food-and-nutrient-intakes-interim-report
THE SCOTTISH DIET: IT NEEDS TO CHANGE 2018 UPDATE20
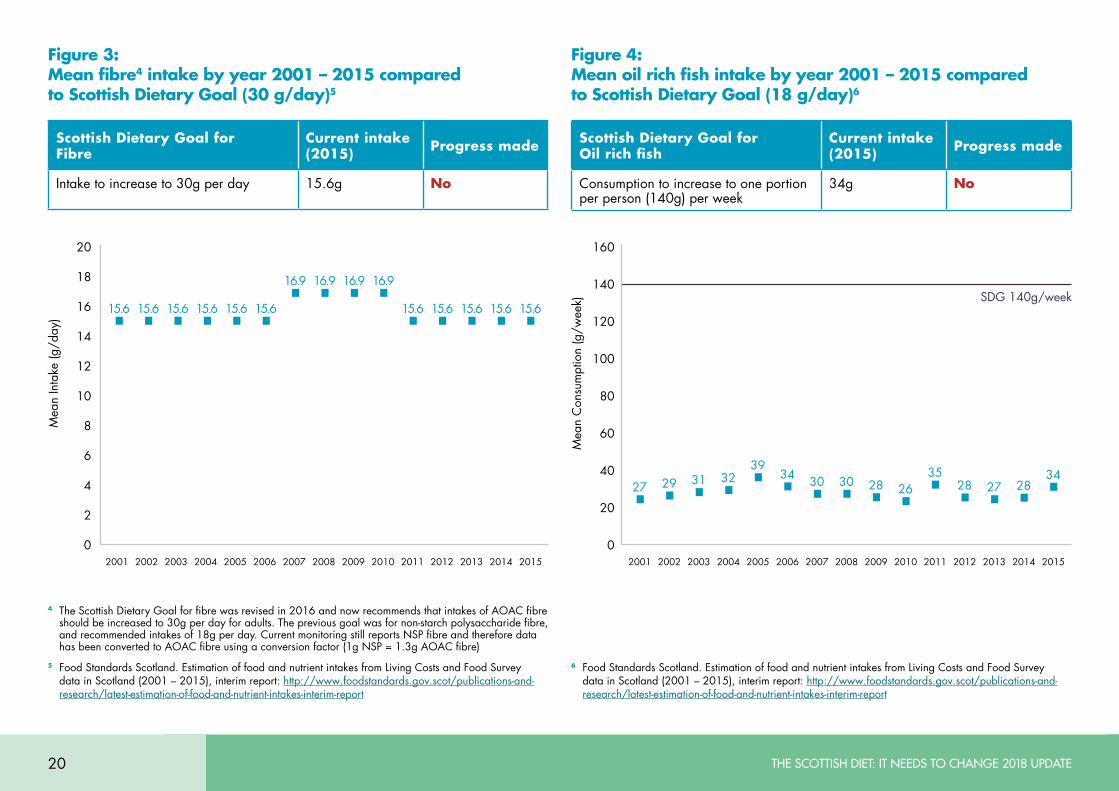
Figure 4: Mean oil rich fish intake by year 2001 – 2015 compared to Scottish Dietary Goal (18 g/day)6
Scottish Dietary Goal for Oil rich fish
Current intake (2015) Progress made
Consumption to increase to one portion per person (140g) per week
34g No
160
140
120
100
80
60
40
20
0
Mea
n C
onsu
mpt
ion
(g/w
eek) SDG 140g/week
4 The Scottish Dietary Goal for fibre was revised in 2016 and now recommends that intakes of AOAC fibre should be increased to 30g per day for adults. The previous goal was for non-starch polysaccharide fibre, and recommended intakes of 18g per day. Current monitoring still reports NSP fibre and therefore data has been converted to AOAC fibre using a conversion factor (1g NSP = 1.3g AOAC fibre)
5 FoodStandardsScotland.EstimationoffoodandnutrientintakesfromLivingCostsandFoodSurveydatainScotland(2001–2015),interimreport:http://www.foodstandards.gov.scot/publications-and-research/latest-estimation-of-food-and-nutrient-intakes-interim-report
6 FoodStandardsScotland.EstimationoffoodandnutrientintakesfromLivingCostsandFoodSurveydatainScotland(2001–2015),interimreport:http://www.foodstandards.gov.scot/publications-and-research/latest-estimation-of-food-and-nutrient-intakes-interim-report
Figure 3: Mean fibre4 intake by year 2001 – 2015 compared to Scottish Dietary Goal (30 g/day)5
Scottish Dietary Goal for Fibre
Current intake (2015) Progress made
Intake to increase to 30g per day 15.6g No
20
18
16
14
12
10
8
6
2
4
0
Mea
n In
take
(g/d
ay)
15.6 15.6 15.6 15.6 15.6 15.6
16.9 16.9 16.9 16.9
15.6 15.6 15.6 15.6 15.6
27 29 31 3239
34 30 30 28 2635
28 27 2834
2001 2002 2003 2004 2005 2006 2007 2008 2009 2010 2011 2012 2013 2014 2015 2001 2002 2003 2004 2005 2006 2007 2008 2009 2010 2011 2012 2013 2014 2015
THE SCOTTISH DIET: IT NEEDS TO CHANGE 2018 UPDATE 21
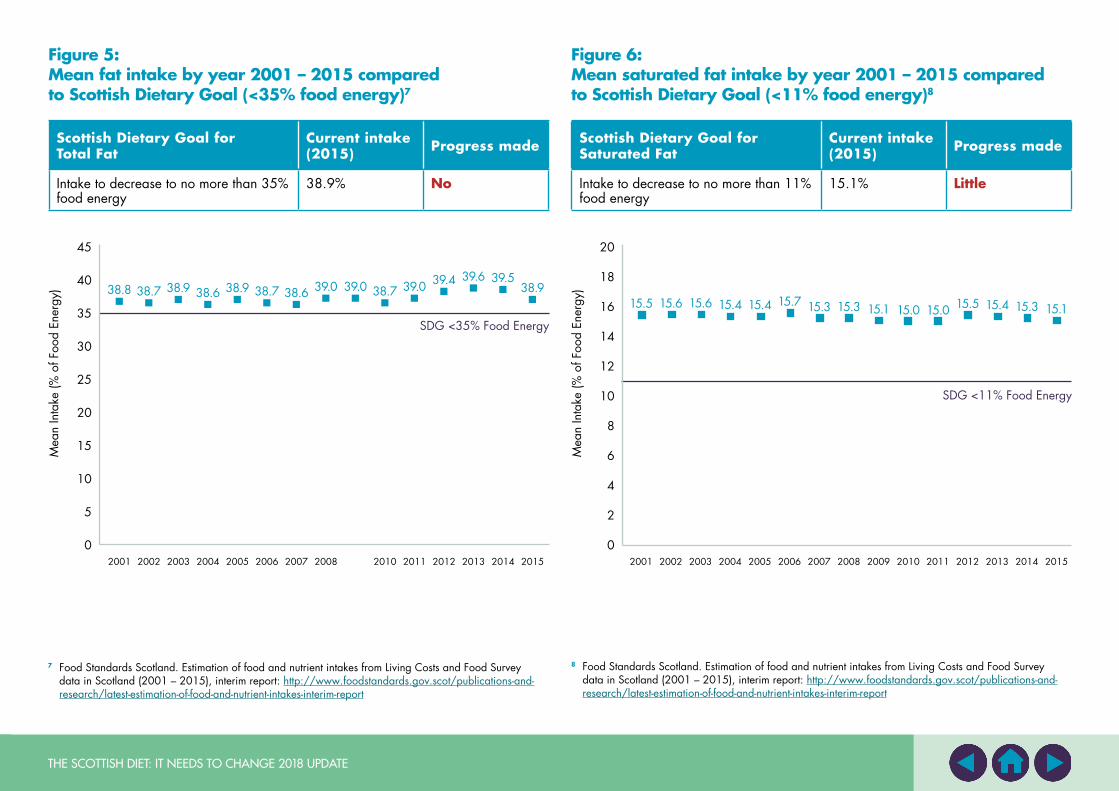
Figure 6: Mean saturated fat intake by year 2001 – 2015 compared to Scottish Dietary Goal (<11% food energy)8
Scottish Dietary Goal for Saturated Fat
Current intake (2015) Progress made
Intake to decrease to no more than 11% food energy
15.1% Little
20
18
16
14
12
10
8
6
2
4
0
Mea
n In
take
(% o
f Foo
d En
ergy
)2001 2002 2003 2004 2005 2006 2007 2008 2009 2010 2011 2012 2013 2014 2015
SDG <11% Food Energy
8 FoodStandardsScotland.EstimationoffoodandnutrientintakesfromLivingCostsandFoodSurveydatainScotland(2001–2015),interimreport:http://www.foodstandards.gov.scot/publications-and-research/latest-estimation-of-food-and-nutrient-intakes-interim-report
15.5 15.6 15.6 15.4 15.4 15.7 15.3 15.3 15.1 15.0 15.0 15.5 15.4 15.3 15.1
Figure 5: Mean fat intake by year 2001 – 2015 compared to Scottish Dietary Goal (<35% food energy)7
45
40
35
30
25
20
15
10
5
0
Mea
n In
take
(% o
f Foo
d En
ergy
)
SDG <35% Food Energy
Scottish Dietary Goal for Total Fat
Current intake (2015) Progress made
Intake to decrease to no more than 35% food energy
38.9% No
2001
38.8
2002
38.7
2003
38.9
2004
38.6
2005
38.9
2006
38.7
2007
38.6
2008
39.0 39.0
2010
38.7
2011
39.0
2012
39.4
2013
39.6
2014
39.5
2015
38.9
7 FoodStandardsScotland.EstimationoffoodandnutrientintakesfromLivingCostsandFoodSurveydatainScotland(2001–2015),interimreport:http://www.foodstandards.gov.scot/publications-and-research/latest-estimation-of-food-and-nutrient-intakes-interim-report
THE SCOTTISH DIET: IT NEEDS TO CHANGE 2018 UPDATE22
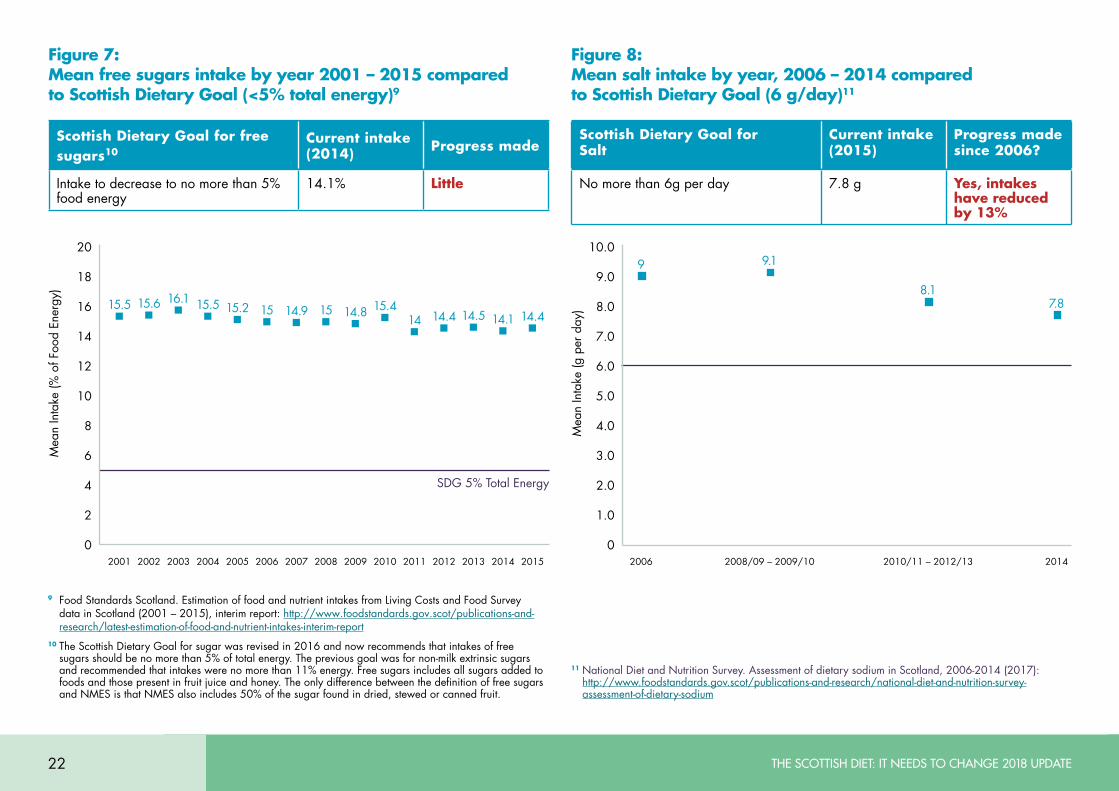
Figure 8: Mean salt intake by year, 2006 – 2014 compared to Scottish Dietary Goal (6 g/day)11
Scottish Dietary Goal for Salt
Current intake (2015)
Progress made since 2006?
No more than 6g per day 7.8 g Yes, intakes have reduced by 13%
10.0
9.0
8.0
7.0
6.0
5.0
4.0
3.0
1.0
2.0
0
Mea
n In
take
(g p
er d
ay)
2006 2008/09 – 2009/10 2010/11 – 2012/13 2014
9
8.17.8
9.1
Figure 7: Mean free sugars intake by year 2001 – 2015 compared to Scottish Dietary Goal (<5% total energy)9
20
18
16
14
12
10
8
6
4
2
0
Mea
n In
take
(% o
f Foo
d En
ergy
)
SDG 5% Total Energy
Scottish Dietary Goal for free sugars10
Current intake (2014) Progress made
Intake to decrease to no more than 5% food energy
14.1% Little
2001
15.5
2002
15.6
2003
16.1
2004
15.5
2005
15.2
2006
15
2007
14.9
2008
15
2009
14.8
2010
15.4
2011
14
2012
14.4
2013
14.5
2014
14.1
2015
14.4
9 FoodStandardsScotland.EstimationoffoodandnutrientintakesfromLivingCostsandFoodSurveydatainScotland(2001–2015),interimreport:http://www.foodstandards.gov.scot/publications-and-research/latest-estimation-of-food-and-nutrient-intakes-interim-report
10 The Scottish Dietary Goal for sugar was revised in 2016 and now recommends that intakes of free sugars should be no more than 5% of total energy. The previous goal was for non-milk extrinsic sugars and recommended that intakes were no more than 11% energy. Free sugars includes all sugars added to foods and those present in fruit juice and honey. The only difference between the definition of free sugars and NMES is that NMES also includes 50% of the sugar found in dried, stewed or canned fruit.
11 National Diet and Nutrition Survey. Assessment of dietary sodium in Scotland, 2006-2014 (2017): http://www.foodstandards.gov.scot/publications-and-research/national-diet-and-nutrition-survey-assessment-of-dietary-sodium
THE SCOTTISH DIET: IT NEEDS TO CHANGE 2018 UPDATE 23
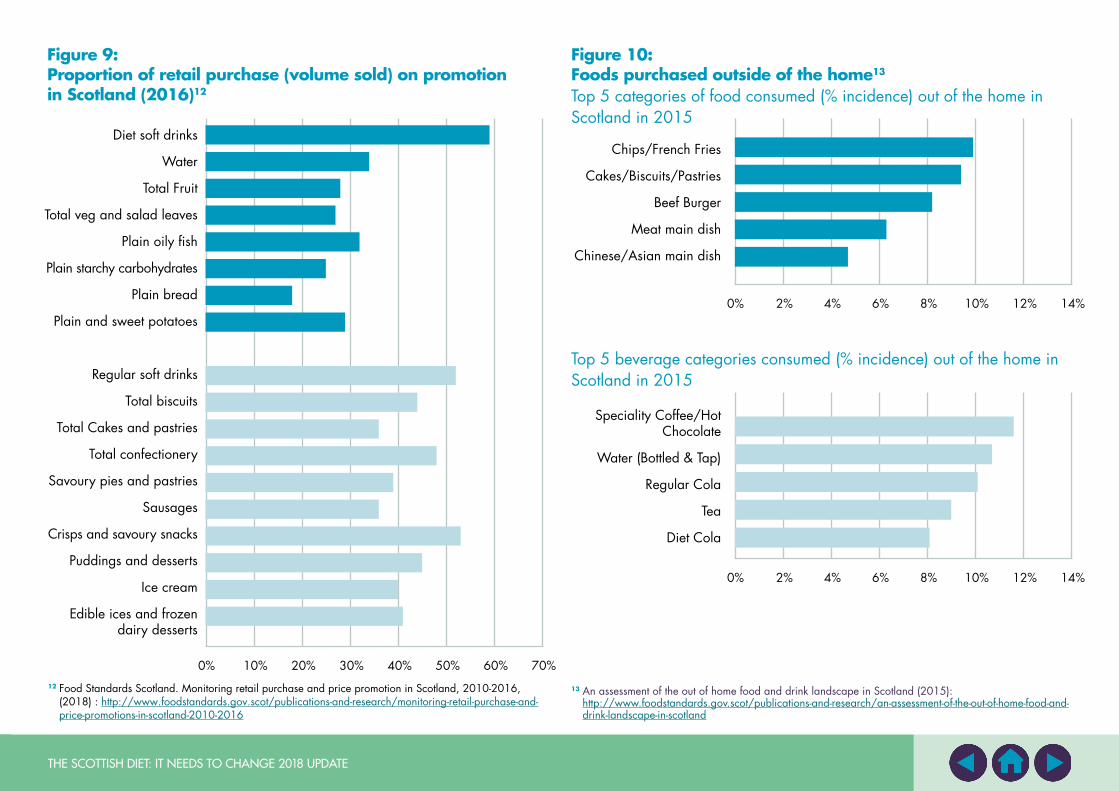
12FoodStandardsScotland.MonitoringretailpurchaseandpricepromotioninScotland,2010-2016,(2018):http://www.foodstandards.gov.scot/publications-and-research/monitoring-retail-purchase-and-price-promotions-in-scotland-2010-2016
Figure 10: Foods purchased outside of the home13
Top 5 categories of food consumed (% incidence) out of the home in Scotland in 2015
Top 5 beverage categories consumed (% incidence) out of the home in Scotland in 2015
Figure 9: Proportion of retail purchase (volume sold) on promotion in Scotland (2016)12
0% 10% 20% 30% 40% 50% 60% 70%
Diet soft drinks
Water
Total Fruit
Total veg and salad leaves
Plain oily fish
Plain starchy carbohydrates
Plain bread
Plain and sweet potatoes
Regular soft drinks
Total biscuits
Total Cakes and pastries
Total confectionery
Savoury pies and pastries
Sausages
Crisps and savoury snacks
Puddings and desserts
Ice cream
Edible ices and frozen dairy desserts
Chips/French Fries
Cakes/Biscuits/Pastries
Beef Burger
Meat main dish
Chinese/Asian main dish
Speciality Coffee/Hot Chocolate
Water (Bottled & Tap)
Regular Cola
Tea
Diet Cola
13 An assessment of the out of home food and drink landscape in Scotland (2015): http://www.foodstandards.gov.scot/publications-and-research/an-assessment-of-the-out-of-home-food-and-drink-landscape-in-scotland
0% 2% 4% 6% 8% 10% 12% 14%
0% 2% 4% 6% 8% 10% 12% 14%
THE SCOTTISH DIET: IT NEEDS TO CHANGE 2018 UPDATE24
Top 10 Food and Beverages consumed out of home by children aged 0-12 yrs in Scotland in 2015: % incidence, comparison with all ages.
0% 1% 2% 3% 4% 5% 6% 7% 8% 9% 10% 11% 12% 13% 14% 15% 16% 17% 18% 19% 20%
Beef Burger
Regular Cola
Chips/French Fries
Juice Drinks
Regular Fizzy Flavours
Diet Cola
Cakes/Biscuits/Pastries
Water (Bottled & Tap)
Fried/Breaded Chicken
Ice Cream
All AGES
0-12
THE SCOTTISH DIET: IT NEEDS TO CHANGE 2018 UPDATE 25
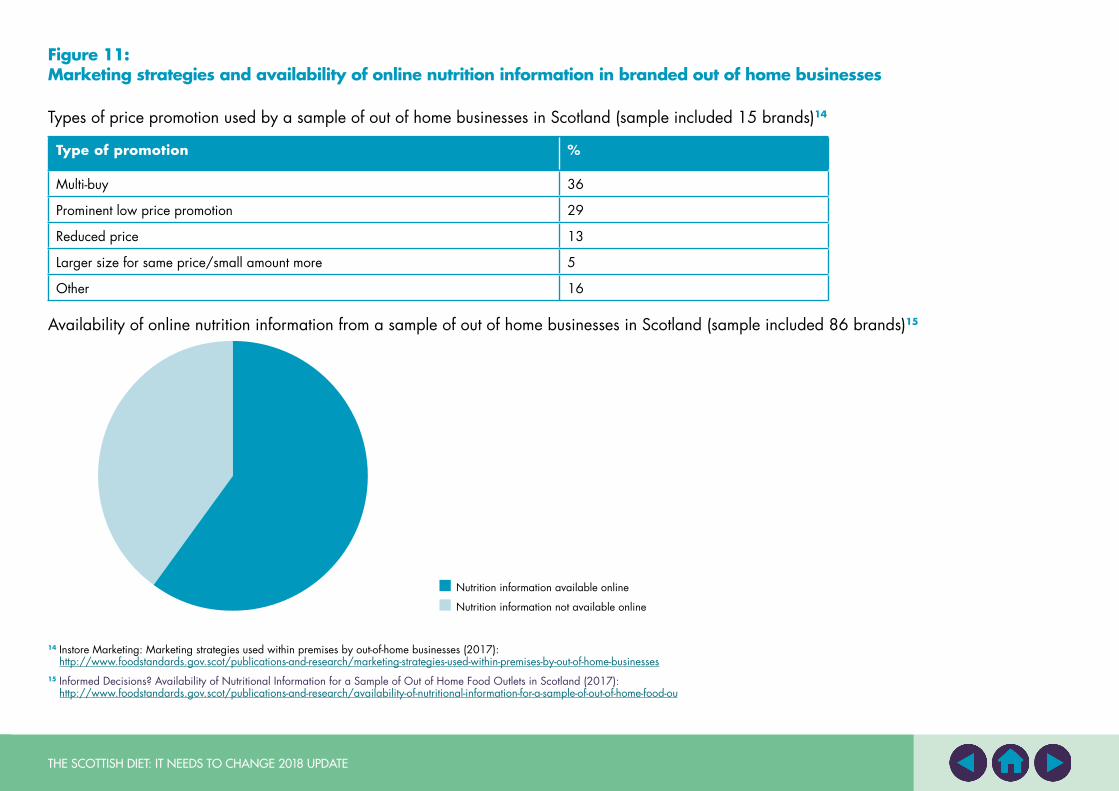
Figure 11: Marketing strategies and availability of online nutrition information in branded out of home businesses
Types of price promotion used by a sample of out of home businesses in Scotland (sample included 15 brands)14
Type of promotion %
Multi-buy 36
Prominent low price promotion 29
Reduced price 13
Larger size for same price/small amount more 5
Other 16
Availability of online nutrition information from a sample of out of home businesses in Scotland (sample included 86 brands)15
14 Instore Marketing: Marketing strategies used within premises by out-of-home businesses (2017): http://www.foodstandards.gov.scot/publications-and-research/marketing-strategies-used-within-premises-by-out-of-home-businesses
15 Informed Decisions? Availability of Nutritional Information for a Sample of Out of Home Food Outlets in Scotland (2017): http://www.foodstandards.gov.scot/publications-and-research/availability-of-nutritional-information-for-a-sample-of-out-of-home-food-ou
Nutrition information available online
Nutrition information not available online
THE SCOTTISH DIET: IT NEEDS TO CHANGE 2018 UPDATE26
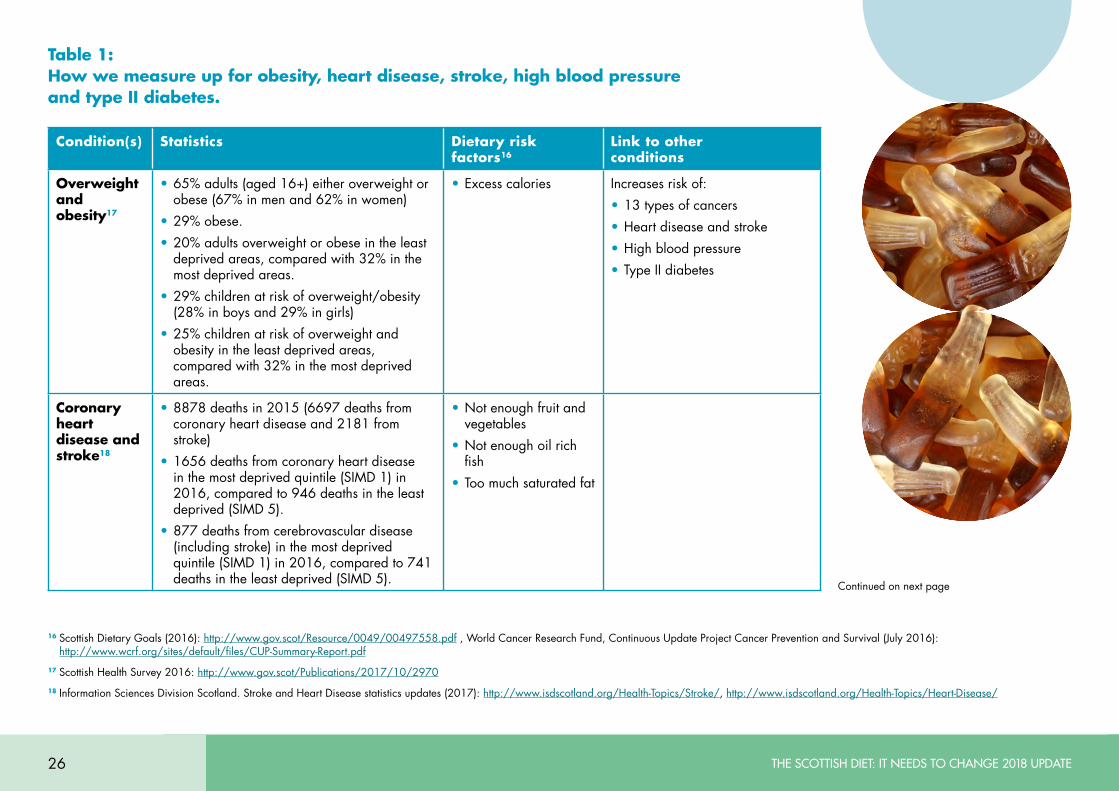
Condition(s) Statistics Dietary risk factors16
Link to other conditions
Overweight and obesity17
• 65% adults (aged 16+) either overweight or obese (67% in men and 62% in women)
• 29% obese.
• 20% adults overweight or obese in the least deprived areas, compared with 32% in the most deprived areas.
• 29% children at risk of overweight/obesity (28% in boys and 29% in girls)
• 25% children at risk of overweight and obesity in the least deprived areas, compared with 32% in the most deprived areas.
• Excess calories Increases risk of:
• 13 types of cancers
• Heart disease and stroke
• High blood pressure
• Type II diabetes
Coronary heart disease and stroke18
• 8878 deaths in 2015 (6697 deaths from coronary heart disease and 2181 from stroke)
• 1656 deaths from coronary heart disease in the most deprived quintile (SIMD 1) in 2016, compared to 946 deaths in the least deprived (SIMD 5).
• 877 deaths from cerebrovascular disease (including stroke) in the most deprived quintile (SIMD 1) in 2016, compared to 741 deaths in the least deprived (SIMD 5).
• Not enough fruit and vegetables
• Not enough oil rich fish
• Too much saturated fat
Table 1: How we measure up for obesity, heart disease, stroke, high blood pressure and type II diabetes.
16 Scottish Dietary Goals (2016): http://www.gov.scot/Resource/0049/00497558.pdf , World Cancer Research Fund, Continuous Update Project Cancer Prevention and Survival (July 2016): http://www.wcrf.org/sites/default/files/CUP-Summary-Report.pdf
17 Scottish Health Survey 2016: http://www.gov.scot/Publications/2017/10/2970
18 Information Sciences Division Scotland. Stroke and Heart Disease statistics updates (2017): http://www.isdscotland.org/Health-Topics/Stroke/, http://www.isdscotland.org/Health-Topics/Heart-Disease/
Continued on next page
THE SCOTTISH DIET: IT NEEDS TO CHANGE 2018 UPDATE 27
19ScottishHealthSurvey2015:http://www.gov.scot/Publications/2016/09/2764
20 ScottishDiabetesSurvey,2016:http://www.diabetesinscotland.org.uk/Publications/Scottish%20Diabetes%20Survey%202016.pdf
21 CancerResearchUK.Howbeingoverweightcausescancer(2016):http://www.cancerresearchuk.org/about-cancer/causes-of-cancer/obesity-weight-and-cancer/how-being-overweight-causes-cancer
22 InformationSciencesDivisionScotland.CancerMortalityupdate(2017):http://www.isdscotland.org/Health-Topics/Cancer/
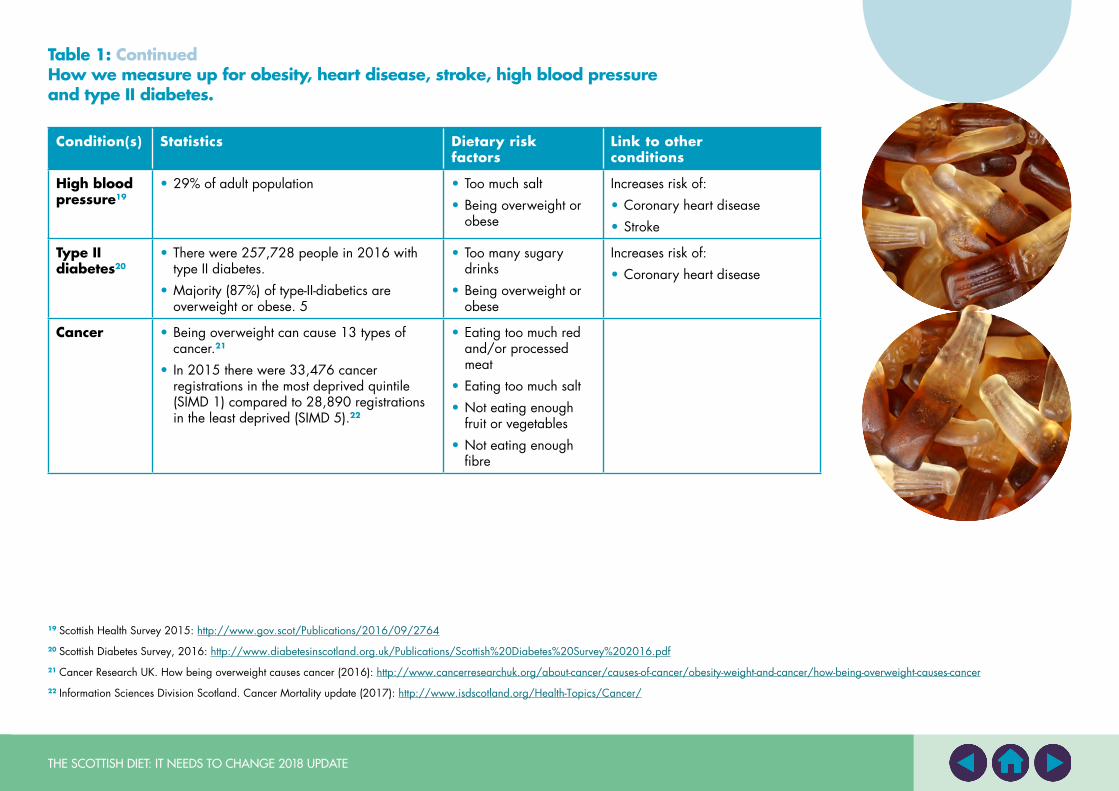
Condition(s) Statistics Dietary risk factors16
Link to other conditions
High blood pressure19
• 29% of adult population • Too much salt
• Being overweight or obese
Increases risk of:
• Coronary heart disease
• Stroke
Type II diabetes20
• There were 257,728 people in 2016 with type II diabetes.
• Majority (87%) of type-II-diabetics are overweight or obese. 5
• Too many sugary drinks
• Being overweight or obese
Increases risk of:
• Coronary heart disease
Cancer • Being overweight can cause 13 types of cancer.21
• In 2015 there were 33,476 cancer registrations in the most deprived quintile (SIMD 1) compared to 28,890 registrations in the least deprived (SIMD 5).22
• Eating too much red and/or processed meat
• Eating too much salt
• Not eating enough fruit or vegetables
• Not eating enough fibre
Table 1: Continued How we measure up for obesity, heart disease, stroke, high blood pressure and type II diabetes.
THE SCOTTISH DIET: IT NEEDS TO CHANGE 2018 UPDATE28
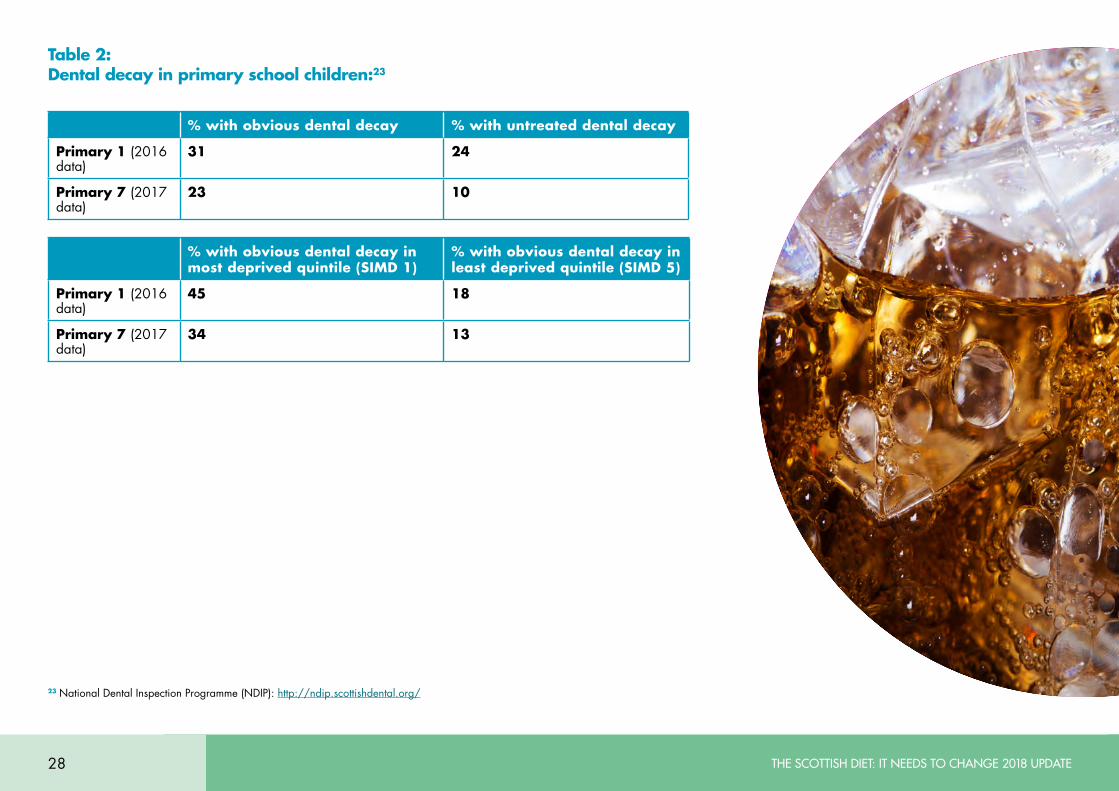
Table 2: Dental decay in primary school children:23
23NationalDentalInspectionProgramme(NDIP):http://ndip.scottishdental.org/
% with obvious dental decay % with untreated dental decay
Primary 1 (2016 data)
31 24
Primary 7 (2017 data)
23 10
% with obvious dental decay in most deprived quintile (SIMD 1)
% with obvious dental decay in least deprived quintile (SIMD 5)
Primary 1 (2016 data)
45 18
Primary 7 (2017 data)
34 13
THE SCOTTISH DIET: IT NEEDS TO CHANGE 2018 UPDATE 29
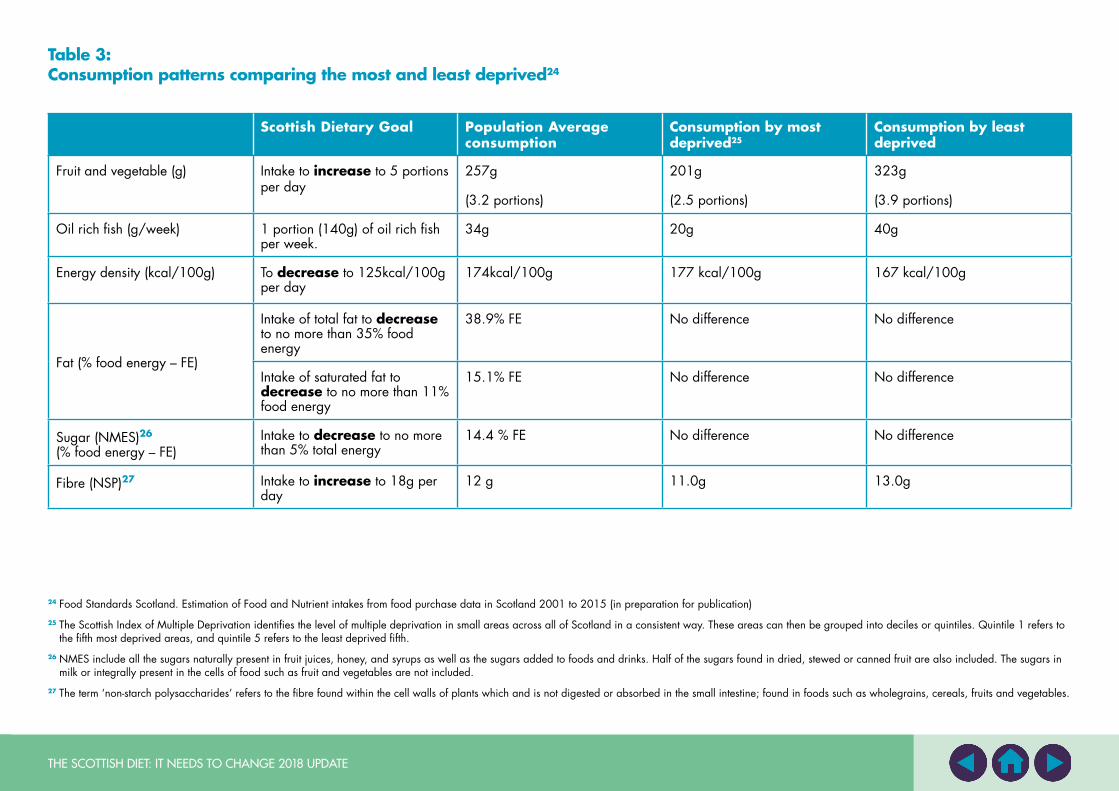
Table 3: Consumption patterns comparing the most and least deprived24
Scottish Dietary Goal Population Average consumption
Consumption by most deprived25
Consumption by least deprived
Fruit and vegetable (g) Intake to increase to 5 portions per day
257g
(3.2 portions)
201g
(2.5 portions)
323g
(3.9 portions)
Oil rich fish (g/week) 1 portion (140g) of oil rich fish per week.
34g 20g 40g
Energy density (kcal/100g) To decrease to 125kcal/100g per day
174kcal/100g 177 kcal/100g 167 kcal/100g
Fat (% food energy – FE)
Intake of total fat to decrease to no more than 35% food energy
38.9% FE No difference No difference
Intake of saturated fat to decrease to no more than 11% food energy
15.1% FE No difference No difference
Sugar (NMES)26 (% food energy – FE)
Intake to decrease to no more than 5% total energy
14.4 % FE No difference No difference
Fibre (NSP)27 Intake to increase to 18g per day
12 g 11.0g 13.0g
24FoodStandardsScotland.EstimationofFoodandNutrientintakesfromfoodpurchasedatainScotland2001to2015(inpreparationforpublication)
25 The Scottish Index of Multiple Deprivation identifies the level of multiple deprivation in small areas across all of Scotland in a consistent way. These areas can then be grouped into deciles or quintiles. Quintile 1 refers to the fifth most deprived areas, and quintile 5 refers to the least deprived fifth.
26 NMES include all the sugars naturally present in fruit juices, honey, and syrups as well as the sugars added to foods and drinks. Half of the sugars found in dried, stewed or canned fruit are also included. The sugars in milk or integrally present in the cells of food such as fruit and vegetables are not included.
27 The term ‘non-starch polysaccharides’ refers to the fibre found within the cell walls of plants which and is not digested or absorbed in the small intestine; found in foods such as wholegrains, cereals, fruits and vegetables.
THE SCOTTISH DIET: IT NEEDS TO CHANGE 2018 UPDATE30
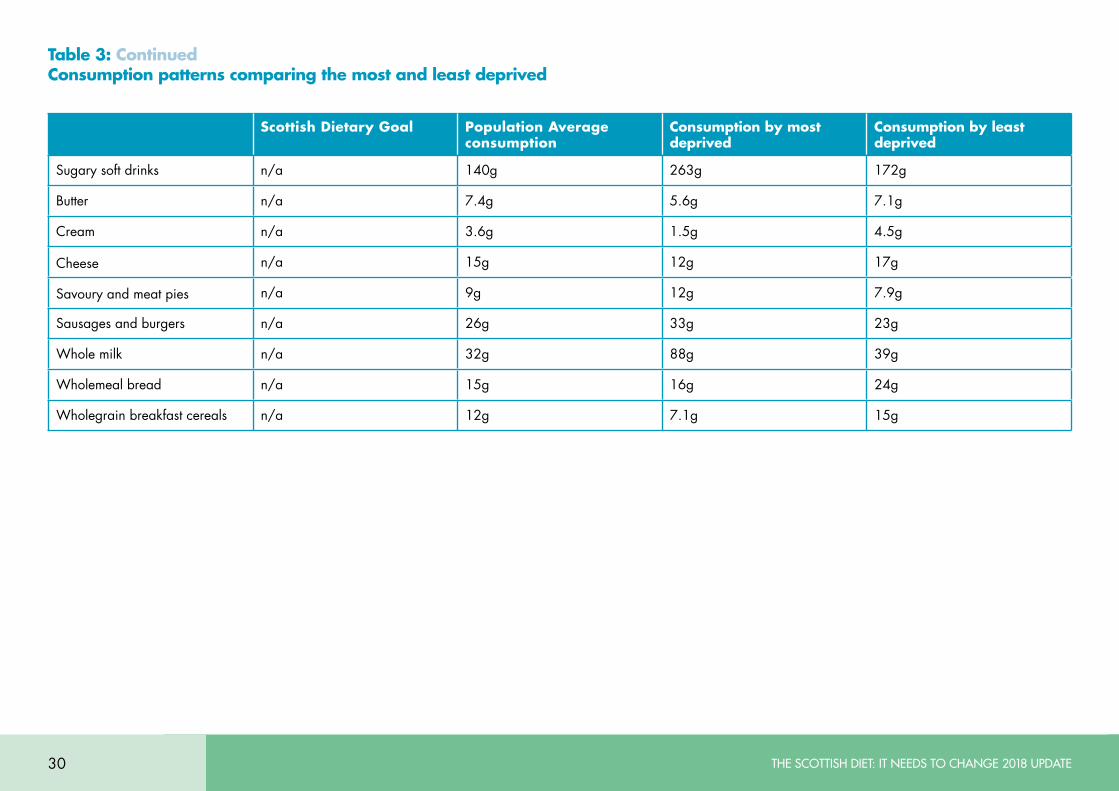
Table 3: Continued Consumption patterns comparing the most and least deprived
Scottish Dietary Goal Population Average consumption
Consumption by most deprived
Consumption by least deprived
Sugarysoftdrinks n/a 140g 263g 172g
Butter n/a 7.4g 5.6g 7.1g
Cream n/a 3.6g 1.5g 4.5g
Cheese n/a 15g 12g 17g
Savouryandmeatpies n/a 9g 12g 7.9g
Sausagesandburgers n/a 26g 33g 23g
Wholemilk n/a 32g 88g 39g
Wholemealbread n/a 15g 16g 24g
Wholegrainbreakfastcereals n/a 12g 7.1g 15g
THE SCOTTISH DIET: IT NEEDS TO CHANGE 2018 UPDATE 31
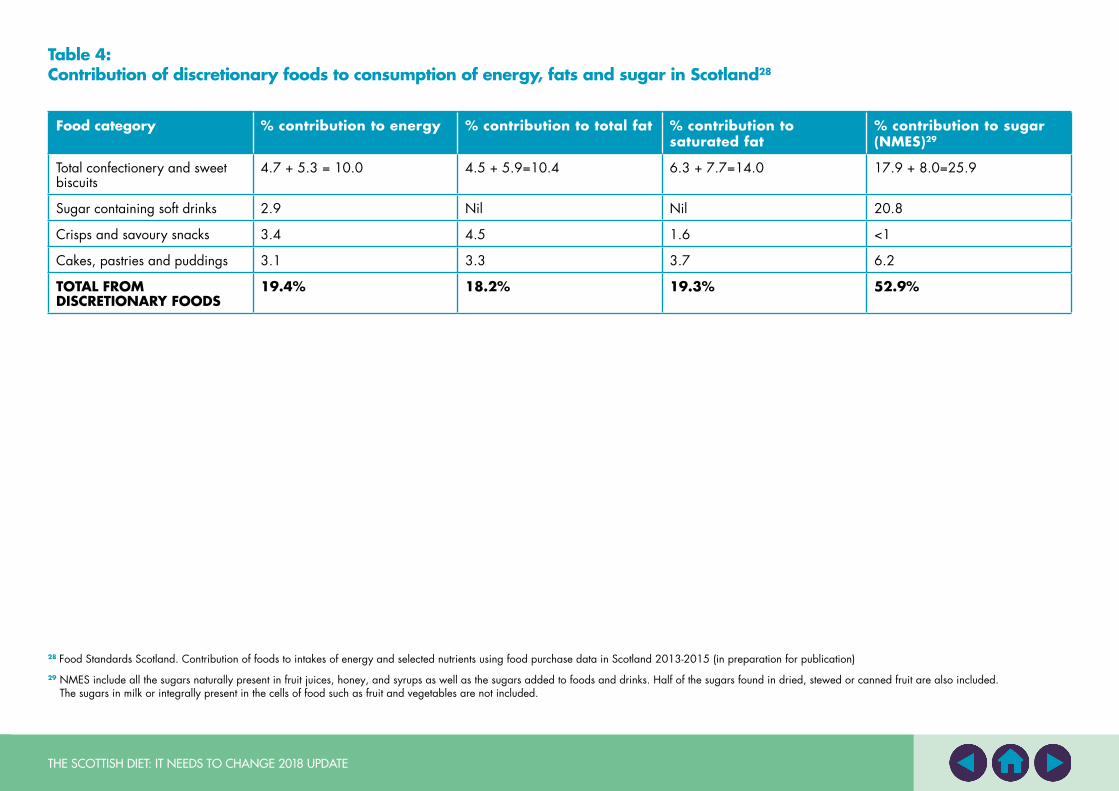
Table 4: Contribution of discretionary foods to consumption of energy, fats and sugar in Scotland28
Food category % contribution to energy % contribution to total fat % contribution to saturated fat
% contribution to sugar (NMES)29
Total confectionery and sweet biscuits
4.7 + 5.3 = 10.0 4.5 + 5.9=10.4 6.3 + 7.7=14.0 17.9 + 8.0=25.9
Sugar containing soft drinks 2.9 Nil Nil 20.8
Crisps and savoury snacks 3.4 4.5 1.6 <1
Cakes, pastries and puddings 3.1 3.3 3.7 6.2
TOTAL FROM DISCRETIONARY FOODS
19.4% 18.2% 19.3% 52.9%
28FoodStandardsScotland.ContributionoffoodstointakesofenergyandselectednutrientsusingfoodpurchasedatainScotland2013-2015(inpreparationforpublication)
29NMESincludeallthesugarsnaturallypresentinfruitjuices,honey,andsyrupsaswellasthesugarsaddedtofoodsanddrinks.Halfofthesugarsfoundindried,stewedorcannedfruitarealsoincluded.Thesugarsinmilkorintegrallypresentinthecellsoffoodsuchasfruitandvegetablesarenotincluded.
THE SCOTTISH DIET: IT NEEDS TO CHANGE 2018 UPDATE32
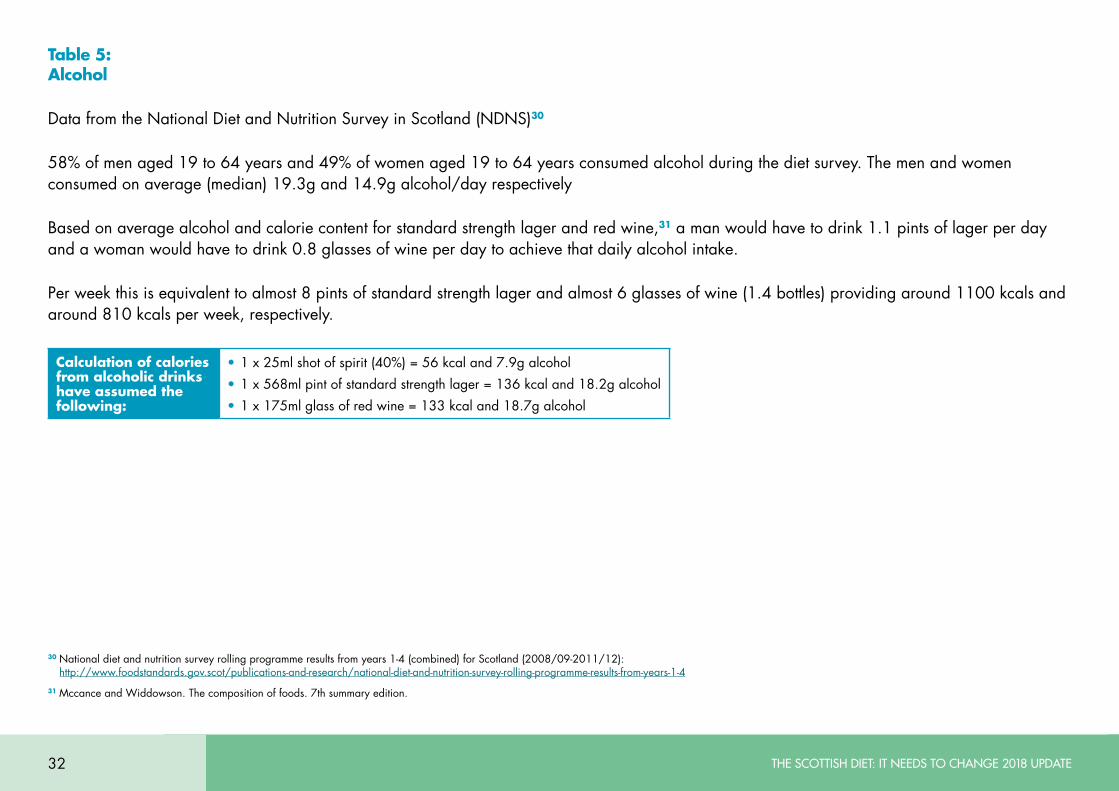
Table 5: Alcohol
Data from the National Diet and Nutrition Survey in Scotland (NDNS)30
58% of men aged 19 to 64 years and 49% of women aged 19 to 64 years consumed alcohol during the diet survey. The men and women consumed on average (median) 19.3g and 14.9g alcohol/day respectively
Based on average alcohol and calorie content for standard strength lager and red wine,31 a man would have to drink 1.1 pints of lager per day and a woman would have to drink 0.8 glasses of wine per day to achieve that daily alcohol intake.
Per week this is equivalent to almost 8 pints of standard strength lager and almost 6 glasses of wine (1.4 bottles) providing around 1100 kcals and around 810 kcals per week, respectively.
Calculation of calories from alcoholic drinks have assumed the following:
• 1 x 25ml shot of spirit (40%) = 56 kcal and 7.9g alcohol
• 1 x 568ml pint of standard strength lager = 136 kcal and 18.2g alcohol
• 1 x 175ml glass of red wine = 133 kcal and 18.7g alcohol
30 National diet and nutrition survey rolling programme results from years 1-4 (combined) for Scotland (2008/09-2011/12): http://www.foodstandards.gov.scot/publications-and-research/national-diet-and-nutrition-survey-rolling-programme-results-from-years-1-4
31MccanceandWiddowson.Thecompositionoffoods.7thsummaryedition.
THE SCOTTISH DIET: IT NEEDS TO CHANGE 2018 UPDATE 33
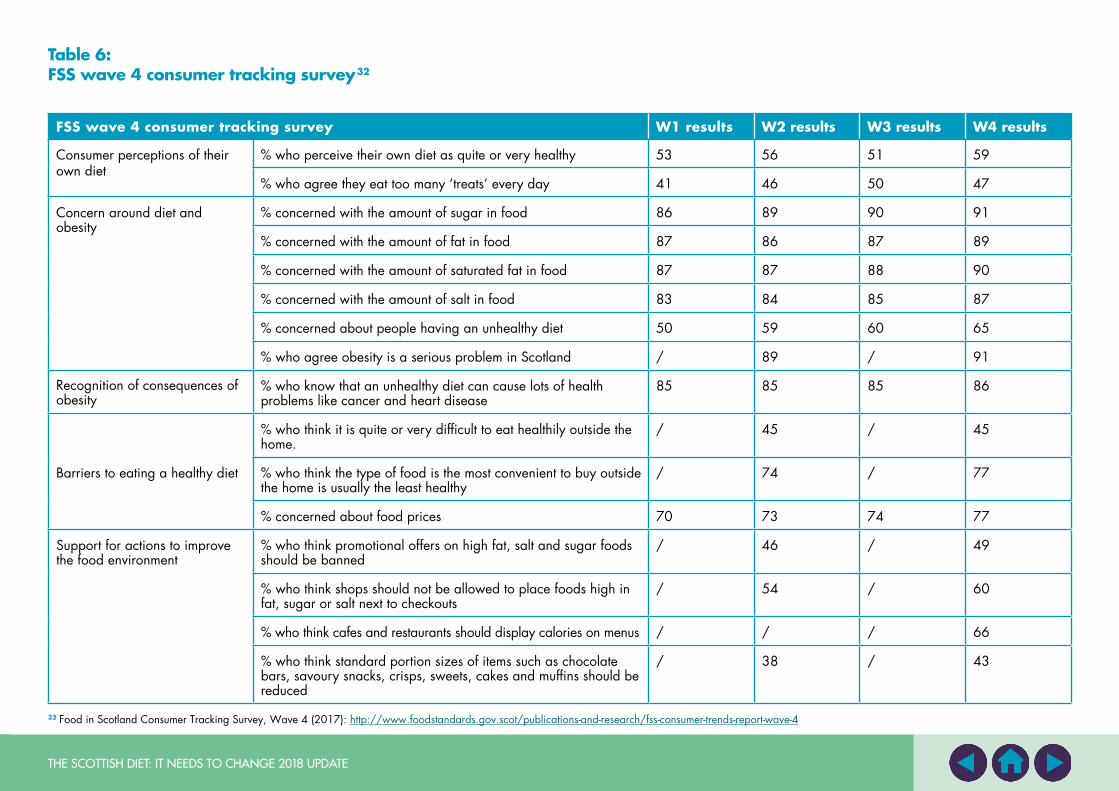
Table 6: FSS wave 4 consumer tracking survey132
32FoodinScotlandConsumerTrackingSurvey,Wave4(2017):http://www.foodstandards.gov.scot/publications-and-research/fss-consumer-trends-report-wave-4
FSS wave 4 consumer tracking survey W1 results W2 results W3 results W4 results
Consumer perceptions of their own diet
% who perceive their own diet as quite or very healthy 53 56 51 59
% who agree they eat too many ‘treats’ every day 41 46 50 47
Concern around diet and obesity
% concerned with the amount of sugar in food 86 89 90 91
% concerned with the amount of fat in food 87 86 87 89
% concerned with the amount of saturated fat in food 87 87 88 90
% concerned with the amount of salt in food 83 84 85 87
% concerned about people having an unhealthy diet 50 59 60 65
% who agree obesity is a serious problem in Scotland / 89 / 91
Recognitionofconsequencesofobesity
% who know that an unhealthy diet can cause lots of health problems like cancer and heart disease
85 85 85 86
Barriers to eating a healthy diet
% who think it is quite or very difficult to eat healthily outside the home.
/ 45 / 45
% who think the type of food is the most convenient to buy outside the home is usually the least healthy
/ 74 / 77
% concerned about food prices 70 73 74 77
Support for actions to improve the food environment
% who think promotional offers on high fat, salt and sugar foods should be banned
/ 46 / 49
% who think shops should not be allowed to place foods high in fat, sugar or salt next to checkouts
/ 54 / 60
% who think cafes and restaurants should display calories on menus / / / 66
% who think standard portion sizes of items such as chocolate bars, savoury snacks, crisps, sweets, cakes and muffins should be reduced
/ 38 / 43
THE SCOTTISH DIET: IT NEEDS TO CHANGE 2018 UPDATE34
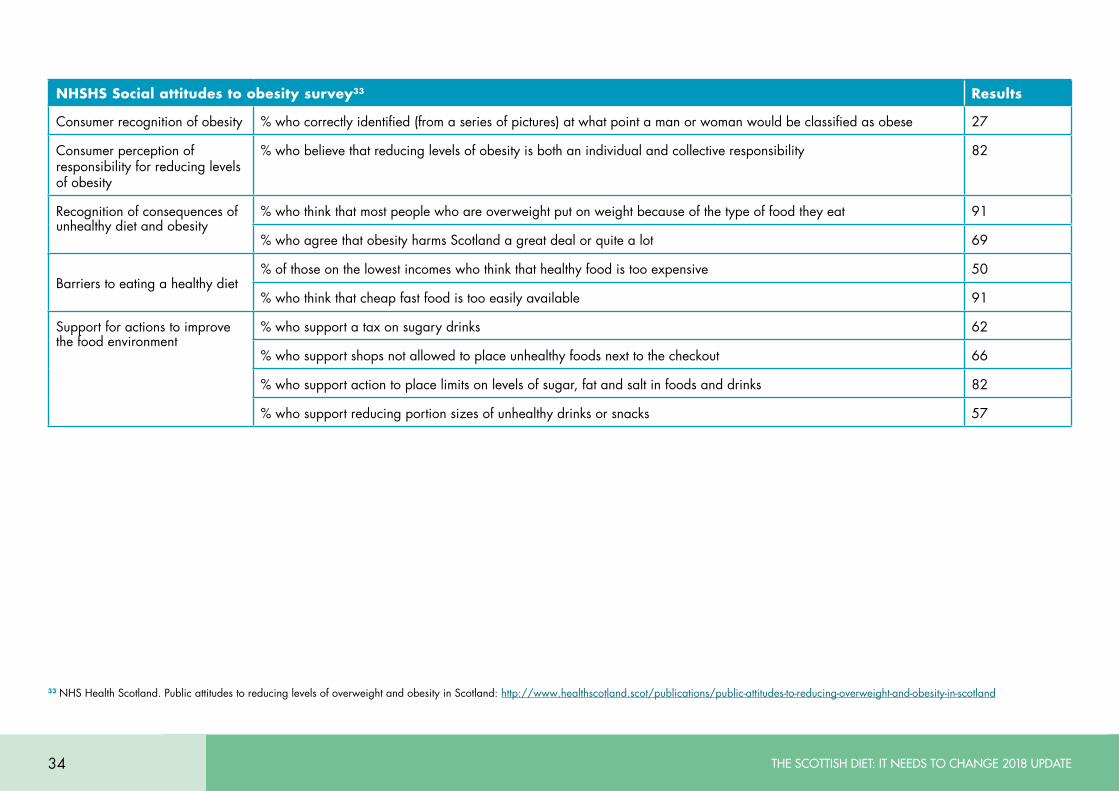
NHSHS Social attitudes to obesity survey33 Results
Consumer recognition of obesity % who correctly identified (from a series of pictures) at what point a man or woman would be classified as obese 27
Consumer perception of responsibility for reducing levels of obesity
% who believe that reducing levels of obesity is both an individual and collective responsibility 82
Recognition of consequences of unhealthy diet and obesity
% who think that most people who are overweight put on weight because of the type of food they eat 91
% who agree that obesity harms Scotland a great deal or quite a lot 69
Barriers to eating a healthy diet% of those on the lowest incomes who think that healthy food is too expensive 50
% who think that cheap fast food is too easily available 91
Support for actions to improve the food environment
% who support a tax on sugary drinks 62
% who support shops not allowed to place unhealthy foods next to the checkout 66
% who support action to place limits on levels of sugar, fat and salt in foods and drinks 82
% who support reducing portion sizes of unhealthy drinks or snacks 571
33NHSHealthScotland.PublicattitudestoreducinglevelsofoverweightandobesityinScotland:http://www.healthscotland.scot/publications/public-attitudes-to-reducing-overweight-and-obesity-in-scotland
THE SCOTTISH DIET: IT NEEDS TO CHANGE 2018 UPDATE 35
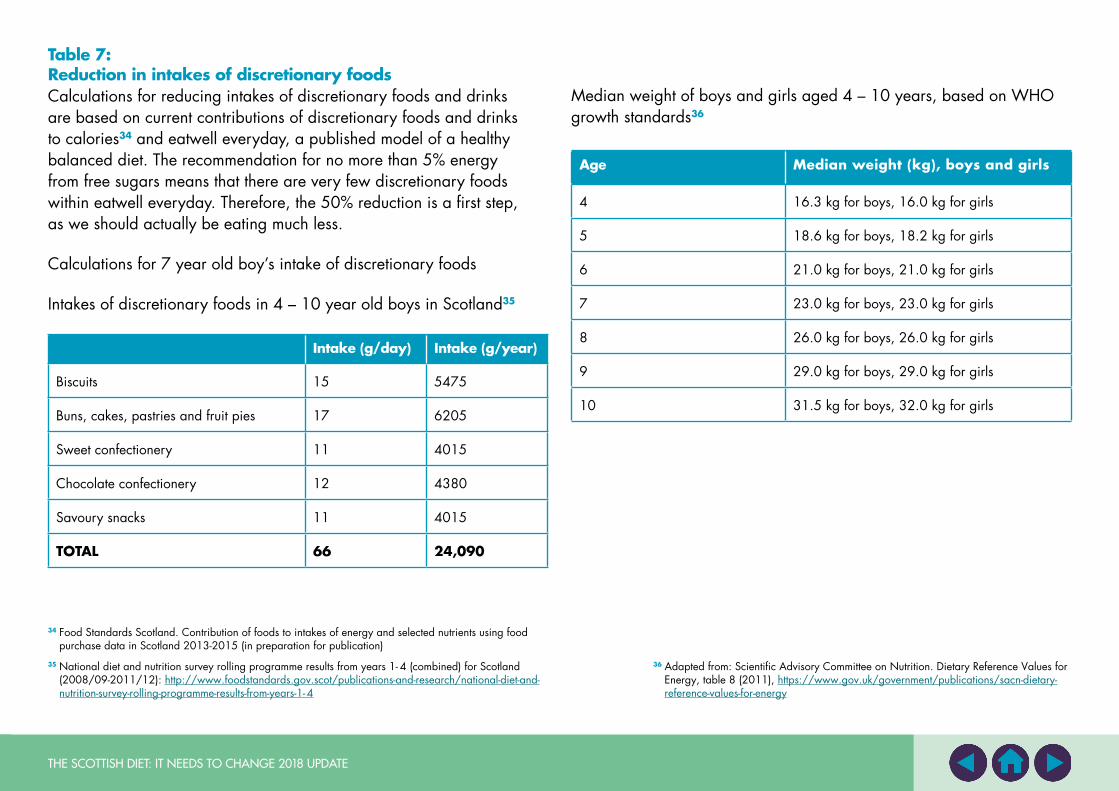
Table 7: Reduction in intakes of discretionary foodsCalculations for reducing intakes of discretionary foods and drinks are based on current contributions of discretionary foods and drinks to calories34 and eatwell everyday, a published model of a healthy balanced diet. The recommendation for no more than 5% energy from free sugars means that there are very few discretionary foods within eatwell everyday. Therefore, the 50% reduction is a first step, as we should actually be eating much less.
Calculations for 7 year old boy’s intake of discretionary foods
Intakes of discretionary foods in 4 – 10 year old boys in Scotland35
Intake (g/day) Intake (g/year)
Biscuits 15 5475
Buns, cakes, pastries and fruit pies 17 6205
Sweet confectionery 11 4015
Chocolate confectionery 12 4380
Savoury snacks 11 4015
TOTAL 66 24,090
Median weight of boys and girls aged 4 – 10 years, based on WHO growth standards36
Age Median weight (kg), boys and girls
4 16.3 kg for boys, 16.0 kg for girls
5 18.6 kg for boys, 18.2 kg for girls
6 21.0 kg for boys, 21.0 kg for girls
7 23.0 kg for boys, 23.0 kg for girls
8 26.0 kg for boys, 26.0 kg for girls
9 29.0 kg for boys, 29.0 kg for girls
10 31.5 kg for boys, 32.0 kg for girls
36Adaptedfrom:ScientificAdvisoryCommitteeonNutrition.DietaryReferenceValuesforEnergy,table8(2011),https://www.gov.uk/government/publications/sacn-dietary-reference-values-for-energy
34FoodStandardsScotland.ContributionoffoodstointakesofenergyandselectednutrientsusingfoodpurchasedatainScotland2013-2015(inpreparationforpublication)
35Nationaldietandnutritionsurveyrollingprogrammeresultsfromyears1-4(combined)forScotland(2008/09-2011/12):http://www.foodstandards.gov.scot/publications-and-research/national-diet-and-nutrition-survey-rolling-programme-results-from-years-1- 4
THE SCOTTISH DIET: IT NEEDS TO CHANGE 2018 UPDATE36
foodstandards.gov.scot
Food Standards Scotland is the food body for Scotland and is here to promote healthier eating, to keep the food we eat safe and to make sure we know the food we’re eating is what it says it is on the label.
Food Standards Scotland’s nutrition remit – to put the consumer first in improving the Scottish diet – commits us to working with government, the food industry, health professionals and the media as well as the public themselves to achieve healthier eating in Scotland.
To read more about what we do and to keep up to date with our news, visit
www.foodstandards.gov.scot
Food Standards Scotland 4th floor Pilgrim House Aberdeen AB11 5RL
01224 285 100
Food Standards Scotland