Embed Size (px)
Citation preview

DIALOGUE FOR SUSTAINABLE MANAGEMENT OF TRANS-BOUNDARY WATER REGIMES IN SOUTH ASIA
Situation Analysis on
INTERNATIONAL UNIONFOR CONSERVATION OF NATURE
Asia Regional Office63 Sukhumvit Soi 39Bangkok 10110, ThailandTel: +66 2 662 4029Fax: +66 2 662 4389www.iucn.org/asia
Bangladesh Country OfficeHouse 16, Road 2/3, BananiDhaka 1213, BangladeshTel: +8802 9890423Fax: +8802 9892854www.iucn.org/bangladesh
India Country Office2nd Floor, 20 Anand Lok, AugustKranti Marg, New Delhi 110049, IndiaTel/Fax: +91 11 4605 2583www.iucn.org/india
Climate Change

1Ecosystems for Life • Inland Navigation

1Ecosystems for Life • Inland Navigation
Situation Analysis on Climate Change
K Shreelakshmi
Chandan Mahanta
Nandan Mukherjee and Malik Fida Abdullah Khan
Nityananda Chakravorty
Ecosystems for Life: A Bangladesh-India Initiative

Inland Navigation • Ecosystems for Life2
The designation of geographical entities in this book, and the presentation of the material, do not imply the expression of any opinion whatsoever on the part of IUCN concerning the legal status of any country, territory, administration, or concerning the delimitation of its frontiers or boundaries. The views expressed in this publication are authors’ personal views and do not necessarily reflect those of IUCN.
This initiative is supported by the Minister for European Affairs and International Cooperation, the Netherlands.
Published by: IUCN Asia Regional Office; IUCN Bangladesh Country Office; IUCN India Country Office; IUCN Gland, Switzerland
Copyright: © 2012 IUCN, International Union for Conservation of Nature and Natural Resources
Reproduction of this publication for educational or other non-commercial purposes is authorized without prior written permission from the copyright holder provided the source is fully acknowledged.
Reproduction of this publication for resale or other commercial purposes is prohibited without prior written permission of the copyright holder.
Citation: IUCN (2012) Situation Analysis on Climate Change, Ecosystems for Life: A Bangladesh-India Initiative, IUCN, International Union for Conservation of Nature.
Coordination: Ganesh Pangare, Bushra Nishat
Editorial design: Pradip Saha
Copy editing: Pratap Pandey
Cover Photo by: IUCN Bangladesh
Cover design by: Sheikh Asaduzzaman and A. J. M. Zobaidur Rahman
Available from: IUCN (International Union for Conservation of Nature) Asia Regional Office, Bangkok Bangladesh Country Office, Dhaka India Country Office, New Delhi
www.iucn.org/E4L

3Ecosystems for Life • Climate Change Situation Analysis
Preface
Bangladesh and India share three major river systems: the Ganga, the Brahmaputra and the Meghna. Along with their tributaries, these rivers drain about 1.75 million sq km of land, with an average runoff of 1,200 cu km. The GBM system also supports over 620 million people. Thus, the need for cooperation on trans-boundary waters is crucial to the future well-being of these millions.
That is precisely the motivation for the Ecosystems for Life: A Bangladesh- India Initiative (Dialogue for Sustainable Management of Trans-boundary Water Regimes in South Asia) project. IUCN wishes to promote a better understanding of trans-boundary ecosystems between Bangladesh and India, by involving civil society in both counries and by providing a platform to discuss issues common and germane to the region. The overall goal is an improved, integrated management of trans-boundary water regimes in South Asia. The Ecosystems for Life is guided by a Project Advisory Committee (PAC) of eminent persons from Bangladesh and India. This four-and-a-half year initiative is supported by the Minister for European Affairs and International Cooperation, the Netherlands.
Ecosystems for Life will develop, through dialogue and research, longer-term relationships between various stakeholder groups within and between the countries. It will develop a common understanding to generate policy options on how to develop and manage natural resources sustainably such that livelihoods and water and food security improve. Inter-disciplinary research studies will be conducted by bringing together experts from various fields from both countries so that relevant issues are holistically grasped.
The initiative centres around five broad thematic areas:• food security, water productivity and poverty; • impacts of climate change; • inland navigation; • environmental security; and • biodiversity conservation.
The first phase of the project concentrated on creating ‘situation analyses’ on each thematic area. Each analysis set identified core issues vis-a-vis a thematic area, their significance within the India-Bangladesh geographic focus, research gaps and needs and, ultimately, priority areas for joint research.
Studies were taken up in the later part of 2010 and early 2011. Authors discussed their points-of-view at a joint exercise; they shared their research. After due PAC review, the ensuing material was further circulated among multiple stakeholders in both countries. All outcomes of this dialogic process are incorporated in the final papers. 16 situation analyses related to the five thematic areas are now complete and ready for publication. We will also subsequently publish summary briefs, based on these studies. The initiative, thus, has taken a big step; now, the agenda for meaningful joint research is clear.
IUCN hopes these publications will be useful to academics, researchers and practitioners in the GBM region.

Climate Change Situation Analysis • Ecosystems for Life4
The Ganga-Brahmaputra-Meghna (GBM) region
River Ganga Brahmaputra Meghna
Length1 (km) 2,510 2,900 210
Catchment2 (sq km) 10,87,300 5,52,000 82,000
Total area of GBM region: 17,21,300 sq kmSource: 1. Average, based on various data; 2. Joint River Commission figures

5Ecosystems for Life • Climate Change Situation Analysis
Contents
CLIMATE ChANGE | INdIA
Impacts in India: key issues 7– K Shreelakshmi
CLIMATE ChANGE | INdIA
Climate change impacts and north-east India 55– Chandan Mahanta
CLIMATE ChANGE | BANGLAdESh
Impacts on hydro-meteorology: a research agenda 83– Nandan Mukherjee and Malik Fida Abdullah Khan
CLIMATE ChANGE | BANGLAdESh
What will happen when climate change occurs? 107– Nityananda Chakravorty

Climate Change Situation Analysis • Ecosystems for Life6
© Pradip Saha

7Ecosystems for Life • Climate Change Situation Analysis
India and Bangladesh face many common challenges. Even as their overlapping geographies force them to share a climate, with its associated vulnerabilities, their use of common resources like water means that actions in one country can profoundly impact the other. As the impacts of climate
change begin to set in, the commonalities in the former will lend greater urgency to the relationship in the latter. As both countries begin to face ever increasing temperatures and ever more erratic precipitation, they will be forced to find greater common cause in their shared water resources. In this spirit, the International Union for the Conservation of Nature (IUCN) has begun an international effort, examining India and Bangladesh’s shared water resources in an attempt to facilitate dialogue and promote cooperation in areas such as food, livelihood and climate change. This study is part of that effort, focusing on climate change and representing the Indian perspective. The Ganga-Brahmaputra-Meghna (GBM) region is the geographic focus of this analysis. It was selected due to its incredible importance in terms of supplying water and livelihoods to both countries, while occupying a significant area of India and the entirety of Bangladesh. We focus specifically on the India part of the GBM region, only on those states which fall within one of three river basins. For the Ganga basin, these include Bihar, Delhi, Haryana, Himachal Pradesh, Jharkhand, Madhya Pradesh, Rajasthan, Uttarakhand, Uttar Pradesh and West Bengal. The states falling within the Brahmaputra basin are Sikkim, Nagaland, Meghalaya, Assam, and Arunachal Pradesh. The states falling in the Meghna basin are Tripura, Manipur, Mizoram and Meghalaya, though the vast majority of this state lies in the Brahmaputra basin. Though Nepal and Bhutan are also part of the GBM region, these countries fall outside the scope of study and will be mentioned only when directly relevant. Our purpose is to arrive at a situation analysis of the impacts of climate change in the GBM basin, including the social, environmental and economic implications, especially for India. Additionally, we identify research knowledge gaps, to serve as a guide for future research in climate change and cooperation between India and Bangladesh. The knowledge gaps, described throughout, are taken directly and almost exclusively from the information in prior case studies and literature reviews; to that extent, this element of the paper could be considered a sort of meta-study, synthesizing the knowledge gaps identified by prior efforts.
CLIMATE ChANGE | INdIA
Impacts in India: key issuesK Shreelakshmi

Climate Change Situation Analysis • Ecosystems for Life8
Key issues and thesisThis situation analysis will proceed first by giving a background on the GBM region, including relevant demographic, geographic, hydrological and social statistics; relevant information in these areas will also be given for India’s GBM states. In terms of geography/demography, the ratio of the GBM falling in Bangladesh and India will be given and the sheer size of the area and accompanying population will be emphasized. In the hydrological section, the contrasting descriptions of a region blessed with bountiful water resources yet ravaged by water scarcity will be illuminated and explained. In the social section, special attention will be given to the rampant poverty and associated climate vulnerability of the GBM basin. We then proceed to the impacts, first describing the basin-wide environmental impacts of climate change with a focus on increased intense precipitation events, glacial melt and temperature rise, as well as the implications for ecological flows and water quality, among other issues. Subsequently, India-specific environmental information will be given. Economic impacts will be briefly discussed then; the primary focus being impacts in the agricultural sector, a concentration justified both by the sector’s economic significance (especially in terms of employment), water dependence and incredible vulnerability. In discussing social impacts, we will take a vulnerability focus, combining the social, demographic and livelihood information with the environmental impacts, to look at the social ramifications of climate change in India. Special attention will also be paid to health issues, specifically malaria. We will also examine various resource conflicts, before shifting focus to the political implications of climate-induced migrations, specifically from Bangladesh to India. Throughout, knowledge gaps identified by prior studies will be given. Finally, we will turn to policy and governance solutions. The focus here will be on India-only measures, namely steps that can be taken to reduce economic water scarcity in the north-east region. Adaptation-related knowledge gaps will also be highlighted. We then proceed to cooperative solutions, providing a brief background on the relationship between India and Bangladesh and existing cooperative measures, before turning to possible areas of cooperation including flood management, water sharing agreements, lean-season flow augmentation and water quality. With respect to lean-season augmentation, we recommend tri-lateral, multi-purpose water storage projects in Nepal. As before, knowledge gaps will be highlighted. We conclude by giving a framework for understanding climate change impacts in India. Subsequently, it will outline a way forward in cooperation, before concluding with suggestions for future research. n The GBM region
The GBM region is the second largest hydrological region in the world, bested only by the Amazon. Covering 1.2% of the world’s landmass, it is also home to 10% of the world’s population (Biswas, 2008). India and Bangladesh dominate the GBM region (see Table 1). The fact that India has such a large population residing in the GBM region should make it especially concerned about climate developments there. Bangladesh, despite accounting for less than one-third of India’s contribution to the GBM region, has a significantly higher population density; this statistic is critical when considering matters like vulnerability to flood. Both India and Bangladesh, moreover, are likely to register an increase in this statistic, for both expect majority urban populations by 2025, rising from 27% and 20% for India and Bangladesh respectively (Biswas 2008). If the GBM region is broken down by country and individual basin, we see the Ganga basin comprises well over half of the region’s total area (see Table 2). The Brahmaputra comes in a distant

9Ecosystems for Life • Climate Change Situation Analysis
second; the Meghna basin is just a little over 5%. Hence, in this analysis, the Ganga and Brahmaputra basins receive the lion’s share of focus. Notice the extent to which India dominates the total land area of the GBM basin (see Table 3). Also notice that, while India comprises a majority of the basin’s area, the GBM region covers all of Bangladesh’s total area. Thus, the actions of the far larger, and upper riparian, India have a tremendous impact on Bangladesh, a fact whose significance will become clearer later. The fact that Bangladesh’s share of the GBM population (20%) dwarfs its share of the land area (8.44%) underscores the limits of its influence on the GBM basin relative to its propensity to be impacted by it. Let us now look at some additional facts about the GBM region (see Table 4, p10). A few key points emerge. While the Ganga basin’s drainage area is roughly commensurate with its total land area (104.78 mha), both the Brahmaputra and Meghna basins drain an area larger than their actual surface area. In the former’s case, the drainage area is nearly double the actual land area. This
Table 1: GBM region, country-wise population
Total (millions)
% of total GBM pop
Population density (/ha)
India 405.4 75.66 3.57Bangladesh 110 20.53 9Bhutan 1.5 0.28 0.33Nepal 18.9 3.53 1.28Total 535.8 100% 3.7
Sources: Shah 2001
Table 2: The GBM region, by basin (million ha)
Ganga Brahmaputra Meghna Minor rivers TotalIndia 86.14 19.44 4.17 3.63 113.38Bangladesh 3.9 4.7 3.62 12.22Bhutan 0 4.5 0 0 4.5Nepal 14.7 0 0 0 14.7Total 104.74 28.64 7.79 3.63 144.8
Source: Shah 2001
Table 3: Share of GBM area, by country (%)
Ganga Brahmaputra Meghna + minor rivers
GBM total
India 82.24 67.88 68.3 78.3Bangladesh 3.73 16.41 31.7 8.44
Source: Shah, 2001

Climate Change Situation Analysis • Ecosystems for Life10
demonstrates how significant the Brahmaputra is in terms of water resources, while foreshadowing its propensity for flooding. The GBM region also appears to have ample arable land, concentrated almost entirely in the Ganga basin. It appears over half of the GBM’s area is arable (see tables 1 to 4), though more recent estimates put the share at 45% (Biswas, 2008).1 Yet, the numbers we see belie a much harsher reality: the per capita availability of arable land is only 1/10th per hectare, less than half the world average (Biswas, 2008; Samarakoon, 2004). Thus, each bit of land in the GBM region is far more precious, a fact to keep in mind when considering flood damage and land degradation data presented later.
The Indian GBM statesIn looking at population data for the Indian states that comprise the GBM region (see Table 5), it should be noted the information is state-wise, rather than strictly within the boundaries of the GBM basin, resulting in an overall increase in population; this discrepancy will appear a few more times throughout the course of the analysis but will only pointed out if it is deemed critical to the conclusions reached. The population of the Indian GBM states is large, dense and growing rapidly. Even after removing the outlier of Delhi, the total growth rate only drops down to a little over 26%. This growing population will have an increasing impact on the water resources of the GBM region and be increasingly impacted by the resulting scarcity. Note that the three largest states, Uttar Pradesh, Bihar and West Bengal, are also some of the critical states in terms of proximity to Bangladesh. Bihar and West Bengal also have the highest population densities, excluding Delhi. The large and dense population of these key states will be very significant in regards to the discussion of climate change impacts later on. It also bears mentioning that the sex ratio of this region is even more skewed towards men than the Indian average of 933 females per 1,000 males; a possible explanation is the large number of landless labourers, possibly migrants from other areas, working in the agricultural sector of this region. Looking at the way the population is distributed (see Table 6, p 12), the India GBM states are comparatively more rural than India’s 27.82% urban population; when the outlier of Delhi is removed, the percentage of urban population drops to a little under 22% in the GBM states. Unsurprisingly, livelihood statistics presented later will confirm that the area’s relatively higher proportion of rural population is matched by a large agriculture sector. Aside from the two peripheral states of Madhya Pradesh and Rajasthan, Uttar Pradesh is by far the largest state in the India GBM. Interestingly, West Bengal has a cropping intensity near that of tiny Delhi, demonstrating the importance of agriculture here. The India GBM has a relatively higher cropping intensity than the national average; the average would be higher if not for the relative lack of agricultural development in the north-eastern states of Tripura, Sikkim, Manipur, Mizoram and, to
Table 4: Key facts about the GBM region, by basin
Ganga Brahmaputra Meghna GBMDrainage area (mha) 108 58 8.5 174.5Estimated Population (1996; in millions)
427 82 49 558
Arable Land (mha) 65.8 9.3 4 79.1
Source: Adhikari et al., 2000

11Ecosystems for Life • Climate Change Situation Analysis
a lesser extent, Meghalaya. Low cropping intensities in the north-east indicate lack of water resource development, a subject tackled in the policy and governance section of this analysis. Relative to their sizes, Assam and Bihar have very large areas of land not available for cultivation. Also, Arunachal Pradesh’s forest cover is extensive – the largest in the India GBM, despite its small size.
The GBM region: water resourcesThe GBM region is richly endowed with water (see Tables 7 and 8, p 13). Annual water availability is 771,400 cubic metres per sq km, compared to a world average of 269,000 cu m/sq km (Biswas, 2008; Samarakoon, 2004). The estimated annual flow lies between 1,150 BCM (Bandopadhyay and Ghosh, 2009) and 1,350 BCM (Biswas, 2008; Samarakoon, 2004), with about half of the flows coming from the Brahmaputra (Biswas, 2008). The fact that the Brahmaputra is a shorter river than the Ganga and has a smaller catchment area, yet contains a greater annual flow, suggests that it is very flood-prone. Also, Nepal adds 20 mha to the surface water of the Ganga, making the total available surface water in that basin higher (Shah, 2001). Thus, India contributes 75% of the water for the GBM region: 69% of the Ganga, 84% of the Brahmaputra and 61% of the Meghna and associated smaller rivers (Shah,
Table 5: The densely populated India GBM states (2001 Census)
State/ UT Person Males Females Sex Ratio Density per Sq. Km.
Growth rate (1991-01)
Himachal Pradesh 6,077,900 3,087,940 2,989,960 968 109 17.54Uttaranchal 8,489,349 4,325,924 4,163,425 962 159 19.34Haryana 21,144,564 11,363,953 9,780,611 861 478 28.43Delhi 13,850,507 7,607,234 6,243,273 821 9340 47.02Rajasthan 56,507,188 29,420,011 27,087,177 921 165 28.41Uttar Pradesh 166,197,921 87,565,369 78,632,552 898 690 25.91Bihar 82,998,509 43,243,795 39,754,714 919 881 28.62Sikkim 540,851 288,484 252,367 875 76 33.06Arunachal Pradesh 1,097,968 579,941 518,027 893 13 27Nagaland 1,990,036 1,047,141 942,895 900 120 64.53Manipur1 2,166,788 1,095,634 1,071,154 978 104 17.94Mizoram 888,573 459,109 429,464 935 42 28.82Tripura 3,199,203 1,642,225 1,556,978 948 305 16.03Meghalaya 2,318,822 1,176,087 1,142,735 972 103 30.65Assam 26,655,528 13,777,037 12,878,491 935 340 18.92West Bengal 80,176,197 41,465,985 38,710,212 934 903 17.77Jharkhand 26,945,829 13,885,037 13,060,792 941 338 23.36Madhya Pradesh 60,348,023 31,443,652 28,904,371 919 196 24.26Total 561,593,756 293,474,558 268,119,198 921.11 797.89 27.65
Note: Manipur and India count excludes those of three sub-divisions where population census was cancelled due to technical and administrative reasons, although a population census was carried out; Source: Registrar General of India

Climate Change Situation Analysis • Ecosystems for Life12
2001). India’s contribution is so much greater than Bangladesh’s due in part to the role of its glaciers (see Table 9); by contrast, it contributes only slightly more than Bangladesh in the Meghna basin, which is entirely dependent on rainfall (Mall et al, 2006). The low levels of glaciation, with an average (range) of 3.2% (4-10%) in the Ganga and 1.3% (0.4-4%) in the Brahmaputra, indicate that precipitation supplies the bulk of the water resources in the GBM region in the form of the annual monsoon (Mall et al, 2006). Available data shows that 80% of annual rainfall occurs within a 3-5 month span (Biswas, 2008; Shah, 2001). However, the reality is that precipitation occurs in about 3-5 intense spells of a few days, if not hours, bringing the total number of precipitation days to only 30-40 (Shah, 2001). Because so much water comes in these intense but brief spurts, the amount of surface water actually utilizable to these countries differs greatly from the amount contributed or available. For example, during the monsoon season, 50% of the Ganga flows into the sea, unused (Shah, 2001). India utilises 32% of the available surface water of the Ganga, but only 4% of the Brahmaputra and Meghna combined, for a total of 19 mha of utilisable surface water in the GBM region, though prospective dams in Nepal could bring that number to 20-24 mha (Shah, 2001). Bangladesh has
Table 6: Population distribution in the India GBM states (2001 Census)
State/Ut Rural Urban Total Urban Population (%)
Himachal Pradesh 5,482,319 595,581 6,077,900 9.8Uttaranchal 6,310,275 2,179,074 8,489,349 25.67Haryana 15,029,260 6,115,304 21,144,564 28.92Delhi 944,727 12,905,780 13,850,507 93.18Rajasthan 43,292,813 13,214,375 56,507,188 23.39Uttar Pradesh 131,658,339 34,539,582 166,197,921 20.78Bihar 74,316,709 8,681,800 82,998,509 10.46Sikkim 480,981 59,870 540,851 11.07Arunachal Pradesh 870,087 227,881 1,097,968 20.75Nagaland 1,647,249 342,787 1,990,036 17.23Manipur1 1,590,820 575,968 2,166,788 26.58Mizoram 447,567 441,006 888,573 49.63Tripura 2,653,453 545,750 3,199,203 17.06Meghalaya 1,864,711 454,111 2,318,822 19.58Assam 23,216,288 3,439,240 26,655,528 12.9West Bengal 57,748,946 22,427,251 80,176,197 27.97Jharkhand 20,952,088 5,993,741 26,945,829 22.24Madhya Pradesh 44,380,878 15,967,145 60,348,023 26.46Total 432,887,510 128,706,246 561,593,756 25.76
Note: India and Manipur count exclude those of the three sub-divisions Mao Maram, Paomata and Purul of Senapati district of Manipur.Source: Registrar General of India

13Ecosystems for Life • Climate Change Situation Analysis
between 20-24 mha of utilizable surface water, but this number represents a paltry 13-15% of the total available water (Shah, 2001), a result of both underdevelopment of storage infrastructure and the fact that 80% of its total run-off comes between June and September (Ahmad and Ahmed, 2004). Furthermore, 75% of the total volume of water drained by Bangladesh comes from India, making it very dependent on actions by its upper riparian neighbour (Ahmad and Ahmed, 2004).
Table 7: Basin-wise water resources in the GBM region
Rivers Length (km) Catchment area (km2) potential in river
Average annual water usage (km3)
Ganga 2525 861452+ 525.02Brahmaputra 916 194413+ 629.05Barak/Meghna, associated rivers
NA 41723+ 48.36
Total* 3441 1097588+ 1202.43
Note: Totals excludes rivers for which data was not available; Source: Gosain and Rao 2005
Table 8: Average annual surface water flows, India and Bangladesh (mha)
Ganga Brahmaputra Meghna TotalIndia 52.5 53.72 7.93 114.15Bangladesh 3.4 10.25 5.1 18.75
Source: Shah 2001
Table 9: Principal glacier-fed river systems of the Himalayas
River Major river system Mountain area (sq km) Glacier (sq km) % GlaciationJamuna
Ganga
11655 125 1.10Ganga 23051 2312 10.00Ramganga 6734 3 0.04Kali 16317 997 6.01Karnali 53354 1543 2.90Gandar 37814 1845 4.90Kosi 61901 1281 2.10Tista
Brahmaputra
12432 495 4.00Raikad 26418 195 0.70Nanas 31080 528 1.70Subansiri 81130 725 4.00Brahmaputra 256928 108 0.40Dibang 12950 90 0.70Lunit 20720 425 2.00
Source: Hasnain et al., 1999

Climate Change Situation Analysis • Ecosystems for Life14
GroundwaterThe total available groundwater resources in the GBM region are about 230 BCM (Biswas, 2008; for India and Bangladesh, see Table 10). India is blessed with far greater groundwater resources than Bangladesh, relying primarily on the Ganga basin. Currently, groundwater development in the Ganga basin is at 34% (Chadha, 2003). Bangladesh’s limited groundwater resources are also quite stressed, potentially resulting in arsenic contamination, which has plagued the region.
Water qualityWater quality in the GBM region represents a serious challenge: over 50% of morbidity in region is related to unsafe drinking water (Biswas, 2008). The primary contaminants include salinity ingress and arsenic concentrations and the primary sources of pollution are intensive agriculture and industrial pollution (Adhikari et al, 2000). Gradually diminishing dry season flows will continue to drive down the water quality of the GBM region, an issue tackled in the environmental impacts section of this analysis.
Knowledge gapsA number of knowledge gaps exist related to the hydrological flows of groundwater and surface water (Bandopadhyay, 2006). A clear example is the lack of a basin-wise breakdown of groundwater resources in Bangladesh (see Table 10). Other examples include modelling of changing river flows, which occurs quite often in the GBM basin (Gosain and Rao, 2003; Bandopadhyay and Ghosh, 2009).
Water resources: focus on IndiaThe India GBM accounts for 60-63% of India’s surface water resources (Shah, 2001; see Table 11) and represents 43% of the catchment area of its major rivers (Gosain and Rao, 2003). The total water resources potential of India is 1,869 km3 (Gosain and Rao, 2003). India receives a total of 4,000 km3 in annual precipitation, but this total exhibits tremendous compression, for temporal variability varies greatly (Gosain and Rao, 2003). For example, even within the Ganga basin, the averages range from 350 mm in the West, 1,000 mm in the middle and between 1,500-2000 mm near the Bengal delta (Ahmad and Ahmad, 2004). Due to the intense rainfall associated with the monsoon described above, 45% of average rainfall/snowfall in India is wasted as run-off to the sea (Mall et al, 2006). Clearly, irrigation is the dominant water user and 83% of all water is used for agriculture (Mall et al, 2006).A basin-wise breakdown of the India GBM’s water resources (see Table 12) confirms earlier statements regarding how little of the surface water of the Brahmaputra and Meghna basins are actually utilisable by India. Despite greater annual surface water potential than the Ganga basins, only one-tenth of surface water potential of the Brahmaputra and Meghna basins—and adjacent small rivers—are utilisable. This makes the Ganga basin far more critical to the water resources of India than either the Brahmaputra or Meghna basins.
Table 10: Groundwater resources, India and Bangladesh (mha)
Ganga Brahmaputra Meghna TotalIndia 17.17 2.78 0.18 20.13Bangladesh NA NA NA 3.22
Source: Shah, 2001

15Ecosystems for Life • Climate Change Situation Analysis
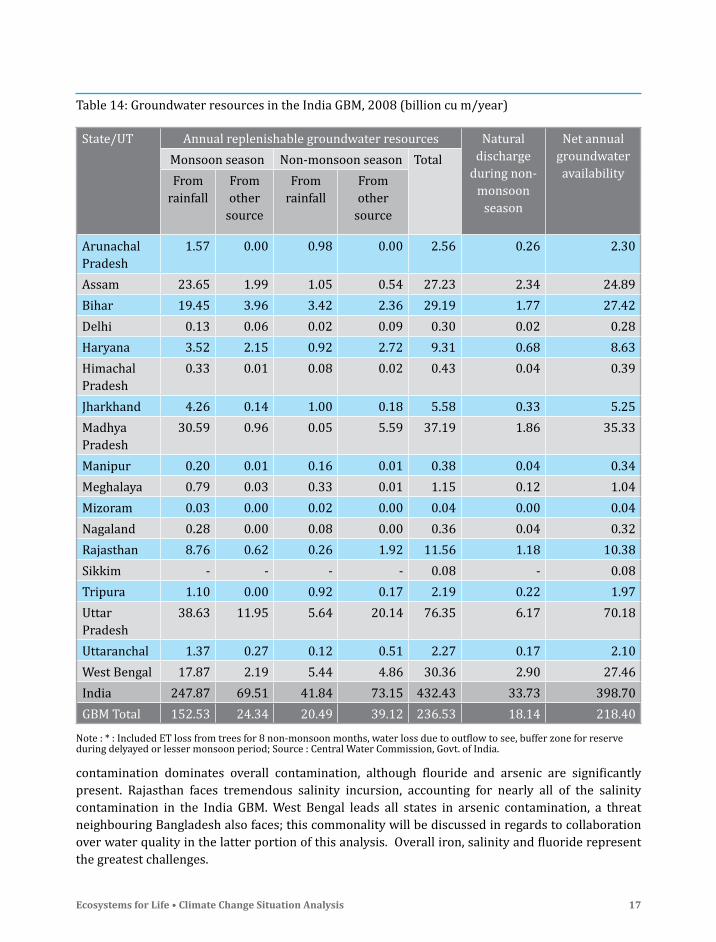
Water resources: India GBMInformation on available surface water by state is difficult to calculate due to the dynamic and transboundary nature of the water and, as such, information is not available. Data on storage capacity, however, is far easier to determine due to its static nature as well as more relevant to utilizable surface waters (see Table 13, p 16). Madhya Pradesh, Uttar Pradesh and Himachal Pradesh have significantly higher storage capacities relative to the other states. In the case of the first two, this is likely related to storage for irrigation, as each state is very agricultural in nature; as for Himachal Pradesh, its position as the source of many rivers and its high altitude make water storage both imperative and ideal. Jharkhand and Uttarakhand, despite having relatively low storage capacities now, will receive considerable investments in the near future which will, in both cases, more than double their current capacity. The largest future increases, however, will take place in Manipur which will see its storage capacity increased by a factor of twenty; however, it is also the only north-eastern state to receive any significant investment now or in the future, a point which will become important in regards to the economic scarcity discussion later. Vis-a-vis groundwater availability in the India GBM (see Table 14, p 17), the most relevant finding is the dependence of both India at large, and its GBM states in particular, on monsoon precipitation for groundwater recharge, with each receiving around 60% and 70% of their total from this source, respectively. That dependency on monsoon rainfall is slightly higher in the India GBM is important to keep in mind during the discussion on rainfall variability and the impact on
Table 11: India’s water resources (billion cu m)
Annual precipitation 4000Available water resources 1869
UtilizableSurface 690Ground 432Total 1122
Present utilization (63% Surface, 37% groundwater)
Irrigation 501Domestic 30Industry, energy, etc. 74Total 605
Source: Mall et al., 2006
Table 12: Water resources in the India GBM, by basin (billion cu m/year)
Average annual surface water
potential
Estimated utilisable surface water
potential
Estimated replenishable Groundwater
Total utilisable water
Ganga 525.02 250 170.99 420.99Brahmaputra, Barak (Meghna), et. al.
585.6 24 35.07 59.07
GBM Total 1110.62 274 206.06 480.06
Source: Central Water Commission

Climate Change Situation Analysis • Ecosystems for Life16
groundwater. The contribution of non-monsoon precipitation, while only one-third of the India GBM’s recharge in that season, is also fairly significant, and is likely to be impacted by diminishing off-season rainfall. Uttar Pradesh, Madhya Pradesh, West Bengal, Assam and Bihar account for nearly all of the India GBM’s available groundwater. The shortages in other states are made clear by the intensive exploitation, at times over-exploitation, of groundwater resources (see Table 15, p 18). Delhi, Haryana and Rajasthan are all overexploiting groundwater. This, coupled with increasing demand pressures from industrial and domestic sources in the future, will lead to net negative groundwater availability for irrigation in both Rajasthan and Haryana, a major concern given the importance of agriculture in those states. Delhi will have exactly zero BCM of groundwater available for future irrigation; however, meeting its ever-increasing domestic demand is of greater concern. Irrigation dominates groundwater use India GBM-wide, exceeding other uses in every state except for Delhi. Yet irrigation will make up proportionally less of future demand as increasing industrialization, population and very likely per capita use will demand a greater share of groundwater. While available groundwater is important, its quality is also very relevant for both present and future use (see Table 16, p 19). Given the number of rural habitations with contaminated groundwater, it is clear the India GBM ’s groundwater is very contaminated. Despite accounting for only 54.77% of India’s groundwater resources, it makes up 72.2% of India’s contaminated rural habitations. Rajasthan, Bihar, Assam and to a lesser extent West Bengal account for the greatest share of contamination in the India GBM. In both Assam and Bihar, iron
Table 13: India GBM state-wise storage capacity (10 million cu m and above)
India GBM stateLive storage capacity
Completed projects Ongoing projects Total projects Projects under considerationArunachal Pradesh 0.00 0.24 0.24 37.93Assam 0.01 0.00 3.01 0.73Bihar 1.84 0.68 2.52 5.82Haryana 0.00 0.00 0.00 0.26Himachal Pradesh 13.92 0.19 14.11 0.99Madhya Pradesh 17.16 16.78 33.94 7.34Manipur 0.40 8.45 8.85 0.00Meghalaya 0.70 0.00 0.70 0.52Mizoram 0.00 0.66 0.66 1.56Nagaland 1.22 0.00 1.22 0.53Rajasthan 8.28 1.43 9.71 1.81Sikkim 0.00 0.00 0.00 0.00Tripura 0.31 0.00 0.31 0.00Uttaranchal 3.06 5.34 8.40 0.15Uttar Pradesh 15.35 2.71 18.06 18.41West Bengal 1.48 0.18 1.66 0Delhi - - - -
Source: Central Water Commission (WM Directorate)
17Ecosystems for Life • Climate Change Situation Analysis
contamination dominates overall contamination, although flouride and arsenic are significantly present. Rajasthan faces tremendous salinity incursion, accounting for nearly all of the salinity contamination in the India GBM. West Bengal leads all states in arsenic contamination, a threat neighbouring Bangladesh also faces; this commonality will be discussed in regards to collaboration over water quality in the latter portion of this analysis. Overall iron, salinity and fluoride represent the greatest challenges.
Table 14: Groundwater resources in the India GBM, 2008 (billion cu m/year)
State/UT Annual replenishable groundwater resources Natural discharge
during non- monsoon
season
Net annual groundwater availability
Monsoon season Non-monsoon season TotalFrom
rainfallFrom other
source
From rainfall
From other
source
Arunachal Pradesh
1.57 0.00 0.98 0.00 2.56 0.26 2.30
Assam 23.65 1.99 1.05 0.54 27.23 2.34 24.89Bihar 19.45 3.96 3.42 2.36 29.19 1.77 27.42Delhi 0.13 0.06 0.02 0.09 0.30 0.02 0.28Haryana 3.52 2.15 0.92 2.72 9.31 0.68 8.63Himachal Pradesh
0.33 0.01 0.08 0.02 0.43 0.04 0.39
Jharkhand 4.26 0.14 1.00 0.18 5.58 0.33 5.25Madhya Pradesh
30.59 0.96 0.05 5.59 37.19 1.86 35.33
Manipur 0.20 0.01 0.16 0.01 0.38 0.04 0.34Meghalaya 0.79 0.03 0.33 0.01 1.15 0.12 1.04Mizoram 0.03 0.00 0.02 0.00 0.04 0.00 0.04Nagaland 0.28 0.00 0.08 0.00 0.36 0.04 0.32Rajasthan 8.76 0.62 0.26 1.92 11.56 1.18 10.38Sikkim - - - - 0.08 - 0.08Tripura 1.10 0.00 0.92 0.17 2.19 0.22 1.97Uttar Pradesh
38.63 11.95 5.64 20.14 76.35 6.17 70.18
Uttaranchal 1.37 0.27 0.12 0.51 2.27 0.17 2.10West Bengal 17.87 2.19 5.44 4.86 30.36 2.90 27.46India 247.87 69.51 41.84 73.15 432.43 33.73 398.70GBM Total 152.53 24.34 20.49 39.12 236.53 18.14 218.40
Note : * : Included ET loss from trees for 8 non-monsoon months, water loss due to outflow to see, buffer zone for reserve during delyayed or lesser monsoon period; Source : Central Water Commission, Govt. of India.

Climate Change Situation Analysis • Ecosystems for Life18
Rainfall
The India GBM receives nearly all of its rainfall in the summer monsoon and pre-monsoon periods (see Table 17, p 20). Only Himachal Pradesh breaks from this pattern due to its larger winter monsoon. Madhya Pradesh, Rajasthan and Uttar Pradesh are especially dependent on the monsoon, receiving
Table 15: Groundwater utilisation and development in the India GBM, 2008 (billion cu m/year)
States/UTs Net annual
available Ground-
water
Annual Groundwater draft Projected demand
for domestic
and industrial uses upto
2025
Ground- water
available for future irrigation
Stage of Ground-
water Develop-ment (%)
Irrigation Domestic and
industrial uses
Total
Arunachal Pradesh
2.30 0.00 0.00 0.00 0.01 2.29 0.04
Assam 24.89 4.85 0.59 5.44 0.98 19.06 22.00Bihar 27.42 9.39 1.37 10.77 2.14 16.01 39.00Delhi 0.28 0.20 0.28 0.48 0.57 0.00 170.00Haryana 8.63 9.10 0.35 9.45 0.60 -1.07 109.00Himachal Pradesh
0.39 0.09 0.03 0.12 0.04 0.25 30.00
Jharkhand 5.25 0.70 0.38 1.06 0.56 3.99 20.00Madhya Pradesh
35.33 16.08 1.04 17.12 1.74 17.51 48.00
Manipur 0.34 0.00 0.00 0.00 0.02 0.31 0.65Meghalaya 1.04 0.00 0.00 0.00 0.10 0.94 0.18Mizoram 0.04 0.00 0.00 0.00 0.00 0.04 0.90Nagaland 0.32 0.00 0.01 0.01 0.03 0.30 3.00Rajasthan 10.38 11.60 1.39 12.99 2.72 -3.94 125.00Sikkim 0.08 - 0.01 0.01 0.02 0.05 16.00Tripura 1.97 0.08 0.09 0.17 0.20 1.69 9.00Uttar Pradesh
70.18 45.36 3.42 48.78 5.30 19.52 70.00
Uttaranchal 2.10 1.34 0.05 1.39 0.08 0.68 66.00West Bengal 27.46 10.84 0.81 11.65 1.24 15.32 42.00India 398.70 212.37 18.05 230.41 29.09 161.06 58.00GBM total 218.40 109.63 9.82 119.44 16.35 92.95 54.69
Source : Central Water Commission, Govt. of India. (ON04)

19Ecosystems for Life • Climate Change Situation Analysis
nearly or greater than 90% of their rainfall in that season alone. The heavy dependence on such a concentrated period makes these states vulnerable to both fluctuations in monsoon rainfall and decreases in winter rainfall, the latter because they any decrease would leave those areas parched throughout the winter given that they receive such limited precipitation in that period, as it is. These states stand in contrast to the north-eastern states and sub-Himalayan West Bengal, which all receive a more even distribution of rainfall due to relatively significant precipitation in the pre-monsoon season; however, these areas are just as exposed to declines in winter precipitation.
The GBM region: social informationThe GBM region is one of the poorest in the world, rendering it especially vulnerable to climate change. When measured by caloric intake (below 2,200-2,400 K cal per person, per day), the GBM region accounts for 40% of the poor people in the developing world (Biswas, 2008). Around 250 million people here survive on less than US $2 per day (Samarakoon, 2004; see Table 18, p 20). Unsurprisingly, most of these statistics, such as life expectancy and infant mortality, are well below world averages (Samarakoon, 2004). Literacy also lags behind world averages, especially for women (Biswas, 2008). While poverty rates have improved in these countries, the total number of poor people has increased due to population growth (Biswas, 2008). The one encouraging statistic is access to clean water, which has improved in recent years (Samarakoon, 2004). Sanitation, however, lags far behind, resulting in the pervasive morbidity related to drinking water.
Table 16: Groundwater contamination in rural areas of the India GBM
States Contamination-wise Number of HabitationsTotal Fluoride Arsenic Iron Salinity Nitrate
Arunachal Pradesh 274 0 0 274 0 0Assam 26588 517 810 25261 0 0Bihar 34909 5957 2510 26442 0 0Haryana 179 173 0 0 6 0Himachal Pradesh 88 0 8 8 72 0Jharkhand 815 83 0 730 1 1Madhya Pradesh 5385 4720 0 178 481 6Manipur 5 0 0 5 0 0Meghalaya 107 1 0 106 0 0Nagaland 157 0 0 157 0 0Rajasthan 37658 11775 66 103 24787 927Tripura 7102 1 2 7097 2 0Uttar Pradesh 5911 1768 873 2800 455 15Uttarakhand 9 2 7 0 0 0West Bengal 10773 582 5195 4339 657 0GBM Total 129960 25579 9471 67500 26461 949India 179988 33071 10004 101845 32497 2571
Note: Data for selected states, as on 01.04.2009; Source : Rajya Sabha Unstarred Question No. 1347, dated 01.12.2009.

Climate Change Situation Analysis • Ecosystems for Life20
Table 17: Rainfall in the India GBM, by meteorological sub-division, 2003
Sub-division Winter monsoon Pre-monsoon Summer monsoon Post-monsoon Total rainfallRainfall % of
totalRainfall % of
totalRainfall % of
totalRainfall % of
totalArunachal Pradesh
123.0 4.10 705.4 23.49 1934.6 64.42 240.2 8.00 3003.2
Assam and Meghalaya
46.8 1.66 755.3 26.81 1821.0 64.64 194.1 6.89 2817.2
Nagaland, Mizoram, Manipur and Tripura
40.3 1.92 529.5 25.21 1326.9 63.18 203.5 9.69 2100.2
Sub-Himalayan West Bengal and Sikkim
73.8 2.63 495.4 17.64 2053.0 73.11 186.6 6.65 2808.0
Gangetic West Bengal
30.0 2.05 171.0 11.70 1111.4 76.06 148.9 10.19 1461.3
Jharkhand 36.8 2.84 83.3 6.43 1077.4 83.11 98.8 7.62 1296.3Bihar 29.5 2.47 74.6 6.26 1006.7 84.42 81.7 6.85 1192.5UP East 32.9 3.22 29.4 2.88 898.8 88.04 59.8 5.86 1020.9UP West 36.1 4.13 28.5 3.26 759.9 87.01 48.8 5.59 873.3Uttaranchal 95.8 6.04 119.3 7.52 1284.0 80.95 87.1 5.49 1586.2Haryana, Chandigarh & Delhi
38.1 6.15 36.1 5.83 515.3 83.18 30.0 4.84 619.5
Himachal Pradesh 179.8 12.88 208.5 14.93 907.4 65.00 100.4 7.19 1396.1Rajasthan West 8.7 2.67 18.2 5.59 289.4 88.88 9.3 2.86 325.6Rajasthan East 12.5 1.82 16.6 2.42 630.7 92.02 25.6 3.74 685.4M P West 17.3 1.75 14.4 1.45 907.7 91.59 51.6 5.21 991.0M P East 44.4 3.55 27.7 2.21 1120.9 89.51 59.3 4.74 1252.3India GBM total 845.8 3.61 3313.2 14.14 17645.1 75.31 1625.7 6.94 23429.0
Source: Central Water Comission
Table 18: Poverty and other social indicators in the GBM region
Poverty (%)
Without clean water
(%)
Without sanitation
(%
HDI GDP per capita (US$)
Life expectancy at
birth
Infant mortality
rate
India 46 25 71 0.436 300 62 71Bangladesh 52 22 66 0.365 220 58 81
Note: % denotes portion of of GBM population for each country; Source: Shah 2001, Samarakoon 2004.

21Ecosystems for Life • Climate Change Situation Analysis
The situation in India GBMWhile the average share of people below the poverty line (BPL) in the India GBM is lower than the rest of India (see Table 19), the averages for the other social indicators are worse, though all are generally at the same levels.2 Poverty is much higher in Bihar, Jharkhand, Madhya Pradesh, Uttar Pradesh and Uttarakhand than other GBM states or all of India. Interestingly, the heightened poverty of these states does not appear to correlate with higher infant mortality, lower literacy or shorter life expectancy. Nevertheless, their overall poverty rates should be kept in mind in as the paper begins to consider vulnerability when discussing the social impacts of climate change. Like the rest of India, the states of the India GBM rely on agriculture for their livelihood (see Table 20, p 22; here, ‘cultivator’ means one who farms his own land; ‘agricultural labour’ mean a landless labourer). Agriculture-related activities are the dominant livelihood, supplying over half of the cultivators and slightly less than half other labourers in India. With the exception of Delhi, Haryana and West Bengal, agriculture-related activities account for the majority of livelihoods in the India GBM, especially in Bihar. The pervasiveness of landless labourers in Bihar, West Bengal and Sikkim,
Table 19: Poverty and the social situation in the India GBM (2001)
State % BPL (04-05)
Literacy Rate Infant Mortality Life Expectancy
Person Male Female Rural Urban Combined Female Male
Arunachal Pradesh 13.4 54.74 64.07 44.24 NA NA NA NA NA
Assam 15.0 64.28 71.93 56.03 70 35 67 57.7 58.1
Bihar 32.5 47.53 60.32 33.57 62 49 60 61.4 59.5
Haryana 9.9 68.59 79.25 56.31 61 49 59 64.7 65.4
Himachal Pradesh 6.7 77.13 86.02 68.08 51 26 49 65.7 66.3
Jharkhand 34.8 54.13 67.94 39.38 NA NA NA NA NA
Madhya Pradesh 32.4 64.11 76.8 50.28 86 55 82 57 56.7
Manipur 13.2 68.87 77.87 59.70 NA NA NA NA NA
Meghalaya 14.1 63.31 66.14 60.41 NA NA NA NA NA
Mizoram 9.5 88.49 90.69 86.13 NA NA NA NA NA
Nagaland 14.5 67.11 71.77 61.92 NA NA NA NA NA
Rajasthan 17.5 61.03 76.46 44.34 78 53 75 60.5 61.6
Sikkim 15.2 69.68 76.73 61.46 NA NA NA NA NA
Tripura 14.4 73.66 81.47 65.41 NA NA NA NA NA
Uttar Pradesh 25.5 57.36 70.23 42.98 79 55 76 59.4 58.5
Uttarakhand 31.8 72.28 84.01 60.26 48 34 46 NA NA
West Bengal 20.6 69.22 77.58 60.22 48 34 46 63.3 64.8
Delhi 10.2 81.82 87.37 75 .00 NA NA NA NA NA
India GBM average 18.4 66.90 75.90 57.00 64.8 43.3 62.2 61.2 61.4India 21.8 65.38 75.85 54.16 66 38 60 61.6 63.3
Note: Literacy rates estimated on the basis of population age 7 years and above; Source: Department of Education, Ministry of Human Resource Development, Registrar General of India, Planning Commission

Climate Change Situation Analysis • Ecosystems for Life22
the only states where they exceed the number of cultivators, makes the inhabitants of these states more vulnerable to climate change: if agricultural production declines, the surplus of rural workers will increase relative to available jobs, leaving these landless labourers as first in line to enter the ranks of the unemployed or possibly migrate elsewhere in search of work (CENTRA technology and Scitor Corporation, 2009). For this very reason, workers considered ‘marginal’, or not having worked for more than
Table 20: State-wise distribution of workers, by category, in the India GBM
State Total workers
Cultivators Agricultural labourers
Household industry workers
Other worker
No. % No. % No. % No. %
Himachal Pradesh
2992461 1954870 65.3 94171 3.1 52519 1.8 890901 29.8
Uttarakhand 3134036 1570116 50.1 259683 8.3 72448 2.3 1231789 39.3
Haryana 8377466 3018014 36.0 1278821 15.3 214755 2.6 3865876 46.1
Delhi 4545234 37431 0.8 15773 0.3 140032 3.1 4351998 95.7
Rajasthan 23766655 13140066 55.3 2523719 10.6 677991 2.9 7424879 31.2
Uttar Pradesh
53983824 22167562 41.1 13400911 24.8 3031164 5.6 15384187 28.5
Bihar 27974606 8193621 29.3 13417744 48.0 1100424 3.9 5262817 18.8
Sikkim 263043 131258 49.9 17000 6.5 4219 1.6 110566 42.0
Arunachal Pradesh
482902 279300 57.8 18840 3.9 6043 1.3 178719 37.0
Nagaland 847796 548845 64.7 30907 3.6 21873 2.6 246171 29.0
Manipur 945213 379705 40.2 113630 12.0 96920 10.3 354958 37.6
Mizoram 467159 256332 54.9 26783 5.7 7100 1.5 176944 37.9
Tripura 1159561 313300 27.0 276132 23.8 35292 3.0 534837 46.1
Meghalaya 970146 467010 48.1 171694 17.7 21225 2.2 310217 32.0
Assam 9538591 3730773 39.1 1263532 13.2 344912 3.6 4199374 44.0
West Bengal 29481690 5653922 19.2 7362957 25.0 2172070 7.4 14292741 48.5
Jharkhand 10109030 3889506 38.5 2851297 28.2 430965 4.3 2937262 29.1
Madhya Pradesh
25793519 11037906 42.8 7400670 28.7 1033313 4.0 6321630 24.5
India GBM total/avg
204832932 76769537 42.2 50430093 15.5 9463265 3.6 68075866 38.7
India 402234724 127312851 31.7 106100330 26.5 16956942 4.2 151189601 37.6
Note: Population figures exclude Mao-Maram, Paomata and Purul sub-divisions of Senapati district in Manipur; Source: Primary Census Abstract : Census of India, 2001

23Ecosystems for Life • Climate Change Situation Analysis
Table 21: State-wise classification of workers in the India GBM (2001)
States\UT Total Main Workers Total Marginal Workers Total Non Workers
Himachal Pradesh (Total) 1963882 1028579 3085439
Rural 1758872 1013479 2709968
Urban 205010 15100 375471
Uttarakhand (Total) 2322347 811689 5355313
Rural 1745562 753280 3811433
Urban 576785 58409 1543880
Haryana (Total) 6241324 2136142 12767098
Rural 4519240 1932347 8577673
Urban 1722084 203795 4189425
Delhi (Total) 4317516 227718 9305273
Rural 273677 27387 643663
Urban 4043839 200331 8661610
Rajasthan (Total) 17436888 6329767 32740533
Rural 13962042 5894381 23436390
Urban 3474846 435386 9304143
Uttar Pradesh (Total) 39337649 14646175 112214097
Rural 31242754 13433198 86982387
Urban 8094895 1212977 25231710
Bihar (Total) 21052875 6921731 55023903
Rural 19112829 6639740 48564140
Urban 1940046 281991 6459763
Sikkim (Total) 212904 50139 277808
Rural 190656 48346 241979
Urban 22248 1793 35829
Arunachal Pradesh (Total) 415007 67895 615066
Rural 340027 61983 468077
Urban 74980 5912 146989
Nagaland (Total) 703977 143819 1142240
Rural 608335 133104 905810
Urban 95642 10715 236430
Manipur (Total) 659364 285849 1221575
Rural 494747 228340 867733
Urban 164617 57509 353842
continued overleaf

Climate Change Situation Analysis • Ecosystems for Life24
six months over the course of the census survey period, also face greater vulnerability to climate change (see Table 21, p 23). The extent of marginal versus ‘main’, or regular, workers shows that in no state does the population of marginal workers exceed main workers; however, in nearly all states the proportion of marginal workers to main workers increases in the rural areas, implying again the vulnerability of agricultural workers. Himachal Pradesh, Uttar Pradesh, Haryana, Bihar, Assam, Jharkhand and Madhya Pradesh all have a relatively higher proportion of marginal workers (defined as approximately one-third or greater of the number of main workers), and are thus at increased vulnerability. Scheduled Tribes (STs) and Scheduled Castes (SCs), meaning those receiving special recognition by the government, represent crucial and vulnerable populations in India, as also in the India GBM (see Table 22). The north-east region stands out as having by far the largest proportion of their population designated as STs, with that group representing an overwhelming majority in some of those states. Jharkhand and Madhya Pradesh also have large ST populations. Many states of the India GBM region have large proportions of SCs, but only Himachal Pradesh, Uttarakhand, Rajasthan, Uttar Pradesh and Mizoram have populations above the Indian average.
Mizoram (Total) 362450 104709 421414
Rural 201599 54445 191523
Urban 160851 50264 229891
Tripura (Total) 912292 247269 2039642
Rural 747822 234625 1671006
Urban 164470 12644 368636
Meghalaya (Total) 757011 213135 1348676
Rural 626538 195993 1042180
Urban 130473 17142 306496
Assam (Total) 7114097 2424494 17116937
Rural 6050639 2346130 14819519
Urban 1063458 78364 2297418
West Bengal (Total) 23023583 6458107 50694507
Rural 16106580 5783062 35859304
Urban 6917003 675045 14835203
Jharkhand (Total) 6446782 3662248 16836799
Rural 5105341 3464250 12382497
Urban 1341441 197998 4454302
Madhya Pradesh (Total) 19102572 6690947 34554504
Rural 14776619 6123607 23480652
Urban 4325953 567340 11073852
Note: Population figures exclude Mao. Maram, Paomata and Purul sub-division of Senapati district in Manipur; Source: Registrar General of India.
States\Uts Total Main Workers Total Marginal Workers Total Non Workers

25Ecosystems for Life • Climate Change Situation Analysis
n Climate change impacts
Let us begin with rainfall. The general theme in precipitation across the GBM basin is an increase in total rainfall, coupled with a simultaneous decrease in rainy days (CENTRA technology and Scitor Corporation, 2009). Rainfall will increase due to higher temperatures, which will result in warmer air that holds more moisture (Mall et al, 2006). A study (Kumar et al, 2006) that predicts South Asia-wide precipitation change in two climate change scenarios, derived from the IPCC SRES scenarios, 2071-2100, shows that in both scenarios, the whole GBM region will experience increases of 15-20%. The Himalayan and north-eastern regions of India (and eastern edge of Bangladesh) will experience increases in the 40-50% range. Given that rainfall in these regions feeds the Ganga and Brahmaputra/Meghna basins, respectively, incredible increases in monsoon water flows should be expected. Another model estimates annual precipitation to increase in the Ganga basin by 8.6% by 2041-2060 (Gosain and Rao, 2003). Despite the increases in overall rainfall, studies also point to a decrease in
Table 22: Scheduled Castes and Scheduled Tribes in the India GBM (2001)
State / UT Population Proportion of SC population
(%)
Proportion of ST population
(%)Total
PopulationScheduled Castes (SC) Population
Scheduled Tribes (ST) Population
Himachal Pradesh 6077900 1502170 244587 24.7 4.0
Uttarakhand 8489349 1517186 256129 17.9 3.0
Haryana 21144564 4091110 - 19.3 0.0
Delhi 13850507 2343255 - 16.9 0.0
Rajasthan 56507188 9694462 7097706 17.2 12.6
Uttar Pradesh 166197921 35148377 107963 21.1 0.1
Bihar 82998509 13048608 758351 15.7 0.9
Sikkim 540851 27165 111405 5.0 20.6
Arunachal Pradesh 1097968 6188 705158 0.6 64.2
Nagaland 1990036 - 1774026 0.0 89.1
Manipur 2166788 60037 741141 2.8 34.2
Mizoram 888573 272 839310 0.0 94.5
Tripura 3199203 555724 993426 17.4 31.1
Meghalaya 2318822 11139 1992862 0.5 85.9
Assam 26655528 1825949 3308570 6.9 12.4
West Bengal 80176197 18452555 4406794 23.0 5.5
Jharkhand 26945829 3189320 7087068 11.8 26.3
Madhya Pradesh 60348023 9155177 12233474 15.2 20.3
India 1028737436 166635700 84326240 16.2 8.2
Note: Pupulation figures exclude Mao-Maram, Paomata and Purul sub-divisions of Senapati districts of Manipur; Source: Primary Census Abstract : Census of India 2001.

Climate Change Situation Analysis • Ecosystems for Life26
overall rain days by about 5-15 days on average (Kumar et al, 2006; Revi 2007). In a region where 60% of annual precipitation can occur in just a few days, the loss of 5-15 days represents a significant loss and will certainly result in an increase in intense and likely destructive rainfall events (Mall et al, 2006). In addition to a reduction in precipitation days, there will be greater inter-seasonal variability. A projection of rainfall under multiple SRES scenarios for the Indian sub-continent, broken down by season (see Table 23), indicates that, overall, rainfall will continue to rise in all scenarios. The winter, or lean season, may witness some much needed increase rainfall initially. However, the projections are in agreement that a reduction in winter rainfall will occur by the 2080s, with one model suggesting this decline will begin as early as the 2020s. Coupled with higher temperatures, this increased variability will have profound implications for lean-season flows and drought. This
Table 23: Rainfall projections for the Indian subcontinent under SRES scenarios, by season
Scenarios Rainfall change (%)
A1 A2 B1 B2
2020s Annual 2.29 2.16 4.15 5.97
Winter 0.39 -1.95 4.36 3.64
Monsoon 1.81 2.37 3.83 5.10
2050s Annual 9.34 5.36 6.86 7.18
Winter 3.22 -9.22 3.82 3.29
Monsoon 10.52 7.18 7.20 8.03
2080s Annual 9.90 9.07 7.48 7.62
Winter -19.97 -24.83 -4.50 -10.36
Monsoon 14.96 15.18 11.12 10.10
Note: SRES: Special Report on Emission Scenarios, IPCC; Source: Mirza and Ahmad, 2005
Table 24: Temperature projections for the Indian subcontinent under SRES scenarios, by season
Scenarios (Temperature Change ˚C)
A1 A2 B1 B2
2020s Annual 1.18 1.00 1.32 1.41
Winter 1.19 1.08 1.37 1.54
Monsoon 1.04 0.87 1.12 1.17
2050s Annual 2.87 2.63 2.23 2.73
Winter 3.18 2.83 2.54 3.00
Monsoon 2.37 2.23 1.81 2.25
2080s Annual 5.09 5.55 3.53 4.16
Winter 5.88 6.31 4.14 4.78
Monsoon 4.23 4.62 2.91 3.47
Source: Mirza and Ahmad, 2005
27Ecosystems for Life • Climate Change Situation Analysis
fact is especially true for Madhya Pradesh, Rajasthan and Uttar Pradesh as they already receive a very small amount of winter rainfall. A ‘shift’ of the monsoon season is also possible, in part because of the weakening relationship between the monsoon and the El-NiÑo weather system; the El-NiÑo system may also experience fluctuations, with implications for the reliability of the monsoon (Kripalani et al, 2003).
Temperature increasesA study that projects temperature increases across South Asia (Kumar et al, 2006) shows that the primary GBM area could expect temperature increases of 2-3oC, 2071-2100. In the Himalayan region, these increases will be as high as 3.5-5oC, with likely implications for glacial melt. Increased temperatures in these mountainous areas will also impact malaria transmission, which will be discussed in detail later. The west of the Ganga Basin will also face extreme rises in temperature in the neighbourhood of 4-5oC. It bears mentioning that these models exhibit greater uncertainty than the precipitation models. These temperature increases will not be spread evenly across all seasons, as a projection of temperature increases under multiple SRES scenarios for the Indian sub-continent, broken down by season, shows (see Table 24). Most alarming here is the increase in winter temperature, which in all scenarios is higher than the increases in monsoon temperature. Coupled with decreased winter rainfall, higher temperatures will increase drought and reduce flows through greater evapo-transpiration (Gosain and Rao, 2003).
Glacial meltGlaciers regulate water flows in the GBM region, generally realizing more water in hotter (drought) periods, while less in wetter (flood) periods (Mall et al, 2006). Thus, despite their relatively small overall contribution to water volume in the GBM region, as shown before, they serve a vital role in regulating flows in the region. Climate change will result in the shrinking of glaciers as decreased winter precipitation, increased summer precipitation and high temperatures will reduce the ability of glaciers to retain mass (Hasnain et al, 2003). Increased melt will initially result in greater yields, before ultimately leading to reduced runoff (CENTRA technology and Scitor Corporation, 2009). One study claims that glacial runoff has already passed the threshold into reduced runoff, with the Himalayan river systems that drain into the Ganga ‘gradually drying out’, while some are already ‘dead’ (see also Table 25, p 28). While the rate of glacial retreat exhibits great variation across the various glaciers, the overall trend towards melt is unmistakable. The Gangotri glacier, in particular, serves an important function as the source of the Ganga (Ahmad and Ahmed, 2004).
Increased floodsWe have already detailed the coming increase in intense rainfall events. A full 80% of the GBM region is already flood-prone, and these increased events will undoubtedly lead to more flooding (Shah, 2001). The flood-prone nature of the Brahmaputra was mentioned earlier when discussing its relatively smaller area but greater annual flows versus the Ganga; indeed, these hydrological facts mean that the Brahmaputra, as well as the Meghna, tend to be very ‘flashy’ in their response to intense rains, resulting in more flooding (Adhikari et al, 2000). Floods in the GBM region also exhibit a vicious cycle in which floods increase erosion and redistribute sediment, reducing channel depth and changing flood plain topography so as to reduce the effectiveness of flood prevention measures, resulting in more floods (Biswas, 2008).

Climate Change Situation Analysis • Ecosystems for Life28
Decreased lean-season flowsAnother likely result of climate change will be decreased lean-season (non-monsoon) flows as a result of the increased precipitation/decreased rain days paradigm, as well as greater evapo-transpiration due to higher temperatures in the winter (Gosain and Rao, 2003). Projected rainfall changes and the impacts on runoff in the Ganga basin (see Table 26) show that despite dramatic increases in annual rainfall of 8.6%, runoff only increases by an average 2.1 mm, while the percentage of rainfall that contributes to runoff actually declines. The authors of this study attribute this finding both to the increased ET (evapo-transpiration), as well as rainfall variability. This decreasing ability of rainfall to supply the Ganga basin will result in a 50% reduction in surface discharge and a corresponding drop in the groundwater table (Kumar et al, 2005). Some estimates place the reduction in flows as high as two-thirds and the human impact at over 400 million people (Sharma and Sharma, 2008). Already the Ganga has witnessed an increase in the sand bar to channel ratio of 30% in the last 70 years (Tangri, 2003). Reduction in these flows below the Environmental Flows Requirement (EFR) has dramatic implications for water quality, for rivers lose their capacity to ‘flush’ streams of contaminants (Bandopadhyay and Ghosh 2009; Roy et al, 2003). Quality also drops with flows because pollutants are concentrated in higher degrees (Samarakoon, 2004).
Decreased water qualityThe primary contaminants likely to increase due to climate change are sediment, salinity and arsenic. Intense rains in the Eastern Himalayas tend to result in dramatic increases in sedimentation: the Kosi river already carries 8.2 tonnes of sediment annually per sq km of catchment area to the Ganga, and the corresponding figure for the Teesta river is 12,510 tonnes to the Brahmaputra (Bandyopadhyay and Ghosh, 2009). The total for the Ganga basin is estimated at 3.5 million tonnes through down to the Bay of Bengal (Huda, 2001). Satellite images show that the GBM region has already lost 106,300 ha to erosion, with the lost soil likely contributing further to sedimentation (Huda, 2001). As flows decrease, so too does the pressure which keeps salt water out. Lower lean-season flows on the Gorai river allow salinity to penetrate 180 km north of the Bay of Bengal (Samarakoon, 2004).
Table 25: Retreat of glaciers that feed the Ganga and Brahmaputra river basins
Glacier (state) Period Retreat of snout (metre)
Average retreat (metre/yr)
Triloknath Glacier (Himachal Pradesh) 1969-1995 400 15.4Pindari Glacier (Uttarakhand) 1848-1996 2840 135.2Milam Glacier (Uttar Pradesh) 1909-1984 990 13.2Ponting Glacier (Uttarakhand) 1906-1957 262 5.1
Chota Shigri Glacier (Himachal Pradesh) 1986-1995 60 6.7
Bara Shigri Glacier (Himachal Pradesh) 1977-1995 650 36.1
Gangotri Glacier (Uttarakhand) 1977-1990 364 28.0
Zemu Glacier (Sikkim) 1977-1984 194 27.7
Source: Muhammed 2004, Mall et. al. 2006

29Ecosystems for Life • Climate Change Situation Analysis
Water wells in coastal areas must now go down to depths of 250 m to avoid salinity contamination, which increases energy consumption, sometimes prohibitively, for poorer people (Samarakoon, 2004). As surface water quality diminishes, groundwater must supply an increasing proportion of water. Some studies point to overexploitation of groundwater, and the resultant lowering of the groundwater table, as the reason for the oxidation of arsenopryite that is leading to arsenic contamination in the groundwater of West Bengal and Bangladesh (Adhikari et al, 2000). India’s Central Ground Water Board attributes this phenomenon to sedimentation in the Ganga river, also likely to increase with climate change, as explained above. Some studies agree with this conclusion (Adhikari et al, 2000). It bears mentioning, however, that other studies believe the causes to be natural (Huda, 2001).
Bangladesh: a brief spotlightThe specific impacts of climate change on Bangladesh will be touched on only briefly, as a more thorough examination falls outside the scope of this paper. The primary theme related to Bangladesh is that it will face many of the same impacts as India but, as the lower riparian, the impacts will likely be more severe. As a flat country with alluvial soil, Bangladesh is very flood-prone (Adhikari et al, 2000). An estimated 80% of the land is flood-prone while 30% is actually flooded every year due to a combination of flash floods from the hills, over-bank spilling of rivers, in-country rainfall and drainage congestion (Biswas, 2008). Contributing to drainage congestion are the 0.5-1.8 billion tonnes of sediment it receives from upstream every year, mostly from the Kosi and Brahmaputra rivers (Biswas, 2008), which also plays into the vicious cycle of channel depth reduction and flood plain topography alteration discussed above (Biswas, 2008). The ‘normal sequence of flooding’ tends to involve flash floods in north and eastern hill streams during pre-monsoon period in April/May; then, as the monsoon begins, flooding comes from the Brahmaputra and Meghna rivers in July/August and the Ganga in August/September (Adhikari et al, 2000). Surveys in Bangladesh found that over 75% of respondents blamed a rise in river flows for floods, while 60% said duration had increased in recent years while the timing had advanced (Mohammed, 2004). Water quality is also a big issue in Bangladesh, especially from salinity incursion. Due to reduced flows, salinity has increased from 280 micro-mhos/cm to 29,000 micro-mhos/cm, creating problems in agriculture, aquaculture, forestry, power generation and water supply, among other areas, in the 25,900 sq km Ganga Dependent Area, or GDA (Huda, 2001). In addition to salinity, arsenic and sediment, industrial effluents, agrochemicals and domestic waste make up the primary pollutants here, with concentrations rising in the dry season (Samarakoon, 2004).
Table 26: Impact of rainfall changes on runoff in the Ganga basin
Basin Scenario Rainfall (mm)
% Change vs. Control
Runoff (mm)
As % of rainfall
Actual ET* (mm)
As % of rainfall
Ganga Control 678.2 8.60% 113.0 16.70% 542.1 79.90%
CC 736.4 115.1 15.60% 583.5 79.20%
Note: ET refers to evapotranspiration; Source: Gosain and Rao 2005

Climate Change Situation Analysis • Ecosystems for Life30
Knowledge gapsKnowledge gaps in this area involve micro-climate studies relating impacts to the GBM region specifically. Such micro-climate, or regional climate models, already exist but not for the GBM basin (Ahmad and Ahmed, 2004). The development of these could provide benefits such as more informed drought warnings, allowing poor farmers to take measures against potential crop losses (Ahmad and Ahmed, 2004). While the need for more micro-climate studies will be expounded upon in more detail in relation to the environmental impacts of India, it bears mentioning here that these models should also be translated into impacts on people and ecosystem services (Gosain and Rao, 2003).
Impacts: focus on India GBMAgain, we begin with rainfall. Overall, India will see a 7-20% increase in annual precipitation, with a 10-15% increase in monsoon season (Ramesh and Yadava, 2005). India will, unfortunately, see a 5-25% decline in precipitation in drought-prone areas (Ramesh and Yadava, 2005). Every state in the India GBM will see a 20% rise in summer rainfall, except for Rajasthan which shows a slight decrease – a rather unfortunate development for the drought-prone state (Kumar et al, 2006). Cyclone intensity is also estimated to increase by 10-20%, motivated by the same increased air temperature factors that will drive rainfall increase (Lal, 2005). A study has illustrated the projected rainfall increases in different climate scenarios by state (Kumar et al, 2006). The data for Himachal Pradesh, Rajasthan,
J F M A M J J A S O N D
16141210
86420
Madhya Pradesh
J F M A M J J A S O N D
25
20
15
10
5
0
West Bengal, Sikkim
J F M A M J J A S O N D
10
8
6
4
2
0
Uttar Pradesh
J F M A M J J A S O N D
25
20
15
10
5
0
Arunachal Pradesh
J F M A M J J A S O N D
12
10
8
6
4
2
0
Bihar
J F M A M J J A S O N D
30
25
20
15
10
5
0
Assam
Figure 1: Projected rainfall increases in different climate scenarios in the India GBM (mm/day)
Source: Kumar et al 2006

31Ecosystems for Life • Climate Change Situation Analysis
Haryana and Delhi was available, but could not be gathered for technical reasons (see Figure 1). The states of the north-east witness both the largest increases and the highest overall totals. In these states, the increases are concentrated in very short time spans of around two months, with increased flooding likely to result.
Temperature increasesA warming of 3-5oC in one scenario and 2.5-4oC in another scenario is expected throughout India (Kumar et al, 2006). As alluded to in the seasonal breakdown (see Table 26) the lowest minimum temperature will increase by up to 5oC, while the highest max will increase by only 2oC (Kumar et al, 2006). This warming will also likely be concentrated in Northern India (CENTRA technology and Scitor Corporation, 2009). GBM-specific temperature increases have been discussed in the preceding section and no additional temperature information on specific states was available.
Flood impacts and vulnerabilityBetween 60-68% of India’s flood prone area falls in the GBM region, with over half of observed floods occurring in either the Ganga or Brahmaputra basins, predominantly in the latter (Biswas, 2008; Shah, 2001). The most vulnerable states are Uttar Pradesh, Assam, West Bengal and Bihar (Biswas, 2008). Bihar and Uttar Pradesh are especially vulnerable because the northern tributaries, such as
J F M A M J J A S O N D
30
25
20
15
10
5
0
Nagaland
J F M A M J J A S O N D
30
25
20
15
10
5
0
Tripura
J F M A M J J A S O N D
25
20
15
10
5
0
Manipur
J F M A M J J A S O N D
60
50
40
30
20
10
0
Meghalaya
J F M A M J J A S O N D
30
25
20
15
10
5
0
Mizoram
Baseline
A2 Scenario
B2 Scenario

Climate Change Situation Analysis • Ecosystems for Life32
the Sharda, Gharga, Gandak and Kosi, carry large quantities of silt and are very windy, giving them a high flood damage potential (Adhikari et al, 2000; Biswas, 2008). West Bengal and the north-east are vulnerable from intense rainfall-induced floods in the Brahmaputra and Meghna basins; these events are expected to increase with climate change (Adhikari et al, 2000). Specifically, the northern tributaries of the Brahmaputra basin and the main river itself are especially vulnerable to spilling, drainage congestion, bank erosion, landslides and sudden changes in course (Adhikari et al, 2000). A look at the average area and population affected by floods in key India GBM states (see Table 27) confirms that these states face the largest damages. Not coincidently, they are also the states with the largest population density affected; one study contents that it is increasing density in flood-prone areas more than increased precipitation that is driving increasing flood damages (Mirza et al, 2001). Uttar Pradesh also accounts for nearly half of the damaged crop area in the India GBM.
DroughtAs mentioned above, increased winter temperatures coupled with decreased winter rainfall will increase droughts in the India GBM. While a full two-thirds of India’s climate risk comes from drought (Revi, 2008), in the India GBM drought is relatively less of a threat, with Rajasthan being the most at risk (Mall et al, 2006). Nevertheless, droughts can adversely affect food production and drinking water supply, with ramifications in regions outside of the drought zone (Revi, 2008). Bihar, Haryana, Madhya Pradesh, Uttar Pradesh and West Bengal are also vulnerable (see Table 28). As discussed earlier, Haryana is already overexploiting its groundwater resources, while West Bengal and Madhya Pradesh are also drawing on their groundwater at a relatively high rate. As a more steady rainfall is replaced by increased intense precipitation events, the resultant decline in “drizzle-type precipitation” which is responsible for replenishing soil moisture and groundwater will adversely affect groundwater replenishment (CENTRA technology and Scitor Corporation, 2009); recall that the significant role of monsoon rainfall in groundwater replenishment was described earlier. As a result, throughout the Gangetic plain, water levels may drop to levels close to those in Gujarat (CENTRA technology and Scitor Corporation, 2009).
Table 27: Average area and population affected by floods in key India GBM states
State Geographic area (mha)
Cropped area (mha)
Damaged land area
(mha)
Damaged cropped
area (mha)
Average population
affected (millions)
Density of population
affected (no./ 1000 ha)
Uttar Pradesh 29.71 17.29 2.26 1.24 8.32 487.00
Bihar 17.33 7.86 1.27 0.60 5.33 556.00West Bengal 8.25 5.56 0.80 0.30 2.72 696.00
Madhya Pradesh 44.21 18.84 0.36 0.18 0.36 162.00
Assam 7.85 2.70 0.89 0.17 1.58 304.00
Rajasthan 34.23 15.58 0.43 0.32 1.04 205.00
India GBM total 141.58 67.83 6.01 2.81 19.35 401.67
Source: Goel, 1993

33Ecosystems for Life • Climate Change Situation Analysis
n Other assorted impacts
A variety of other environmental impacts will afflict India, but they will not be dealt with in detail due either to the fact that they were expounded upon in earlier sections or are not as relevant to the GBM region: • Sea level represents a great threat to India, though in the GBM basin area, West Bengal is most
vulnerable (Kelkar and Bhadwal, 2007);• Saline ingress is likely to increase due to primarily to increased storm surges, though decreased
lean-season flows will have an impact as well (CENTRA technology and Scitor Corporation, 2009); • Decreased flows below the ERT in the Ganga-Damodar basin has already begun to significantly
impact ecoysytems (Roy et al, 2003).
Knowledge gapsThe need for regional climate models, described above, is necessary for the GBM region of India as well. These models must account for factors such as the timing and nature of impacts, the ability of ecosystems to adapt, future population increases, changing economic activities and potential policy responses (Mall et al, 2006). Projections of land-use changes must also be incorporated, as these were excluded from some of the projections given above (Gosain and Rao, 2003). Other impacts such as climate variability, extreme events, changing temporal and spatial distribution of rainfall, sea level rise due to increase run-off and vulnerability of key water resources to climate change also require additional efforts (Mall et al, 2006). Another study cited a “scarcity of reliable discharge and soil moisture data” as a concern (Ramesh and Yadava, 2005). Finally, more data is needed on extreme temperatures and precipitation, which requires daily monitoring (Kumar et al, 2006).
Economic impacts: focus on India GBMWhile the economic impacts of climate change will be many, this paper will focus primarily on agriculture. Part of the justification of this concentration comes from the economic importance of agriculture to India: while only supplying 19% of the country’s GDP, agriculture supports a full two-
Table 28: Groundwater potential in drought-prone districts in some India GBM states
State/UTs Districts (no.) Total replenishable groundwater
resources
Groundwater utilisable for
irrigation
Net groundwater draft
Bihar 5 4694.24 3990.11 564.40Haryana 1 164.05 139.44 233.15Madhya Pradesh 6 6426.13 5462.21 1130.76
Rajasthan 8 4877.88 4143.64 1370.76
Uttar Pradesh 16 17226.18 14642.26 4432.28
West Bengal 3 4610.06 3918.55 814.58
Source: Ground Water Statistics, 1996 (Central Ground Water Board)

Climate Change Situation Analysis • Ecosystems for Life34
thirds of the country’s workforce. As the livelihood tables depicted earlier indicate, the importance of agriculture as an employer exists in the GBM region as well. Agriculture is also more sensitive to climate change than other sectors, as it is directly impacted by changes in water resources, temperature and land availability. As this paper focuses primarily on water resources, an agricultural concentration is warranted, as 83% of India’s water resources are used in agriculture. Finally, perhaps in recognition of the arguments listed here, more data is available on the impacts of climate change on agriculture. In order to understand the magnitude of the impact of climate change on agriculture in the India GBM, one must first determine the most important states and crops in the region, economically. This classification will in part be determined by examining the contribution of each state to the total production of the major crops of India, by top three contributing states. Uttar Pradesh, West Bengal, Haryana, Rajasthan, Madhya Pradesh, Assam and Bihar are the most important states in terms of production of the major crops of India. Uttar Pradesh is by far the most frequent listing; it provides critical crops like wheat and rice, as well as cash crops like sugarcane and potato. The key crops for India, determined by whether two of the top three states are in the India GBM, are rice, wheat, total pulses, jute, mesta and potato. It will be important to keep these states and crops in mind as this section proceeds (see Table 29). A case could be made for Jharkhand and Uttarakhand as well, but in examining the percentage of total yield and production, the outsized role of Uttar Pradesh is clear. Finally, because the purpose of this section is to address the economic impacts of a decline in agricultural production, it is also important to account for the importance of agriculture to the
Table 29: Area, production and yield of foodgrains in major India GBM states (2008-2009)
State Area Proportion to
all-India (%)
Production Proportion to
all-India (%)
Yield Area under irrigation (%)
2007-08*
1 2 3 4 5 6 12Uttar Pradesh 19.76 16.08 46.73 19.93 2365 74.9
Rajasthan 13.21 10.75 16.68 7.11 1263 28.0
West Bengal 6.54 5.32 16.30 6.95 2493 48.4
Haryana 4.61 3.75 15.61 6.66 3388 88.5
Madhya Pradesh 11.91 9.70 13.91 5.93 1168 44.4
Bihar 6.92 5.63 12.22 5.21 1766 63.1
Jharkhand 2.43 1.98 4.19 1.79 1720 8.0
Assam 2.67 2.17 4.14 1.77 1551 3.4
Uttarakhand 1.03 0.84 1.77 0.75 1715 40.2
Others 53.76 43.76 102.92 43.89 @ -
All India 122.83 100.00 234.47 100.00 1909 46.8
Note: States have been arranged in descending order of percentage share of production during 2007-08; * Provisional; @: since area/ production is low in individual states, yield rate is not worked out. Source: Directorate of Economics and Statistics, Department of Agriculture and co-operation

35Ecosystems for Life • Climate Change Situation Analysis
economy of individual states, demonstrated as a percentage of total Gross State Production (see Table 30). It is evident that agriculture is economically important to all the states of the GBM basin except for Delhi and Jharkhand. Therefore, while it remains important to keep in mind the key states mentioned earlier in terms of contribution to India’s total production and major crops, one should also understand that the impacts of climate change will have adverse economic impacts for nearly all the states of the GBM region. Further, it is useful to examine their value as cash crops. While specific sale value is unavailable on a crop-wise basis, information exists in regards to the Market Surplus Ratio (MSR) of important crops; the MSR refers to the percentage available above requirements for subsistence, and can be thought of as a proxy for the extent to which a given crop is sold (see Table 31, p 36). Once again, Uttar Pradesh stands out as important to the economic value of Indian agriculture; it bears mentioning, however, that for key food crops like rice and wheat, Uttar Pradesh has a low MSR value, meaning that it also is a large consumer of its own production.
Table 30: Share of agriculture and allied sector in total Gross State Domestic Production (2008-09)
State GSDP fromagriculture
% share of agriculture and allied sectorin total GSDP
% growth over previous year
Arunachal Pradesh 117033 25.80 15.49
Assam 2214606 27.94 12.01
Bihar 3878540 27.22 31.39
Jharkhand 751332 9.92 3.95
Haryana 3954679 21.66 17.23
Himachal Pradesh 778499 21.08 6.05
Madhya Pradesh 4649376 27.10 18.51
Manipur 149397 23.55 2.57
Meghalaya 187236 19.48 12.61
Mizoram 52492 13.78 4.25
Nagaland NA NA NA
Rajasthan 5077750 25.18 12.20
Sikkim 44442 17.01 8.55
Tripura NA NA NA
Uttar Pradesh 11852668 28.76 16.26
Uttarakhand 669127 16.63 6.08
West Bengal 7454621 21.06 6.98
Delhi 109683 0.66 9.41
Note: GDSP at current prices (1999-2000 base); ‘Agriculture and allied sector’ includes forestry and logging and fishing; Source: Central Statistical Organisation, New Delhi.

Climate Change Situation Analysis • Ecosystems for Life36
Table 31: Crops critical to the India GBM (market surplus value of over 80%)
Crop State
Wheat Haryana
Mustard Rajasthan, Uttar Pradesh and Haryana
Soybean Madhya Pradesh
Sugarcane Uttar Pradesh
Potato Uttar Pradesh
Table 32: Salinity and water-logging in irrigated commands of the India GBM, 2009 (in ’000 ha)
States Total command area (major and
medium projects)
Total waterlogged area (major and medium projects)
Total salt-affected area (major and medium
projects)
Area Percentage Area Percentage
Bihar 5939.255 627.888 10.57 156.887 2.64
Haryana 3868.356 16.459 0.43 19.393 0.50
Himachal Pradeah 35.830 0.261 0.73 0 .000 0 .00
Jharkhand 399.477 0 .000 0 .00 0 .000 0 .00
Madhya Pradesh 4862.888 0.543 0.01 4.410 0.09
Rajasthan 5051.890 8.409 0.17 2.053 0.04
Uttarakhand 251.710 0.222 0.09 0.0134 0.01
Uttar Pradesh 23400.763 126.681 0.54 283.146 1.21
West Bengal 3412.493 46.400 1.36 6.470 0.19
Arunachal Pradesh 0 .000 0 .000 0 .00 0 .000 0 .00
Assam 326.020 2.092 0.64 0 .000 0 .00
Manipur 68.410 0.486 0.71 0 .000 0 .00
Meghalaya 3.400 0.056 1.65 0 .000 0 .00
Mizoram 0 .000 0 .000 0 .00 0 .000 0 .00
Nagaland 6.150 0 .000 0 .00 0 .000 0 .00
Sikkim 0 .000 0 .000 0 .00 0 .000 0 .00
Tripura 25.760 0.023 0.09 0 .000 0 .00
GBM Basin Total 47652.402 829.520 16.99 472.3724 4.68India 88895.620 1719.279 1.93 1034.541 1.16
Source : Rajya Sabha Unstarred Question No. 3015, dated on 30.07.2009.
Source:

37Ecosystems for Life • Climate Change Situation Analysis
To summarize, the most important states in terms of overall production are Uttar Pradesh, West Bengal, Haryana, Rajasthan, Madhya Pradesh, Assam and Bihar, while only Haryana, Rajasthan, Uttar Pradesh West Bengal and Madhya Pradesh produce both a large amount and high surplus of key crops. In terms of production rice, wheat, total pulses, jute and mesta and potato are the most important crops, while other crops like sugarcane, mustard, gram and soy beans are valuable for the high surplus ratios produced in GBM states; however, only wheat, mustard, soy beans, jute, sugarcane and potatoes are both produced in high quantities and with a large surplus ratio. Finally, despite all this information, it remains important to keep in mind that agriculture is a major contributor to the GSDP of every state in the GBM, except for Delhi and Jharkhand.
Climate impacts on agricultureThe primary threats include flood damage, temperature increase, decreased soil moisture and associated groundwater decline, salinity ingress, rainfall variability and intense precipitation. In India there are two growing seasons: the kharif, or monsoon cropping season, and the Rabi, or winter season (Mall et al, 2006b). Kharif crops include rice, maize, sugarcane, cotton, jute, groundnut, soybean and bajra (Mall et al, 2006b). Rabi crops include wheat, mustard, barley, potato, onion and gram (Mall et al, 2006b). The kharif crops are more likely to be impacted by extreme weather events, while rabi crops are more sensitive to uncertain winter precipitation (Mall et al, 2006b). For example, 50% of wheat is rain-fed, so rabi crops are very vulnerable to decrease in winter rainfall, a likely occurrence, as described above (Kalra et al, 2003). Recall that wheat is one of the key crops in terms of surplus and production, so diminished yields are likely to have significant economic impacts. Due to the fact that 60% of India’s crops are rain-fed (Mall et al, 2006b), increased precipitation uncertainty could have a wide impact, for uncertainty about the timing of the monsoon will limit the farmer’s capacity to adapt through crop choice and timing of planting (CENTRA Technology and Scitor Corporation, 2009). Unsurprisingly, historical data shows a high degree of correlation between monsoon rainfall and agricultural production (Ramesh and Yadava, 2005). For example, a 19% decline in the 2002 summer monsoon as opposed to the previous year resulted in a 18% decline in foodgrain production for 2002-2003 (Mall et al, 2006b). Salinity and waterlogging also plague the irrigation command areas of the GBM basin, factors likely to worsen as flooding and saline ingress increases (see Table 32). The extent of waterlogging and salinity ingress in the irrigated command areas of the Ganga basin states is already worrisome.Bihar is by far the most adversely affected by both waterlogging and saline ingress, though Uttar Pradesh too has a fairly high land area so afflicted. Recalling that Bihar produces a significant portion of India’s jute and mesta crop, these afflictions are likely to impact production there; however, because Bihar’s MSR for the jute crop was unavailable, the economic implications are less clear. Higher temperatures will also have an adverse effect on crop yields. Nationally, a rise in 2oC would reduce net national revenues by 12.3% (Kalra et al, 2003). Another study found that an increase in temperature by 2oC-3.5oC would result in a decline in farm level revenues by anywhere from 9-25%. For a more specific example, one study found that a 0.5oC increase in winter temperature would result in a 10% reduction in wheat production in Haryana and Uttar Pradesh; considering that this increase is considered highly likely, Haryana and Uttar Pradesh face significant economic losses to their wheat production. A separate study spells more bad news for Uttar Pradesh. With a 2oC rise in temperature and a 7% increase in precipitation, farm level revenues would reduce by 8.4%; a whole 40% of this impact would be concentrated on Uttar Pradesh, with an additional 10% for Madhya Pradesh, Haryana and Rajasthan (Kumar and Parikh, 2001). Given that Uttar Pradesh is the

Climate Change Situation Analysis • Ecosystems for Life38
single most important agricultural state in the GBM basin, these scenarios should be a matter of great concern. It bears mentioning that the same study found that these conditions would increase farm level revenues in West Bengal and Bihar, which should benefit jute farmers economically (Kumar and Parikh, 2001). Temperature increases are likely to also contribute to lesser available water, with resulting implications for agricultural production. Some of this impact will be felt in the form of drought: of the total rice-growing area in India, 22% is drought-prone and the probability of drought is 35% (Kalra et al, 2003). Drought, however, remains less of a threat in the India GBM, as mentioned earlier. A more likely impact on agriculture is a decrease in soil moisture from the decreased ‘drizzle-type’ rain, as well as increased evapo-transpiration, which is expected to offset the benefits of increased precipitation (Kumar and Parikh, 2001). These factors are also likely to have an impact on groundwater. Groundwater irrigation provides outsized economic benefits to agriculture, supplying 50% of irrigated agriculture but 70-80% of the total value of irrigated agriculture, country-wide (Mall et al, 2006). Overall, groundwater accounts for 40% of total agricultural output, which translates to around 9% of India’s GDP (Mall et al, 2006). To assess the specific vulnerabilities in the India GBM, Haryana and Rajasthan will have net negative groundwater availability for future irrigation just due to overexploitation (although climate change is likely already driving some of that behaviour); these projected shortages will have significant economic ramifications for the mustard crop of both states, as well as the wheat crop in Haryana (see Table 14, p 17). In terms of use, Uttar Pradesh uses over half of its groundwater for irrigation, while Madhya Pradesh, Bihar and West Bengal are not too far behind (see Table 15, p 18). Agriculture in these states will be most vulnerable to decreases in groundwater. To assess vulnerability by crop, wheat is the most dependent on irrigation, especially in Haryana, Nagaland, Uttar Pradesh, Bihar and Rajasthan, where 90-100% of wheat depends on irrigation. With 86%, Haryana is the most vulnerable to diminished availability of water for irrigation, though Uttar Pradesh is not far behind, with 75.5%. While rain-fed crops are especially vulnerable, it is important to understand the different kind of vulnerability faced by irrigated crops, in terms of diminished availability of water resources. For example, wheat in Assam is almost entirely rain-fed, leaving Assam’s production there very vulnerable to decreased winter precipitation. Additionally Himachal Pradesh, Jharkhand and Tripura’s mustard crop also relies heavily on precipitation and are thus vulnerable. Heavy rains and flood also represent a major threat to agriculture (see Table 33). Uttar Pradesh has by far the largest area affected, accounting for over half of the damage in the India GBM. However, comparing this data to the total cropped area, it is seen flood damage accounts for only a fraction of total cropland. Even so, the economic losses are real. Bihar clearly faced the most damage to crops, while Assam lost a breathtaking number of cattle. It is important to note that floods, even when damaging only a tiny area of land, can leave devastating economic impacts. The vulnerability of agriculture in India to climate change, accounting for extreme events, dryness and precipitation, has been researched; it represents a synthesis of climate exposure and adaptive capacity indictors to arrive at a more accurate metric for vulnerability (O’Brian et al, 2004). This study indicates that the central and western regions of India, namely Rajasthan, Haryana and Madhya Pradesh, are particularly vulnerable, while large swathes of Uttar Pradesh and Bihar are also at risk; it bears mentioning that other studies find Uttar Pradesh, Bihar and West Bengal as most at risk (CENTRA Technology and Scitor Corporation, 2009). But when we look at only climate exposure details (O’Brian et al, 2004), it is seen that Uttar Pradesh’s higher adaptive capacity allows it

39Ecosystems for Life • Climate Change Situation Analysis
to endure relatively worse conditions, while Bihar’s low adaptive capacity makes it more vulnerable to milder changes. The authors of this study have defined adaptive capacity using various socio-economic indicators, as well as the presence of alternative livelihood options and the ratio of landless labourers to land-owners. Indeed, examining the latter data (see Table 21, p 23) reveals the source of Bihar’s vulnerability: in Bihar, landless labourers account for 48% of all workers while landowners account for only 29.3%; by contrast, the figures for Uttar Pradesh are nearly reversed, at 24.8% versus 41.1%, respectively. Only West Bengal joins Bihar with a higher proportion of landless labourers to landowners, at 25% to 19.2% respectively. Before concluding this section, it should be noted that some studies actually find that agriculture in India will benefit from climate change. The reasoning behind this argument focuses on increased CO2 concentrations in the atmosphere, which facilitate plant photosynthesis (Mall et al, 2006b). For example, one study found that rice yields in India could improve by anywhere from 1-33% (Aggarwal and Mall, 2002). The issue with these studies is that they consider only temperature and CO2 concentrations, failing to account for the role of water resources. As such, their relevance to this analysis, which focuses specifically on the impacts of climate change on water, is limited. Supporting the decision to give less attention to these examples is another study which, by accounting for temperature, CO2 and water, found a 20% decline in rice yields (Lal et al, 1998). Finally, a survey of the literature shows that even those studies which display medium-term benefits due to the role of CO2 all agree that eventually temperature increases will come to outweigh any positive benefits of climate change, resulting in yield reductions across the board (Mall et al, 2006b).
Other assorted economic impactsThe other economic impacts of climate change will mostly come in the form of flood damages (see Table 34, p 40). Annual flood damages in north-east India already reach Rs 450 million (1977 price level; Huda, 2001). According to the CRED International Disaster Database, floods have cost India over US $29.4 billion since 1960. illuminates some of the economic damages of flooding for key states in 2004. Once more Bihar is the greatest sufferer, with the exposure of its public utilities sector accounting for almost half of the financial losses.
Table 33: Impact of floods on agriculture in select states of the India GBM (2004)
State/UTs Area affected (million ha)
Population affected (million)
Damage to Crops Cattle lost (no.)
Area (mha)
Value (Rs crore)
Arunachal Pradesh 0.16 0.31 0.01 103.53 5679
Assam 2.59 12.20 1.26 0.00 50375
Bihar 4.99 21.25 1.40 418.60 2673
Meghalaya 0.03 0.16 0.03 78.05 4993
West Bengal 0.01 0.18 0.00 14.22 34
Source : Central Water Commission

Climate Change Situation Analysis • Ecosystems for Life40
Knowledge gapsThere is a need to incorporate more agriculture-relevant data into climate models. Specifically, more information is needed on ‘mid-day highs’, which bears the most responsibility for the saturation deficit of plants, or drying out (Mall et al, 2006b). Given the possibility of a monsoon shift, information on monsoon timing is critical, as shifting crop schedules to more closely align with the monsoon is a no-cost decision for farmers (Mall et al, 2006b). Models must also take an integrated approach, soliciting input from diverse stakeholders like climatologists, economists, industry and farmer organizations (Mall et al, 2006b). Finally, the inferences on specific crops and their potential economic values must be carried further, perhaps by maps which overlay cropping patterns, climate exposure and the economic value of crops.
Social impacts: focus on India and select statesAs described in the IPCC 2001 report, vulnerability is a confluence of exposure to climate risk, sensitivity of the given environment to those changes and adaptive capacity in the form of livelihood stability or flexibility and various socio-economic capabilities (McCarthy et al, 2001). The preceding discussion on impacts has detailed the exposure and sensitivity of given populations; here, let us turn to adaptive capacity. The exposure of landless labourers discussed earlier represents just one of the many indicators of low adaptive capacity. Another indicator is living conditions, namely whether a person lives in a slum. Such populations are at greater risk of displacement through floods and more exposed to intense heat and precipitation (Revi, 2008); one study expressed the fear that floods and heavy rains would likely sweep away shanties and makeshift urban dwellings (CENTRA Technology and Scitor Corporation, 2009). These populations are also more vulnerable as they lack the ability to mortgage their property to endure a particularly troubled time, a strategy which was cited in surveys in India and Bangladesh as a key coping mechanism (Muhammed, 2004). Haryana, West Bengal, Dehli, Rajasthan, Meghalaya, Uttar Pradesh, Madhya Pradesh and Uttarakhand have especially high slum populations, though examining the discrepancies between what it means to live in an urban area and in a slum tells a more complete story (see Table 35). The slum population of Meghalaya, for example, comprises a high but not astronomical 19% of the
Table 34: The damage floods create, in key India GBM states, 2004
State/UTs Damage to Houses Human lives lost (no.)
Damage to public utilities
(Rs crore)
Total damage to crops, houses & public utilities
(Rs crore)
no. Rs crore
Arunachal Pradesh 0 37.23 15.00 364.81 505.57
Assam 589064 0.00 251 0.00 0.00
Bihar 897427 739.49 800 1057.69 2215.78
Meghalaya 32 1.42 13 130.87 210.34
West Bengal 1812 73.65 5 2.49 90.36
Source : Central Water Commission

41Ecosystems for Life • Climate Change Situation Analysis
urban population, but a shocking 65% of one city/town lives in slums; clearly, only one town/city in Meghalya has a vulnerable slum population. Uttarakhand, Uttar Pradesh, Rajasthan, and Madhya Pradesh also exhibit a discrepancy between the two metrics, indicating that their slum populations are concentrated in select areas. West Bengal and Delhi exhibit commensurate proportions in each metric, suggesting a large slum problem throughout the states. The figures for Haryana, while displaying some discrepancy, are high enough to suggest that many people in the state are quite vulnerable. In general, the slum populations of Haryana, Delhi, Uttar Pradesh and Madhya Pradesh will be exposed to the increases in temperature which will hit the region, while those in Meghalaya and West Bengal will have little to protect them against increased precipitation and the resultant flooding. Marginal workers, too, especially those in rural areas, are also especially vulnerable to natural disasters (CENTRA Technology and Scitor Corporation, 2009; see Table 21, p 23). Recall that Himachal Pradesh, Uttar Pradesh, Haryana, Bihar, Assam, Jharkhand and Madhya Pradesh all have a relatively higher proportion of marginal workers (defined as approximately one-third or greater the number of main workers), especially in rural areas. Given the pessimistic outlook for agriculture in Uttar Pradesh, Haryana, Bihar, Jharkhand and Madhya Pradesh, marginal workers in these states are especially vulnerable. Marginal workers and landless labourers, losing jobs in rural communities, may be forced to migrate to cities, only to find that when they arrive in urban India, their relatively lower educational and skill levels may prevent them from integrating into India’s booming economy (CENTRA Technology and Scitor Corporation, 2009).
Table 35: Urban and slum population in the India GBM, 2001
State Number of Cities/
towns reporting
slums
Total urban population
Population of cities / towns report slums
Total slum population
% of slum population to total
Urban Population
Population of cities / towns reporting
slumsAssam 7 3439240 1371881 82289 2.4 6.0
Bihar 23 8681800 4814512 531481 6.1 11.0
Haryana 22 6115304 4296670 1420407 23.2 33.1
Madhya Pradesh 43 15967145 9599007 2417091 15.1 25.2
Meghalaya 1 454111 132867 86304 19.0 65.0
Rajasthan 26 13214375 7668508 1294106 9.8 16.9
Delhi 16 12905780 11,277,586 21029755 15.7 18.0
Jharkhand 11 5993741 2422943 301569 5.0 12.4
Tripura 1 545750 189998 2949 5.5 15.8
Uttar Pradesh 69 34539582 21256870 4395276 12.7 20.7
Uttarakhand 6 2179074 1010188 195470 9.0 19.3
West Bengal 59 22427251 15183596 4115980 18.5 27.1
Notes: Arunachal Pradesh, Nagaland, Sikkim, Himachal Pradesh, Manipur and Mizoram did not report any slum population for 2001; Source : Census of India 2001

Climate Change Situation Analysis • Ecosystems for Life42
The ability to borrow money, through formal or informal schemes, is a key adaptive measure (Muhammed 2004). Therefore, people in the India GBM who already face indebtedness will have less recourse in the future (see Table 36). Indebtedness is pervasive in the India GBM, the region accounting for slightly less than half of all indebted farmers in India. Haryana, Rajasthan, Tripura, Madhya Pradesh, Uttar Pradesh and Uttarakhand face the highest shares of indebted farmers. This will greatly limit the adaptability of farmers here. Meanwhile, farmers in Tripura, likely facing increased flooding due to the increase in intense precipitation events, will have limited ability to persevere through flood times, as 49.2% of them are in debt.
Impact on Scheduled Castes and Scheduled TribesScheduled castes and tribes represent some of the most vulnerable populations in India. As detailed earlier, the highest concentration of STs exist in north-east India. In general, the high population
Table 36: Rural households, farmer households and indebted farmer households in the India GBM
State Rural households ('00)
Farmer households ('00)
Indebted farmer households ('00)
Farmer households
indebted (%)
Arunachal Pradesh 15412 1227 72 5.9
Assam 41525 25040 4536 18.1
Bihar 116853 70804 23383 33.0
Haryana 31474 19445 10330 53.1
Himachal Pradesh 11928 9061 3030 33.4
Jharkhand 36930 28238 5893 20.9
Madhya Pradesh 93898 63206 32110 50.8
Manipur 2685 2146 533 24.8
Meghalaya 3401 2543 103 4.1
Mizoram 942 780 184 23.6
Nagaland 973 805 294 36.5
Rajasthan 70172 53080 27828 52.4
Sikkim 812 531 174 38.8
Tripura 5977 2333 1148 49.2
Uttar Pradesh 221499 171575 69199 40.3
Uttrakhand 11959 8962 644 7.2West Bengal 121667 69226 34696 50.1
India GBM total/avg 788107 529002 214157 31.9
India 1478988 893504 434242 48.6
Source : Report No. 498(59/33/1), Situation Assessment Survey of Farmers: Indebtedness of Farmer Households, National Sample Survey 59th Round (January-December 2003)

43Ecosystems for Life • Climate Change Situation Analysis
densities and large amounts of poverty here makes this region very vulnerable to an increase in flooding (Revi, 2008); therefore, these tribal populations are going to be very vulnerable. Jharkhand and Madhya Pradesh also have large ST populations, which may fall victim to the negative agricultural outlook in those states. In terms of SCs, Himachal Pradesh, Uttarakhand, Rajasthan, Uttar Pradesh and Mizoram were found to have a higher proportion of SCs than the Indian average. As an assessment of the vulnerability of these groups in the different states, the same slum-dwelling criteria used above will be applied (see Table 37). The average number of STs and SCs living in slums is higher in the GBM states than in India as a whole. Delhi, Haryana, Uttarakhand, Uttar Pradesh, Tripura, Madhya Pradesh, Rajasthan and Bihar all have relatively high slum dwelling populations of SCs. The figures for Bihar and Tripura suggest that SCs are especially disadvantaged there, given that these states exhibit relatively low overall slum populations; by contrast, SCs in Haryana represent a relatively lower proportion of slum dwellers. In Delhi, Haryana, Uttar Pradesh and Rajasthan, these populations will have little reprieve from the increased instances of intense heat and precipitation predicted for those states, though in Rajasthan the extra rainfall might serve as a bit of a reprieve from drought and high temperatures. SCs in Bihar and Tripura face increased flooding and intense precipitation as their greatest threats. As for ST slum populations, a shocking 50.8% of Meghalaya’s ST population resides in slums, nearly 25 times the national proportion; recall, however, that this population is likely concentrated in one area. Like the SCs of Tripura, these populations will
Table 37: Scheduled Caste and Scheduled Tribe populations in slums in the India GBM
States Population in Slum Areas Percentage of Population in Slum Areas
Percentage of Population in Urban Areas
Scheduled Castes
Scheduled Tribes
Scheduled Castes
Scheduled Tribes
Scheduled Castes
Scheduled Tribes
Uttarakhand 44865 362 23.0 0.2 12.0 0.7
Haryana 267975 NST 18.9 0.0 14.4 0.0
Delhi 552784 NST 27.2 0.0 16.7 0.0
Rajasthan 349473 52763 27.0 4.1 14.8 2.9
Uttar Pradesh 898790 2495 20.4 0.1 12.5 0.0
Bihar 94523 7724 17.8 1.5 10.0 0.5
Tripura 7136 619 23.8 2.1 18.3 4.7
Meghalaya 720 43843 0.8 50.8 0.9 68.3
Assam 12355 211 15.0 0.3 7.9 4.5
West Bengal 567522 50810 13.8 1.2 13.1 1.2
Jharkhand 26105 50425 8.7 16.7 10.0 9.8
Madhya Pradesh 510034 91399 21.1 3.8 14.0 4.9
India GBM total 3332282 300651 18.1 6.7 12.1 8.1
India 7402373 1017408 17.4 2.4 11.8 2.2
Source: Census of India 2001

Climate Change Situation Analysis • Ecosystems for Life44
be exceptionally vulnerable to floods and intense rainfall as well. Jharkhand also has a relatively high number of STs in slums, though temperature and precipitation increases will be relatively mild there.
Health impacts: focus on malariaIndia’s changing climate will have a profound impact on the transmission of malaria, yielding both negative and positive changes. A 3.8oC increase would increase the number of states with a malaria transmission window of 12 months from just West Bengal to nine states (Kelkar and Bhadwal, 2007). In a climate change scenario, West Bengal and south Assam will remain malaria-prone, though increases in maximum temperatures in West Bengal are likely to result in a decreased transmission window (Battacharya et al, 2006). The malaria zone which currently occupies central India in Madhya Pradesh and Jharkhand is likely to shift south-westward, out of the GBM basin. However, increased temperatures will open up new transmission windows or increase those already in existence in Himachal Pradesh, Arunachal Pradesh, Nagaland, Manipur and Mizoram (Battacharya et al, 2006). Urban populations tend to be at greater risk due to their higher concentration and poor sanitation (Mitra et al, 2003). Of the malaria-prone states in the climate change scenario, Arunachal Pradesh, Manipur and Nagaland all have relatively high percentages of urban populations (around 20%), with the ratio of urban population reaching as high as 27.9% in West Bengal and 49.63% in Mizoram. While studies examining the impact of overall precipitation on malaria transmission have found no observed relationship, higher precipitation in October shows a correlation with increased incidences of malaria; the authors reasoned that rainfall in October leads to good vegetation growth, which promotes humidity retention, leading to a stronger malaria season (Battacharya et al, 2006). Of the future malaria-prone states, both Arunachal Pradesh and Himachal Pradesh are projected to face relatively large increases in October rainfall, possibly contributing to higher incidences of malaria in those regions. Warmer and wetter conditions will increase the incidence of other infectious diseases in India as well (Kelkar and Bhadwal, 2007). For example, increased floods will result in higher incidences of cholera, diarrhoea and other water-borne illness as water supplies are contaminated (Kelkar and Bhadwal, 2007). Food poisoning and water-borne illness will increase as higher temperatures will increase both the chances and duration of survival for aquatic pathogens (Mitra et al, 2003). Incidences of dengue are also likely to increase due to wetter conditions (Mitra et al, 2003).
Reduced drinking water accessBefore examining the likelihood of reduced drinking water access due to climate change, baseline water access details must be determined (see Table 38). Assam, Jharkhand, Madhya Pradesh, Rajasthan and Tripura have the lowest overall access to safe water. Examining the rural numbers for all these states paints an even direr picture, for a state like Tripura has its very low rural percentage nudged up by its relatively high urban access rate; examining rural figures alone, one could also add Sikkim to the list of states with limited access. These statistics, coupled with the relevant environmental data presented earlier, can help guide policies to continue to protect and increase drinking water access in a climate change scenario. For example, government bodies and NGOs should target states like Assam and Tripura with appropriate rainwater harvesting interventions to utilize the projected increases in future precipitation to address the currently low rates of drinking water access. Additionally, water quality and sanitation interventions should focus on states like Madhya Pradesh and Rajasthan which will likely face increases in water-borne illnesses due to higher temperature and less access to reliable water sources.

45Ecosystems for Life • Climate Change Situation Analysis
Groundwater fulfills the domestic needs of more than 80% of the rural population and 50% of the urban population (Mall et al, 2006; see Table 39, p 46). Uttar Pradesh, Tripura, Assam, West Bengal, Jharkhand, Madhya Pradesh and especially Bihar are all very dependent on groundwater for their drinking water supplies. Temperature increases in Uttar Pradesh, Madhya Pradesh, West Bengal and to a lesser extent Bihar and Jharkhand will lead to increased evapo-transpiration rates in these areas, threatening groundwater recharge. Uttar Pradesh will also experience a relatively smaller increase in precipitation, making it especially vulnerable to reduced groundwater supplies for drinking water. In general, dependency tends to be higher in rural areas, with the exception of Nagaland, suggesting greater vulnerability in those areas. This fact is especially true for states like Tripura, Assam, Jharkhand and Madhya Pradesh, which were cited above as already having low rural access rates.
Knowledge gapsThe knowledge gaps in terms of the social impacts relate to malaria transmission. Models should include socio-economic indictors, like those incorporated into the agricultural maps earlier, to reach a better understanding of vulnerable populations (Battacharya et al, 2006). Models must also take a district level focus and do more to incorporate climate factors, so changing malaria risks can be better understood (Mitra et al, 2003). Malaria monitoring systems must improve to track risk on a more immediate basis (Battacharya et al, 2006). Other social knowledge gaps could involve translating environmental impacts directly into human costs on a local, perhaps even district level so policy makers and aid organizations will have better awareness as to who will be in the greatest need.
Table 38: India GBM households with access to safe drinking water (2001)
State / UT Rural (%) Urban (%) Total (%)
Arunachal Pradesh 73.7 90.7 77.5
Assam 56.8 70.4 58.8
Bihar 86.1 91.2 86.6
Delhi 90.1 97.7 97.2
Himachal Pradesh 87.5 97.3 88.6
Jharkhand 35.5 68.2 42.6
Madhya Pradesh 61.5 88.6 68.4
Rajasthan 60.4 93.5 68.2
Sikkim 67.0 97.1 70.7
Tripura 45.0 85.8 52.5
Uttar Pradesh 85.5 97.2 87.8
Uttarakhand 83.0 97.8 86.7
West Bengal 87.0 92.3 88.5
Source : Statistical Abstract India 2005-06, Ministry of Statistics and Programme Implementation, Government of India

Climate Change Situation Analysis • Ecosystems for Life46
Political impacts: focus on India and select statesTwo types of resource disputes will plague India as its population and per capita water footprint increase, while water availability decreases: demand competition and conflicting claims to resources. Demand competition will take the form of increasing urban and industrial users demanding an increasing proportion of the available water supply, pitting them against the current dominant user, the rural farmer (Bandopadhyay, 2006). By 2050, domestic water demand is estimated to double, while industrial and energy use increases by factors of eight and seventy, respectively (Lal, 2005). Estimates show that, due to this increased demand, per capita drinking water will drop from 600 litres per day to 300 litres per day by 2030 (Lal, 2005). Much of the increased in domestic demand will come from cities, as 500 million people migrate to India’s cities by 2060; these migrations will begin to form a vicious cycle, in which urban demand saps rural water supplies, increasing rural to urban migration and resulting in an even greater increase in urban demand (Revi, 2008). Looking at groundwater use (see Table 15, p 18) presented earlier, Uttar Pradesh and Madhya Pradesh are expected to see the largest increases in terms of total BCM/year in demand for domestic and industrial uses, while Bihar and Rajasthan will see more modest increases. Given that temperature
Table 39: Households dependent on groundwater in the India GBM (2001)
States Rural (%) Urban (%) Total (%)
Himachal Pradesh 10.0 4.0 9.3
Uttarakhand 24.0 15.7 22.0
Haryana 59.8 26.4 49.6
Delhi 38.8 20.7 21.9
Rajasthan 68.9 17.5 57.0
Uttar Pradesh 88.0 44.5 75.7
Bihar 97.8 72.4 95.5
Sikkim 0.7 0.2 0.5
Arunachal Pradesh 15.3 11.5 14.5
Nagaland 36.9 53.7 39.4
Manipur 16.2 8.4 14.1
Mizoram 6.3 5.9 6.0
Tripura 71.7 42.4 66.3
Meghalaya 36.7 14.0 31.9
Assam 78.4 63.5 76.3
West Bengal 91.3 42.1 77.1
Jharkhand 91.0 48.9 81.9
Madhya Pradesh 86.4 30.5 72.1
India GBM average 51.0 29.0 45.1
India 71.1 29.0 59.5
Source : National Commission for Women.

47Ecosystems for Life • Climate Change Situation Analysis
increases will likely cause evapo-transpiration to increase in all these states, with a resultant decline in available water, they should all be considered potential ‘hot spots’ for water demand conflicts. Could inter-linking of rivers be an adaptive solution? Given the projected decreases in water availability in Uttar Pradesh, Madhya Pradesh and Rajasthan, this plan has plenty of merit. However, the loss of such a substantial amount of water from rivers which will see reduced flows in the coming years will no doubt have implications for the inhabitants of those basins. As water decreases throughout the country and adaptive schemes such as river iner-linking are proposed, issues of equity and water sharing will increase, potentially leading resulting in political conflicts.
Knowledge gapsMany knowledge gaps exist in terms of the political impacts of climate change. More data is needed on projected urban and rural demands for water so hot spots of scarcity-induced conflict can be identified. Additionally, more research is needed in order to assess the impact of the India’s river-linking scheme on those who stand to lose water, both to ensure equity and gauge the chances of conflict (Ahmad and Ahmed, 2004).
n Policy and governance solutions
In order to combat coming water scarcity, India will need to act aggressively to develop its water infrastructure. No region typifies that necessity than the north-east. While the Brahmaputra and Meghna basins (concentrated in the north-east India) account for 32% of India’s water resources, it has a storage capacity of only 12%, about 72 billion cu m (Mohile, 2001). The effect of this underdevelopment is evidenced by the fact, cited earlier, that India utilizes only 4% of the available surface water of the Brahmaputra and Meghna river basins. This inability to capitalize on available water resources is indicative of economic scarcity, or water shortages resulting from a lack of infrastructure to utilize available supplies. Water storage would also mitigate flood damage, which reaches as high as Rs 450 million annually in the region (Huda, 2001). Increased precipitation in the region will increase the costs of floods, while also increasing the potential benefits of water storage. Furthermore, as food production is threatened elsewhere in the country, the relatively less affected North-East will have to compensate. As of 1991-1992, foodgrain production in the region was only 5.14 million tonnes, while projected food demand there is 16.4 million (Mohile, 2001). Despite the need for an increase in agricultural development, irrigation has lagged (Mohile, 2001). As indicated earlier (see Table 13, p 16), only Mizoram stands to receive large investments in water storage in the future. A survey of leading stakeholders from diverse fields such as civil society organizations and farmers groups identified a number of key adaptive measures which could benefit from additional research (Muhammed et al, 2004). Studies should focus on improving the access to and quality of financial mechanisms like insurance schemes and credit systems for farmers to adapt to uncertain circumstances (Muhammed et al, 2004). Other suggestions included dissemination of water budgeting knowledge and small-scale water efficiency technology, assessments of the impact of climate change on irrigation and the study of water trading between states, regions and farmers (Muhammed et al, 2004). The need for the design and dissemination of irrigation efficiency technology is underscored by the fact that South Asia has some of the least efficient irrigation technology in the world (Bandopadhyay, 2006). Studies of economic incentives for demand management should also be conducted (Bandopadhyay, 2006).

Climate Change Situation Analysis • Ecosystems for Life48
Additionally, due attention must be given to the value of traditional knowledge. For years, local peoples successfully managed their water supplies and developed sound management techniques (Bandopadhyay, 2006). As an example, farmers in north-east use bamboo pipes to divert stream water as a low-cost irrigation tool (Kelkar and Bhadwal, 2007). Research must be done to cull water management best practices from traditional sources.
Co-operative adaptive measuresCooperation between India and Bangladesh on water issues began with the 1977 treaty on Ganges Water Sharing, which was followed by two Memoranda of Understanding on lean-season flows for 1982-1983 and 1985-1988 (Ahmad and Ahmed, 2004). The primary water treaty, centered on waters around Farakka, went into effect in 1997. The terms are summarized below:• Establishment of 50/50 sharing between the countries when water availability at Farakka is
70,000 cusec or less;• Reservation of 35,000 cusec for Bangladesh and the remainder for India when flow is between
70,000-75,000 cusec• Allowing the use of 40,000 cusec for India and the rest for Bangladesh when flow is greater than
75,000 cusec.• If flows at Farakka were to fall below 50,000 cusecs in any 10 day period, “the two Governments
will enter into immediate consultations to make adjustments on an emergency basis in accordance with the principles of equity, fair play and no harm to either party.” (Adhikari et al, 2000)
A Joint Rivers Commission was also established as part of this treaty to facilitate management and dialogue (Adhikari et al, 2000). Cooperation on flood warning represents the other major area of cooperation. Currently, India transmits actual and forecasted river-level data to Bangladesh from the Ganga at Farakka, from the Brahmaputra at Goalpara and Dhurbi, from the Teesta at Domohani and from the Meghna at Silchar; rainfall data is transmitted from seven sites around the GBM region (Shah, 2001). In addition to these official or ‘Track I’ cooperative efforts, unofficial ‘Track II’ research collaborations have been underway since 1990 between the Bangladesh Unnayan Parishad (BUP) in Dhaka, the Center for Policy Research (CPR) in New Delhi and the Institute for Integrated Development Studies (IIDS) in Kathmandu (Ahmad and Ahmed, 2004). Some of the fruits of this collaborative labour will guide the recommendations of this paper (Adhikari et al, 2000).
Co-operation on flood forecasting and managementDespite the cooperative efforts on flood forecasting and management, both countries stand to gain a lot from greater collaboration in this area. Existing flood forecasting would benefit tremendously from real-time data transfer even before water reaches critical levels (Ahmad and Ahmed, 2004; Biswas, 2008). Joint flood modelling using state of the art hydro-dynamic models incorporating satellite information would also increase preparedness in both countries (Ahmad and Ahmed, 2004). Greater cooperation in this area should not be too difficult, as both countries currently use the same MIKE II flood monitoring software (Adhikari et al, 2000). A lack of collaboration on flood management issues has resulted in increased flood damages to both countries. For example, the construction of large-scale embankments shift flood patterns away from “protected” areas while contributing to drainage congestion and over-bank spilling (Adhikari et al, 2000). Greater coordination with these measures could ensure that actions by one riparian do not adversely impact the other while increasing the effectiveness of flood management strategies. All

49Ecosystems for Life • Climate Change Situation Analysis
of these measures must coalesce into a broader vision for integrated disaster management between the two countries (Biswas, 2008). As part of this cooperative agenda, both countries could engage in and share knowledge about “flood-plain zoning” into their planning policies – an idea which is well received in India (Adhikari et al, 2000). Given the apparent lack of any downside to greater collaboration in this area, implementation of measures such as these should begin immediately and irrespective of progress in other areas (Biswas, 2008).
n Water-sharing agreements
Both nations are currently planning irrigation projects on the Teesta river, a major tributary of the Brahmaputra. The Bangladeshi project plans utilize a 615 m barrage to irrigate 749,000 ha, while the Indian project will utilize a 936 m barrage to irrigate 925,000 ha (Adhikari et al, 2000). However, estimates show that flows in the lean-season will not be adequate to meet the needs of both countries (Biswas, 2008). A solution suggested by multiple authors would be for India to share water from its project with Bangladesh, maintaining adequate flows while meeting the needs of both countries (Adhikari et al, 2000; Biswas, 2008). The Joint Rivers Commission could govern flow sharing, especially after undertaking realistic assessments of Teesta flows and the requirements of the various command areas of each country (Adhikari et al, 2000). As flows diminish on other rivers that pass from India to Bangladesh, the two countries will have to continue to compromise on water sharing to ensure that the needs of both are met.
Augmenting lean season flow Upstream water storage in Nepal promises greater potential to facilitate lean-season augmentation in the Ganga than any other strategy (Adhikari et al, 2000). One author concludes that water storage in Nepal of excess monsoon flows for release in the dry season is the only true long term solution to dry season scarcity (Samarakoon, 2004). Another study demonstrates that doing so would, in addition to the augmentation of dry season flows, provide increased hydroelectricity to all three countries while stemming salinity ingress in India and Bangladesh (Ahmad and Ahmed, 2004), while reducing flood damage during the monsoon in Uttar Pradesh, Bihar, West Bengal, Assam and all of Bangladesh (Biswas, 2008). When accounting for all the benefits in terms of flood control, power generation, increased irrigation, etc. upstream water storage dams have a cost-benefit ratio of over 2:1 (Adhikari et al, 2000). While the scope of this paper is meant to focus on India-Bangladesh cooperative efforts, bringing Nepal into the conversation is imperative as almost all promising sites for locating future multipurpose dams in the Ganga basin lie in Nepal (Adhikari et al, 2000). Bangladesh had proposed seven possible storage sites in Nepal as early as 1977 (Adhikari et al, 2000; Ahmad and Ahmed, 2004; Bandopadhyay and Ghosh, 2009). Nepal has also identified 28 possible sites, including nine large dams with a total storage capacity of over 110 billion cu m
India and Bangladesh can only gain by greater collaboration, whether the issue is tackling water scarcity, or its opposite, flood forecasting and management. Another aspect that begs such joint attention or action is augmenting lean season flow

Climate Change Situation Analysis • Ecosystems for Life50
(Biswas, 2008). The water stored by these sites would account for only 10% of annual river flows, so it is likely that the required ecological flow rate would be maintained given the tremendous surplus of monsoon season flows (Biswas, 2008). The collaborative Track II research efforts have endorsed Nepal’s proposal, which also includes six of the seven sites suggested by Bangladesh (Adhikari et al, 2000). Such implementation would require a regional treaty between the three countries, and all should become investors in the project to ensure each country receives due benefit (Samarakoon, 2004).Co-operation on water qualityThere are numerous opportunities for cooperation in the area of water quality. First of all, a real-time exchange of water quality data could improve quality management in each country (Biswas, 2008). Joint quality monitoring should accompany exchange of flow data to ensure that ecological flows are maintained (Biswas, 2008). Monitoring pollution flows also is required in order to arrive at appropriate legal remedies for victims of water pollution (Bandopadhyay, 2006). Finally, given that arsenic contamination of groundwater plagues both West Bengal and Bangladesh, the two countries should undertake joint efforts at understanding the cause of this problem and working together to mitigate it (Bandopadhyay, 2006).
Knowledge gapsIn order for the cooperative agenda described above to be implemented, several knowledge gaps must first be addressed. First and foremost, more studies detailing the costs of inaction, in terms of benefits foregone and increased damages from floods, and other impacts, accrued, could help spur policy makers into action; currently, no systemic study has been done (Huda, 2001). In terms of flood management, research must be done to ensure that flood mitigation measures take into account the ecological benefits of flooding, such as the ecosystem services provided by levels of sedimentation to agriculture (Bandopadhyay, 2006; Bandopadhyay and Ghosh, 2009). A number of knowledge gaps exist in regards to water-sharing agreements on the Teesta. Specifically, no significant studies have been carried out in either country, let alone jointly, on each country’s actual requirements for water from this river to facilitate an optimal use scenario (Shah 2001). More surprisingly, no agreed quantification of Teesta flows has been made, for tremendous uncertainties exist in the observed data from monitoring sites in both countries (Adhikari et al, 2000). Inhibiting cooperation on this front is that transboundary flow data is at times considered “classified” by governments in South Asia – an obvious impediment to the sharing of transboundary flow data (Bandopadhyay and Ghosh, 2009). In terms of the upstream storage in Nepal, additional studies are needed to determine the appropriate balance of storage and eventual discharge in regards to issues like flood management, power generation and flow augmentation (Adhikari et al, 2000). Research in this area should seek to maximize sharing of costs and benefits for the three countries involved (Adhikari et al, 2000). Finally, in order to facilitate joint water quality monitoring, both countries must agree on uniform water quality standards, a process which would be facilitated by the undertaking of joint quality studies (Adhikari et al, 2000; Ahmad and Ahmed, 2004; Biswas, 2008).
The way forwardA new paradigm of integrated water management between India and Bangladesh is required to meet the challenges of the time. This new paradigm must come to see the economic benefits of working together, rather than the current paradigm which views water resources as a zero-sum

51Ecosystems for Life • Climate Change Situation Analysis
game (Bandopadhyay and Ghosh, 2009). The governance systems implemented both intra- and internationally must include all stakeholders, as the exclusion of voices from the most vulnerable communities allows policy makers and service-providers to escape accountability. The joint research knowledge gaps outlined in this paper present an excellent opportunity for Track II efforts to progress, hopefully resulting in greater Track I cooperation.
Suggestions for future researchThe knowledge gaps detailed throughout this paper primarily focused on localizing climate models, while fully integrating other vulnerability statistics like socio-economic factors and the input of other stake holders. Another major concern identified was the lack of flow data, specifically related to some of the more dynamic hydrological systems in the region Additionally, best practices on adaptation, whether from traditional sources or involving low-cost technology, must be identified and disseminated to local peoples. Overall, a need for indigenous South Asian knowledge sources is required, as currently European models which often fail to account for significant ecological and cultural factors unique to the South Asia guide research in the region (Bandopadhyay, 2006)
K Shreelakshmi, Ph.d., Fellow, Water Resource Division, The Energy and Resource Institute (TERI), New Delhi, India.
Endnotes1 Whether this difference is due to differing measurement standards or land degradation over time is unclear.2 The utility of this observation could be questioned on the grounds that taking the average of the states, rather than
calculating it out of the true population is less useful, but it still provides a basin-wide approximation.
References• Adhikari, K.D., Q.K. Ahmad, S.K. Malla, B.B. Pradhan, Khalilur Rahman, R.Rangachari, K.B. Sajjadur Rasheed, and B.G.
Verghese, Cooperation on Eastern Himalayan Rivers: Opportunities and Challenges. New Delhi: Center for Policy Research, 2000.
• Aggarwal, P.K. and R.K. Mall. “Climate Change and Rice Yields in Diverse Agro-environments of India. II. Effects of uncertainties in scenarios of crop models on impact assessments.” Climate Change 52 (2002): 331-343.
• Ahmad, Q.K. and Ahsan Uddin Ahmed. “Regional Cooperation on Water and Environment in the Ganges Basin: Bangladesh Perspectives.” in The Ganges Water Diversion: Environmental Effects and Implications ed. M. Monirul Qader Mirza (Netherlands: Kluwer Academic Publishers, 2004): 305-325
• Bandyopadhyay, Jayanta. “A Framework for Research on Integrated Water Systems Management in South Asia.” Centre for
Development and Environment Policy: Indian Institute of Management (2006).• Bandyopadhyay, Jayanta and Nilanjan Ghosh. “Holistic Engineering and Hydro-Diplomacy in the Ganges-Brahmaputra-
Meghna Basin.” Economic and Political Weekly XLIV (2009): 50-60

Climate Change Situation Analysis • Ecosystems for Life52
• Bhattacharya, Sumana, C. Sharma, R. C. Dhiman and A.P. Mitra. “Climate Change and Malaria in India.” Current Science 90 (2006): 369-375
• Biswas, Asit K. “Management of Ganges-Brahmaputra-Meghna System: Way Forward.” in Management of Transboundary
Rivers and Lakes eds. Olli Varis, Cecilia Tortajada, Asit K. Biswas (Heidelberg: Springer, 2008): 143-164• Central Bureau of Health Intelligence, compiler. National Health Profile 2009. Ministry of Health and Family Welfare.• Central Ground Water Board. “Ground Water Quality Scenario” http://cgwb. gov.in/GroundWater/Gw_quality.html,
accessed February 10, 2011.• Central Ground Water Board. “Ground Water Statistics 1996.” Water Data Book 2005. Water Resources Information
System, compiler. Central Water Commission: 2005.• Central Statistical Organization, Ministry of Statistics and Program Implementation. 2009.• CENTRA Technology inc, and Scitor Corporation. “India: The Impact of Climate Change to 2030, Geopolitical Implications.”
Paper presented to National Intelligence Council, United States, May, 2009.• Chadha, D.K.. “Climate Change and Ground Water Resources of Deccan asalt and Ganga Basin.” Presented at the the
NATCOM – V&A Workshop on Water Resources, Coastal Zones and Human Health, IIT Delhi, Nw Delhi, June 27-28, 2003.• Department of Education. Ministry of Human Resources Development. 2001• Directorate of Economics and Statistics, Department of Agriculture and Cooperation, compiler. “Agricultural Statistics at
a Glance 2010.” http://dacnet.nic.in/ eands/latest_2006.htm 2010, accessed February 10, 2011.• Directorate of Economics and Statistics, compiler. “Report No. 498(59/33/1) Situation Assessment Survey of Farmers:
Indebtedness of Farmer Households.” National Sample Survey 59th Round (January-December 2003), 2003.• Goel R.S. ed. “Environmental Impacts of Water Resource Development.” Proceedings of the National Round Table
Discussion, New Delhi, June 4-5, 1993 (New Delhi: Tata McGraw-Hill Publishing Company Ltd, 1993).• Goodbred, Steven L. “Response of the Ganges dispersal system to climate change: a source-to-sink view since the last
interstate.” Sedimentary Geology 162 (2003): 83-104• Gosain, A.K. and Sandhya Rao. “Impacts of Climate Change on Water Sector.” in Climate Change and India: Vulnerability
Assesment and Adaptation eds. P.R. Shulka, Subodh K. Sharma, N.H. Ravindranath, Amit Garg and Sumana Bhatacharya (Hyderabad: University Press, 2003):159-192.
• Hasnain S.I. Himalayan Glaciers – Hydrology and Hydrochemistry. New Delhi: Allied Publishers Ltd., 1999.• Hasnain, S.I.. “Impact of Climate Change on Gangotri and Chhota Shigri Glacier.” Presented at the NATCOM – V&A
Workshop on Water Resources, Coastal Zones and Human Health, IIT Delhi, New Delhi, June 27-28, 2003.• Huda, A.T.M. Shamsul. “Constraints and Opportunities for Cooperation Towards Development of Water Resources in the
Ganges Basin.” in Sustainable Development of the Ganges-Brahmaputra-Meghna Basins. eds. Asit K. Biswas and Juha I. Uitto (New Delhi: Oxford University Press, 2001): 46-57.
• Karla, Naveen, P.K. Aggarwal, S. Chander, H. Pathak, R. Choudhary, A. Chaudhary, Mukesh Sehgal, H.K. Rai, U.A. Soni, Anil Sharma, Monica Jolly, U.K. Singh, Owes Ahmed and M.Z. Hussain. “Impacts of Climate Change on Agriculture.” in Climate
Change and India: Vulnerability Assesment and Adaptation eds. P.R. Shulka, Subodh K. Sharma, N.H. Ravindranath, Amit Garg and Sumana Bhatacharya (Hyderabad: University Press, 2003):193-226.
• Kelkar, Ulka and Suruchi Bhadwal. South Asian Regional Study on Climate Change Impacts and Adaptation: Implicatons for Human Development.” UNDP Human Development Report (2007).
• Kripalani, R. H., Ashwini Kulkarni, S.S. Sabade and M.L. Khandekar. “Indian Monsoon Variability in a Global Warming Scenario,” Natural Hazard 29 (2003): 189-206.
• Kumar, Rakesh, R.D. Singh and K.D. Sharma (2005), “Water resources of India”, Current Science 89 (2005): 794-811.• Kumar, Rupa K, A.K. Sahai, K. Krishna Kumar, S.K. Patwardhan, P.K. Mishra, J.V. Revadekar, K. Kamala and G.B Pant. “High-
resolution Climate Change Scenarios for India for the 21st Century.” Current Science 90 (2006): 334-344.• Lal, M. “Climatic Change – Implications for India’s Water Resources.” Journal of Indian Water Resources Society, 21 (2001):
101-119

53Ecosystems for Life • Climate Change Situation Analysis
• Mall, R.K., Akhilesh Gupta, Ranjeet Singh, R.S. Singh and L.S. Rathore. Water Resources and Climate Change: an Indian Perspective.” Current Science 90 (2006): 1610-1626.
• Mall R.K., Ranjeet Singh, Akhilesh Gupta, G. Srinivasan, and L.S. Rathore. “Impact of Climate Change on Indian Agrilcuture” Climate Change 78 (2006),445-478.
• McCarthy, JJ., O.F. Canziani, N.A. Leary, D.J. Dokken, K.S. White (eds.) “Climate Change 2001: Impacts, Vulnerability and Adaptation.” Cambridge: Cambridge University Press, 2001.
• Ministry of Statistics and Programme Implementation, compiler. Statistical Abstract India 2005-06. 2006.
• Mitra, A.P., Sumana Bhattacharya, R.C. Dhiman, K. Krishna Kumar and C. Sharma, “Impact of Climate Change on Health: A Case Study of Malaria in India.” in Climate Change and India: Vulnerability Assesment and Adaptation eds. P.R. Shulka, Subodh K. Sharma, N.H. Ravindranath, Amit Garg and Sumana Bhattacharya (Hyderabad: University Press, 2003): 360-388.
• Mirza, M. Monirul Qader, R.A. Warrick, N.J. Ericksen and G.J. Kenny. “Are floods getting worse in the Ganges, Brahmaputra and Meghna basins?” Environmental Hazards 3 (2001): 37-48
• Mohile, A.D. “Brahmaputra: Issues in Development.” in Sustainable Development of the Ganges-Brahmaputra-Meghna
Basins. eds. Asit K. Biswas and Juha I. Uitto (New Delhi: Oxford University Press, 2001): 58-79.• Muhammed, Amid, Bonnie A. Stewart, A.P. Mitra, Kedar Lal Shrestha, Ahsan Uddin Ahmed, A.M. Chowdhury. “Water
Resources in South Asia: an Assessment of Climate Change-associated Vulnerabilities and Coping Mechanisms.” Asia-
Pacific Network for Global Change Research (2004).• National Commission for Women. Government of India. 2001• O’Brien, Karen, Robin Leichenko, Ulka Kelkar, Henry Venema, Guro Aandahl, Heather Tompkins, Akram Javed, Suruchi
Bhadwal, Stephan Barg, Lynn Nygaard, and Jennifer West. “Mapping vulnerability to multiple stressors: climate change and globalization in India.” Global Environmental Change 14 (2004): 303-313.
• Planning Commission, Government of India.• Rajaya Sabha “Unstarred Question No. 1347”, December 1st, 2009• Rajya Sabha “Unstarred Question No. 3015,” July 30th, 2009.• Ramesh, R. and M.G. Yadava. “Climate and Water Resources of India.” Current Science 89 (2005): 818-824• Revi, Aromar. “Climate Change Risk: an Adaptation and Mitigation Agenda for Indian Cities.” presented at the Rockefeller
Foundation’s Global Urban Summit, Bellagio, Italy, July 8-13, 2007.• Roy, P.K.., D. Roy, A. Mazumdar and B. Bose. “Vulnerability assessment of the lower Ganga-Brahmaputra-Meghna Basins.”
Presented at Proceedings of the NATCOM – V&A Workshop on Water Resources, Coastal Zones and Human Health, IIT Delhi, New Delhi, June 27-28, 2003.
• Registrar General of India, “Primary Census Abstract.” Census of India 2001. 2001.• Samarakoon, Jayampathy. “Issues of Livelihood, Sustainable Development, and Governance: Bay of Bengal.” Ambio 33
(2004): 33-44• Shah, R.B. “Ganges-Brahmaputra: The Outlook for the Twenty-first Century.” in Sustainable Development of the Ganges-
Brahmaputra-Meghna Basins. eds. Asit K. Biswas and Juha I. Uitto (New Delhi: Oxford University Press, 2001): 17-45.• Sharma, Bharat R and Sharma, Devesh. “Impact of Climate Change on Water Resources and Glacier Melt and Potential
Adaptations for Indian Agriculture.” Keynote address at 33rd Indian Agricultural Universities Association Vice Chancellors’ Annual Convention on “Climate Change and its Effect on Agriculture,” New Delhi, India, December 4-5, 2008.
• Swain, Ashok. “Displacing the Conflict: Environmental Destruction in Bangladesh and Ethnic Conflict in India.” Journal of
Peace Research 33 (1996): 189-204• Tangri, A.K.. “Impact of Climate Change on Himalayan Glaciers.” Presented at Proceedings of the NATCOM – V&A
Workshop on Water Resources, Coastal Zones and Human Health, IIT Delhi, New Delhi, June 27-28, 2003.• Water Resources Information System, compiler. Water Data Book 2005. Central Water Commission. 2005.

Climate Change Situation Analysis • Ecosystems for Life54
© Pradip Saha

55Ecosystems for Life • Climate Change Situation Analysis
Climate change, perhaps the most unique issue of current concern for the global community, is no longer a distant scientific prognosis but a reality (Mall et al, 2006), with observed changes in global average air temperature, sea surface temperature, extreme weather events, widespread
melting of snow and ice, storm surges and coastal flooding (IPCC 2007). The concentration of atmospheric carbon dioxide has increased from about 280 parts per million by volume (ppmv) to about 369 ppmv and the global temperature of the earth has increased by about 0.6°C (Mall et al, 2006). This global increase in carbon dioxide concentration is due primarily to fossil fuel use and land use changes. The fourth assessment of the Intergovernmental Panel for Climate Change (IPCC) states that the global atmospheric concentrations of CO2, methane and nitrous oxide have increased markedly as a result of human activities since 1750 and now far exceed pre-industrial values, determined from ice core samples spanning many thousands of years (IPCC, 2007). Climate change studies for India with respect to temperature and rainfall have been carried out by a number of Indian scholars (Hingane et al, 1985; Srivastava et al, 1992; Rupa Kumar et al, 1994; Pant et al, 1994; Singh and Sontakke, 2002). A study covering the period 1091-1987 (Rupa Kumar et al, 1994) shows mean maximum temperature, countrywide, has risen by 0.6oC. For India as a whole, the minimum as well as maximum temperatures have increased by about 2oC per decade, 1970-2003 (Kothawale and Kumar, 2005). For the region, the projected area-averaged annual mean warming is 1.6±0.2oC in the 2020s, 3.1±0.3oC in the 2050s and 4.6±0.4oC in the 2080s as a result of increase in atmospheric concentration of GHGs or greenhouse gases (IPCC, 2001). In a study covering the period 1871-1990 (Parthasarathy et al, 1993), no systematic trend in all-India rainfall was observed. However, large inter-annual and decadal variations was noted by them. Other studies (Rupa Kumar et al, 1992, for example) show, on the other hand, long term changes in Indian monsoon rainfall on regional and local scales. Increasing trend in the monsoon seasonal rainfall is reported along the west coast, north Andhra Pradesh and north west India, while decreasing trend in the same is reported over east Madhya Pradesh and adjoining areas, northeast India and parts of Gujarat and Kerala. According to the government (MoEF, 2010), all-India summer monsoon rainfall is projected to increase by 3-7%. The mean annual rainfall is likely to increase by 0.3-3%, with substantial decrease in winter rainfall. However, rainfall during June, July and August is likely to increase by 0.6% in the 2030s, with respect to the 1970s.
CLIMATE ChANGE | INdIA
Climate change impacts and north-east IndiaChandan Mahanta

Climate Change Situation Analysis • Ecosystems for Life56
There is growing concern about the impact of these changes on the various elements of the environment. India, though not a dominant contributor to global greenhouse gas emissions, would be adversely impacted by projected climate change due to the significant dependence of its population and economy on climate sensitive sectors such as agriculture, forests, fisheries, ecosystems and coastal zones. India, therefore, has a high stake in scientific advancement and global negotiations for addressing the problem of climate change.
Observed changes in temperatureLet us begin with observed changes in temperature. The global mean surface temperature has reportedly increased by 0.74°C over the last 100 years,1906-2005 [IPCC, 2007]. Most of this increase has been observed in two distinct periods: 1910-1940 (0.35°C) and more strongly from 1970 to the present (0.55°C). The year 2010 ranked as the warmest on record, together with 2005 and 1998 (WMO, 2011). Over the last ten years, 2001-2010, global temperatures have averaged 0.46°C above the 1961-1990 average, and were the highest ever recorded for a 10-year period since climate records began to be kept. However, the rates of climate change are significantly different among regions. This is primarily due to varied types of land surfaces with different surface albedo, evapotranspiration and carbon cycle affecting and responding to the climate in different ways (Snyder et al, 2004; Dang et al, 2007). The warming is very likely the response of the main anthropogenic drivers such as population growth, deforestation, industrialization, changes in land use and increased atmospheric concentrations of greenhouse gases. Air temperature is a good indicator of the state of climate globally because of its ability to represent the energy exchange process over the Earth’s surface with reasonable accuracy. A study (Braganza et al, 2004) has emphasized changes in mean temperature as an indicator of climate variability, but changes in maximum and minimum temperature provide more useful information than the mean temperature alone. A study (Kodioglu et al, 2001) analyzed temperature trends in Turkey, 1930-1996, and found significant cooling during this period. In both Australia and New Zealand, the frequency of days below freezing point decreased in association with an increase in daily minimum temperatures (Plummer et al, 1999). A study of Central England temperature records (Jones et al, 1999) found an increase in temperature that corresponded to a reduced number of days that had temperature much below normal. Given this context, it is important to examine the scenarios in the Indian subcontinent. Investigations of historical meteorological records from India have provided a comprehensive picture of short-term (annual to decadal) variability of Indian climate over the past century. The all-India annual mean surface temperature derived from 73 stations spread over India, 1900-1982, showed a significant warming of 0.4°C over the past century, comparable to the global mean warming trend of 0.3°C per 100 years. A study of maximum and minimum temperature data from 121 stations in India, 1901-1987 (Hingane et al, 1985; Rupa Kumar et al, 1994) found the increase in mean temperature over India is almost solely contributed by the maximum temperatures, with the minimum temperatures remaining practically trendless, leading to an increase in the diurnal range of temperatures. In a recent study (Sonali and Nagesh, 2012), a set of seven temperature-homogeneous regions of India were considered to detect trends in annual, monthly, winter, pre-monsoon, monsoon and post-monsoon maximum and minimum temperatures. A consistent increasing trend was detected in minimum temperature for most of the regions over India during the last three decades. Application of Sen’s slope methodology also indicated that magnitudes of trend in most of the regions during last

57Ecosystems for Life • Climate Change Situation Analysis
three decades were more intense for minimum temperature as compared to maximum temperature. More recent PRECIS simulations for the 2030s indicate an all-round warming over the Indian subcontinent (Krishna Kumar et al, 2011). The annual mean temperature is projected to rise by 1.7-2°C in the 2030s, with respect to 1961-90. The rise in annual mean temperature in the northeast region may range 1.8-2.1°C (MOEF, 2010). The countrywide mean maximum temperature has shown an increase by 0.6°C, and the mean minimum temperature decreased by 0.1°C. Warming over the Indian subcontinent was found to be mainly contributed by the post-monsoon and winter seasons. The monsoon temperatures did not show a significant trend in most parts of India, except for a significant negative trend in northwest India (De and Mukhopadhyay, 1998). Diurnal temperature range had also decreased, with increase in night-time temperature at twice the rate of day-time maximum temperature (Sen Roy and Balling, 2005). The widespread increasing trend of all-India coldest day showed a decreasing trend, in contrast, in the Brahmaputra river valley due to its significant decrease (-0.41°C/decade) during the pre-monsoon season. The pre-monsoon thunderstorm activity in the Brahmaputra valley is vigorous, unlike other parts of India, and contributes 25% of annual rainfall. Moreover, during good monsoon years, substantial decrease in incoming solar radiation due to dense cloud cover and evaporative cooling of rainwater are responsible for lower surface temperature during the day (Kothawale et al, 2012).
Observed changes in rainfallPrecipitation has very likely increased during the 20th century by 5-10% over most mid- and high latitudes of Northern Hemisphere continents, but in contrast rainfall likely decreased by 3% on average over much of the subtropical land areas (IPCC, 2001). Trends in European annual precipitation revealed an increase in rainfall in northern Europe by 10-40% in the twentieth century, but little change or drying in southern Europe (Parry, 2000). Precipitation in the Great Plains of the United States of America also showed significant increase since the late 1960s, the last two decades being the wettest of the 20th century (Garbrecht and Rossel, 2001). The Brazilian Amazon basin precipitation records revealed a shift around 1975, downward in the northern area and upward in the southern part (Marengo, 1999). Analyzing summer (June-September) monsoon rainfall data from 120 east-Asia stations, 1881-1998, a study (Kripalani and Kulkarni, 2001) noted the presence of short-term variability in rainfall amounts on decadal and longer timescales. The length of the longer rainfall ‘epochs’, they noted, last for about three decades over India and China and approximately five decades over Japan. Long term trends of Indian monsoon rainfall for the country as a whole as well as for smaller spatial regions have been studied by several researchers. A study of Indian monsoon rainfall records (Parthasarathy et al, 1993) could find no systematic trend in Indian rainfall over the last 100 years. However, large inter-annual and decadal variations have been observed. But on a smaller spatial scale, existence of trends was noticed (Parthasarathy, 1994; Rupa Kumar et al, 1992). Rainfall trends evaluated on sub-divisional basis for the two monsoons (southwest and northeast) have shown significant variations due to high spatial variability of rainfall during monsoon season (Rupa Kumar et al, 2002). A recent study (Pattanaik and Rajeevan, 2010) found significant increasing trend in the frequency of extreme rainfall events (rainfall ≥ 124.4 mm) over India during the southwest monsoon season. However, this increasing trend of contribution from extreme rainfall events was balanced by decreasing trend in light to heavy rainfall (rainfall ≤ 64.4 mm) events.

Climate Change Situation Analysis • Ecosystems for Life58
Observed extreme eventsOne of the most significant consequences of global warming is considered to be an increase in magnitude and frequency of extreme weather events. There is an increasing trend of extreme precipitation events in USA and Australia (Easterling et al, 2000; Haylock and Nicholls, 2000), western New Zealand (Salinger and Griffiths, 2001), the UK in winter (Osborn et al, 2000), and South Africa (Fauchereau et al, 2003). Significantly decreasing trends in extreme rainfall events have been reported in Western Australia (Haylock and Nicholls, 2000), south-east Asia and parts of central Pacific (Griffiths et al, 2003), northern and eastern New Zealand (Salinger and Griffiths, 2001) and the UK in summer (Osborn et al, 2000). In general, climate variability and the frequency of occurrence of extremes of weather events such as heat waves, droughts, floods and timing of rainfall have been increased over the past few decades over South Asia (De et al., 2005). A study (Singh and Sontakke, 2002) has looked into the fluctuations of precipitation amounts, 1829-1999, for the Indo-Gangetic region. This study indicates a significant increasing trend from 1939 over the central part and a significant decreasing trend over eastern parts of the country. Another study (Soman et al, 1988) of annual extreme rainfall for the stations in Kerala found that stations in hilly terrain showed a decreasing trend. However, despite these sporadic studies conducted on extreme weather events, the IPCC’s Special Report on Extreme Weather has opined that projections of changes in flood events, drought events and other extreme weather events are, at best, limited due to data paucity, complexity of regional weather change variables, and the inability of models to include all the factors that influence extreme weather events (IPCC, 2012).
Projected climate scenarioGreenhouse gases in the Earth’s atmosphere can accelerate in the future; consequently, the best estimates of increase in average global surface temperature are likely to be in the range 1.8°-4.0°C (IPCC, 2007). Globally, average precipitation is projected to increase, with great deviation at regional scale (Meehl et al, 2007). Downscaled projections using the Hadley Centre Regional Model (HadRM2) indicate future increases in extreme daily maximum and minimum temperatures throughout South Asia due to increase in greenhouse gas concentrations (Krishna Kumar et al, 2003). The tendency of the warming becoming more pronounced in winter is also a conspicuous feature of the observed temperature trends over India (Rupa Kumar et al, 2002, 2003). Results from a more recent RCM
In India, projections indicate increases in extreme daily maximum and minimum temperatures. The tendency of warming becoming more pronounced in winter is a conspicuous feature of observed temperature trends. Modelling results indicate night temperatures are increasing faster than day temperatures: cold extremes are very likely to be less severe in future

59Ecosystems for Life • Climate Change Situation Analysis
(PRECIS) modelling indicate night temperatures are increasing faster than day temperatures, with the implication that cold extremes are very likely to be less severe in future (Rupa Kumar et al, 2006). According to a study (Lal et al, 2001), the annual mean area-averaged surface warming over the Indian subcontinent will range between 3.5°C and 5.5°C by the 2080s. These projections show more warming in the winter over monsoon season. The spatial distribution of surface warming suggests a mean annual rise in surface temperatures in north India by 3.0°C or more by 2050. The study also suggests that, during winter, the surface mean air temperature could rise by 3.0°C in northern and central parts while it would rise by 2.0°C in southern parts by 2050. In case of rainfall, an increase of 7-10% in annual rainfall is projected over the sub-continent by the year 2080. However, the study suggests a fall in rainfall by 5-25% in winter while there would be 10-15% increase in summer monsoon rainfall over the country. The study reported that the date of onset of summer monsoon over India could become more variable in future.
National interest and climate changeThe growing consensus of the changing climatic scenario and its implications has greatly raised concern globally, leading to a number of climate change impact assessment studies worldwide. These assessment studies and projections raise a number of concerns about the ways in which climate change may particularly affect the lives and livelihoods of the poor and vulnerable communities. Especially for vulnerable regions like the northeastern region of India and the floodplain areas of Assam and Bangladesh, climate stressors would further expose these regions to enhanced risk. In India’s second communication to UNFCC in May 2012, it has been stated that India has reasons to be concerned about the adverse impacts of climate change since vast populations depend on climate-sensitive sectors for their livelihoods. India’s commitment to the United Nations Framework Convention on Climate Change (UNFCCC) is reflected in various initiatives taken nationally, such as including climate change in the Indian planning process and resource allocation, formulating National Action Plan for Climate Change with a focus on eight missions, enhancing resilience of poor communities through programmes such as National Rural Employment Guarantee Act (NREGA), and promoting research and development in environmental areas. Environmental protection and sustainable development have emerged as key national priorities and are manifest in India’s approach to socio-economic development and poverty eradication (NATCOM, 2012). Temperature rise in the region has been predicted to range 1.8-2.1°C with respect to the 1970s. Irrigated rice in the upper Brahmaputra area of northeast India is predicted to gain yields marginally due to warming, as compared to rain-fed crops. The health sector would be greatly impacted, with climate change opening up the risk of malaria transmission for a longer period in the region. Thus, considering the projected impacts of climate change in the upper Brahmaputra plains and northeast India, a sector-based assessment of climate change impacts in the entire Ganga-Brahmaputra-Meghna (GBM) region appears essential. A very first step is to find possible areas where collaborative research could be undertaken with respect to ecosystems bearing similar set-up and potential vulnerability within this region.
The study’s contextThe unprecedented rate of climate change and the evolving impacts are alarming. Early imprints can be evidenced in the form of intensified extreme events in sensitive areas like the river Brahmaputra basin. This relatively unexplored basin is trans-boundary, shared by four major riparian countries: India, China, Bhutan and Bangladesh. Originating from the Manas Sarovar glacier in Upper Himalayas,

Climate Change Situation Analysis • Ecosystems for Life60
the river Brahmaputra flows through China, India and Bangladesh before finally discharging into the Bay of Bengal, travelling for about 2,997 km (Bhattarai, 2009). The river covers a total length of 1,130 km in India and 240 km in Bangladesh (Bhattarai, 2009). Trans-boundary water issues can aggravate in view of the growing water needs of the riparian nations; the climate change scenario seems to further worsen many already existing issues, including water-sharing. Climate change-induced rising temperatures, with potential glacial melting in the Himalayas, have led to serious concerns in the downstream floodplains in Assam and Bangladesh. Large cross-border runoff is being drained by the Brahmaputra river system before finally discharging into the Bay of Bengal. The GBM floodplain area spread over India and Bangladesh ranks low, for several reasons, in terms of all measures of economic development (INCCA 2010; OECD 2003). The areas located in the downstream regime of the Brahmaputra river basin are highly vulnerable to intense events of flooding, storm surges, cyclones, intense precipitation, sea level rise and other related risks. About 80% of Bangladesh’s land is in the floodplains of three large rivers: the Ganga, the Brahmaputra and the Meghna (Karim and Mimura, 2008); for the northeastern region of India, a major part lies within the floodplain areas, while the remaining comprises hilly areas. This unique geophysical setting of northeast India and Bangladesh makes these regions vulnerable to natural disasters, with climate change further aggravating the scenario. The Brahmaputra river, along with its tributaries, is a lifeline of the people in these regions. Every aspect of the people in the floodplain areas is intrinsically related with the ebb and flow of the river. Any change pertaining to the hydrology of the river would perhaps greatly impact the livelihood of the people at large. The changes, in turn, are likely to drive changes in the ecosystems upon which the peoples of the floodplain areas of Bangladesh and northeast India depend for their livelihoods, including coastal erosion and inundation, sea level rise, storms, cyclones, droughts, saline water intrusion, increasing risk of disease and declining agricultural productivity.
The foci of this situation analysisPristine landscapes like the Brahmaputra plains, relatively unperturbed by non-climatic factors, are places where changing climate scenarios can be well visualized. The current paper focuses on highlighting the key climate change-vulnerable sectors in the Indo-Bangla Bramhaputra plains. With the perceived threat of climate change impacting nations similarly, yet often with varied manifestations depending upon the biophysical and biogeochemical characteristics of the impacted domain, the paper also seeks to highlight the key issues pertaining to such impacts in the Brahmaputra floodplains in India and Bangladesh, subsequently identifying the potential areas for joint and collaborative research at a regional scale. The vulnerabilities of the areas within the Brahamaputra floodplain are already marked by instances of intense and recurrent flooding, intermittent drought, erratic rainfall patterns, depleted habitat and resources, low agricultural productivity, displacements and related incidences (see Table 1). The major foci of this situation analysis are to: • Highlight the major climate change impacts on different sectors in the Brahmaputra plains, based
on a review of the existing state of knowledge on climate impact studies in the region; • Examine the socio-economic implications of climate impacts in the Indo-Bangla region; • Explore possible research requirements towards overcoming the hurdles in finding potential
mitigation and adaptation strategies that are realistic, affordable and practicable for a region seriously lagging in environmental governance;
• Identification of future joint research opportunities in the region; and • Prioritizing the key areas of joint climate change research in the GBM region.

61Ecosystems for Life • Climate Change Situation Analysis
n Socio-economic conditions and impact situations
Let us first understand the socio-economics of climate change of the region under analysis. The average per capita income of the region is about 30% lower than the Indian national average (INCAA, 2010). Added to this are the issues of burgeoning population, decreasing land productivity, relatively higher dependence on the natural resource base and a higher incidence of poverty. Under the varied
Table 1: Natural disasters in the Brahmaputra basin within India and the impacts
Disaster Areas Affected Impact
Flood Floodplain areas of the Brahmaputra and its tributaries
Loss of agricultural production; disruption of communication and livelihood systems; injury, damage and destruction of immovable infrastructure; disruption to essential services; economic loss; evacuation; loss of human lives and biodiversity; displacement and disruption of human property and biodiversity
Drought Almost all areas Loss of agricultural production; stress on national economy; disruption in lifestyle
Landslides Along the hilly tracks of the basin Loss of land; disruption of human property and livestock; evacuation; damage of property and loss of life
Erosion and Sedimentation
Banks and beds of Brahmaputra and its tributaries
Loss of land; disruption of human property and livestock; evacuation; damage of property and loss of life
Earthquake All areas Damage and destruction of property; loss of life; change in geomorphology
Cyclones and Intensified Storms
Almost all areas Loss of agricultural production; disruption of communication and livelihood system; injury, damage and destruction of immovable infrastructure; disruption to essential services; economic loss; evacuation; loss of human lives and biodiversity; displacement and disruption of human property and biodiversity

Climate Change Situation Analysis • Ecosystems for Life62
impacts of climate change, the region is likely to face more severe consequences. The augmented incidence of extreme events would, naturally, have major socio-economic impacts. Economies being directly related to climate-sensitive sectors like agriculture, water resources, fishery, forestry and biodiversity, climate impacts on these sectors are likely to extensively affect the economy and livelihoods directly. Harbouring a predominantly agrarian economy, the region is susceptible to serious socio-economic consequences, with climate change largely impacting agriculture and its diversity. The erratic nature of rainfall and its intensity and frequency have often made crop planning a difficult task in the past (Das et al, 2009). The erratic rainfall pattern in the northeast and shifting of monsoon rainfall to post monsoon in Umiam district in Meghalaya is an example (see Figure 1). Amplification of rainfall variability is likely to distress agricultural productivity and consequently affect the socio-economic condition of the region. Intense agricultural drought occurred in the Brahmaputra plains of Assam in 2006. As much as 75% of the 26 million people associated with livelihoods related to agriculture in these districts were affected. The state suffered a loss of more than Rs 100 crore due to crop failure and other peripheral affects (Das et al, 2009). Flooding and drought, being recurrent phenomena, thus bear a significant effect on the socio-economic set-up in the region.
1983 1985 1987 1989 1991 1993 1995 1997 1999 2001 2003 2005 2007 2009
4000
3500
3000
2500
2000
1500
1000
500
0
1983 1985 1987 1989 1991 1993 1995 1997 1999 2001 2003 2005 2007 2009
2500
2000
1500
1000
500
0
Figure 1: The situation in Meghalaya, 1983-2009: Variable rainfall in Umiam and monsoon rain distribution
Source: Das et al, 2010

63Ecosystems for Life • Climate Change Situation Analysis
Sector-wise analysis and research issuesThe concern over past, present and future weather aberrations, climate trends and their effects, particularly on agriculture, has continued to stimulate deep research interests on the analysis of climate variability and consequential agricultural productivity. There is a growing mass of literature focused on predicting and quantifying the impact of climate change on agricultural systems in many areas of the world (Parry et al, 1999; Parry et al, 2005; Cabas et al, 2009; Rowhani et al, 2011). The sector under greatest threat, arguably, is food security. Food security is both directly and indirectly linked to climate parameters (Chaudhary and Agarwal, 2007). Changing rainfall patterns, droughts, altered water flow and humidity variations can fundamentally impact agricultural productivity. Changing rainfall pattern, droughts, altered water flow and humidity variations can fundamentally impact agricultural productivity. The northeast region of India is relatively more vulnerable to climate change impacts due to its location in the Eastern Himalayan periphery, fragile geo-environmental setting and economic under-development (MoEF, 2010). The impacts of climate variability on agriculture on Assam, for instance, are already visible in terms of erratic monsoon, frequent floods, drought-like situations and warmer winters. In three consecutive years since 2002, there were large floods in the state but the seasons of 2006, 2007 and 2009 witnessed deficient rainfall (IMD, 2006, 2007; IPCC, 2007a). The last decade (2001-10) has been found to be the driest decade in the history of past 110 years in the Brahmaputra valley (Deka et al, 2012). Estimates have shown that the productivity of rainfed mono-cropping farming system in northeast India is low and it is a high economic risk activity (Ghosh et al, 2010). This low productivity, linked to degradation, deforestation and conventional agricultural practices, is also largely impacted by climate change. Studies have shown inter-seasonal climatic variability—mainly temperature and rainfall—may influence crop production and hence food security in India (Sinha and Swaminathan, 1991). A study (Sinha and Swaminathan, 1991) estimated a 2°C increase in mean temperature could decrease rice yield by about 0.75 tonnes/hectare in the high-yield areas and by about 0.06 tonnes/ha in low-yield coastal regions. Decrease in rice yields by 3-15% under a scenario of 1.5°C rise in temperature and a 2 mm/day increase in precipitation has been reported (Saseendran et al, 1999). Monsoon rainfall greatly affects rice productivity. The inter-annual variations in summer monsoonal rainfall (SMR) and total foodgrain production anomalies are closely related (Selvaraju, 2003). The correlation between SMR and food grain production (0.71) was significant at the 1% level. The SMR shows a high correlation (r = 0.80) with kharif foodgrain production and a moderate correlation (r = 0.41) with rabi foodgrain production. Food security is, further, intrinsically linked to the nutritional aspects of the vulnerable communities, as an adverse impact on food security would lead to an increasing number of undernourished individuals and an unhealthy population susceptible to diseases (Chaudhary and Agarwal, 2007).
HealthHuman health being largely dependent on—disease burden apart—access to ecosystem services for food, nutrition, medicine, shelter, fresh water and clean air, climate-induced changes in food production, water resource, migration and economic development have great ability to affect human health (McMichael et al, 2001). Long-term changes in climatic variables may cause ill-health because of insufficient food supplies, lack of safe and adequate drinking water, poor sanitation and insecure habitats (Xu et al, 2008), thereby allowing diseases to invade unprepared regimes. Episodes of

Climate Change Situation Analysis • Ecosystems for Life64
ecological and climatic changes can even lead to extinction of some species and the emergence of new ones (Pimm et al, 1995; Parmesan, 2006). Altered distribution of vector species may be among the early signs of climate change—with pests, pathogen and parasites among the first to emerge during periods of transition—along with the distribution and seasonal transmission of vector-borne infections such as malaria, dengue fever and schistosomiasis, which may be affected by climate changes (Sutherst, 2001; WHO, 2000). Considering prevailing environmental conditions, north-eastern India can be under a severe health threat. The rise in temperature may induce a higher transmission window favourable to breeding vectors, leading to a rise in their population and so making them the causative agents for many life-threatening diseases. Malaria is one of the most prevalent health problems in the north-eastern states of India as well as in Bangladesh, where it is endemic and widely distributed, and transmission of the causative parasites is maintained almost exclusively by Anopheles minimus. Other vectors are A. dirus and A. fluviatillis (Dev et al, 2001). These vectors are well adapted to the ecology of the deep forests and forest fringe environment, which covers extensive areas of north-east India (Prakash et al, 1998). Though the region accounts for only 3.7% of India’s population, it accounts for 10% of confirmed malaria cases and 13-41% of all malaria-related deaths; the disease, being unevenly distributed across the landscape, is associated with varying intensity of malaria transmission and risk factors (Dev et al, 2004). Although the north-eastern region is considered a region of low-to-moderate transmission intensity, change in climatic conditions is likely to open a wider transmission window favourable for the breeding of these vectors, thus making this region one of the most epidemic-prone regions in India. Applying class I, II and III criteria of temperature governing transmission of P. vivax and P. falciparum to the daily weather as generated by HadRM2 control climate scenario for 1980-2000, a study (Bhattacharya et al, 2006) has reported that class I, II and III criteria are satisfied in the state of Assam, amongst others. Thus these states are the most epidemic regions of malaria in India, with a possibility of new transmission windows opening up in the northern states as well. Earlier studies (Srivastava et al, 2001), using a GIS-based approach, have shown the most favourable areas for A. dirus, a causative malaria parasite, are in the Brahmaputra flood plains, which comprises moist deciduous forests. These studies have further reported that the percentage favourable area for the parasite with respect to the total state area is maximum for Mizoram (93%), followed by Tripura (52%) and Assam (30-35%). However, with respect to total favourable area in India, Assam (22.58%) has the maximum favourable percentage compared to the rest of the states. Apart from malaria, other vector- and water-borne diseases like diarrhoea, cholera, dengue and encephalitis can also be endemic in the
The northeastern region of India is considered a low-to-moderate transmission zone for vector-borne diseases. Change in climatic conditions is likely to favour the breeding of vectors, thus making this region epidemic-prone

65Ecosystems for Life • Climate Change Situation Analysis
region. The recurrent flooding in the region can perhaps pave way for favourable breeding grounds of vector species.
Water supply and sanitationWater supply and sanitation are important determinants of health. With climate change exacerbating the incidence of flooding in the region, situations of lack of safe water supply and poor sanitation can further provide favourable breeding grounds for vectors. Studies have shown climate change will, and already does, impact access to water and sanitation by causing floods and droughts, changes in precipitation and temperature extremes that result in water scarcity, contamination of drinking water and exacerbation of the spread of disease (UN Mandate, 2010). However, with limited studies on the impacts of climate on sanitation in the region, it would be difficult to explicitly elucidate the linkage between poor sanitation and increased disease incidence in the Brahmaputra floodplains.
GenderIn terms of gender, climate change is expected to have differential impacts. Climate impact studies on gender have shown women in rural areas in developing countries, who have the major responsibility for household water supply and energy for cooking and heating as well as food security, are negatively affected by drought, uncertain rainfall and deforestation (Women’s Environment and Development Organization Information Sheet, 2007). With a major section of the population in northeast India inhabiting rural areas, there is very little scope for women’s participation in decision-making and climate policy formulation, thereby exacerbating vulnerabilities of women in the region.
Habitat and human settlementClimate change impacts that result in intense flooding, erosion and erratic rainfall patterns bear a direct impact on human settlement. The colossal damage associated with climate-related hazards is extremely daunting, leading to massive loss of life and disarticulation of daily activities (McBean and Ajibade, 2009). Due to weak governance and poor institutional mechanisms, the region remains one of the most backward in the country. A major section of the region’s population that inhabits the floodplain areas is highly vulnerable to recurrent flooding and erosion. Huge swathes of settlement and cultivable lands are either inundated or eroded every year due to intense precipitation, flooding and erosion. Further, the issue of migration from nearby areas is another major factor that exacerbates matters related to human settlement. Climate-induced migration can perhaps be an additional stressor to settlement in the floodplain areas, for such migration has the potential to be a stress multiplier by accentuating competition for resources, ethnic tension, distrust or by adding to existing socio-economic fault lines (Sharma et al, 2009).
Employment and income of the poorRural communities predominant in the region, being directly dependent on their natural resource base, are vulnerable to climate change impacts. Despite least contribution to the cause of climate change, these sections are the ones that have to bear the greatest brunt of negative impacts. Agriculture is the mainstay of livelihood and earning, and with climate change directly impacting agricultural productivity, rural farmers are left with little option to cope. Another major section of the communities in the upper Brahmaputra floodplains earn their livelihood as tea labourers. The tea industry in the Brahmaputra basin provides average daily employment to more than 6 lakh persons (Borah, 2010). Any damage to this highly climate-sensitive industry would greatly threaten

Climate Change Situation Analysis • Ecosystems for Life66
the livelihood of a vast majority of communities, with limited options for these people to switch over to alternative livelihood means. Similarly, increasing temperature is reported to have impacted silkworm productivity, thus causing a decline in silk productivity in the region (Borah, 2010). With an un-estimated large population dependent on this industry, the situation can easily turn serious, directly impacting their income. There may be more such instances at microeconomic levels.
Extensive erosionThe floodplain areas in the region support a high density of population vulnerable to accelerated and recurrent flooding, coupled with extensive erosion, both great threats to the housing and settlement sector. Extensive bank erosion in the Brahmaputra basin has led to numerous social and economic consequences: loss of agricultural land (loss of livelihood), loss of housing and other essential infrastructure, displacement and involuntary migration, so promoting native-migrant contest over limited resources, ethnic tensions, distrust, political instability and civil strife (Reuveny, 2007; Sharma, 2010). Vast areas in the region have been affected by erosion: 1 million ha in Assam; 815,000 ha in Meghalaya; 508,000 ha in Nagaland; 108,000 ha in Tripura; and 14,000 ha in Manipur (Venkatachary et al, 2001; Das et al, 2009). Recurrent floods inundate at least 2,000 villages every year in addition to destroying other infrastructure. The problem is further exacerbated by localized riverbank erosion, which destroys about 8,000 ha of inhabited land along the Brahmaputra annually (Das et al, 2009).
Land and waterAs the climate warms, the most obvious impacts would be visible on the fluvial systems, the flow of which are predicted to vary due to early glacial melt and monsoon perturbations. The Brahmaputra river and its tributaries, the mainstay for meeting the water need of the people in north-east India, is a glacier-fed river that may undergo significant change in its hydrological regime. Enhanced glacial melting will result in early onset of increased flow in the Brahmaputra river system, which may cause early flooding within the basin. On the other hand, resultant glacial recession would create scenarios of water scarcity in the upper watershed. Since a major part of the Brahmaputra basin falls within the India-Bangladesh region (see Table 2), continued melting will eventually affect the availability of drinking water, food production and ecosystem maintenance within the region along with possible alteration of the basin’s hydrological, ecological and biogeochemical processes. Flooding induced by extreme precipitation events, coupled with glacial melting and overflowing of rivers, has time and again caused mayhem in the region. 1953-2004, the seven states of the region suffered a loss of Rs 1,729 crore due to flood damage to crops, houses and public utility, while 1.25 mha land was affected (Das, 2009). Other important aspects are flooding caused due to glacial lake outburst flood (GLOF) and landslides dam outburst floods (LDOF) in the Greater Himalayan region. The flooding event in Bhutan, in 2004, caused due to a breach in a landslide-induced dam on the Tsatichhu river, holds a unique example of hazards caused due to LDOF. Breaching forced Kurichu Hydropower Project authorities to open the gates of the dam and release water into the Kurichu River. That entered the Beki-Manas river system downstream and devastated large tracts of western Assam (Das, 2009). Projected increase in water demand and use will reinforce the attempt of inter-basin water transfers or diversions, contributing further to species migration, altered habitats, along with alteration of water quality, and the potential introduction of foreign biota and diseases. The rise in temperature will impact water quality through alterations in the rate of operation of biogeochemical processes and lowering the dissolved oxygen concentration of water (Mazumdar, 2008).
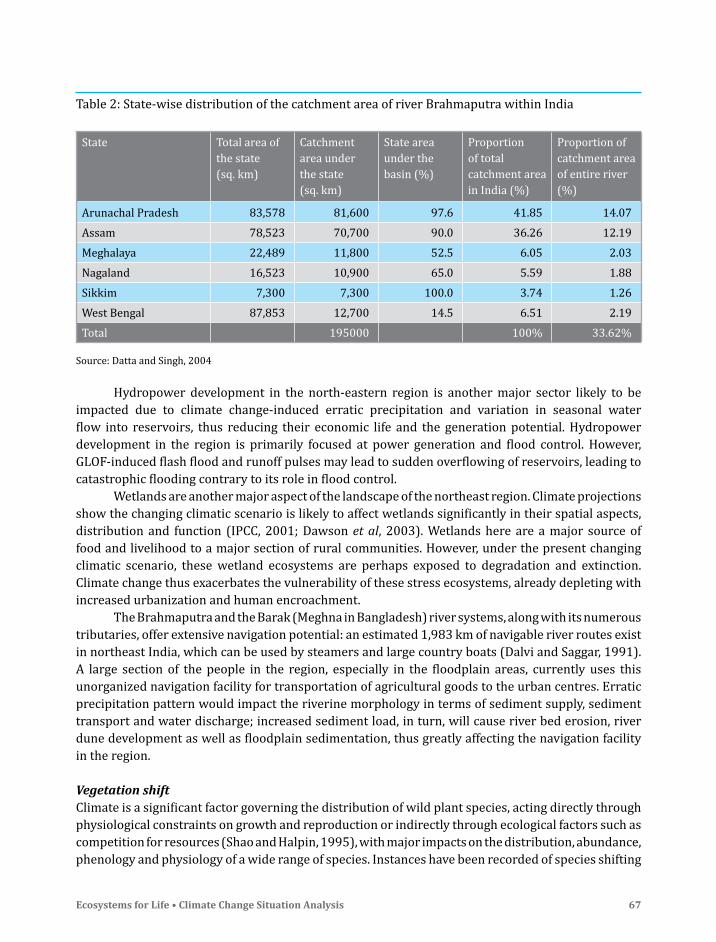
67Ecosystems for Life • Climate Change Situation Analysis
Hydropower development in the north-eastern region is another major sector likely to be impacted due to climate change-induced erratic precipitation and variation in seasonal water flow into reservoirs, thus reducing their economic life and the generation potential. Hydropower development in the region is primarily focused at power generation and flood control. However, GLOF-induced flash flood and runoff pulses may lead to sudden overflowing of reservoirs, leading to catastrophic flooding contrary to its role in flood control. Wetlands are another major aspect of the landscape of the northeast region. Climate projections show the changing climatic scenario is likely to affect wetlands significantly in their spatial aspects, distribution and function (IPCC, 2001; Dawson et al, 2003). Wetlands here are a major source of food and livelihood to a major section of rural communities. However, under the present changing climatic scenario, these wetland ecosystems are perhaps exposed to degradation and extinction. Climate change thus exacerbates the vulnerability of these stress ecosystems, already depleting with increased urbanization and human encroachment. The Brahmaputra and the Barak (Meghna in Bangladesh) river systems, along with its numerous tributaries, offer extensive navigation potential: an estimated 1,983 km of navigable river routes exist in northeast India, which can be used by steamers and large country boats (Dalvi and Saggar, 1991). A large section of the people in the region, especially in the floodplain areas, currently uses this unorganized navigation facility for transportation of agricultural goods to the urban centres. Erratic precipitation pattern would impact the riverine morphology in terms of sediment supply, sediment transport and water discharge; increased sediment load, in turn, will cause river bed erosion, river dune development as well as floodplain sedimentation, thus greatly affecting the navigation facility in the region.
Vegetation shiftClimate is a significant factor governing the distribution of wild plant species, acting directly through physiological constraints on growth and reproduction or indirectly through ecological factors such as competition for resources (Shao and Halpin, 1995), with major impacts on the distribution, abundance, phenology and physiology of a wide range of species. Instances have been recorded of species shifting
Table 2: State-wise distribution of the catchment area of river Brahmaputra within India
State Total area of the state (sq. km)
Catchment area under the state (sq. km)
State area under the basin (%)
Proportion of total catchment area in India (%)
Proportion of catchment area of entire river(%)
Arunachal Pradesh 83,578 81,600 97.6 41.85 14.07
Assam 78,523 70,700 90.0 36.26 12.19
Meghalaya 22,489 11,800 52.5 6.05 2.03
Nagaland 16,523 10,900 65.0 5.59 1.88
Sikkim 7,300 7,300 100.0 3.74 1.26
West Bengal 87,853 12,700 14.5 6.51 2.19
Total 195000 100% 33.62%
Source: Datta and Singh, 2004

Climate Change Situation Analysis • Ecosystems for Life68
towards the poles or upward in altitude, or a progressively earlier seasonal migration and breeding, in response to climatic variability (Walther et al, 2002; Parmesan, 2006). Several studies (Holdridge, 1947; Thornthwaite, 1948; Walter, 1985) have shown certain climatic regimes are associated with particular plant communities or functional types, with climate probably being the most important determinant of vegetation patterns globally, significantly influencing the distribution, structure and ecology of forests (Kirschbaum et al, 1996). An assessment, using climate projections of NadRM3 on the A2 and B2 scenarios of the IPCC Special Report on Emission Scenarios and BIOME4 vegetation response model, has projected that by 2050, 77% and 68% of the forested grids in India are likely to experience shift in forest types under A2 and B2 scenarios, including forest types in the northeastern region and drier forest types in the northwestern region (Ravindranath et al, 2006). This is because different plant species respond differently to change in climate (IPCC, 2001). ForestsThe Brahmaputra floodplain has 64% of its total geographical area under forest cover and it continues to be a forest surplus region (Ramakantha et al, 2003), with 80% of forested area in Mizoram and Arunachal to 35-45% in Assam and Sikkim (Verghese, 2006). It occupies 7.7% of India’s total geographical area, supporting 50% of the flora, about 8,000 species (Rao, 1994) of which 31.58%, or about 2,526 species, is endemic (Nayar, 1996). The forests in the region are extremely diverse in structure and composition and combine tropical and temperate forest types, alpine meadows and cold deserts (UNDP, 2007-2008). The region forms the mainland of tropical forests in India, especially the species-rich tropical rainforests. Changing climatic condition will also potentially impact forests in the northeastern region (Ravindranath et al, 2006). Studies show there will be considerable geographical variation in the magnitude of changes for both temperature as well as rainfall, with the northeast Indian region becoming much wetter compared to that of the northwestern region, which would become much drier. Temperature increase in the northwestern region will be more than that in the northeastern region (Ravindranath et al, 2006). This is turn will bring in changes in economically important forests types, such as Tectona grandis, Shorea robusta, bamboo, upland hardwoods (these constitute some of the important plant species in the Brahmaputra basin) and pine. Biodiversity is predicted to be impacted under projected climate scenarios due to the changes or shifts in forest or vegetation types in 57-60% of forested grids, due to forest dieback during the transient phase and due to different species responding differently to climate changes (IPCC, 2001), even when there is no change in forest types (Ravindranath et al, 2006). Climate change will be an additional pressure and will enhance the decline in biodiversity due to socio-economic pressures (Gitay et al, 2002). This will, in turn, lead to increase in species losses, mainly because of a shift in forests boundaries due to changes in the temperature and precipitation, thereby leading to change in the habitats of many species (both flora and fauna). The projected increase in precipitation over the Brahmaputra basin will lead to more severe floods, which could place the wildlife, especially those in national parks and reserve forests which are home to several endangered species, at risk.
AgricultureAgriculture is the main source of livelihood in the Brahmaputra floodplain, the common crops being rice, millet, wheat, pulses, potato, oil seeds and sugarcane. These crops are grown in almost all parts of the north-eastern region. Agricultural productivity is likely to suffer severe losses because of more extreme contrast of temperature, severe drought and flood and soil degradation. Cropping patterns being directly related to rainfall, even small changes in the rainfall pattern is likely to bring about a

69Ecosystems for Life • Climate Change Situation Analysis
major change on their productivity. The rise in the temperature lately has been attributed to be the cause of erratic flood and droughts, and also believed to have put heat stress on crops, thus giving pests access to a wide range of areas that were too cold for them to survive in earlier (Das et al, 2009). The year 2000 marked one of the most devastating floods in the Brahmaputra plains of Assam, triggered by heavy monsoon rains which caused the river and its tributaries to burst their banks. This flood destroyed unprecedented number of agricultural fields and claimed the highest number of lives. Devastating floods in the region have been annual occurrences for last 60 years as the Brahmaputra, one of the most heavily flowing rivers in the world, struggles through a narrow stretch of land during monsoons that, in places, receives more than more than 40 cm of rain in a day—equivalent to nearly a year’s rainfall in eastern England. Flooding in 2003 cut off the whole of north-eastern India and forced 20 million people from their homes, while more than 100 people were killed and 12 million were made homeless in the following monsoon (The Guardian, Friday, June 16, 2006). Several millions are affected by flood, for three to six months of the year, in eastern India (Mishra, 1999). Increased precipitation and higher peak monsoon-induced flow, added to by glacial regression, could exacerbate the situation for tens of millions more. The total flood prone area in the Brahmaputra valley is an estimated 32 lakh ha, which accounts for 9.6% of the country’s total area (INCCA, 2010). The actual impacts depend on the location, level of development, technological advancement and institutional settings (Fleischer et al, 2007). Further, drought is another issue bearing a direct link to agriculture. During 2006, unprecedented drought-like conditions affected the whole of the northeast region. Estimates have shown that the total area affected by agricultural drought during the south-west monsoon period constitute about 40% of northeast India’s geographical area and 39% of rice cultivated area (Das et al, 2009; see Table 3). The tea industry of Assam and Darjeeling is facing an emerging threat of climatic change. Area under tea in Assam is 3.11 lakh ha (Tea Board of India, 2007). About 88% of Assam’s tea area is concentrated in the Brahmaputra valley alone, producing 450 million kg of tea, 90% of the state’s total tea production. Moreover there are 65,466 small tea growers producing about 9% of the state’s total annual production from an area of 1,03,298 ha. Studies conducted on the tea industry of Sri Lanka (Wijeratne, 1996) show that tea yield is sensitive to temperature, drought and heavy rainfall. An increase in the frequency of droughts and extreme rainfall events could result in a decline in
Table 3: Flood damage trends in the river Brahmaputra valley in Assam
Period Total Cropped Flooded crop as % of total inundated
Average annual population affected
Affected population per hectare of flooded area
Average annual damage (million rupees)
Value of crop lost as % of total damage
1953 - 1959 1.13 0.10 8.85 860000 0.8 58.60 66
1960 - 1969 0.75 0.16 21.33 1520000 2.0 75.70 92
1970 - 1979 0.87 0.18 20.69 2000000 2.3 151.80 89
1980 - 1988 1.43 0.40 28.05 4550000 3.2 1,455.20 96
1999 - 2005 0.38 0.38 35.65 4586000 4.3 7,171.70 34
Source: NHC, 2006

Climate Change Situation Analysis • Ecosystems for Life70
tea yield, which would be greatest in the low country regions (< 600m MSL). Reports on declining tea production, and deteriorating flavour and quality of tea in Assam, have already highlighted the impacts of the changing scenario on the tea industry in the Brahmaputra valley (Green Camp, 2011; NE Greens, 2011).
n Priority areas for joint research
Economies (agriculture, fisheries, livelihood, tourism) are closely linked to climate-sensitive factors. Economic activities that rely on natural resources such as land and water are more susceptible to weather and climate than those that rely on human-made resources, because the latter have more control over the environment than the former (Tol et al, 2004). As with all major economies around the globe, climate change will have significant impacts on the economies in the Brahmaputra floodplain. Optimum solutions demand a collaborative approach to cope with the coherent and obvious impacts of climate change. The Brahmaputra floodplain is essentially an agrarian economy characterised by a diverse variety of crops (INCCA, 2010). Climate impacts on the agricultural sector due to recurrent flooding and extensive erosion can cause cascading impact on the region’s economy. Episodic flooding and its devastating impacts have already been highlighted. 1953-2004, the states of the region suffered together a loss of about Rs 200 crore due to flood damage to crops, houses and public (Das et al, 2009). The anticipated impacts of flooding on the economy of the region can thus be well evidenced from the monetary loss in billions. Further, impact on the tea industry, a major revenue-generator for the region, would also have similar impacts on the region’s economy. With the reported deterioration in the quality and flavour of the tea in the region (Borah, 2010), the likelihood of diminished demand of tea export from the region cannot be ruled out. Climate change impacts on the hydrology of the region are another major concern. The hydropower potential of the region has been well illustrated as a major revenue generator. Under conditions of altered river flows, water scarcity and related phenomena, the feasibility of hydropower development in the region may require rethinking. Water resource development is the key to agricultural productivity of the region. With climate-induced water scarcity in the region, a direct implication on agricultural productivity and thereby the economy of the region can be well foreseen. These are critical research issues already becoming overdue.
Water availability in a trans-boundary contextDespite being the second-largest river basin in the world, the GBM region still reflects a low per capita water availability because of the huge population of half a billion people living within the basin that stretches from Upper Himalayas to the southern region of Bangladesh (Bhattarai, 2009). Burgeoning population and a rapid rate of developmental activities within the basin have greatly aggravated sustainable water resource management, leading to a host of water-related conflicts between riparian nations. Dam construction by upstream riparian nations for hydropower generation, water diversion, irrigation and flood control are the major conflict issues. Modification of the common waterways through construction of dams in upstream regimes can greatly impact the hydrology of the freshwater system, thus affecting seasonal flow and sediment transport downstream. The construction of the Farraka Barrage in the 1960s is a classic trans-boundary water conflict between India and Bangladesh. Although a 30-year water sharing agreement, aimed at optimum utilization of water, was signed in 1996, a growing resentment still tends to persist in Bangladesh (Bhattarai, 2009).

71Ecosystems for Life • Climate Change Situation Analysis
Unless collective efforts are urgently initiated, climate change will only further aggravate the scenario. Water availability, distribution and scarcity will be the main drivers of transboundary relations. Both the northeastern region of India and the floodplain areas of Bangladesh are highly vulnerable to numerous environmental challenges. Sharing a common river basin, most of these challenges are, arguably, commonly addressable by the riparian countries, although the nature and magnitude of the challenge may vary locally. The Indo-Bangladesh region lying within the floodplain areas of the Brahmaputra has to reconcile issues emerging due to changing climate through a joint initiative that attains a robust mitigation, management and adaptation strategy. Indo-Bangladesh joint research should also address the following climate-sensitive sectors.
Water security issuesWhile discussing climate change impacts on a trans-boundary river, the subject becomes sensitive. Any change in the upstream water regime is likely to have impacts downstream. The climate-induced alterations in the amount and distribution of vital water resource services can create considerable consequences on the water-dependent entities. Strongly water-resource-connected systems like agriculture, fisheries, sanitation and hydropower would be of critical consideration (Michel, 2009). Trans-boundary policies for climate change mitigation and adaptation strategies should be tailored to include the key water-related aspects of the riparian nations. The irrigation sector uses the maximum water in the entire GBM basin. It is thus imperative to develop climate-centric, water-saving technologies. Such initiatives should be devised with due consideration to the irrigated water distribution mechanism in both nations. Trans-boundary data and information-sharing between the two nations need to be strengthened. Wider water-related data sharing could pave the way for better water management policies and practices. Although a data-sharing arrangement does exist for both India and Bangladesh, it applies only once the water reaches a certain level—1 m below the danger level (Paterson, 2009). Several suggestions for continuous monitoring of water levels, with information transferred to Bangladesh at regular intervals, have been made (Ahmad, undated). With climate change aggravating the already existing and complex water conflict issue, it is necessary to have a multilateral dialogue involving stakeholders from both countries to discuss trans-boundary water issues, including common concern due to reported engagements by China in the river Yarlung-Tsangpo. Following the model of the comprehensive Mekong River Commission set up for sustainable development of the Mekong river basin, a similar commission for the Brahmaputra and the Ganga river basins needs to be set up for the joint management of shared water resources and the economic potential of the rivers; basin-wide co-operation is the optimal solution to the problem of international
The irrigation sector uses the maximum water in the entire GBM basin. It is thus imperative to develop the sector with climate-centric, water-saving technologies. Climate change’s aggravation in the area of water makes the case for dialogue more compelling

Climate Change Situation Analysis • Ecosystems for Life72
basins (Kliot et al, 2001). Similar cross-boundary institutional mechanisms, like that of the Ganga water-sharing treaty, need to be developed under a joint research program. Such initiatives can, perhaps, greatly facilitate water-sharing issues. Recognizing the linkage between water resources spread over thousands of miles and across several sovereign borders, it is necessary to truly commit to sustainable practices (Peterson, 2009). The joint research initiative should thus focus on the development of such sustainable practices for both the countries as part of the same basin.
Food security issuesFood security being a major common concern, joint initiatives and policies involving collective riparian needs can be adopted. With over 35% of Bangladeshis suffering from malnourishment (Lal et al, 2001), the threat of increased hunger from reduced agricultural production would suggest the inclusion of agriculture as one of the major vulnerabilities facing the country (World Bank, 2003). Joint research for improved crop varieties that can withstand changing climate scenarios needs to be encouraged. Institutional linkage and collaboration are essential.
Livelihood securityWith the per capita income of both regions being very low (INCCA, 2010; OECD, 2003), potential climate change scenarios will aggravate livelihood insecurity. With floods devastating agricultural and settled lands, vulnerable communities of low-lying areas are exposed to extreme threats to their livelihood security. Policies for improved livelihood alternatives for these vulnerable communities need to be worked out within a joint framework. Alternative livelihood could include strategies for training the vulnerable communities with other livelihood means like masonry, carpentry and a range of conveniently adaptable vocations.
Health securityAs highlighted above, the health sector will require close surveillance and response. Extreme events will facilitate wider and intensified transmission of vector- and water-borne diseases in these areas. Joint research to improve the health security condition of vulnerable people in these areas needs to be adopted. Research and policy development for increasing the coping capacity of the vulnerable sectors should be initiated under the joint venture.
River bank and coastal zone securityWhile river bank erosion of habitations and fertile vegetations and sand-casting over vast farming lands in the upper Brahmaputra is already considered to be a more formidable problem than flood, the coastal zones of Bangladesh are highly vulnerable under the climate change scenario. As such the joint research program should focus on devising effective policies for integrated river bank erosion and coastal zone management. Such management policies should primarily focus on engaging local communities and their knowledge base for effective mitigation, besides structural interventions considered essential. An example of direly-needed river bank erosion management under the climate change threat is the case of the Majuli river island in the upper Brahmaputra, where the land mass has decreased from 1,246 sq km in 1950 to 879.6 km in 1993, which indicates the extent of river erosion in the vicinity of the island, and this trend is continuing unabated till date (Singh et al, 2004). There is an urgent need to examine whether such critical and unique pieces of insulated riverine ecosystem face the threat of complete wipe-out in the face of hydrological onslaught caused due to climate change.

73Ecosystems for Life • Climate Change Situation Analysis
Awareness and capacity-building programmesLack of clear and adequate understanding of climate change risks among vulnerable communities remains a key challenge that needs to be prioritized in joint research. Capacity building of the potentially affected communities can perhaps help them to adapt and cope better to the changing scenarios.
n Adaptation approaches in the region
Sustainable mitigation strategies yet to be achieved, people in the region have adhered to their indigenous adaptive techniques to cope up with the changing scenarios. Climate change adaptation refers to any activity that reduces the negative impacts of climate change and/or takes advantage of new opportunities that may be presented and can be either reactive or anticipatory (Lemmen et al, 2008; McBean and Ajibade, 2009). Adaptation involves a range of activities to reduce vulnerability and increase resilience in key sectors such as water, agriculture and human settlement. Adaptation in the human dimension usually refers to a process, action or outcome in a system—household, community, group, sector, region, country—in order for the system to better cope with, manage or adjust to some changing conditions, stress, hazard, risk or opportunity (Smit and Wandel, 2006). With a weak climate change institutional mechanism, adaptation strategies in the region are basically the conventional methods adopted by the indigenous communities in the region. The recent ICIMOD report on climate change adaptation strategies for two districts in Assam, Dhemaji and Lakhimpur, has highlighted some of the traditional adaptive measures being followed by the people in these areas to cope with flooding. Farmers in these areas have switched over to crop varieties that can either withstand intense flooding or that can withstand severe drought. At certain times, some farmers also transit to other livelihood means to cope with recurrent flooding and erosion. India’s National Action Plan on Climate Change, released June 2008, outlines both existing and future policies and programs addressing climate mitigation and adaptation. Though it does not set a numerical goal for emissions reductions or for energy intensity, it offers a list of eight core ‘national missions’ to combat climate change, including expansion of solar energy, enhanced energy efficiency, sustainable habitat, water assets, preserving the Himalayan Ecosystem, Green India, sustainable agriculture and development of a knowledge base for dealing with climate change issues (GoI, 2008). The government, for example, has sought to expand the amount of forest cover in India by 1% a year through to 2012. Not much study has been carried out on what effect climate change will have on agricultural systems of developing countries like India. A study (Rosenzweiz and Igelesias, 1994) has addressed
Not much study exists on the effect climate change will have on agriculture in northeast India. What adaptations are likely to occur here? The institutional mechanism being weak, adaptation strategies are basically conventional methods of coping

Climate Change Situation Analysis • Ecosystems for Life74
responses of graincrops—maize, wheat, soya bean and rice—to climate change in various countries including India and Brazil. These studies suggest that if high amount of adaptation is assumed, developing countries could adapt to climate change. However, these studies do not model what adaptations are likely to occur. Also, these studies include only grains; comprehensive empirical analyses of the impact of climate change on other important crops in developing countries are yet to be accomplished (Mendelsohn et al, 1998). One way climate change may impact agriculture is by reducing the available supply of water for irrigation. Through either reduction in precipitation or increase in evapo-transpiration, available water for irrigation may be reduced. This may be especially important for developing countries like India because agriculture here utilizes as much as 80% of water resources (Xei et al, 1993). Water availability is a key factor in agricultural productivity, especially with developing countries located in arid and semi-arid regions. Further, developing countries may not be able to afford extensive manipulations of water systems. So they may face limited options to adapt to water shortages (Frederiksen, 1992). The National Water Policy adopted in 2002 provides the guidelines for water resource management and development. It stresses non-conventional methods—including inter-basin transfers, artificial recharge of groundwater, desalination of brackish or sea water, as well as traditional water conservation practices like rainwater harvesting, including roof-top rainwater harvesting—be practiced to increase utilisable water resources (Kumar, 2008). Under this policy, initiatives for water security through promotion and adoption of rainwater harvesting techniques, augmentation of indigenous storage reservoirs, community involvement and such related water conservation options are being undertaken for the region.
n Identified fields of research priorities
The Brahmaputra plains in India and Bangladesh share some of the most obvious and common impacts of climate change. Climate change will have significant and sizeable impact on the poor and marginalised communities around these areas. While the primary manifestations of climate change are of a physical nature such as changes in temperature, rainfall, sea levels, and increased frequency of extreme weather events, the consequences or secondary manifestations are much more varied, including ecological, social, and economic impacts (Byg and Salick, 2009). Climate-amplified phenomena of flooding, erosion, landslides, cyclones, storm surges and such have significantly affected the socio-economics of this region. Thus, a collaborative approach for development of appropriate, affordable and practical mitigation and adaptation strategies for both these countries needs to be initiated. Technological intervention for dissemination of information related to climate change mitigation and adaptation strategies to the vulnerable communities in the floodplain areas of these regions needs to be developed. Such interventions should also ensure enhancing resilience of vulnerable communities to climate change impacts. Recurrent flooding and bank erosion being common to both regions, joint initiatives for development of flood risk management strategies for the floodplain areas needs to be formulated. It is not impossible to adopt flood risk management measures (see Table 4). In terms of drought protection, joint initiatives for large scale water storage, development of wetlands, water allocation planning, development of water-saving technologies in terms of irrigation water demand and development of effective and reliable trans-boundary data and information sharing mechanisms need to be undertaken urgently.

75Ecosystems for Life • Climate Change Situation Analysis
The Brahmaputra plains in India and Bangladesh being largely agriculture-based, collaborative research to develop flood- and drought-resilient crop varieties needs to be initiated, along with the development of alternative livelihood options for vulnerable communities. With irrigated rice predicted to yield gains marginally in the northeast region, strategies for long-term improved irrigation for the region need to be developed. The predicted increase in rainfall intensity calls for adoption of flood-resistant crop varieties, along with change in sowing and harvesting patterns. Responding to predicted changes in rainfall and temperature patterns for the region further demands adoption of new technologies, improved approach to economic and human development, new research as well as new approaches of policy and decision-making. Short or long-term fluctuations in weather patterns can force farmers to adopt new agricultural practices in response to altered climatic conditions. As aberrations in weather are being experienced more frequently, and agriculture is the most vulnerable to climate changes, it is imperative adaptation strategies be developed for sustaining and enhancing agricultural production to achieve food security. It is necessary to analyze the regional climate changes individually for better planning of agriculture and to identify factors responsible for climate changes/fluctuations. There is also a need to quantify the growth and yield response of important crops and also identify suitable options to sustain productivity. Crop simulation models have been used extensively to study the impact of climate change on agricultural production. The output provided by the simulation models can be used to make appropriate crop management decisions and to provide farmers and others with alternative options for their farming system. Besides agricultural stresses, safe water availability, health and hygiene issues, increased incidence of water- and vector-borne diseases are some of the major stringent stresses that have to be faced by the vulnerable communities. As such, collaborative research should be undertaken for mainstreaming these key sectors. Thus, priority areas of joint research for the Brahmaputra floodplains in India and Bangladesh can be summarized as under:
Table 4: Flood risk management measures
Flood hazard Reduction
Barriers, barrages, dams and river regulation
Structural Measures
River Channel ImprovementsDykes, Levees and EmbankmentsImproved DrainageFlood Abatement through Afforestation
Flood Vulnerability
Flood Proofing
Non- Structural Measures
Flood Forecasting and WarningPreparedness, Planning and EvacuationRaising Public AwarenessReduction Land Use RegulationProperty Purchase and RelocationFlood InsuranceCompensation
Source: Harries and Roswell, 2011

Climate Change Situation Analysis • Ecosystems for Life76
• Initiatives for information dissemination on climate change trends, impact assessments and adaptation options to the vulnerable communities in the floodplain areas of both the countries of the region;
• Prioritize agronomic research, integrated to develop adaptation options that are not only effective in terms of crop production, but are also environmentally and economically robust, at landscape and regional scales;
• Joint research to develop hydrologic models and integrating these to the agricultural sector in the region to facilitate assessment of climate change impacts under different future scenarios along with evaluating adaptation strategies;
• Collaborative research on drought- and flood-resilient crop varieties to facilitate adaptation in the future and to ensure food security for the region;
• Development of climate change vulnerability indices for the region and documentation of adaptation techniques to both beneficial and adverse impacts of climate change;
• Review the existing practices for adaptation to climate risks in the floodplain areas and addressing the limitations of the existing coping strategies towards modified ones;
• Water resources connected systems like agriculture, fisheries, sanitation and hydropower would be greatly affected (Michel, 2009). As such trans-boundary policies for climate change mitigation and adaptation strategies should tailor the key water-related aspects of the riparian nations; and
• Collaborative research to ensure resilience of water and sanitation infrastructure to the changing climate scenarios.
n GBM: a priority region for joint research
The GBM river system is the second largest hydrological system in the world after the Amazon, spreading over the South Asian nations of Bangladesh, Bhutan, India, Nepal, and vast areas in the Tibet Autonomous Region of China and covering an approximate area of 17,45,400 sq km (Bandyopadhyay and Ghosh, 2009). Each of the three constituent rivers, Ganga, Brahmaputra and Meghna are unique in every sense of the term, bearing definite identities of their own. Draining a multitude of tributary rivers originating in the Himalayas, the total runoff of the basin gets finally discharged into the Bay of Bengal. However, inspite of the high level of precipitation, annual run-off, and a large hydroelectric potential of more than 1,00,000 MW, the basin remains home to some of the world’s most poverty-stricken communities (Verghese 1990, Bandyopadhyay and Ghosh, 2009). Due to its vitality as a life supporting resource, water is and shall remain a persistent source of conflict at national as well as international levels. Tailored to water are the broader contexts of food, ecosystem and livelihood security. Both Bangladesh and a large tract of India falling within the GBM basin are an agrarian economy, with all aspects of livelihood closely woven to water. With water resources being greatly impacted by the changing climatic scenario, there has been an emerging concern regarding the water resources of these regions. Climate impacts on the various aspects of the GBM in India and Bangladesh has already been manifested by the extreme events of flooding, drought, sea level rise, cyclones and storm surges and landslides. In terms of prioritizing research studies accounting the need for improved water availability, studies pertaining to the GBM region are of immediate importance. The GBM region encompasses some of the highly sensitive, vulnerable and economically backward regions in the world, including northeastern India and Bangladesh (INCCA, 2010; OECD, 2003). The vulnerabilities of these areas to the changing climate scenarios have been highlighted in the previous sections. Climate change

77Ecosystems for Life • Climate Change Situation Analysis
impacts will exacerbate the issues connected to sheer human survival in this part of the world. Therefore, an integrated approach to address the climate impacts on the water resources in the GBM region, coupled with other inherent issues from a climate change perspective, is an immediate task. Clearly, for engagement into any meaningful mitigation intervention, there is currently an adequacy deficit of research in this vast vulnerable basin even in the primary domains, something that cannot be overcome overnight. On the other hand, to understand the additional dimension of threat and challenges brought about by the emerging climate induced changes, there is an urgency to study at least the major manifestations in a typological ecosystem-centric unit that can provide vital generic clues which can help in administering mitigation action plans in a range of identical sub-regions within the larger GBM basin. Arguably, the Sunderbans coastal sub-region is an area where pronounced climate change threat exists, including serious risks of coastal inundation, saline water intrusion, intensified cyclone and the peril of habitat disarticulation, leading to potential climate refugee migration and other fall-outs. The challenge of isolating clear climate impact signatures from amongst a range of well illustrated pre-existing natural as well as human perturbations in this intensely populated region influenced by several anthropogenic drivers, however, can make some findings obscured by prevailing local conditions, making their generic projections questionable. For a pilot study of a suitable scale, any of the Himalayan watersheds of the Brahmaputra basin, with both mountainous and valley components, may be ideal. A possible area from an experimental perspective can be the Majuli river island in the mid-Brahmaputra floodplains. Several hazards that can be intensified by climate change including flood, drought, bank erosion, river bed aggradations and ecosystem transience are already prevailing in this pristine island, which also happens to be a habitat for exceptional species diversity juxtaposed with some of the most vulnerable rural communities largely dependent on traditional livelihood practices. The island, being cut off from both the banks of the Brahmaputra river, is insulated from the impacts of urbanization and industrialization. Lack of long-time series data can remain a challenge, which is generally the case for almost the entire GBM region. Nevertheless, if fluvial landmass like Majuli on the Brahmaputra (an island which have lost half of its land mass over last six decades or so due to water hazards like flood and bank erosion, relegating it from the coveted identity of the world’s largest river island) and scores of smaller river islands and chars can be put into a path of climate change resilience and adaptation, that can be one of the exceptional examples of research application into successful mitigation preparedness in the highly climate-vulnerable Indo-Bangladesh floodplains. Considering that there are a few hundred small and big discreet landmasses of varied sizes dotting this vast river landscape, Majuli can turn out to be a path-breaking experiment to examine climate change impact on a large section of a river ecosystem-dependent, floodplain-dwelling, vulnerable community
Chandan Mahanta, Ph.d., Department of Civil Engineering, Indian Institute of Technology, Guwahati, Assam, India

Climate Change Situation Analysis • Ecosystems for Life78
Reference
• Bandyopadhyay, J and Ghosh, N., (2009). Holistic Engineering and Hydro-Diplomacy in the GangesBrahmaputra-Meghna Basin. Retrieved from the url: www.eledu.net/
• Bhattacharya, S., Sharma, C., Dhiman, R.C & Mitra, A.P., (2006). Climate change and malaria in India. Current Science, 90(3): 369-375.
• Bhattarai, D.P., (2009). An analysis of transboundary water resources: A case study of River Brahamputra. Journal of the Institute of Engineering, Vol. 7 (1), pp. 1-7.
• Borah, A. (2010). Climate Change tints a good cuppa from the tea gardens of Assam. Retrieved from the url: http://www.smh.com.au/environment/climate-change/climate-change-taints-a-good-cuppafrom-the-tea-gardens-of-assam-20101228-199ci.html.
• Byg, A. & Salick, J., (2009). Local perspectives on a global phenomenon – climate change in Eastern Tibetan villages. Global Environmental Change, Vol. 19, pp. 156–166.
• Chaudhary A. and Agarwal, P.K., (2007). Climate change and Food Security in India. National Workshop on Climate Change and its impact on health, 26-27
th Nov, 2007. Retrieved from the url: www.searo.who.in.
• Changing the Climate: Why Women’s Perspectives Matter. Women’s Environment and Development Organisation Information Sheet , 2007, p2.
• Climate Change 2001: The Scientific Basis – Contribution of Working Group I to the Third Assessment Report of the Intergovernmental Panel on Climate Change (IPCC). Cambridge: Cambridge University Press.
• Dang, H., Gillett, N. P., Weaver, A, J, and Zwiers, F. W. (2007). Climate change detection over different land surface vegetation classes. Int. J. Climatol. Vol. 27, pp.211–20
• Das, A., Ghosh, P.K., Choudhury, B.U., Patel, D.P., Munda, G.C., Ngachan, S.V. and Chowdhury, P., (2009). Climate Change in Northeast India: Recent Facts and Events –Worry For Agricultural Management. ISPRS Archives XXXVIII-8/W3 Workshop Proceedings: Impact of Climate Change on Agriculture
• Das, P.J., (2009). Water and climate induced vulnerability in northeast India: Concerns for environmental security. WATCH Research Report 1. AARANYAK. Guwahati, Asssam, India. www.aaranayak.org.
• Datta, B. & Singh, V.P., (2004). Hydrology, in The Brahmaputra Basin Water Resources, edited by V.P. Singh, N. Sharma and C.S.P. Ojha. Netherlands: Kluwer Academic Publishers: 139-195.
• De, U.S., Dube, R.K. and Prakasa Rao, G.S. (2005) Extreme weather events over India in the last 100 years. J Indian Geophys Union, Vol. 9(3), pp. 173–187
• Dev, V., Hira, Rajkhowa, M.J., C.R., (2001). Malaria-attributable morbidity in Assam, north-eastern India. Ann. Trop. Med. Parasitol. Vol. 95 (8), pp.789–796.
• Dawson, T.P., Berry, P.M and Kampa, E., (2003). Climate Change impacts on freshwater wetland habitats. Journal for Nature Conservation, Vol. 11, pp. 25-30.
• Easterling, D. R., Evans, J.L., Groisman, P. Y., Karl, T.R., Kunkel, K.E. and Ambenje, P. (2000) Observed variability and trends in extreme climate events: a brief review. Bull Am Meteorol Soc Vol. 81(3), pp.417–425
• Fischer – Kowalski, M. & Haberl H., (2007). Socio ecological Transitions and Global Change: Trajectories of Social Metabolism and Land Use. Edward Elgar Cheltenham
• Garbrecht, J. and Rossel, F. (2001). Decade-scale precipitation increase in Great Plains at the end of the 20th
Century. J. Hydrologic Engg.Vol 7, pp. 64-78
• Ghosh, P.K., Das, A., Saha, R., Kharkrang, E., Tripathi, A.K., Munda, G.C., and Ngachan, S.V., (2010). Conservation agriculture towards enhancing food security in Northeast India. Current Science, Vol. 99 (7), pp. 915-921.
• Gitay, H., Suarez A., Watson R. T., & Dokken D. J., (2002). Climate Change and Biodiversity, Intergovernmental Panel on Climate Change, Geneva, Switzerland .pp.85
• Griffiths, G. M., Salinger, M. J. and Leleu, I. (2003). Trends in extreme daily rainfall across the south Pacific and relationship

79Ecosystems for Life • Climate Change Situation Analysis
to the South Pacific convergence zone. Int. J. Climatol. Vol. 23: pp. 847-869. • Guardian Unlimited, Friday, June 16, 2006. http://www.guardian.co.uk/environment/2006/jun/16/india.naturaldisasters • Harries, T and Rowell, E.P., (2011). Victim pressure, institutional inertia and climate change adaptation: The case of food
risk, Global Environmental Change, Vol. 21, pp. 188-192. • Hingane, L.S., Rupa Kumar, K. and Ramana Murthy, Bh. V., (1985). Long term trends of surface air temperature in India, J.
Climatol, Vol. 5, pp. 521-528. • http://greencamp.in/2011/01/climate-change-a-threat-to-assam-tea/ • http://www.forestpeoples.org/region/bangladesh/news/2010/10/cyclone-aila-s-devastation-bangladeshcoast-
another-victim-climate-ch • Haylock, M. R., Nicholls, N. (2000). Trends in extreme rainfall indices for an updated high quality data set for Australia
1910 – 1998. Int. J. Climatol. Vol.20, pp.1533 – 1541. • INCCA, (2010), Climate Change and India: A 4x4 Assessment. A sectoral and regional assessment for 2030s. • India’s Initial National Communications to the United Nations Framework Convention on Climate Change, Ministry of
Environment and Forests, New Delhi, 2004. • ICIMOD (2008). Recorded proceedings of the two day ‘Climate Change and Vulnerability of Mountain Ecosystems in the
Eastern Himalayan Region, North-East India & Bhutan Stakeholders Workshop’ 11-12 March, 2008, Shillong. Organized by International Centre for Integrated Mountain Development Kathmandu, Nepal.
• IPCC (2001): Climate Change The Scientific Basis, Contribution of Working Group 1 to the Third Assessment Report of the Intergovernmental Panel on Climate Change [Houghton, J.T., Y. Ding, D.J. Griggs, M.Noguer, P.T. Van der Linden, X. Dai, K.Maskell and C.A. Johnson (eds.)], Cambridge University Press, Cambridge, UK, pp.881.
• IPCC. (2007a). Climate Change 2007: The Physical Science Basis. Contribution of Working Group I to the Fourth Assessment Report of the IPCC. In S. Solomon, D. Qin, M. Manning, Z. Chen, M. Marquis, K.B. Averyt, M. Tignor and H.L. Miller, eds. Cambridge, UK: Cambridge University Press. p 996.
• IPCC. (2007b). Climate Change 2007: Synthesis Report. Contribution of Working Groups I, II and III to the Fourth Assessment Report of the Intergovernmental Panel on Climate Change. [Core Writing Team, Pachauri, R.K and Reisinger, A. (eds.)]. IPCC, Geneva, Switzerland, p 104.
• IPCC. (2007c). Climate Change 2007: Impacts, Adaptation and Vulnerability. Contribution of Working Group II to the Fourth Assessment Report of the IPCC. In M.L. Parry, O.F. Canziani, J.P. Palutikof, P.J. van der Linden and C.E. Hanson, eds. Cambridge University Press, Cambridge, UK, p 976.
• IPCC 2007: Summary for Policy makers, in Climate Change 2007: Mitigation of Climate Change Working Group III Contribution
to the 4th
Assessment Report of the Intergovernmental Panel on Climate Change, edited by S. Solomon, D. Qin, M. Manning, Z. Chen, M. Marquis, K.B. Averyt, M. Tignor and H.L. Miller . Cambridge, New York: Cambridge University Press.
• Jones, P.D., Horton, E. B., Folland, C.K., Hulme, M., Parker, D.E. and Basnett, T.A. (1999). The use of indices to identify changes in climate extremes, In: Weather and climate extremes: changes, variations & a perspective from the insurance industry. (Karl, T.R., Nicholls, N. and Ghazi, A. eds). The Netherlands: Kluwer Academic Publications.
• Kadioglu, M., Sen, Z. and Gultekin, L. (2001). Variations and trends in Turkish seasonal heating and cooling degree-days. Climate Change. Vol. 49, pp. 209-223
• Kliot, N., Shmueli, D and Shamir, U., (2001). Institutions for management of transboundary water resources: their nature, characteristics and shortcomings, Water Policy, Vol. 3, pp. 229-255.
• Kripalani, R. H., Kulkarni, A., Sabade, S. S. and Khandekar, M. L., (2003). Indian monsoon variability in a global warming scenario, Nat. Hazards, Vol. 29, pp.189– 206.
• Krishna Kumar, K., et al. (2003). Future scenarios of extreme rainfall and temperature over India. In: Proceedings of the Workshop on Scenarios and Future Emissions, Indian Institute of Management (IIM), Ahmedabad, July 22, 2003. NATCOM Project Management Cell, Ministry of Environment and Forests, Government of India, New Delhi, 56–68.
• Kumar, R (2010). Climate Change and India: Impacts, Policy Responses and a Framework for EU-India Cooperation,

Climate Change Situation Analysis • Ecosystems for Life80
Retrieved from the url:http://www.europarl.europa.eu/activities/committees/studies/download.do?file=19208 • Lemmen, D.S., Warren, F.J., Lacroix, J: Synthesis .In From Impacts to Adaptation: Canada in a changing climate, 2007.
Edited by Lemmen, D.S., Warren, F.J., Lacroix, J., Bush, E., Ottawa, O.N: Government of Canada; 2008: 1-20 • Mall, R.K., Singh, R. Gupta, A. Srinivasan, G. and Rathore, L.S., (2006). Impact of Climate Change on Indian Agriculture: A
review, Springerlink, Vol. 78, pp. 445-478. • Marengo, J. (1999). Interdecadal and long-term variability of the hygrometeorology of the Brazilian Amazon basin.
International Symposium “Manaus 99: Hydrological and Geochemical Processes in Large-scale River Basins”, 15-19 November, 1999, Manaus, Brazil, (Hibam Ed), 8
• McMichael, A.J., Githeko, A., Akhtar, R., Carcavallo, R., Gubler, D., Haines, A., Kovats, R.S., Martens, P., Patz, J. & Sasaki, A. 2001. Human Health, in Climate Change 2001: Impacts, Adaptation, and Vulnerability, edited by J. J. McCarthy et al. Cambridge, UK: Press Syndicate of the University of Cambridge: 451-485.
• McBean, G.A. and Ajibade, I., (2009). Climate change, related hazards and human settlements. Current Opinions in Environmental Sustainability, Vol. 1(2), pp. 179-186
• Meehl, G. A., Stocker, T. F., Collins, W. D., Friedlingstein, Gaye, A. T., Gregory, J. M., Kitoh, A., Knutti, R., Murphy, J. M., Noda, A., Raper, S. C. B., Watterson, I. G., Weaver, A. J. and Zhao, Z. C. (2007). Global Climate Projections, Climate Change 2001: The Scientific Basis. Contributions of Working Group I to the Third Assessment Report of the Intergovernmental Panel on Climate Change. [Solomon S D, Qin, Manning M, Chen Z, Marquis M, Averyt K B, Tignor M and Miller H L (eds.)]. Cambridge University Press, Cambridge, UK, pp 385-432
• Michel, D., (2009). A River Runs Through It: Climate Change, Security Challenges, and Shared Water Resources in D. Michel and A. Pandya Edited Troubled Waters: Climate Change, Hydropolitics and Transboundary Resources
• Mishra, D.K., (1999). Flood Protection That Never Was: Case of Mahananda Basin of North Bihar. Economic and Political Weekly, XXXIV (29).
• Mujumdar, P.P., (2008). Implications of climate change for sustainable water resources management in India. Physics and Chemistry of the Earth, Parts A/B/C, Vol.33 (5), pp. 354-358.
• Northwest Hydraulics Consultants, 2006, Background paper No.4, River Flooding and Erosion in Northeast India. Retrieved from url, http://mdoner.gov.in/writereaddata/sublink3images/44795983627.pdf
• OECD, (2003). Development and Climate Change in Bangladesh: Focus on Coastal Flooding and the Sundarbans. Retrieved from the url: www.oecd.org/dataoecd/46/55/21055658.pdf
• Osborn, T. J., Hulme, M., Jones, P, D. and Basnett, T. A. (2000). Observed trends in the daily intensity of United Kingdom precipitation. Int. J. Climatol.Vol. 20, pp. 347-364.
• Parry, M. L. (2000). Assessment of potential effects and adaptations for climate change in Europe: The Europe Acacia Report. UK: Jackson Environment Institute, University of East Anglia.
• Pant, G.B. and Rupakumar, K., (1997). Climates of South Asia, John Wiley & Sons Ltd., West Sussex, UK, p 320. • Parthasarathy, B., Rupa Kumar, K. and Munot, A.A. (1993). Homogeneous Indian Monsoon Rainfall: Variability and
Prediction, In Proceedings of the Indian academy of Science (Earth and Planetary Seiences). pp. 121-155. • Parthasarathy, B., Rupa Kumar, K. and Munot, A. A. (1994). Forecast of rainy-season food grain production based on
monsoon rainfall. Indian J. Agril Sci., Vol. 62, pp. 1-8. • Parmesan, C., (2006). Ecological and evolutionary response to recent climate change. Ann Rev Ecol. Syst. Vol.37, pp.
637–669. • Patterson, K., (2009)). A case for integrating Groundwater and Surface water Management in D. Michel and A. Pandya
Edited Troubled Waters: Climate Change, Hydropolitics and Transboundary Resources • Pimm, S.L., Russell, G.J., Gittleman, J.L. & Brooks, T.M., (1995) .The future of biodiversity. Science, Vol. 269, pp. 347–350. • Plummer, N., Sailinger, J.M., Nicholls, N., Suppiah, R., Hennessy, K.J., Leighton, R. M., Trewin, B., Page, C.M. and Lough, J.M.
(1999). Changes in climate extremes over the Australian region and New Zealand during the twentieth century, Climatic Change, Vol. 42, pp. 183-202.

81Ecosystems for Life • Climate Change Situation Analysis
• Prakash, A., Bhattacharya, D.A, Mohapatra, P.K. & Mahanta, J., (1998). Anopheline fauna in the northeastern states of India with notes on vectors of malaria. Proceedings the of National Academy of Sciences India, Vol. 68, pp. 217–228.
• Ravindranath, N.H., Joshi, N.V., Sukumar, R. & Saxene, A., (.2006). Impact of climate change on forests in India. Current Science, Vol. 90, pp. 354-361.
• Reuveny R., (2007). Climate change-induced migration and violent conflict. Polit Geogr, Vol. 26: pp. 656-665. • Rupa Kumar, K., .Krishna Kumar, K and Pant, G.B. (1994).Diurnal asymmetry of surface temperature trends over India,
Geophy. Res. Let. Vol. 21, pp. 677-680. • Salinger, M. J. and Griffiths, G. M. (2001) Trends in New Zealand daily temperature and rainfall extremes. Int. J. Climatol.,
Vol. 21, pp. 1437–1452 • Saseendran, A. S., K., Singh, K. K., Rathore, L. S., Singh, S. V. and Sinha, S. K. (1999). Effects of climate change on rice
production in the tropical humid climate of Karala, India. Climatic Change. Vol. 44, pp. 495–514. • Sharma, N., Johnson, F.A., Hutton, C.W and Clark, M. (2010). Hazard, Vulnerability and Risk on the Brahmaputra Basin: A
case study of River Bank Erosion, The Open Hydrology Journal, Vol.4, pp. 211-266. • Singh, N. and Sontakke, N.A., (2002). On climatic fluctuations and environmental changes of the Indo-Gangetic plains,
India, Climatic Change, Vol. 52, pp.287-313. • Sinha, S. K. and Swaminathan, M.S (1991) Deforestation, climate change and sustainable nutrition security: A case study
of India. Climate Change, Vol.19, pp. 201-209. • Soman M K, Krishnakumar K, Singh N. (1988). Decreasing trend in the rainfall of Kerala. Current Science, Vol. 57, pp.5-12. • Smit, B and Wandel, J., (2006). Adaptation, Adaptive Capacity and Vulnerability, Global Environmental Change, Vol. 16, pp.
282-292. • Srivastava H.N., Dewan, B.N., Dikshit, S.K., Singh, S.S. and Rao, R., (1992). Decadal trends in Climate over India, Mausam,
Vol. 43, pp.7-30. • Srivastava A., Nagpal B.N., Saxena, R. & Subbarao, S.K., (2001). Predictive habitat modeling for forest malaria vector
species, An. Dirus in India-A GIS based approach, Current Science, Vol. 80 (9), pp. 1129-1134. • Sutherst, R.W., (2001). The vulnerability of human health to parasites under Global Change. Int J Parasitol, Vol. 31 (9): 933–948. • Snyder, P. K., Delire, C. and Foley, J. A. (2004). Evaluating the influence of different vegetation biomes on the global climate
Clim. Dyn.23 279–302 • Thapliyal, V. and Kulshrestha, S.M., (1991). Climate Change and trends over India, Mausam, Vol. 42, pp. 333-338. • United Nations (2010). Mandate of the Independent Expert on the issue of human rights obligations related to access to
safe drinking water and sanitation. Retrieved from the url: http://www2.ohchr.org/english/issues/water/iexpert/docs/ClimateChange_HRtWS.pdf
• Venkatachary, K.V., Bandyopadhyay, K., Bhanumurthy, V., Rao, G.S., Sudhakar, S., Pal, D.K., Das, R.K., Sarma, U., Manikiam, B., Meena Rani, H.C. and Srivastava, S.K., (2001). Defining a spacebased disaster management system for floods: A case study for damage assessment due to 1998 Brahmaputra floods. Current Science, Vol. 80(3), pp 369-377.
• Verghese, B G (1990): Waters of Hope (Dhaka: University Press) • Wizeratne M.A., (1996). Vulnerability of Srilanka tea production to global climate change, in Climate Change Variability
and Adaptation in Asia and Pacific, edited by L. W. Bolhofer, S. Huq, S. Lenhart, • S.K. Mukherjee, J.B. Smith, and J. Wisniewski. Dordrecht: Kluwer Academic Publishers: 249 World Health Organisation
(WHO). 2008. Ten facts on climate change and health. Geneva. World Bank, (2007): Strategy Report on Development and growth in northeast India: The Natural
• Resources, Water and Environment Nexus. Washington D.C., U.S.A: The World Bank. www. uniquepublishers.in www. projects monitor. com/news img /photo www.nowpublic.com/world/drought www.moea.gov.bt Xu, J., Sharma, R., Fang, J. and Xu, Y., (2008). Critical linkages between land use transition and
• Human health in the Himalayan region. Environmental International, 34 (2), pp. 239-247.
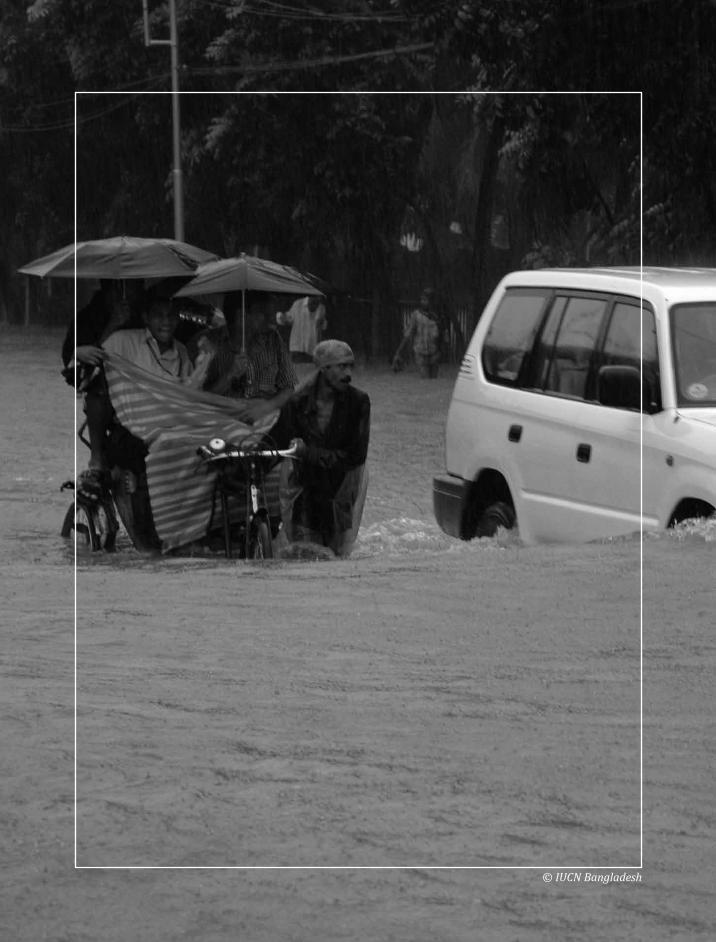
Climate Change Situation Analysis • Ecosystems for Life82
© IUCN Bangladesh

83Ecosystems for Life • Climate Change Situation Analysis
CLIMATE ChANGE | BANGLAdESh
Impacts on hydro-meteorology: a research agendaNandan Mukherjee and Malik Fida Abdullah Khan
Recently, IUCN has taken an initiative to facilitate multi-stakeholder mechanisms that will promote a better understanding on food, livelihood and climate change concerns related to the water regimes of Bangladesh and India. It will contribute to the development of a dynamic
hub for scientific information and knowledge pertaining to water and peoples of the riparian areas of the region. This supplement provides a list of common and isolated issues related to climate change and water resources in the Ganga-Brahmaputra-Meghna (GBM) region. It was decided by the experts both from India and Bangladesh to have a common report on the impact of climate change with particular emphasis on the GBM region. As part of this effort, the focus of this situation analysis is on hydrological changes, including meteorological changes/variability and also on hazard, risk, vulnerability and capacity-related issues where impacts are already visible or are anticipated. The Intergovernmental Panel on Climate Change (IPCC) warned, in 2001, that the global climate was changing, largely because of human activities (Mitchell et al. 2001). Observational records and climate projections provide abundant evidence that freshwater resources are vulnerable and have the potential to be strongly impacted by climate change, with wide-ranging consequences for human societies and ecosystems. IPCC’s Fourth Assesment Report (FAR; Cruz et al, 2007) has predicted with high confidence that South Asian countries are most vulnerable to climate change, where the water and agriculture sectors that shape up the economy in this region are likely to be most sensitive to climate change-induced impacts.

Climate Change Situation Analysis • Ecosystems for Life84
Hydro-meteorological extremes like flood and drought are an obvious outcome of the global climate change due to enhanced greenhouse effect. The interactions between increases in greenhouse gases and the hydrological systems are very complex. In a nutshell, the interaction between the physical process of climate change and its impacts on the hydrological regime is summarised below (also see Figure 1):• Increase in temperature will result in changes in evapo-transpiration, soil moisture, and infiltration;• Increased atmospheric CO2 may increase global mean precipitation;• Increased temperature will result in the rise in global sea level caused by the thermal expansion of
ocean water due to warming and increase in the ocean mass (principally from land-based sources of ice like glaciers and ice caps, and the ice sheets of Greenland and Antarctica);
• Changes in precipitation events could affect water availability in soils, rivers and lakes with negative implication for the demand-supply equilibrium; and
• Increased evapo-transpiration enhances the water vapour content of the atmosphere and the greenhouse effect, so that the global mean temperature, may rise even higher.
Asia is the most populous continent in the globe, with a reported population in 2002 of 3,902 million. Of this, almost 14% live in the GBM region (Brichieri-Colombi and Bradnock, 2003). The GBM
Figure 1: Physical process of climate change and its impact on water regimes
Note: ET: Evapo-transpiration; Source: Mirza and Ahmad, 2005
GHG increases
Smow and ice melt
Changes in precipitation
and ET
Changes in runoff
Changes in river flow Changes in flood
Increase in radiative forcings
Sea level rise Backwater effect by tidal flow
Changes in soil moisture
Increase in temperature
Changes in drought
Changes in soil groundwater

85Ecosystems for Life • Climate Change Situation Analysis
region is physiographically diverse and ecologically rich in natural and crop-related biodiversity. In terms of drainage area, the size of the Ganga basin is highest; it covers 62% of the total drainage area, followed by the Brahmaputra basin with 33%, the remaining 5% attributed to the Meghna basin. Similarly, the Ganga basin also covers the highest proportion of arable land, 83%, followed by 12% arable land in the Brahmaputra basin and 5% in the Meghna basin (Brichieri-Colombi and Bradnock, 2003). It is possible to have a comparative profile of the GBM region, where geographical positioning of the region and other salient features are shown (see Table 1). To assess the impact of climate change on GBM region, the following research questions are investigated: • The first question is: what are the forms of climate change in the GBM region? Higher temperatures, more variable precipitation, and more extreme weather events are already
felt in the GBM region and it has been projected that these will intensify. • Now the next question: why is the GBM region vulnerable to climate change? Geography coupled with high levels of poverty and population density has rendered the region
especially vulnerable to the impacts of climate change. In the following sections, a literature review is undertaken to gain a thorough understanding of the relationship between climate change and hydrology. Another motive for stocktaking is that it will guide further research on this particular issue. Following the literature review, climate change related issues focusing on the GBM region are elaborated in line with the above-mentioned research questions.
Table 1: Some salient features of the Ganga-Brahmaputra-Meghna region
River Nepal India Bangladesh Bhutan China Total Upstream US/Total (%)
Drainage area (’000 sq km)
Brahmaputra 195 47 45 293 580 533 92
Ganga 140 861 46 33 1080 1034 96
Meghna 49 36 85 49 58
GBM 140 1105 129 45 326 1745 1616 93
Arable area (’000 sq km)
Brahmaputra 55 36 2 93 57 61
Ganga 26 602 30 658 628 95
Meghna 15 225 40 15 38
GBM 26 672 91 2 791 70 88
Population in 2001 (million)
Brahmaputra 32 49 2 2 85 36 43
Ganga 22 385 35 1 442 406 92
Meghna 7 43 50 7 14
GBM 22 422 127 2 3 577 449 78
Source: Brichieri-Colombi and Bradnock, 2003

Climate Change Situation Analysis • Ecosystems for Life86
n Review of research
The literature that elaborates the physical sciences of climate change more specifically covers the following broad categories of issues:• Basic understanding of climatic processes, including climate change and variability, at global or
local scale; and• Observed trends in the climatic system. o The following research has been undertaken on a basic understanding of climatic processes, including
climate change and variability, at global or local scale: • Conceptual understanding on physical processes of climate change in the atmosphere (Alam et
al, 2008), (Pittock, 2005), (Khan et al, 2008), (Milliman et al, 1996), (Ahmed, 2006), (Islam et al, 1999), (Choudhury, 1986), (Efroymson, 2005), (Friendly, 1998), (United Nations Development Programme, 2005).
• Key characteristics of climate change process in Bangladesh (Alam et al, 2008). • Climatic characteristics of rainfall and vertical variation of rainfall using satellite observation data
(TRMM) (Islam et al, 2007), (Islam et al, 2008). • Variation of rainfall characteristics during El Nino years (Choudhury, 1994). • Global circulation model (GCM) model-generated outputs for observed period to estimate the
monthly average rate of change in temperature and precipitation (Ahmed et al, 1999). • Development of a base document describing the country settings including natural settings,
physical infrastructures and socio-economic conditions in the backdrop of climate change (Climate Change Cell, 2009b).
o Research related to observed trends in the climatic system: • Trends or observed evidences of climate change and variability in terms of change in temperature
and rainfall (Karmakar et al, 2000); (Miah, 2003); (Singh, 2001); (Cash et al, 2008); (Choudhury et al, 1997); (Chowdhury et al, 2003); (Hossain, 1989). All of them found a notable trend in temperature, but most of them found little or no trend in change in rainfall pattern.
• Historical changes in sea level along the Bangladesh coast (Singh, 2002), (Singh et al, 2001), (Warrick et al, 1996), (Bangladesh Centre for Advanced Studies (BCAS)); (Resource Analysis (RA); Approtech, 1994), (Ahmad et al, 1994). Change in the sea level since the early-to-mid Holocene (Islam et al, 1999); specifically, later research has shown, based on empirical evidence, the fluctuating history of relative sea level movement in terms of geological time frame (Islam, 2001).
• Relationship between historical trend in sea surface temperature and sea level rise with the frequency of cyclones originating in the Bay of Bengal (Khan et al, 2000).
• The link between greenhouse gas emissions and global warming, along with their impacts on the key hydrological parameters and on the bio-physical system (Nishat, 1989), (Mirza, 2002). The change in the climatic system and its sensitivity to greenhouse gas emissions and sulphate aerosols is elaborated in one of the papers (Qureshi et al, 1994).
Since the early 1990s efforts have been made to develop climate change scenarios using dif-ferent schools of thought. In the late 1990s, efforts were made to generate a climate change scenario using the Atmosphere-Ocean Global Circulation Models (AOGCM) which opened up a pathway to de-velop scientifically more rigorous and acceptable scenarios (Ahmed, 2006). To date, efforts made regarding climate change scenario generation are:

87Ecosystems for Life • Climate Change Situation Analysis
• One of the earliest initiatives (Mahtab, 1989) was rather ‘speculative’ or based on ‘expert judgment’ rather than being built on ‘simulating’ the physical processes, due to the absence of appropriate models and modelling facilities.
• Some significant initiatives have been taken by researchers or agencies (BUP-CEARS-CRU, 1994); (Asian Development Bank, 1994); Climate Change Country Studies Programme (Ahmed et al, 1996); (Asaduzzaman et al, 1997); (Huq et al, 1998); (Mirza, 1997); (Ahmed et al, 1999) (Mirza, 2002) and (Agrawala et al, 2003). Most of the literature shows anticipated changes in climatic parameters would be moderate till 2030 but severely altered during and after 2070. Out of the AOGCM derived scenarios, the National Adaptation Programme for Action (MoEF, 2005) for Bangladesh adopted the results obtained by (Agrawala et al, 2003).
• Recently the IPCC has developed a climate change scenario for South Asia (Meehl et al, 2007) from an ensemble of AOGCM models. This shows that under different SRES scenarios, the rate of change in temperature in South Asia may be 1.1-6.4oC and global sea level rise may be in the range of 0.18-0.59 m. It has also shown that monsoon seasonal rainfall in South Asia might increase by 26%. But the main problem of the AOGCM-driven scenarios is that they are very coarse and not suitable for location-specific adaptation planning. In this regard, the need for more downscaled climate change scenarios has evolved over the last decade.
• In Bangladesh, regional climate model Hadley Centre Regional (Climate) Model version 2 (HadCM2) was run with a 50 km x 50 km grid (Choudhury et al, 2005). RegCM and PRECIS have already been attempted, but the results were not fully accepted due to the mismatch with the GCM-driven scenarios. In a later research initiated by the Climate Change Cell (Climate Change Cell, 2009 k) of Bangladesh, PRECIS-generated scenario generation was further attempted but the model results still need further refinement.
Using the same result, a number of more specific research initiatives have been carried out for simulating future precipitation pattern at local scale (Islam, 2008) (Islam et al, 2008), (Islam, forthcoming). TERI and UKMO have attempted generating RCM scenario for India. But results are suffering from inconsistencies; we need further precision, incorporating regional climatology/dynamics. A recent version of PRECIS is capable of resolving climatology at 50 km X 50 km scale, with a possibility of going further down to 25 km x 25 km resolution and new attempts have been started to minimise the uncertainties in climate scenario generation.
o Vulnerability studies can be broadly classified into the following groups:• Overall vulnerability of different sectors due to climate change (global and local focus);• Vulnerability due to sea level rise with particular focus on the coastal zone; and• Vulnerability due to specific natural hazards amplified by climate change. The following research has been conducted on vulnerability and risk knowledge:• Overview of the linkage between global warming and natural disasters (Walter et al, 2002); • Investigation by several researchers into the possibility of rise in sea level and its impact on
different sectors (Begum et al, 1997), (Gaan, 2005), (Warrick et al, 1993), (Ahmed et al, 1996), (Ali, 2000);
• Overall vulnerability of natural disasters on the coastal zone of Bangladesh (Habibullah et al, 1999), (Huq et al, 1995), (Hossain, 1989) (Shamsuddoha et al, 2007), (Osman et al, 2006), (Jennifer et al, 2006), (Moudud et al, 1988), (Asaduzzaman et al, 1997), ( Department of Environment, 1993);
• Assessment of the vulnerability of the coastal zone due to salt water intrusion using STREAM, a GIS-based vulnerability assessment model (Aerts, 1997);
Climate Change Situation Analysis • Ecosystems for Life88
• Vulnerability of the coastal zone due to beach erosion (Karim et al, 2002); • Risk of climate-induced natural disasters in the global perspective (Schneider et al, 2007);• Impacts of climate change on different hydro-meteorological disasters like flood, drought, salinity
intrusion, cyclone and storm surge events (Mirza et al, 2005), (Alam, 2004), (Ali, 1996), (World Bank, 2000);
• Assessment of the impact of climate change on flood in Bangladesh (Ahmad, 2006), (Ahmed, 2003), (Mirza et al, 2003);
• Risk of climate change-induced flooding in Bangladesh in terms of flood depth and duration (Karim et al, 2002);
• Climate change scenario in the GBM region and estimation of the possible changes in flood extent and depth within Bangladesh (Mirza et al, 1997);
• Understanding the impact of SLR on flood using different IPCC SRES scenarios (Nicholls, 2004); • Investigation into the possible changes in the extent, magnitude and depth of flood in the GBM
river basin by using statistical techniques and adopting hydraulic modeling approaches under different climate change scenarios (Mirza et al, 2003), (Mirza et al, 2001);
• Identification of high risk areas in Bangladesh using flood frequency and flood water depth information (Asada et al, 2005);
• Review of evidences of the increased intensity of monsoon flooding in Bangladesh as well as increased incidence of drought in the dry season (Mirza et al, 2005);
• Assessment of flood risk in terms of cost of flood damage (Brouwer et al, 2006); Assessment of the risk of drought in the western part of Bangladesh (Shahid, et al., 2008).
• Critical analysis of history, trend, frequency and causes of flood in Bangladesh (Messerli et al, 2006);
• Explanation of different mathematical modeling approaches for investigating the effect of climate change on flow in the river basins of South Asia (Mirza et al, 2005). The reasons behind the increase of flood intensity and duration are found out from time series plot and regression analysis of the long term variability and trends of the pre-monsoon and monsoon period for the GBM river system. In this study, the main reasons are pointed out as sea level rise and enhanced back water effect from stronger monsoon flow (Quadir et al, 2003);
• Development of flood level probability map—contours of flood level (Rana et al, 2000), where GEVD (Generalised Extreme Value Distribution) is adopted after comparing six different probability distributions using the time series of historical annual maximum water level data. The extent to which reconstruction of embankments is responsible for increased severity of flash flooding is also researched (Choudhury et al, 2004);
• Co-existence of severe drought in India and extreme floods in Bangladesh during the 1987 monsoon season (Dhar et al, 2004);
• Identification of long term trend in the annual frequency of cyclonic disturbances (Karmakar, 2003);
• Analysis of sea level and sea surface temperature in relation to frequency of cyclones (Khan et al, 2000). Focusing on storm surge and sea level rise, a mathematical model has been developed by (Ali, 1996) for projecting alternative scenarios of sea level changes in the Bangladesh coast. He has identified trends in cyclone frequency and intensity and has simulated probable impacts of temperature increase on the extent of damage caused by cyclonic events;
• Research has found the impact of SLR on flood by producing various maps for flood inundations resulting from different levels of sea level rise (Nishat, 2008); and

89Ecosystems for Life • Climate Change Situation Analysis
• The impact of sea surface temperature and SLR on the generation of cyclonic storm, surge and flood in Western Bangladesh, using hydrodynamic modeling is covered in (Karim et al, 2008). Other papers that cover the effect of CC and tropical cyclones are (Ali, 1999) and (Ali, 2003).
o A number of studies have been conducted on the impact on water sector:• The diversion of Ganga water and its environmental impact on Bangladesh and India; specifically,
how significant the damage is to the ecosystem and economic sector of both countries has been covered in (Mirza, 2004);
• The impact of climate change on water resources at a regional scale (Fung et al, 2006). ADB has investigated the impact of climate change in the water sector of Bangladesh (Asian Development Bank, 1994);
• Strengthening the resilience of the water sector in Khulna has been studied (Asian Development Bank, 2008);
• Sensitivity of runoff to changes in temperature and precipitation in the GBM basin. This study attempted to find out the effect of temperature changes on low flow, sedimentation process, flood and drought (Mirza et al, 1997);
• Socio-economic perspectives of water-related vulnerability to climate change, based upon the data collected from selected hydrological unit (Choudhury et al, 2005);
• Impact of climate change on some water-dependent sectors and then the possible measures for sustainable water use in crop fields on Bangladesh has been presented (Islam et al, 2008).
• Assessment of climate change scenarios, salt water intrusions and human interventions on the natural resources of the basin and the use of these resources by the population within the basin (Aerts, 1997); and
• Severity of flood has been assessed from model generated scenario; severity of flood will increase both in frequency and inundated area and moderate flood with increased precipitation would functionally reduce availability of cultivable land area (Climate Change Cell, 2009).
n Climate change in the GBM region
We will begin by looking at surface warming. During the latter half of the past century, air temperatures have shown slow increase in all the countries in the GBM region. For India, which constitutes about 75% of the basin’s land area, an estimate reported a significant warming of 0.4oC/100 years in the mean annual temperature, 1901-1982 (Hingane et al, 1985). However, unlike the other countries of the region, increase in temperature is seen mainly in maximum temperature, thus showing an increase in the diurnal range of temperature. The reported changes in temperature over India, however, are not spatially uniform. There have been large areas of significant warming along the west coast (with an exception of the middle reaches), the interior peninsula and northeast India. Northwest India has been observing significant cooling. The diurnal variability in temperature has also showed significant changes. In general, there has been an increase in the diurnal range of temperatures. A recent analysis of observed daily temperature data spread over the Indian part of the GBM region shows that mean annual temperature increase is most prominent in the Brahmaputra basin (0.038oC/year). Mean annual minimum temperature in the same region is also showing an increasing trend (0.060oC/year). Whereas in the Ganga region, mean annual maximum temperature is showing the most prominent increasing trend (0.050oC/year), as we have found out (see Table 2, p 90).

Climate Change Situation Analysis • Ecosystems for Life90
A trend analysis of the past temperature in Bangladesh, as we have done, shows that during the past three decades warming has indeed taken place. In the Meghna region of Bangladesh, mean annual temperature and mean minimum temperature show prominent increase, by 0.026˚C/year and 0.03˚C/year. On the other hand, in the Ganga region the increase in maximum temperature is most prominent (0.05˚C/year). More specifically, minimum temperature of the winter and post-monsoon seasons has been increasing in most parts of the country, while the maximum temperature of winter shows weaker warming compared to the minimum temperature. The overall trend suggests that the winter is growing milder and the amplitude of diurnal variation during winter is also decreasing. On the other hand, post-monsoon season exhibits significant warming in the maximum temperature. Our trend analysis with mean annual temperature shows that it has been increasing over central and southern Bangladesh at moderate to high rates. For monsoon season a strong warming of about 0.1-0.3˚C/decade has taken place over the past thirty years (see Table 2).
RainfallA significant consequence of global warming due to increase in greenhouse gases would be an increase in magnitude and frequency of extreme precipitation events, as we have found out. In India, most of the extreme rainfall indices have shown significant positive trends over the west coast stations and northwestern parts of the peninsula (Maharashtra). Along the west coast, contribution from the heaviest (95 and 99 percentile) events to the total seasonal rainfall has increased significantly. Mean changes in the total rainfall is also realized. Increasing trend in some of the extreme rainfall indices also exists for the north-east region. Over the hilly region, significant decreasing trends of some extreme rainfall indices are also observed. In India, the trend in mean annual rainfall is showing an increasing trend only in the Meghna basin,1 whereas in the Brahmaputra regions the trend is decreasing. In the Meghna basin, each year the net increase in rainfall is around 32 mm/year (see Figure 3). In Bangladesh, mean annual rainfall all over three regions is showing an increasing trend. Like
Table 2: Change in mean annual temperature in the GBM region
Temperature range Region Degree Celsius/Year
Brahmaputra Ganges Meghna
Mean India 0.038 0.037 -0.002
Bangladesh 0.009 0.020 0.026
Minimum India 0.060 0.043 0.035
Bangladesh 0.013 0.023 0.030
Maximum India 0.048 0.050 0.025
Bangladesh 0.048 0.050 0.025
Source: CEGIS analysis

91Ecosystems for Life • Climate Change Situation Analysis
Figure 3: Observed trend in mean annual rainfall in the GBM region, India
Figure 4: Observed trend in mean annual rainfall in the GBM region, Bangladesh
Source: CEGIS analysis
1975 1980 1985 1990 1995 2000 2005 2010 2015
1200
1000
800
600
400
200
01975 1980 1985 1990 1995 2000 2005 2010 2015
1200
1000
800
600
400
200
0
1975 1980 1985 1990 1995 2000 2005 2010 2015
3500
3000
2500
2000
1500
1000
500
0
Mea
n an
nual
rain
fall
(mm
)
Ganga Basin
Ganga Basin
Meghna Basin
Meghna Basin
Brahmaputra Basin
Brahmaputra Basin
Mea
n an
nual
rain
fall
(mm
)
Mea
n an
nual
rain
fall
(mm
)M
ean
annu
al ra
infa
ll (m
m)
Mea
n an
nual
rain
fall
(mm
)M
ean
annu
al ra
infa
ll (m
m)
1965 1970 1975 1980 1985 1990 1995 2000 2005
3000
2500
2000
1500
1000
500
01965 1970 1975 1980 1985 1990 1995 2000 2005
3500
3000
2500
2000
1500
1000
500
0
1965 1970 1975 1980 1985 1990 1995 2000 2005
45004000350030002500200015001000
5000
y = 2.8195x – 3571.7R2 = 0.008 y = 9.8773x – 17195
R2 = 0.0991
y = 34.584x – 66136R2 = 0.2017
y = 0.3296x + 89.685R2 = 0.0006 y = 1.6666x + 4002.1
R2 = 0.0148
y = 31.824x – 61799R2 = 0.2882

Climate Change Situation Analysis • Ecosystems for Life92
the Indian part of the Meghna basin, the trend is most prominent and showing an increasing trend by 34.5 mm/year. More specifically, it is found maximum during the pre-monsoon (MAM) and monsoon (JJA) seasons, by around 100 mm increase in the mean seasonal rainfall. Although the winter season (DJF) experiences minimum rainfall, historical trend is showing a positive inclination in most of the rainfall observatories. Increase in the pre-monsoon (MAM) seasonal rainfall is also evident almost in every location in the coastal regions. Increase in the monsoon (JJA) rainfall is observed in some of the meteorological stations and post-monsoon (SON) rainfall is also observed to have increased in most meteorological stations, and is prominent in the coastal observatories (see Figure 4, p 91). Within the GBM region, India already has 174 meteorological stations, but only 12 are usable for statistical interpretation of climate change and variability. Other than this, Nepal has 17 stations, but none of them are usable. China has 13 stations, of which only 6 can be used. No monitoring station from Bhutan is available publicly. In this regard, for basic understanding of climate change phenomenon in the GBM region, time series data from a closely spaced hydro-meteorological monitoring network or establishment of a regional protocol will be very much helpful. Furthermore, observed evidence of climate change and extreme events in the GBM region is not available in any literature, which is also very urgent for drawing the base climatic profile of the GBM region.
The future scenarioMost of the observed increase in global average temperatures since the mid-20th century is very likely due to the observed increase in anthropogenic greenhouse gas concentrations. The concentration of atmospheric CO2 increased from a pre-industrial value of about 280 ppm to 379 ppm in 2005. The CH4 abundance in 2005 of about 1,774 ppb was more than double of its pre-industrial value. The N2O concentration in 2005 was 319 ppb, about 18% higher than its pre-industrial value. 1961-2003, the average rate of global mean sea level rise was estimated from tide gauge data to be 1.8 ± 0.5 mm per year (Solomon et al, 2007). Projected global average surface warming and sea level rise at the end of 2100, based on AOGCMs, has been presented in tabular form (see Table 3). Under different scenarios, temperature rise might be in the range of 1.1-6.4oC. Under the extreme scenario (A1FI), it is projected pre-monsoon seasonal rainfall might increase by 31% and monsoon seasonal rainfall might increase by 26% in the South Asian region (Cruz et al, 2007). Global sea level rise in the region might be in the range of 0.18 m-0.59 m under different SRES scenarios (Meehl et al, 2007). But FAR has been criticised for essentially discounting recent observations of substantial ice losses from the Greenland and Antarctic ice sheets in its projections of future sea level rise. Projected precipitation change in South Asia during the 21st century, based on AOGCMs, are now available (see Table 4). IPCC-projected climate change scenarios for South Asia are very coarse; at a 250-350 km grid, they are unsuitable for any micro-level impact assessment and adaptation
Table 3: Projected global average surface warming and sea level rise under different scenarios
Variable Scenarios
B1 A1T B2 A1B A2 A1Fl
Temp (oC) 1.1 – 2.9 1.4 – 3.8 1.4 – 3.8 1.7 – 4.4 2.0 – 5.4 2.4 – 6.4
SLR (m/year) 0.18 – 0.38 0.20 – 0.45 0.20 – 0.43 0.21 – 0.48 0.23 – 0.51 0.26 – 0.59
Note: SLR: Sea Level Rise; Source: Cruz et al, 2007; Meehl et al, 2007

93Ecosystems for Life • Climate Change Situation Analysis
planning study. In this regard, it is very urgent to downscale climate change scenario at the local level (preferably at 25-50 km interval) which will act as the base of any climate change-related studies. Understanding the urgency, the following research project is proposed for further research: Climate change scenario generation for the GBM region through dynamic downscaling.
n What climate change can induce in the GBM
Impact of climate change on hydro-meteorological events in the GBM region is not necessarily common. Some events are local or some are indirectly related to the regional hydrological regime. But it is possible to list what could happen in the GBM (see Table 5, p 94). From Table 5’s matrix, the following emerge as the common hydro-meteorological issues related to climate change:• Floods;• Droughts;• Natural disasters (cyclones and surges);• Sea level rise and inundation; and• Glacier melting. In what follows, each of the above-listed issues is discussed in the context of the GBM region.
FloodsClimate change is posing an additional threat to the occurrence of flood in the GBM region. Basin rainfall accounts more than two-third of annual water availability in the mighty river systems of the region3 and the occurrences of above-average basin wide rainfall during the monsoon months, June to August, are the main contributing factors of mega-flood events (Hofer and Misserli, 2006). In a nutshell, future changes in the precipitation regime have four distinct implications for the riverine flood regime: • Change in the timing of flood due to possible changes in seasonality; • Increase in the magnitude, frequency, depth, extent and duration of floods; • Change in the timing of peaking and change in the likelihood of synchronization of flood peaks of
the major rivers; and • Dramatic change in land-use patterns in Bangladesh. Most climate-related research points toward a warmer, wetter GBM region during monsoon
Table 4: Projected precipitation change in South Asia during the 21st century
Sub- regions Season 2010 – 2039
2040 – 2069 2070 - 2099
Scenarios A1Fl B1 A1Fl B1 A1Fl B1
South Asia DJF -3 4 0 0 -16 -6
MAM 7 8 26 24 31 20
JJA 5 7 13 11 26 15
SON 1 3 8 6 26 10
Note: All figures in mm; DJF: December, January & February; MAM: March, April & May; JJA: June, July & August; SON: September, October and November; -ve : decrease). Source: Cruz et al, 2007

Climate Change Situation Analysis • Ecosystems for Life94
in the coming decades (Mirza, 2005; Ahmed, 2006; Tanner et al, 2007). Increased rainfall in the upper GBM region is expected to result in higher river flows from Nepal, India, China, and Bhutan into Bangladesh (Mirza 2005; Cruz et al, 2007). Another estimation (Mirza and Dixit, 1997) suggests that a 2˚C warming, combined with a 10% increase in rainfall, would increase runoff by 19% for the Ganga, 13% for the Brahmaputra and 11% for the Meghna. In Bangladesh, depth of flooding would be pronounced in the lowlands of southwest Dhaka, Rajshahi and Sylhet, and the districts of Faridpur, Pabna, Comilla, and Mymensingh. Research (Mirza et al, 1997) has shown that a 5% increase in rainfall for the GBM basin, combined with 1˚C temperature rise, could result in up to 20% increase in the flooded area in Bangladesh. In 2002, Mirza further estimated that a 20-yr return period catastrophic flood event in the Ganga, Brahmaputra and Meghna rivers may change to 13-year, 15-year and 5.5-year return period floods in case of a 2oC warming scenario. Another study (Ahmed and Alam, 1998) concluded that a 1–20% increase in monsoon rainfall will increase surface runoff by 20–45% in Bangladesh.4 A more recent study (Mirza, 2005) estimated that the average flooded area in Bangladesh may increase by 23-29% for a 2˚C rise in temperature; and by 20-40% in case of a 6˚C temperature increase. Further, it has been estimated (Tanner et al, 2007) that a 9% increase in rainfall for the GBM region along with 2.4˚C temperature rise could result in a 57% reduction in the flood-free area and a 51% increase in flooded area, with inundation depth 0.9-1.8m, in Bangladesh by 2050. For a 10% increase in precipitation and 1.9˚C warming, the estimated changes are 63% reduction and
Table 5: Climate change issues in the GBM region
GBM regional Country Climate change priorities Scale and magnitude Priority focus areas
Bangladesh Floods National to regional GBM region Droughts Local to national Throughout, scatteredIncrease in natural disasters (cyclones and storm surges)
National to regional Coastal zones
SLR and salinity intrusion Local Coastal zones India Glacier melting Regional Himalayas; Hindu Kush
Floods National to regional GBM region Droughts Local to national Throughout , scatteredIncrease in disasters (cyclones) National to regional Coastal zones SLR and salinity intrusion Local Coastal zones
Bhutan Glacier melting Regional Himalayas; Hindu Kush Lake outburst Local to national Hill and mountain areas Floods National to regional GBM region Droughts Local to national Throughout
Nepal Glacier melting Regional Himalayas; Hindu Kush Lake outburst Local to national Hill and mountain areas Floods National to regional GBM region Droughts Local to national Throughout
Source: World bank, 2009

95Ecosystems for Life • Climate Change Situation Analysis
82% increase respectively. Most recently, the Institute of Water Modelling reported an increase in average inundation area in Bangladesh by 8%, for a 13% increase in rainfall over the GBM basin and a 17-cm sea level rise by 2040 (CCC, 2009 I). Hence, forecasts by most of the climate-related research indicate vulnerability of GBM region to severe monsoon floods will increase further with climate change. Thus, climate change has added additional uncertainty over flood regime in the region and people have become used to coping with flood. Nowadays, flood forecasting has become the most crucial issue for all the countries in the GBM region. But effective flood forecasting is not possible without including the whole regional hydrological regime. In this regard, prior to the assessment of climate change impact on river flow hydraulics, a region-wide hydrological model is required to be updated jointly, with real time series, for understanding the mechanism of monsoon flood and pre-monsoon flash flood. As an output of the model, establishment of a region-wide flood forecasting network might be one of the most important joint research agendas for this region.
DroughtIncreasing frequency and intensity of droughts in many parts of South Asia are attributed largely to a rise in temperature, particularly during the summer and normally drier months, and during ENSO events (Lal 2002, 2003). In this region, 50% of droughts associated with El Nino, consecutive droughts in 1999 and 2000 in northwest India led to a sharp decline in water tables; consecutive droughts in 2000 and 2002 caused crop failures, mass starvation and affected around 11 million people in Orissa, while droughts in northeast India during summer monsoon also had a devastating impact on rural livelihoods. Research data from the Indian Institute of Tropical Meteorology (IITM) indicate a close relationship between drought in South Asia and El Niño events in the Pacific. IPCC is projecting that more frequent and prolonged droughts, as a consequence of climate change and other anthropogenic factors together, will result in the increasing trends of desertification in South Asia (Cruz et al, 2007; see section 10.4.4.2 of Working Group 2 in the IPCC FAR report). Another projection (World Bank, 2009) has shown that Bangladesh and India in the South Asian region will be mostly affected by severe drought due to climate change. Drought is quite a common phenomenon in the GBM region. But definition and understanding on drought is different among the regional countries. But till date, no research has been initiated yet to assess the impact of climate change on drought on a regional scale. Such research will be particularly helpful for planning adaptation measure for promoting the agriculture-dependent economy in the GBM region.
Cyclones and coastal storm surgesFrequency of monsoon depressions and cyclone formation in the South Asian coast, especially in the Bay of Bengal, is on the decline since 1970 but intensity is increasing, causing severe floods in terms of damages to life and property (Lal, 2001; 2003). It is evident from research that a 10oC increase in sea surface temperature could increase tropical cyclone intensity by 10%. FAR has also projected that extreme rainfall and winds associated with tropical cyclones are likely to increase by 10-20% in South Asia, caused by the rise in Sea-Surface Temperature (SST) of 2-4˚C, relative to the current threshold (26˚C in the Bay of Bengal) in SST. In the ranking of the world’s deadliest tropical cyclones,5 23 out of 30 cyclones originated in the Bay of Bengal that hit mostly Bangladesh (14 out of 30), followed by India (9 out of 30) and Myanmar (1 out of 30), which caused a death toll of around 2.5 million.6 Over the last two years, four devastating cyclones originated in the Bay of Bengal that hit the

Climate Change Situation Analysis • Ecosystems for Life96
coast and parts of eastern India. In terms of surge height, during cyclone Sidr, tidal waves reached up to 12m (see Figure 3, p 91) and a surge up to 3 m was reported in the coastal areas of north Chennai in the southern state of Tamil Nadu in India. Till date, very little research is available on the impact of climate change on cyclones originating in the Bay of Bengal. Apart from this, identification of risk zones in the coastal region of Bangladesh and assessing the vulnerability of the population and assets are very essential, as climate change is predicted to increase the frequency and intensity of the cyclones. In this regard, the following research topic is proposed as local research agenda: To investigate into the trends in past cyclone frequency and intensity in Bangladesh and to predict the possible future changes in cyclone behaviour under different climate change scenarios.
Sea level riseThe region has a long and densely populated coastline with low-lying islands vulnerable to sea level rise. Sea level rise is a major source of concern not only for coastal urban areas (e.g. Cox’s Bazar, Chittagong, Chennai, Kolkata and Mumbai) but also for the fertile delta systems, which are threatened by both inundation and salinity intrusion (e.g. in Bangladesh, and the river deltas of the Indus, Krishna, Cauvery and Narmada rivers). FAR (Solomon et al, 2007) has stated that the observed mean sea level rise, 1961-2003, was 1.3-2.3 mm per year but in the past two decades, 1993-2003, it has risen more alarmingly, to 2.4-3.8 mm per year. Remaining on a conservative side,7 they have also estimated the possible sea level rise of 0.18-0.59 m for six different scenarios in 2090-2099. But IPCC-projected sea level rise estimates are much understated, as they did not include ice sheet contribution from Greenland and Antarctica, local SLR estimates, subsidence effect, and the fact that the river bed and estuary will adjust due to morphological dynamism. In this regard, knowledge gap in estimating the net amount of sea level rise remains and further research on this particular should be initiated from local level.
GlaciersThe retreating glaciers of the Himalayas could present the most far-reaching challenge to the region. Although FAR controversially reported that the receding rate is faster than any other part of the world and the likelihood of them disappearing by the year 2035, or perhaps sooner, but the fact of higher recession rate is not invalid.8 The 30.2 km long Gangotri glacier and neighbouring chain of glaciers, which is the lifeline of the Ganga and the Brahmaputra, has been receding alarmingly in recent years. 1842-1935, the Gangotri glacier was receding at an average of 7.3 m every year; the average rate of recession 1985-2001 is about 23 m per year (Hasnain, 2002). In the long-term, experts predict, the quantity of water in these river systems will decrease, especially in the Indus river system. The combination of two trends—increasing demand plus decreasing supply and access—is likely to exacerbate discord over regional water resources. Due to regional scarcity of water, India has already signed several treaties with its South Asian neighbours for regulation and distribution of shared water resources, particularly rivers. In recent years, increasing upstream water withdrawal and other development initiatives have created decline in the water availability in Bangladesh and even within the states in India. These disruptions may threaten the non-traditional security issues like quality of economic, social and political relationships between India and Bangladesh (Condon et al, 2009). In this regard, joint or regional initiative for water resources development at the regional scale may produce a win-win solution. It was a big debate when FAR projected that the total area of the Gangotri glacier will shrink

97Ecosystems for Life • Climate Change Situation Analysis
from 500,000 sq km to 100,000 sq km by 2035 (Cruz et al, 2007; cited from WWF, 2005). If the present rate continues, the likelihood of them disappearing by 2035, and perhaps sooner, is very high if the Earth keeps warming at the current rate. The truth is that over the past few decades the rate of recession for the Gangotri glacier has been 22-27 m/yr; IPCC adopted the fugure 28 m/yr (Jain, 2008). If it increases to 40 m/yr, simple computation shows that 30 km of length will take 700 years to completely melt away. In this regard, a comprehensive research is needed for better understanding of the impact of glacier melting on river water availability in the GBM region.
n Foci of joint research
Climate change impacts are long term; where mitigation is an essential but not the optimum option for reducing the uncertain future impacts, adaptation planning and implementation in the short-term is a must for combating rather than living with the uncertainties. As the origin and destination of risks and impacts are not country specific, so seeking solution must not be limited only to specific country domains. Regional/joint planning and implementation of incremental adaptation strategies and policies to exploit ‘no-regret’ measures and ‘win-win’ options should be preferred over other options. Hence a list of ‘win-win’ potentials that may call for (but are not limited to) regional initiatives for adaptation planning is given below:• Basic understanding of climate change phenomena in the GBM region is missing. Joint research
and the development of a knowledge base on hydro-meteorological information will facilitate the process of determining new trends in climate variability and change, including extreme weather events. Key findings on impacts, vulnerabilities and adaptation for the GBM region will not only help combating future uncertainties, but also move towards sustainable and equitable economic development in the region, like increase in the income levels, education and technical skills and improvements in public food distribution, disaster preparedness and management, and health care systems. Management and distribution of time series data from a closely spaced hydro-meteorological monitoring network or establishment of a regional protocol should be treated as an urgent priority;
• Climate change scenario generation for the GBM region through dynamic downscaling. It will act as the base of all climate change impact and adaptation related study;
• The first and foremost task before adaptation option formulation is to assess the impact of climate change in terms of regional perspective. As a part of this, a region-wide hydrological model is required to be updated for assessing the impact on river water flow regime. The output should be used for establishment of a region wide flood forecasting network that might be one of the most
Mitigation as a response to climate change is essential. But is it the optimum option? To reduce uncertain future impacts, adaptation planning and implementation in the short term is necessary. Rather than living with the uncertainties, it it better to combat them

Climate Change Situation Analysis • Ecosystems for Life98
important joint research agenda for this region. Other than this, assessing the impact of climate change on drought on a regional scale should be given priority. A comprehensive research is also needed for better understanding of the impact of glacier melting on river water availability in the GBM region;
• Permanent and temporal inundation due to sea level rise and storm surge is crucial for Bangladesh's coast. Immediately, a comprehensive understanding is required on the net amount of sea level rise in the Bangladesh coast. Other than this, to investigate the trends in past cyclone frequency and intensity in Bangladesh and to predict the possible future changes in cyclone behaviour under different climate change scenario is also a daunting task;
• Water savings and management mechanism through increasing water use efficiency, water recycling and designing environment and climate change resilient water management infrastructure to avert water scarcity in regions already under water stress;
• Assessment of potentials of devolutionary shift in common river basin and coastal zone management techniques, applying integrated water resources and coastal zone management principles, with special focus on integrated crop zoning (crop and fish) culture in the potentially affected areas due to sea level rise and storm surge inundation; and
• Installation and maintenance of regional and national weather prediction and hazard warning systems, especially during rainy and tropical storm seasons.
Nandan Mukherjee and Malik Fida Abdullah Khan, Climate Change Study Division (CCSD), Centre for Environmental and Geographic Information Services (CEGIS), Dhaka, Bangladesh

99Ecosystems for Life • Climate Change Situation Analysis
Endnotes
1 Meghna basin comprises of the river basin of Meghna in Bangladesh and Barak in India2 Estimates of global sea level rise do not consider the local effect of the Bay or Coast which often influenced by subsidence,
wind, tidal amplification or dampening effects.3 For example, snow and glacier melt contribute only 29% to the annual flow in the Ganges at Devprayag; the rest is from
rainwater (Jain, 2008).4 An earlier study indicates that a 10% increase in precipitation in Bangladesh could increase run-off depth by 18-22%,
resulting in a seven-fold increase of extremely wet weather (Qureshi and Hobbie, 1994).5 Measured in terms of number of deaths per event.6 www.wunderground.com, as accessed on October 29, 2009.7 IPCC’s Fourth Assessment Report has been criticized for essentially discounting recent observations of substantial ice
losses from the Greenland and Antarctic ice sheets in its projections of future sea level rise. Mote et al (2008) provides a rough estimate of an upper limit for ice sheet loss contributions to global sea level rise of 0.34 m by 2100.
8 Its total area will likely shrink from the present 500,000 to 100,000 sq km by the year 2035 (WWF, 2005).
Reference
• ADB, Asian Development Bank (1994). Climate Change in Asia: Bangladesh Country Report. Manila.• Ahmed, A.U. and Alam, M. (1998). Development of Climate Change Scenarios With General Circulation Models, in S. Huq,
Z. Karim, M. Asaduzzaman, and F. Mahtab (Eds.), Vulnerability and Adaptation to Climate Change for Bangladesh, Kluwer Academic Publishers, Dordrecht, pp. 13-20.
• Asaduzzaman, M, Reazuddin, M. and Ahmed, A.U. (Eds.), 1997, Global Climate Change: Bangladesh Episode, Department of Environment, Government of Bangladesh, July 1997.
• Department of Environment. (1993). Assessment of the Vulnerability of Coastal Areas to Climate Change and Sea Level
Rise. A Pilot Study of Bangladesh. Dhaka: Department of Environment, Ministry of Environment and Forest (MoEF), Government of the People’s Republic of Bangladesh (GoB); Bangladesh Center for Advanced Studies (BCAS); Resource Analysis (RA); and Approtech.
• United Nations Development Programme (UNDP). (2005). National Adaptation Programme of Action (NAPA). Dhaka: United Nations Development Programme (UNDP), Ministry of Environment and Forest (MoEF), Government of the People’s Republic of Bangladesh (GoB); November; available at: http://unfccc.int/resource/docs/napa/ban01.pdf.
• Aerts, J. (1997). Spatial Tools for River Basins and Environment and Analysis of Management options (STREAM), Applications
for Sea Level Rise. Amsterdam: The Netherlands: Vrije Universiteit.• Aerts, J. (1997). Spatial Tools for River Basins and Environment and Analysis of Management options (STREAM), Applications
for Sea Level Rise. Amsterdam: The Netherlands: Vrije Universiteit.• Agrawala, S., Ota, T., Ahmed, A., Smith, J., & Aalst, M. V. (2003). Development and Climate Change in Bangladesh: Focus on
Coastal Flooding and the Sunderbans. Paris: Organisation for Economic Co-operation and Development (OECD).• Ahmad, Q. K. (2006a). Changement climatique, inondations et gestion des crues: le cas du Bangladesh. No. 121, pp. 73-94.• Ahmad, Q. K. (2006b). Sustainable Development: From Community Approaches to Flood Vulnerability Reduction to
Climate Change Adaptation in South Asia. the Climate Change and Sustainable Development (CC&SD) Workshop. Delhi: http://www.un.org/esa/sustdev/sdissues/energy/op/new_dehli_workshop/UNDESA%20presentations/Day1/Session3 /UN_DESA_New%20Delhi_2006_QK%20Ahmad.ppt.
• Ahmad, Q. K., Warrick, R. A., Ericksen, N. J., & Mirza, M. Q. (1994). The Implications of Climate Change for Bangladesh: A Synthesis. In R. A. Warrick, & Q. K. Ahmad, The Implications of Climate and Sea-Level Change for Bangladesh (pp. 1-34). Dhaka: Bangladesh Unnayan Parishad, Briefing Document No. 7, Dordrecht, The Netherlands: Kluwer Academic Publishers.

Climate Change Situation Analysis • Ecosystems for Life100
• Ahmed, A. U. (2006). Bangladesh: Climate Change Impacts and Vulnerability - A Synthesis. Dhaka: Dhaka: GoB, MoEF, Department of Environment, Climate Change Cell; http://www.climatechangecell-bd.org/publications/06ccimpactvulnerability.pdf.
• Ahmed, A. U. (2003). Climate Variability and Flood: Climate Variability and Flood: Observed Coping Mechanisms in Bangladesh. 13th Stockholm Water Symposium (August 11-14). Stockholm.
• Ahmed, A. U., & Alam, M. (1999). Development of Climate Change Scenarios with General Circulation Models. In S. Huq, Z. Karim, M. Asaduzzaman, & F. Mahtab, Vulnerability and Adaptation to Climate Change for Bangladesh (pp. 13-20). Dordrecht, The Netherlands: Kluwer Academic Publishers.
• Ahmed, A. U., Huq, S., Karim, Z., Asaduzzaman, M., Rahman, A. A., Alam, M., et al. (1996). Vulnerability and Adaptation Assessments for Bangladesh. In J. B. Smith, S. Huq, S. Lenhart, L. J. Mata, I. Nemesova, & S. Toure, Vulnerability and
Adaptation to Climate Change: Interim Results from the US Country Studies Program. Dordrecht: Dordrecht, The Netherlands: Kluwer Academic Publishers.
• Ahmed, A., Huq, S., Karim, Z., Asaduzzaman, M., Rahman, A., Alam, M., et al. (1996b). Vulnerability and Adaptation Assessments for Bangladesh. In J. Smith, S. Huq, S. Lenhart, L. Mata, I. Nemesova, & S. Toure, Vulnerability and Adaptation
to Climate Change. Dordrecht/Boston/London: Kluwer Academic Publishers, 1996.• Alam, M. (2004). “Adverse Impacts of Climate Change on Development of Bangladesh: Integrating Adaptation into Policies
and Activities”, Capacity Strengthening in the Least Developed Countries (LDCs) for Adaptation to Climate Change (CLACC) Working Paper No. 1. Capacity Strengthening in the Least Developed Countries (LDCs) for Adaptation to Climate
Change (CLACC) (p. Working Paper No. 1). London: International Institute for Environment and Development (IIED), and Dhaka: Bangladesh Centre for Advanced Studies (BCAS); http://www.iied.org/pubs/pdf/full/10016IIED.pdf.
• Alam, M., & Rahman, A. (2008). Development and climate change policy-making process in Bangladesh. In Y. Kameyama, A. P. Sari, M. H. Soejahmoen, & N. Kanie, Climate Change in Asia: Perspectives on the Future Climate Regime (pp. 51-65 (Chapter 4)). Tokyo: United Nations University Press.
• Ali, A. (1999). Climate change impacts and adaptation assessment in Bangladesh. Climate Research; available at: http://
www.intres.com/articles/cr/12/c012p109.pdf , CR Special 6, Vol. 12, No. 2/3, pp. 109-116.• Ali, A. (2003). Impacts of Climate Change on Tropical Cyclones and Storm Surges in Bangladesh. Proceedings of SAARC
Seminar on Climate Variability in the South Asian Region and its Impacts (held on 10-12 December 2002. Dhaka: Dhaka: SAARC Meteorological Research Center (SMRC).
• Ali, A. (2000). Vulnerability of Bangladesh Coastal Region to Climate Change with Adaptation Options. Dhaka: Dhaka: Bangladesh Space Research and Remote Sensing Organisation (SPARRSO); available at: http://www.survas.mdx.ac.uk/pdfs/3anwaral.pdf.
• Ali, A. (1996). Vulnerability of Bangladesh to Climate Change and Sea Level Rise through Tropical Cyclones and Storm Surges, Water, Air, & Soil Pollution. Vol. 92, No. 1-2 (November), pp. 171-179.
• Asada, H., Matsumoto, J., & Rahman, R. (2005). Impact of Recent Severe Floods on Rice Production in Bangladesh. Geographical Review of Japan , Vol. 78, No. 12, pp. 783-793.
• Asaduzzaman, M., Reazuddin, M., & Ahmed, A. U. (1997). Global Climate Change -Bangladesh Episode. Dhaka: Department of Environment (DoE), Ministry of Environment and Forest (MoEF), Government of the People’s Republic of Bangladesh.
• Asian Development Bank (ADB). (1994b). Climate Change in Asia: Bangladesh Country Report. Manila, The Philippines: Asian Development Bank, Regional Study on Global Environmental Issues Series.
• Asian Development Bank (ADB). (2008). People’s Republic of Bangladesh: Strengthening the Resilience of the Water Sector
in Khulna to Climate Change. Manila, The Philippines: Asian Development Bank (ADB), Technical Assistance Report, Project No. 42469 (December); available at: http://www.adb.org//Documents/TARs/BAN/42469-BAN-TAR.pdf.
• Bangladesh Centre for Advanced Studies (BCAS); Resource Analysis (RA); Approtech. (1994). Vulnerability of Bangladesh
to Climate Change and Sea Level Rise. Concepts and Tools for Calculating Risk in Integrated Coastal Zone Management. Dhaka: Dhaka: Bangladesh Centre for Advanced Studies (BCAS), and Delft, The Netherlands: Resource Analysis (RA), and

101Ecosystems for Life • Climate Change Situation Analysis
Approtech Consultants Limited.• Begum, S., & Fleming, G. (1997). Climate Change and Sea Level Rise in Bangladesh, Part I: Numerical Simulation. Marine
Geodesy , Vol. 20, No. 1 (Special Issue on Sea Level Problems of Bangladesh), pp. 33-54.• Brichieri-Colombi, S., & Bradnock, R. (2003). Geopolitics, water and development in South Asia: cooperative development
in the Ganges-Brahmaputra delta. The Geographical Journal , Vol. 169, pp.43-64.• Brouwer, R., Aftab, S., Brander, L., & Haque, E. (2006). Economic valuation of flood risk exposure and flood control in a
severely flood prone developing country. Amsterdam: Amsterdam, The Netherlands: Institute for Environmental Studies, Vrije Universiteit, Poverty Reduction and Environmental Management (PREM), PREM Working Paper, No. 06/02 (March); available at http://www.premonline.org/archive/16/doc/PREM06-02.pdf.
• BUP-CEARS-CRU. (1994). Bangladesh: Greenhouse Effect and Climate Change, Briefing Documents No. 1-7. Bangladesh Unnayan Parishad (BUP), Bangladesh; Centre for environmental and Resource Studies (CEARS), University of Waikato, New Zealand and Climate Research Unit (CRU), University of East Anglia, Norwich, UK).
• Cash, B. A., Rodó, X., & III, J. L. (2008). Links between Tropical Pacific SST and Cholera Incidence in Bangladesh: Role of the Eastern and Central Tropical Pacific. Journal of Climate , Vol. 21, No. 18, pp. 4647-4663.
• Choudhury, A. M. (1994). Bangladesh Floods, Cyclones and ENSO, Trieste, Italy. International Centre for Theoretical Physics (ICTP); Proceedings of the International Conference on Monsoon Variability and Prediction, Vol. 1, pp 136-145, WMO,WCRP-84,WMO/TD-No. 619.
• Choudhury, A. M. (1986). Our Climate in Danger, Trieste, Italy. Dhaka: International Centre for Theoretical Physics (ICTP); Proceedings of the Regional Seminar on the Applications of Remote Sensing Techniques To Coastal Zone Management and Environmental Monitoring organized by UNDP/ESCAP Regional Remote Sensing Programme.
• Choudhury, A. M., Haque, M. A., & Quadir, D. A. (1997). Consequences of Global Warming and Sea Level Rise in Bangladesh. Marine Geodesy , Vol. 20, No. 1 (Special Issue on Sea Level Problems of Bangladesh), pp. 13-31.
• Choudhury, A. M., Neelormi, S., Quadir, D. A., Mallick, S., & Ahmed, A. U. (2005). Socio-Economic and Physical Perspectives of Water Related Vulnerability to Climate Change: Results of Field Study in Bangladesh. Science and Culture , Vol. 71, No. 7/8, pp. 225-238.
• Choudhury, N. Y., Paul, A., & Paul, B. K. (2004). Impact of costal embankment on the flash flood in Bangladesh: a case study. Applied Geography , Vol. 24, No. 3, pp. 241-258.
• Chowdhury, M. R., & Ward, M. N. (2003). “Seasonal Rainfall and Stream-flow in the Ganges-Brahmaputra Basins of Bangladesh: Variability and Predictability. In P. B. DeBarry, Proceedings of the World Water and Environmental Resources
Congress 2003. Reston, VA: American Society of Civil Engineers.• Climate Change Cell (2009 b), Characterizing Country Settings: Development of a Base Document in the Backdrop of Climate
Change Impacts. Dhaka: Climate Change Cell, DoE,MoEF; Component 4b, CDMP, MoFDM.• Climate Change Cell (2009 k), Generation of PRECIS Scenarios for Bangladesh: Validation and Parameterization. Dhaka:
DoE, MoEF,CDMP, MoFDM.• Climate Change Cell (2009 l), Impact Assessment of Climate Change and Sea Level Rise on Monsoon Flooding. Dhaka:
Climate Change Cell, DoE, MoEF; Component 4b, CDMP, MoFDM.• Condon, E., Hillmann, P., King, J., Lang, K., and Patz, A., 2009. Resource Disputes in South Asia: Water Scarcity and the
Potential for Interstate Conflict. Robert M. La Follette School of Public Affairs University of Wisconsin–Madison.• Cruz, R. V., Harasawa, H., Lal, M., Wu, S., Anokhin, Y., Punsalmaa, B., et al. (2007). Asia. In M. L. Parry, O. F. Canziani, J.
P. Palutikof, P. J. Linden, & C. E. Hanson, Climate Change 2007: Impacts, Adaptation and Vulnerability -- Contribution of
Working Group II to the Fourth Assessment Report of the Intergovernmental Panel on Climate Change (pp. pp. 469-506 (Chapter 10); available at: http://www.ipcc.ch/pdf/assessment-report/ar4/wg2/ar4-wg2-chapter10.pdf). Cambridge, UK: Cambridge University Press.
• Dhar, O. N., & Nandargi, S. (2004). Co-existence of severe drought in India and extreme floods in Bangladesh during the 1987 monsoon season. International Journal of Meteorology , Vol. 29, No. 289, pp. 161-167.

Climate Change Situation Analysis • Ecosystems for Life102
• Efroymson, D. (2005). Climate Change: Information and Suggestions. Dhaka: Dhaka: Work for a Better Bangladesh (WBB) Trust; available at: http://www.wbbtrust.org/research/Climate%20change.pdf.
• Friendly, A. (1998). Bangladesh-2020: A Long Run Perspective Study. Dhaka: Dhaka: The University Press Ltd. with Bangladesh Centre for Advanced Studies; available at: http://go.worldbank.org/NTPHG4XVE0.
• Fung, C. F., Farquharson, F., & Chowdhury, J. (2006). Exploring the impacts of climate change on water resources - Regional impacts at a regional scale: Bangladesh. In S. Demuth, A. Gustard, E. Planos, F. Scatena, & E. Servat, Climate Variability and
Change— Hydrological Impacts (Proceedings of the Fifth FRIEND World Conference held at Havana, Cuba, November 2006) (pp. pp. 389-393). Oxfordshire, UK: International Association of Hydrological Sciences (IAHS) Publication.
• Gaan, N. (2005). Environmental scarcity, migration and future sea level rise in Bangladesh: security implications on India. Asian Profile , Vol. 33, No. 6 (December), pp. 617-630.
• Hasnain, S.I., 2002: Himalayan glaciers meltdown: impacts on South Asian Rivers. FRIEND 2002-Regional Hydrology:
Bridging the Gap between Research and Practice, H.A.J. van Lanen and S. Demuth, Eds., IAHS Publications,Wallingford, No. 274, 417-423.
• Habibullah, M., Ahmed, A. U., & Karim, Z. (1999). Assessment of Foodgrain Production Loss Due to Climate Induced Soil Salinity: A Case Study. In S. Huq, Z. Karim, M. Asaduzzaman, & F. Mahtab, Vulnerability and Adaptation to Climate Change
for Bangladesh (pp. pp. 56-69). Dordrecht, The Netherlands: Kluwer Academic Publishers.• Hossain, M. (1989). The Greenhouse Effect and the Coastal Area of Bangladesh: Its People and Economy. In H. J. Moudud,
H. E. Rashid, A. A. Rahman, & M. Hossain, The Greenhouse Effect and Coastal Area of Bangladesh. Dhaka: Dhaka, Bangladesh Centre for Advanced Studies.
• Huq, S., Ali, S. I., & Rahman, A. A. (1995). Bangladesh Is Used to Coping but Rising Seas Pose New Dangers. Climate Alert , Vol. 8, No. 2 (March-April).
• Huq, S., Karim, Z., Asaduzzaman, M., & Mahtab, F. (1998). Vulnerability and Adaptation to Climate Change for Bangladesh. Kluwer Academic Publishers, Dordrecht.
• Islam, M. N. (forthcoming). Projection of Rainfall in SAARC Region: Part-1 Bangladesh.• Islam, M. N. (2008). Studies on Summer Monsoon Rainfall Using Regional Climate Model PRECIS. SAARC Meteorological
Research Centre (SMRC) , SMRC Publication, No. 22.• Islam, M. N., & Uyeda, H. (2007). Use of TRMM in determining the climatic characteristics of rainfall over Bangladesh.
Remote Sensing of Environment , Vol. 108, No. 3, pp. 264-276.• Islam, M. N., & Uyeda, H. (2008b). Vertical variations of rain intensity in different rainy periods in and around Bangladesh
derived from TRMM observations. International Journal of Climatology , Vol. 28, No. 2, pp. 273-279.• Islam, M. N., Rafiuddin, M., Ahmed, A. U., & Kolli, R. K. (2008c). Calibration of PRECIS in employing future scenarios in
Bangladesh. International Journal of Climatology , Vol. 28, No. 5, pp. 617-628.• Islam, M. S. (2001). Sea Level Changes in Bangladesh: The Last Ten Thousand Years. Dhaka: Asiatic Society of Bangladesh.• Islam, M. S., & Tooley, M. J. (1999). Coastal and sea-level changes during the Holocene in Bangladesh. Quaternary
International , Vol. 55, No. 1 , pp. 61-75.• Islam, M. S., Mahbub, A. A., & Islam, M. S. (2008d). Cool Rice for a Warmer Environment Concept, Progress and Prospect.
Presentation made at the International Symposium on Climate Change and Food Security in South Asia . Dhaka: http://www.wmo.ch/pages/prog/wcp/agm/meetings/rsama08/rsama08_present.html.
• Jain, S. K. (2008). Impact of retreat of Gangotri glacier on the flow of Ganga River. Climate Science , 1012-1014.• Jennifer, P., Islam, N., Smit, B., Islam, & Shafiqul. (2006). Livelihoods in rural Bangladesh. Tiempo , Issue 59 (April), pp.
18-22; http://www.cru.uea.ac.uk/tiempo/portal/archive/pdf/tiempo59low.pdf.• Karim, M. F., & Mimura, N. (2008). Impacts of climate change and sea-level rise on cyclonic storm surge floods in
Bangladesh. Global Environmental Change , Vol. 18, No. 3, pp. 490-500.• Karim, M. F., Tingsanchali, T., & Tanimoto, K. (2002). Flood Risk Assessment for the Ganges Floodplain in Bangladesh.
Proceedings of the International Coastal Engineering Conference , Vol. 28, No. 3, pp. 3581-3593.

103Ecosystems for Life • Climate Change Situation Analysis
• Karmakar, S. (2003). Trends in the annual frequency of cyclonic disturbances and storms in the Bay of Bengal. In K. P. D. A. Quadir, Proceedings of SAARC Seminar on Climate Variability in the South Asian Region and its Impacts . Dhaka: SAARC Meteorological Research Center.
• Karmakar, S., & Shrestha, M. L. (2000). Recent Climate Changes in Bangladesh. Dhaka: SAARC Meteorological Research Centre; SMRC Publication; SMRC-No. 4.
• Khan, M. S., Sen, R., Noor, S., Naser, H. M., & Alam, M. K. (2008). Soil, Water and Climate Related Constraints for Crop Production in Bangladesh. Presentation made at the International Symposium on Climate Change and Food Security in
South Asia . Dhaka: http://www.wmo.ch/pages/prog/wcp/agm/meetings/rsama08/rsama08_present.html.• Khan, T. M., Singh, O. P., & Rahman, M. D. (2000). Recent sea level and sea surface temperature trends along the Bangladesh
coast in relation to the frequency of intense cyclones. Marine Geodesy , Vol. 23, pp. 103-116.• Lal, M., 2001: Tropical cyclones in a warmer world. Curr. Sci. India, 80, 1103-1104.• Lal, M., 2002: Global climate change: India’s monsoon and its variability. Final Report under Country Studies Vulnerability
and Adaptation Work Assignment with Stratus Consulting’s Contract of the U.S. Environmental ProtectionAgency, 58 pp.• Lal, M., 2003: Global climate change: India’s monsoon and its variability. Journal of Environmental Studies and Policy, 6,
1-34.• Mahtab, F. (1989). Effect of Climate Change and Sea Level Rise on Bangladesh, (for Expert Group on Climate Change and Sea
Level Rise). London, United Kingdom: Commonwealth Secretariat.• Meehl, G., Stocker, T., Collins, W., Friedlingstein, P., Gaye, A., Gregory, J., et al. (2007). Global Climate Projections. In:
Climate Change 2007: The Physical Science Basis. In S. Solomon, D. Qin, M. Manning, Z. Chen, M. Marquis, K. Averyt, et al., Contribution of WoFourth Assessment Report of the Intergovernmental Panel on Climate Change. Cambridge, United Kingdom and New York, NY, USA: Cambridge University Press.
• Messerli, Bruno, & Hofer, T. (2006). Floods in Bangladesh: History, Dynamics and Rethinking the Role of the Himalayas. Tokiyo: United Nations University Press.
• Miah, N. M. (2003). Variations of temperature in Bangladesh. In D. A. Quadir, K. Prasad, & M. & Hussain, Proceedings of
SAARC Seminar on Climate Variability in the South Asian Region and its Impacts. Dhaka: SAARC Meteorological Research Center (SMRC).
• Milliman, J. D., & Haq, B. U. (1996). Sea-Level Rise and Coastal Subsidence: Causes, Consequences, and Strategies. New York: Springer, Series: Coastal Systems and Continental Margins, Vol. 2.
• Mirza, & Qader, M. M. (2002). Global warming and changes in the probability of occurrence of floods in Bangladesh and implications. Global Environmental Change , Vol. 12, No. 2, (July) pp. 127-138.
• Mirza, & Qader, M. M. (2005). Hydrologic Modeling Approaches for Climate Impact Assessment in South Asia. In M. M. Mirza, & Q. K. Ahmad, Climate Change and Water Resources in South Asia (pp. 23-53 (Chapter 2)). Leiden, The Netherlands: A. A. Balkema Publishers.
• Mirza, & Qader, M. M. (1997). Modeling the Effects of Climate Change on Flooding in Bangladesh. Waikato, New Zealand: The University of Waikato: Ph.D. Thesis in International and Resource Studies.
• Mirza, & Qader, M. M. (2003). Three Recent Extreme Floods in Bangladesh: A Hydro-Meteorological Analysis. Natural
Hazards , Vol. 28, No. 1, pp. 35-64.• Mirza, M. (2002b). Global Warming and Changes in the Probability of Occurrence of Floods in Bangladesh and Implications.
Global Environmental Change , Vol 12: 127-138.• Mirza, M. M. (2004). The Ganges Water Diversion : Environmental Effetcs and Implications. Kluwer Academic Publishers.• Mirza, M. M., & Ahmad, Q. K. (2005b). Climate Change and Water Resources in South Asia: An Introduction. Leiden, The
Netherlands:: A. A. Balkema Publishers.• Mirza, M. M., & Burton, I. (2005c). Using the Adaptation Policy Framework to Assess Climate Risks and Response Measures
in South Asia: The Case of Floods and Droughts in Bangladesh and India. In M. M. Mirza, & Q. K. Ahmad, Climate Change
and Water Resources in South Asia (pp. 279-314 (Chapter 11)). Leiden, The Netherlands: A. A. Balkema Publishers.

Climate Change Situation Analysis • Ecosystems for Life104
• Mirza, M. M., & Dixit, A. (1997b). Climate change and water management in the GBM Basins. Water Nepal , Vol. 5, No. 1, pp. 71-100.
• Mirza, M. M., Warrick, R. A., & Ericksen, N. J. (2003b). The Implications of Climate Change on Floods of the Ganges, Brahmaputra and Meghna Rivers in Bangladesh. Climatic Change , Vol. 57, No. 3, pp. 287-318.
• Mirza, M. M., Warrick, R. A., Ericksen, N. J., & Kenny, G. J. (2001). Are floods getting worse in the Ganges, Brahmaputra and Meghna basins? Global Environmental Change , Vol. 3, No. 2, pp. 37-48.
• Mirza, M. (1997c). Modeling the Effects of Climate Change on Flooding in Bangladesh. International Global Change Institute (IGCI),University of Waikato, Hamilton, New Zealand.
• Mitchell, J., Karoly, D., Allen, M., Hegerl, G., Zwiers, F., & Marengo, J. (2001). Detection of climate change and attribution of causes. In H. J. al., Climate change 2001: the scientific basis. Contribution of Working Group I to the 3rd Assessment Report
of the Intergovernmental Panel on Climate Change. (pp. 695-738). Cambridge: Cambridge University Press.• MoEF. (2005). National Adaptation Programme of Action (NAPA), Final report. Dhaka: Ministry of Environment and Forest
(MoEF), Government of the People’s Republic of Bangladesh.• Moudud, H. J., Rashid, H. E., & Rahman, A. A. (1988). Executive Summary and Recommendations of the National Workshop
on Bangladesh Coastal Area Resource Development and Management. Dhaka: Coastal Area Resource Development and Management Association(CARDMA).
• Nicholls, R. J. (2004). Coastal Flooding and Wetland Loss in the 21st century: Changes under the SRES Climate and Socioeconomic Scenarios. Global Environmental Change , Vol. 14, pp. 69–86.
• Nishat, A. (2008). Climate Change and Water Security in Bangladesh: Concerns & Options. International Symposium
on Climate Change and Food Security in South Asia . Dhaka: http://www.wmo.ch/pages/prog/wcp/agm/meetings/rsama08/rsama08_present.html.
• Nishat, A. (1989). Greenhouse Effect and Bangladesh: Hydrological Setting and Technical Options. In H. J. Moudud, H. E. Rashid, A. A. Rahman, & M. Hossain, The Greenhouse Effect and Coastal Area of Bangladesh. Dhaka: Bangladesh Centre for Advanced Studies.
• Osman, M. S., Islam, M. R., & KamalUddin, A. M. (2006). Bibliography on Bangladesh Coastal Issues. Dhaka: Government of the People’s Republic of Bangladesh, Ministry of Water Resources, Water Resources Planning Organization (WARPO); http://www.iczmpbangladesh.org/rep/bib.pdf.
• Pittock, A. B. (2005). Climate Change: Turning up the Heat. London, UK and Sterling, VA, USA: Earthscan; and Melbourne, Victoria, Australia: CSIRO Publishing.
• Quadir, D. A., Hussain, M. A., Hossain, M. A., Ferdousi, N., Sarker, M. M., & Rahman, M. M. (2003). Climate Change and its Impacts on Bangladesh Floods Over the Past Decades. Proceedings of SAARC Seminar on Climate Variability in the South
Asian Region and its Impacts. Dhaka: SAARC Meteorological Research Center (SMRC).• Qureshi, A., & Hobbie, D. (1994). Potential Impacts of Climate Change in Bangladesh. In A. D. Bank, Climate Change in
Asia (pp. 10-42 (Chapter 2)). Manila, The Philippines: Asian Development Bank ;http://www.adaptationlearning.net/profiles/country/files/WorldBank_Climate%20change%20impacts%20in%20Bangladesh.pdf.
• Rana, M. Y., & Lambert, M. F. (2000). Generating A Flood Level Probability Map for Bangladesh. Rural and Environmental
Engineering , No. 38, pp. 30-39.• Schneider, S. H., Semenov, S., Patwardhan, A., Burton, I., Magadza, C., Oppenheimer, M., et al. (2007). Assessing key
vulnerabilities and the risk from climate change. In M. L. Parry, O. F. Canziani, J. P. Palutikof, P. J. Linden, & C. E. Hanson, Climate Change 2007: Impacts, Adaptation and Vulnerability -- Contribution of Working Group II to the Fourth Assessment
Report of the Intergovernmental Panel on Climate Change. Cambridge, UK: Cambridge University Press, pp. 779-810 (Chapter 19); available at: http://www.ipcc.ch/pdf/assessment-report/ar4/wg2/ar4-wg2-chapter19.pdf.
• Shahid, S., & Behrawan, H. (2008). Drought risk assessment in the western part of Bangladesh. Natural Hazards , Vol. 46, No. 3 (September), pp. 391-413. .
• Shamsuddoha, M., & Chowdhury, R. K. (2007). Climate Change Impact and Disaster Vulnerabilities in the Coastal Areas of

105Ecosystems for Life • Climate Change Situation Analysis
Bangladesh . (Dhaka: COAST Trust; and Equity and Justice Working Group (EJWG)); available at: http://equitybd.org/newsletter/english/Issue-5/Disaster_BD.pdf. .
• Singh, O. P. (2001). Cause-effect relationships between sea surface temperature, precipitation and sea level along the Bangladesh coast. Theoretical and Applied Climatology , Vol. 68, No. 3/4, pp. 233-242.
• Singh, O. P. (2002). Spatial Variation of Sea Level Trend along the Bangladesh Coast. Marine Geodesy , Vol. 25, pp. 205-212. • Singh, O. P., Khan, T. M., Murty, T. S., & Rahman, M. S. (2001b). Sea Level Changes Along Bangladesh Coast in Relation to the
Southern Oscillation Phenomenon. Marine Geodesy , Vol. 24, No. 1, pp. 65-72.• Solomon, S., D. Qin, M. Manning, R.B. Alley, T. Berntsen, N.L. Bindoff, Z. Chen, A. Chidthaisong, J.M. Gregory, G.C. Hegerl,
M. Heimann, B. Hewitson, B.J. Hoskins, F. Joos, J. Jouzel, V. Kattsov, U. Lohmann, T. Matsuno, M. Molina, N. Nicholls, J. Overpeck, G. Raga, V. Ramaswamy, J. Ren, M. Rusticucci, R. Somerville, T.F. Stocker, P. Whetton, R.A. Wood and D. Wratt, 2007: Technical Summary. In: Climate Change 2007: The Physical Science Basis. Contribution of Working Group I to the Fourth Assessment Report of the Intergovernmental Panel on Climate Change [Solomon, S., D. Qin, M. Manning, Z. Chen, M. Marquis, K.B. Averyt, M. Tignor and H.L. Miller (eds.)]. Cambridge University Press, Cambridge, United Kingdom and New York, NY, USA.
• Tanner TM, Hassan A, Islam KMN, Conway, D, Mechler R, Ahmed AU, and Alam, M, 2007. ORCHID: Piloting Climate Risk
Screening in DFID Bangladesh. Detailed Research Report. Institute of Development Studies, University of Sussex, UK.• Walter, J., & Simms, A. (2002). The End of Development? Global Warming, Disasters and the Great Reversal of Human
Progress. The New Economics Foundation,London;Dhaka: Bangladesh Centre for Advanced Studies (BCAS): The New Economics Foundation, and Dhaka: Bangladesh Centre for Advanced Studies (BCAS);http://www.neweconomics.org/gen/z_sys_publicationdetail.aspx?pid=119.
• Warrick, A., & Ahmad, Q. K. (1996). The Implications of Climate and Sea-Level Change for Bangladesh . Dordrecht and Boston : Kluwer Academic Publishers.
• Warrick, R. A., Bhuiya, A. K., Mitchell, W. M., Murty, T. S., & Rasheed, K. B. (1993). Sea-Level Changes in the Bay of Bengal. Dhaka: Bangladesh Unnayan Parishad, Briefing Document No. 2.
• World Bank. (2000). Bangladesh: Climate Change and Sustainable Development. Report No. 21104 BD. Dhaka: World Bank, South Asia Rural Development Team;http://go.worldbank.org/CW8WDU9WQ0.
• World Bank. (2009). South Asia Region: Towards a Climate Change Strategy. Washington: The World Bank.• WWF (WorldWildlife Fund), 2005: An overview of glaciers, glacier retreat, and subsequent impacts in Nepal, India and
China. WorldWildlife Fund, Nepal Programme, 79 pp.

Climate Change Situation Analysis • Ecosystems for Life106
© IUCN Bangladesh

107Ecosystems for Life • Climate Change Situation Analysis
CLIMATE ChANGE | BANGLAdESh
What will happen when climate change occurs?Nityananda Chakravorty
Bangladesh and India share water, in a way that is unique in the world. Water is a critical source of livelihoods of people in both nations. And now, both countries have also begun to share a phenomenon: climate change, including its impact on this important shared resource. It
is a challenge for both nations to stave off dangerous climate change, and how it could affect the following: food security, water productivity, poverty reduction, environmental security, inland river transportation and biodiversity conservation. Moreover, since countries are welfare societies, depending on each other particularly for water and environmental resources, the time is ripe for joint research from/in each country’s socio-economic context, to develop mutually gainful strategies and so avert risks research has foreseen. This essay is a contribution to precisely such an effort. An important context for this essay is a general consensus that both countries, through increased extremes of higher temperature, aridity, water stress, drought and ocean warming, will experience food insecurity. Available literature on the food security situation in Bangladesh, mainly published by the government, research thinktanks and individuals (see Guide, p 122), certainly provide statistics and ideas to visualise the food security situation vis-à-vis present profiles by region. The point is to try and fathom what’s ahead. Equally, population and development activities will continue to remain major causes of change in vegetative cover in Bangladesh, or for that matter in India. Consequent changes in ecosystems will necessarily affect distribution and productivity of plant and animal species, water supply, fuel materials and other services in general. Most likely, biodiversity losses will be multiplied by climate change. Livelihood protection in ecologically fragile areas will be an imperative for each welfare country. Available literature regarding biodiversity and livelihood protection status and future needs is limited, but preliminary review has provided ideas that can be further reflected upon. Temperature rise is sure to increase the potential habitats for insects or germ-carriers of diseases (disease vectors) such as malaria, dengue, intestinal diseases and other epidemics. There is literature on the existing situation and on measures for protection, but further investigations are required before research issues can be selected.
Climate Change Situation Analysis • Ecosystems for Life108
Coastal zones are vulnerable to sea-level rise. Bangladesh has a 710 km coastline (Sarwar, 2005). Recent devastating cyclones (Sidr and Aila) have marked Bangladesh. Studies are being conducted on further research on socio-economic aspects like capacity building for adaptation and mitigation. Rapid urbanization and population growth have greatly increased water demand. Groundwater resources are already under severe stress and expansion is not possible. Poverty and, further, food shortage due to water shortage, coastal inundation and riverine flooding are highly apprehended. Loss of life from heat stress and vector-borne diseases and potential displacement of littoral population are the unexpected but inevitable scenarios for Bangladesh. Probable impacts of these on different socio-economic groups, particularly women, have been discussed in the literature (see Guide). Further investigation is required to capture the present situation; future research needs have to be identified after thorough reviews. Having created the contexts in which this study can be placed, it must be said that this is not a research work. The objective is to capture existing knowledge and experience around the five themes mentioned above, find source materials and assess levels of study achievements regarding socio-economic variables relevant to each thematic area. Once the baseline situation is fixed, in terms of studies and researches conducted so far, the need for further research can be conjectured on the basis of participatory interactions among the think-tanks in the country. Then the research-gaps can be identified: some new areas for research may come out, some ongoing research may have to be further continued and supported, some fields of research may be restructured after the proposed design. In all this, Interaction with Indian counterparts is a vital component of this exercise. Informed participation in the dialogues is important. The Guide presents existing literature regarding completed research/study activities in Bangladesh around climate change. We hope there are other sources which can enhance our knowledge and information base for identifying further research in the field.
n Understanding the socio-economic context of climate change
Climate change turns the heat up in the atmosphere. Carbon dioxide enters into land/soil and shallow oceans and then is removed into the deep ocean. This process of emission and dissolution of carbon dioxide involves all living beings and things, biotic and abiotic, directly by affecting their productive and reproductive systems in land and water at large. Disasters increase with increased temperature in the atmosphere. A glance at disasters since the 1960s will clarify the rising tendency of weather-induced disasters compared to non-weather induced disasters (see Table 1). This is of course not because of carbon emissions during this or previous decades; it has been a result of cumulative emissions since the beginning of the industrial revolution in Europe. The dangers of the effects of carbon emissions have only surfaced since the 1960s. Global warming has, therefore, touched many countries in the world, seriously affecting those relatively less developed, more dependent on nature for livelihoods and with low capacity to adapt to the new risks of climate change. India and Bangladesh are highly vulnerable with respect to the following potential impacts, from a socio-economic viewpoint (World Bank, 2000; Ahmed, 2006; Tanner et al, 2007):• Duration of heat stress increases due to higher temperature, causing higher mortality rate, health
hazard and vector-borne diseases and greater probability of human migration; • Severe water scarcity during March-April due to significant decline in winter rainfall affects first

109Ecosystems for Life • Climate Change Situation Analysis
Table-1: Weather and non-weather related disasters since 1960, also shown as graph
Indicators 1960-‘69 1970-‘79 1980-‘89 1990-‘99 Ratio 90s/60s
1. Number of weather-related disasters 16.0 29.0 44.0 72.0 4.5
2. Number of non-weather related disasters 11.0 18.0 19.0 17.0 1.5
3. Economic losses (US$ billion) 50.8 74.5 118.4 399.0 7.9
4. Insured losses (US$ billion) 6.7 70.8 21.6 91.9 13.6
Source: Annual World Disaster Report, Red Cross and Red Crescent Societies
Weather-related disasters
Non-weather related disasters
Economic Losses
Insured Losses
kharif crops and contribute to furthering food poverty;• Wheat and rice crop production also decreases due to more intensive droughts over a larger area,
aggravating food poverty;• More intense floods due to more rainfall intensity in the eastern Himalayan flood plains, its
tributaries and the delta region damages crops, houses, livestock, physical infrastructures and other public and private properties, causing loss of economic resources and sources of employment and income of the poor. In terms of extreme events, 1-in-100 year floods in the last century may well be replaced by 1-in-25 year floods during this century, or increase in frequency;
• Increased temperature and ocean warming cause sea level rise, resulting in coastal flooding and salinity intrusion in conjunction with frequent and more severe tropical cyclones along the Bay of Bengal. In extreme events of tropical cyclones, the projected decrease in central pressure and increased wind speed jointly add to increase the surge height. Additional stress also occurs from wind-driven waves and river flooding. This further aggravates if rainfall rate increases. If sea level rise is positive, the havoc will be extremely fatal.
Thus, the following socio-economic variables are likely to be affected negatively by the incidence of climate change:
• Food security;• Health and nutrition;• Drinking water and sanitation;
1960-69 1970-79 1980-89 1990-99Decades
Num
ber o
f Dis
aste
rs
Loss
es (B
illio
ns)
80
70
60
50
40
30
20
10
0
450
400
350
300
250
200
150
100
50
0

Climate Change Situation Analysis • Ecosystems for Life110
• Gender; • Human settlements in the coast and erosion-prone riverbanks;• Employment and income of the poor;• Housing and other physical infrastructures;• Nation’s economic resources: land and water;• Agriculture, forest, livestock and fisheries; and• Culture and heritage. The magnitude of the impacts on the variables are important to know. Studies on rates of change in natural and human systems in this century and beyond are essential, in particular with respect to rapid changes occurring beyond threshold warming.1 It will be convenient to synthesize them at a point when elements of commonality among the impact variables would justify synthesizing. The primary socioeconomic questions for climate change research are, therefore, the following: • What are the visualized changes and how quickly can the communities adapt and change in
response?• What changes in behaviour (kind and degree) will be required for adaptation?• Will people respond to theoretical projections without their past experience?• How can a society be facilitated for expected adaptive changes in traditional natural systems? In sum, the case of climate change in Bangladesh is not just ‘life-style threatening’, it is rather ‘life-threatening’. Welfare of people in the face of increasing climate disasters is, therefore, the priority national objective while ongoing economic development of the nation is a necessity.
n Sector-wise research issues
We will now discuss the socioeconomic variables one by one to understand the meaning and relevance with respect to Bangladesh and to elicit the research issues.
Food securityFood security with respect to climate change has been the topmost priority issue for Bangladesh. In its total meaning, food security implies (1) availability of good food on demand at all places in the country; (2) access to available food for all, meaning food purchasing power of all; (3) good food including all food types (not only cereals) for a healthy society; and (4) food including animal feed, seed and wastes for a sustained society. Bangladesh has, at present, a net cultivable area of 8.4 million ha of land, with roughly a 1% reduction per annum due to change in land use (Government of the People’s Republic of Bangladesh, 2010). Research and modern methods of crop cultivation are being pursued to cope with demand from an ever-increasing population. But increasing natural disasters like floods, droughts, excessive rainfall, drainage congestions, and so on, are impeding even such high production, causing it to fall short of what is needed. Exogenous factors are: food price inflation and low income of the poor, keeping them below purchasing power. The major determinant of food security in Bangladesh is the security of rice production in the basins of the three major river systems—the Ganga-Padma, the Brahmaputra-Jamuna and the Meghna—and in the estuary. The land area available for production of food and fibre in the three river basins totals about 5.45 million ha,2 belong to F0, F1, F2 and F3 elevations3 and is: (1) Ganga-Padma: 1.75 million ha; (2) Brahmaputra-Jamuna : 2.28 million ha ; and (3) Meghna: 1.42 million ha (Brichieri-Colombi & Bradnock, 2003). The elevation of these areas being low to medium, any overland flood or prolonged drought or low flow in the perennial rivers or coastal inundation due

111Ecosystems for Life • Climate Change Situation Analysis
to sea level rise damage or totally destroy the standing crops in the kharif season. Although saline-tolerant varieties of rice and low water-consuming varieties of crops are being invented in the realms of agricultural research, the outputs are certainly less strong than the galloping morsels of climate change impacts. Present area under rice cultivation (aus, aman and boro) is around 10.5 million ha, producing 30.7 million tonnes in 2007-08.4 Under the yield gap minimisation programme, the target production is 36.81 million tonnes5 by 2021. Since climate change has already marked its footprint a number of times in Bangladesh, the research issues emanating from experience here are:• Selection of suitable crops and development of those crop production models under minimum
water requirement conditions in view of growing water stresses;• Coastal ecosystems are affected due to coral bleaching or more toxic impacts. More river flows
can reduce or eliminate those impacts. Water technology can be devised for coastal ecosystems protection for both the countries;
• Ecological role of inland fisheries as a breeding ground for numerous forms of actually and potentially profitable aquatic life enhances their economic value. Research can be conducted to ascertain the economic value of such aquatic life and measures to enhance inland fisheries;
• Technology for water conservation can be found out to protect food crops by optimizing international water courses for the medium and long term;
• Employment and income from agriculture/food production, processing, storing, marketing, and so on, have to be enhanced with growth of population. Crop failure or damage as a result of climate change has to be avoided. Measures to protect the employment and income of the poor (particularly of women), keeping their access to food unaffected, have to be devised for the food sector as a response to climate change;
• Research may be conducted to devise particular high-value crops in appropriate districts according to suitability in respective AEZs;
• Irrigation efficiency, particularly in the surface water sector, has been low in both countries. Joint research can be conducted to enhance the efficiency from present 30% to 60% and successful institutional experiences in integrated management of irrigation water can be jointly demonstrated;
• Effects on food production (cereal and non-cereal) have to be ascertained through study using a linked system of climate scenarios (e.g. developed by SRES or by the researchers on more practical grounds), agricultural models, national, regional and global economic models. Adaptation at the farm level, for example, changes in crop calendar, fertilizer doses, irrigation schedule, and at the regional level through new cultivars and irrigation systems has to be seen from practical perspectives in terms of capacity at farm level and technology available on a sustainable basis. Required economic adjustments like national or regional investment in agriculture, crop switching and price responses may be included in model.
Model results may show gains of adaptations against scenarios like A2, B1, B2. Optimistic results may show stability in aggregate global production but differences in regional crop production, leading to significant polarisation of effects, with exorbitant rise in food price and risk of hunger among the poor economies. In that context Bangladesh has the possibility of the majority of the population getting worse off.
• Care needs to be taken that models are built on real world situations about increased CO2 concentrations. Its effects on pests and diseases, positive or negative, have to be simulated with a number of climate models before signalling to policy bodies.

Climate Change Situation Analysis • Ecosystems for Life112
Health and nutritionA country of 144 million people with an age composition of 25% children, 23% adolescents, 47% middle-aged and 5% old (Mukherjee, Choudhury, Khan, & Islam, 2011) needs a multiple dietary combination. The dietary energy composition for Bangladeshis as of today shows around 82.5% of the total food energy comes from major carbohydrate sources, followed by 10% from protein, 5% from fat, 2% from minerals and only 1% from fibrous food (FAO, 2005).6 WHO has proposed there must be 55-65% of carbohydrate, 10-20% protein, 15-25% of fat and 5% of mineral sources to maintain a balance between different energy compositions (ibid). In this regard, it can be clearly affirmed Bangladeshis, irrespective of various skewed income groups, have been suffering from malnutrition due to an absence of balanced dietary intake: carbohydrate intake is excessive. For Bangladesh, income is a major driver of the changing patterns of nutritional intake. The calorific demand varies 2,041 to 2,492 for low- to high-income groups (Bangladesh Bureau of Statistics, BBS, 2004). Actually the majority of low-income people engage in agriculture or hard manual labor for their living, which results in a higher energy requirement and hence consumption of more foodgrain. The consumption of non-grain crops and animal products are increasing for the mid- and upper-income groups. With increasing income and urbanization, people are switching to superior non-cereal items. To address this ‘hidden hunger’ of the low-income groups, production of more vegetables, fruits, pulses, fish, dairy products, poultry and other proteins has to be enhanced and demonstrated in practice, along with ensuring access of the majority to such food. Health services facilities are targeted to increase up to the Union level in strategic plans. Even so, Climate change has a face of human disease. It accelerates the expansion of the range of vector-borne diseases. While quarantine, eradication, control, medication and repellants may be potential adaptation measures, Bangladesh has limitations in applying these in the backdrop of high population pressure, low per capita income and low resource endowment in the economy. Research is required to look for appropriate repellants to evade costly and socially unviable measures.
Drinking water and sanitationThere is a promise the drinking water and sanitation situation will improve. Be that as it may, freshwater plays the pivotal role in ensuring healthy food and health and sanitation. These three again involve a whole host of roles to upkeep the biotic and abiotic environment which, in turn, influences human health and nutrition. The major roles are as follows:• Water for food production (irrigation); • Water for drinking (surface and ground); • Water for sanitation (bathing, washing, cleansing);• Water for human environment;• Water for animal environment;• Water for plants, herbs, vegetation;• Water for fish and other aquatic life;• Water for industries;• Water for natural environment;• Water for recreation and non-use; and• Water for the river itself. Climate change affects all these roles, because the water cycle itself changes, so changing food production patterns, and the quantity and quality of food.

113Ecosystems for Life • Climate Change Situation Analysis
Gender implicationsProduction of non-grain crops and animal products has gender implications because these require women’s involvement at different stages of production, harvesting, processing, transporting, storing and marketing. The following gender issues have to be incorporated into the research parameters:• Fruits, vegetables, spices, flowers and livestock require water. But no structured water delivery or
irrigation system has been developed in this region for these high-value crops and products. Women have to manage water for these productive sub-sectors, in most cases. Homestead and kitchen gardens occupy a great deal of area for these activities, except for very large-scale enterprises. Even in large-scale ones, women play a great role. The issue here is that water management sharing by women in case of climate-change-induced water stress for non-grain and animal products has to be factored while estimating costs and benefits of adaptation or mitigation activities;
• Adaptation options for water stress due to climate change have to integrate women’s vulnerabilities in the models, particularly with respect to water management against groundwater poisoning and drying up of flowing water sources. National statistics show except for the north-central region, the other 5 hydrological regions resort to 80-98% dependence on tube-well water, which invariably implies about 100% women’s involvement (see Table 2). Climate change stress would further deteriorate the condition of women; and
• Climate change disasters cause migration or dissolution of family units. Women sell their own jewellery or movable properties to mitigate the family’s instant wants, so losing their ‘fall-back’ option. Finally, most of them constitute ‘female-headed households’. These issues deserve in-depth studies for ensuring gender equity.
Human settlementsChange in water regime due to less flow is directly related to human settlements and economic activities. Historically, all civilizations grew around a steady and flowing water source. Even in this hi-tech world, water plays a central role in environmentally sustainable production. So, socially and economically, water has the attractive or repulsive force to invite or expel population with adequacy
Table 2: Salinity situation in coastal districts under three hydrological regions, 1973 and 2000
Name of the Region
Name of the greater district
Salt affectedareas (’000 ha)
S12.0-4.0 ds/m
S24.1-8.0 ds/m
S38.1-16.0 ds/m
S4> 16 ds/m
1973 2000 1973 2000 1973 2000 1973 2000 1973 2000
South West
Khulna, Jessore
345.74 444.4 28.7 109.4 255.2 124.2 49.1 162.4 20.7 48.4
South Central
Faridpur, Barisal, Patuakhali
289.30 372.4 192.8 140.9 86.5 121.5 0.0 110.0 0.0 0.0
South East
Noakhali 77.90 78.4 18.8 24.2 53.4 27.3 5.7 19.1 0.0 7.7
Note: ha: hectare; ds/m: Source: SRDI

Climate Change Situation Analysis • Ecosystems for Life114
or scarcity of freshwater, respectively. Depletion of water in river-courses will push people out of employment and income wherever water is the key input to the productive system. Migration takes place accordingly, creating various kinds of social trauma and economic crises. Bangladesh has a flow of migration due to urbanization, repeated cyclonic storms along the coast and riverbank erosion, but it will experience more migration due to water shortage in water-stressed areas if water gets scarce. Erosion has particular significance in migration of households. At least 400 households migrate due to erosion annually (Centre for Environmental and Geographic Information Services, CEGIS, 2010). Erosion depends on flood discharge. It causes human migration and increased poverty, including creation of female-headed households. Appropriate flood management system can be devised through joint research which can, in turn, reduce the probability of erosion and resulting increased poverty.
Employment and income of the poorIn Bangladesh, over 7 million holdings belong to those involved in agricultural labour (Government of the People’s Republic of Bangladesh, 2010). This means the livelihood of 25% of all holdings in the country depends on agricultural activities. Coincidentally, 25% of Bangladeshi households are below the lower poverty line.7 Most of these poor belong to agricultural labour households in rural areas. Employment and income of these people will be shattered if climate change reduces cropped areas or damages crops or reduces yields and production at any scale. Worse will be the case if additional government spending for mitigation of climate change effects leads government to withdraw support to farmers in terms of subsidies or price support. These issues deserve further analysis and research to devise adaptation strategies to protect and enhance economic gains of farmers through ensuring employment and income. Construction of regional, national and local production functions under climate change scenarios (based on the IPCC’s Special Report on Emission Scenarios) and simulating them with various income and employment possibilities would be the objective of such research. Ensuring employment and income to the poor remains the root of broad-based growth and food security. Technology has to be devised to merit the needs of the poor and the disadvantaged sections of the community who can be employed.
Housing The relevance of housing technology to climate change impacts is a proven fact. Floods, storm surges and cyclones, droughts and other heat impacts have been guiding housing technology from time immemorial. The technology has been gradually improving all over. In Bangladesh, houses along the 710 km long coastal belt (Sarwar, 2005) have found structural changes a number of times. Recent changes in cyclone shelters have occurred; even private houses in settlement areas in the coastal chars are equipped with economical reinforcements capable of withstanding average hits of cyclone surges. This kind of adaptation at the household level needs support from project sources, for these modifications are costlier than normal housing expenses. Government houses also are being designed to withstand such surges, however, with reasonably higher costs. As for roads, communications and other infrastructure, technology is similarly changing, gradually at higher and higher costs. Besides the coastal area, housing and other infrastructure are also experiencing incremental adaptations, not so spectacular as in the coast. Extra protection against wave action during flood, indigenous cooling devices for protection from heat inside the house, replacement of thatched wall by CI sheets, and so on, are the known adaptations. But the proportion of climate change impact is much more than that of day-to-day weather

115Ecosystems for Life • Climate Change Situation Analysis
changes at snail’s pace. Bangladesh is experiencing devastating floods with much longer durations, cyclonic surges with much more height and pressure than before and heat waves of longer duration and greater intensity. Incremental improvement as such will not cover the risks. Research on technology for improving house and other infrastructure construction is, therefore, vital to make them economically viable and environmentally sustainable. Experiences in Bangladesh can be shared with Indian experiences and mutually gainful innovations can be accomplished. Saving the livestock population during storm surges along the coast, saving wonderful paddy harvests from total damage in haor areas or saving harvested paddy from floods around there by building special kind of earthen mounts and improvising the settlements in climate change risky areas may be examples of such innovative research issues. Besides these, environmentally sustainable building materials and their designs may be invented to improve house and infrastructure construction, rendering them reasonably safe from climate change extreme events.
Land-based ecosystemsLand-based ecosystems are subject to impact by climate change. Biodiversity loss, fire risks, weed invasion and salinisation are the visualized impacts of climate change on terrestrial ecosystems. Although fire risks are unknown yet in Bangladesh, continuous dry weather may in future bring about the risk. Advance preventive measures may be devised through research. Appropriate landscape management, eco-corridors and weed control management will be necessary to avert risks due to climate change. The risk of losing some parcel of a ‘natural’ ecosystems (biodiversity loss) cannot, however, be expected to be avoided, but research may come out with devices for minimisation of such risks. Salinisation of land due to intrusion of salinity from the Bay or due to human interventions (like extended shrimp farming in agricultural lands) has been increasing in the coastal areas. Innovative technology is required to do away with such effects, at least to arrest salinity levels up to plant tolerance limits. Besides this, joint validation of data for ecosystems (Bangladesh and India) is felt to be very important for both terrestrial and aquatic ecosystem planning and management.
Aquatic ecosystemsSalinisation of coastal aquifers and wetlands, low river flows and eutrophication are, at the very least, apprehended climate change impacts on aquatic ecosystems. Salinity ingress has long been a known parasite in Bangladesh, particularly in the southwest region. In a normal hydrological cycle, rivers suffer from low-flow conditions in the absence of rainfall run-off. This situation accelerates reduction of fresh water flows for irrigation, livestock, people and the environment. During low-flow condition in March and early April, salinity penetrates further inland for lack of adequate flushing. A good
The impacts of climate change will be felt across sectors: Land-based and aquatic ecosystems; human health and habitation. It will affect income and livelihoods, and have gender implications. That is why the response must not only be sector-specific, but also co-ordinated across sectors, across the GBM region

Climate Change Situation Analysis • Ecosystems for Life116
number of earlier studies (Ahmed et al., 1998; Ahmed, 2006; World Bank, 2000) has identified this danger, for the southwest region in particular. The World Heritage and Ramsar site, the Sundarbans, will be heavily affected by saline ingress. The Sundarbans has actually been affected due to reduced flows through the Ganga river system over the last few decades, particularly during dry season. This has affected different species of plants and animals, including the widely-known phenomenon named top-dying of the Sundari trees. If sea level rises up to 32 cm, additional 10-20 parts per thousand salinity will increase in the Sundarbans (Mohal et al., 2006). Salt intrusion will render the ecosystem irreversible and, therefore, out of adaptation possibilities. Biodiversity protection through reduction of salinity in the coastal aquifers and wetlands and enhancement of river flows are the important research issues here. Besides this, navigation is dependent on river flows and depth. Joint research with India can find economic means to revive the river routes for carrying bulk commodities favourable for both countries. This will have extensive employment and income implications for the poor of both countries.
AgricultureIncreased flood, drought, spread of pests and diseases, increased soil erosion and so on are the possible impacts of climate change on agriculture. Bangladesh has adaptation strategy built into its agriculture policy but seasonal forecasts, market planning, niche crops, land management, plant breeding, dynamic farm practices and suchlike activities take time and resources as adaptation mechanisms. Sustainability of such mechanisms is also not beyond question. The farming community in Bangladesh is already dynamic enough to catch up with changed climatic conditions and researchers are apt enough to respond to changes, as such, by introducing risk-tolerant varieties in agriculture. But climate change thresholds are not known and farmers’ multiple vulnerabilities to abrupt changes in climatic conditions work as impediments to those strengths. Agro-biodiversity protection and improvement strategies and action plan preparation are welcome research issues here. Crop modelling, simulating IPCC models with minimum water requirement are also viable components under Indo-Bangladesh joint research program. Technological innovation against reduced winter chill for fruiting and flowering and increased pests and plant diseases shall also be an interesting field of joint research.
ForestsForest resources have been denuded due to many interventions, such as logging, mining (including natural gas exploration), roads, other infrastructure, agricultural clearing and excessive vegetation removal. Logging and agricultural clearing constitute the two main reasons for deforestation in Bangladesh or, for that matter, in Asia at large. Forests provide various goods and services for the humans, including livelihoods for the poor. As for goods, forests provide firewood and food (tubers, flowers, seeds and gums), medicines (herbs and leaves) and fodder for the poor and pulpwood, fibres and flosses, resins, lac, tendu and other leaves, bamboo and canes for people in general. Forests also provide services like conservation of soil, protection and regulation of water flows, amelioration of climate, absorption of dust and noise, maintenance of a pool of genetic resources, habitat for wildlife, recreation resorts, aesthetic aroma of the environment and maintenance of balance of carbon dioxide. Bangladesh has the Sundarbans mangrove forest, covering about 4,110 sq km, in the southwest
117Ecosystems for Life • Climate Change Situation Analysis
region of the country (Siddiqui, 2006). This is a global heritage site, threatened by various externalities like top-dying syndrome, felling of trees, over-salinity, loss of ecological balance. Joint research on sustainability of the forest through developing economic models may be considered assuming various scenarios (as in the SRES) with high, medium and low salinity levels.
n Identifying research issues
In the light of the analysis above, twelve sectors have been selected where socioeconomic issues have emerged that deserve in-depth studies and research. The sectors are closely related with water, land and the environment at large. It should be noted that the fields suggested are neither exhaustive nor finalized. It is only after getting feedback from the stakeholders that the fields will be further rationalized. Biodiversity issues have not been discussed in detail separately. While analyzing land, coastal and aquatic ecosystems the biodiversity issues have been highlighted as necessary elements and fields of research identified. Adaptation information given in the matrix is not exhaustive. Ideas are thrown from stories of line departments for different sectors. This column has enough potential for elaboration, but the status of adaptation as provided against each sector gives the impression that these are not enough.The sector-wise socioeconomic impacts, adaptation practice and identified fields of research are presented in the matrix that starts on p 120.
Nityananda Chakravorty, Economist (Environment, Water and Climate Change) and Individual Consultant, Asian Development Bank/Government of Bangladesh, Dhaka, Bangladesh.

Climate Change Situation Analysis • Ecosystems for Life118
Matrix: Sector-wise issues/impacts, ongoing adaptation and identified fields of joint research
Climate change-related sectors
Socio-economic Issues/Impacts Adaptations being practiced
1. Hydrology and water resources
More frequent extreme flood/drought/water stress/salinity intrusion in surface or aquifers, making many people homeless, starving and poorer
• Coastal embankments are being re-sectioned and strengthened • Inland river embankments are being re-sectioned and strengthened• Building more improved early warning systems for flood, drought, riverbank erosions
2. Land-based ecosystems
Biodiversity loss/fire risks/weed invasion/salinization leading to loss of access of the poor to many natural bounties in land ecosystems
Conservation sites are being managed in forest and wetlands.
3. Aquatic ecosystems Salinisation of coastal aquifers and wetland/low river flows/eutrophication leading to loss of access of the poor to many natural bounties in aquatic ecosystems
Conservation of aquatic ecosystems
4. Coastal ecosystems Coral bleaching/more toxic impacts (extinction of mangrove forest) leading to loss of biodiversities and loss of livelihoods of littoral population
Mangrove ecosystems is exposed to climate change impacts
5. Agriculture Increased flood/ drought/spread of pests and diseases/increased soil erosion/ over doses of CO2 leading to food poverty for the poor
Technology is being devised for varieties to adapt to climate change situations
6. Horticulture Reduced winter chill for fruiting or flowering/increased pests and diseases leading to loss to the farmers and consequent higher price of those crops beyond poor man’s access
Crop diversification programmes are being implemented
7. Fisheries Changes in recruitment/nutrient supplies leading to loss of occupation for fishermen and loss of livelihoods
Culture fisheries is being practiced in place of open water fisheries due to drying up of river water, canals, beels and haors

119Ecosystems for Life • Climate Change Situation Analysis
Identified fields of joint research
• Improved management of wetland for community use, fishery production and conservation purposes• Exploration of all forms of water storage (surface and ground) to provide insurance against drought and climate change • Soil improvement through conservation; agricultural practices to improve water holding capacity and to sequester carbon• Development of drought-tolerant crop varieties• Improved IWRM models including gender vulnerability factors in water management • Research on genetic and ecosystems biodiversity to define thresholds, present situation and measures to protect biodiversity loss• Finding out socio-economically critical ecosystems data jointly
• Research on genetic and ecosystems biodiversity to define thresholds, present situation and measures to protect biodiversity loss• Finding out socio-economically critical ecosystems data jointly
Social and economic aspects of conservation technology and legal provisions are to be devised
• Selection of suitable crops and development of those Crop production models under minimum water requirement conditions• research on agro-biodiversity conservation for protection of livelihoods of rural population and access of poor to common property resources in khas floodplainsHorticulture crop models to be built for high value crops under climate change variability scenarios
The proposed research hypothesis: The ecological role of inland fisheries as a breeding ground for numerous forms of actually and potentially profitable aquatic life enhances their economic value

Climate Change Situation Analysis • Ecosystems for Life120
Climate change-related sectors
Socio-economic Issues/Impacts Adaptations being practiced
8. Migration, Settlements and Industry
Increased extreme event risks and hazards/migration/death, malnutrition/water pollution leading to livelihood crisis and unemployment
9. Tourism Increased heat index/decreased migration of season birds/loss of coastal wetlands leading to extinction of variety of habitats, biotic communities and ecological processes; loss of income from tourism
Eco-tourism projects are being planned and implemented under public and private initiatives
10. Insurance Increased exposure to natural hazards
11. Human health and gender
Increase of vector-borne diseases, epidemics, death, illness, malnutrition, injury, habitat alteration, water quality deterioration, aggravation of air pollution, all leading to health hazard, inequity and gender disparities
Health services are being improved under public and private enterprises while gender action plans are being prepared and implemented in sector development projects
12. Inland navigation Drying up of river routes/increase in bulk transport costs/loss of employment in navigation leading to unfavorable transport economies for the trading community and loss of livelihoods of river-dependent people

121Ecosystems for Life • Climate Change Situation Analysis
Identified fields of joint research
Techniques and data for characterising settlements; exploring best practice in sustainable settlements under climate change conditions. Drivers of settlement: • Mapping migration and settlement patterns; understanding the influences on settlement and migration• Industrial ecology lifecycle analysis • Developing environmental market• Innovative housing and other infrastructures development for settlements and economic activities in floodplains, haors and coastal fringe areas Research on possibilities of developing joint tourism industries by taking measures to protect genetic, species and ecosystems biodiversity
Research on economic risks of climate change-exposed capital development in both the countries and likely scenarios of insurance coverage• Innovative research is required to look for appropriate repellants to evade the costly and socially unviable measures against vector-borne diseases in the backdrop of high population pressure, low per capita income and low resource endowment in the economy• Adaptation options for water stress due to climate change, integrating women vulnerabilities in the models, particularly with respect to water management against groundwater poisoning and drying up of flowing water sources from health perspectives
Research on identification of medium rivers (or, marginal rivers) in both the countries for reviving river routes for commercial transportation for livelihood protection of river-dependent communities and cultural activities

Climate Change Situation Analysis • Ecosystems for Life122
Guide: Research themes regarding climate change
Publication reference Key Personnel
Ahmad, Qazi Kholiquzzaman; R. A. Warrick; Neil J. Ericksen; and M. Q. Mirza (1994) The Implications of Climate Change for Bangladesh: A Synthesis (Dhaka: Bangladesh Unnayan Parishad, Briefing Document No. 7); also published in: Richard A. Warrick and Q. K. Ahmad (eds.) The Implications of Climate and Sea-Level Change for Bangladesh (Dordrecht, The Netherlands: Kluwer Academic Publishers), pp. 1-34.
Dr. Qazi Kholiquzzaman Ahmad
Alam, Sarfaraz (2003) “Environmentally Induced Migration from Bangladesh to India”, Strategic Analysis, Vol. 27, No. 3 (Jul-Sep); revised paper available at: http://www.idsa.in/publications/strategic-analysis/2003/jul/Sarfaraz.pdf.
Sarfaraz Alam
Barnett, Jon and W. Neil Adger (2007) “Climate Change, Human Security and Violent Conflict”, Political Geography, Vol. 26, No. 6 (August), pp. 639-655.
Jon Barnett
Brouwer, Roy; Sonia Akter; Luke Brander; and Enamul Haque (2007) “Socio-economic vulnerability and adaptation to environmental risk: A case study of climate change and flooding in Bangladesh”, Risk Analysis - An International Journal, Vol. 27, No. 2, pp. 313-326.
Prof. Dr. R. Brouwer
Byravan, Sujatha and Sudhir Chella Rajan (2008) “The Social Impacts of Climate Change in South Asia”; available at website of Social Science Research Network (SSRN).
Sujatha Byravan
Cannon, Terry (2002) “Gender and Climate Hazards in Bangladesh”, Gender and Development, Vol. 10, No. 2 (July), pp. 45-50; also published in: Rachel Masika (ed.) Gender, Development, and Climate Change (Oxford: Oxfam Publishing), pp. 45-50.
Terry Cannon

123Ecosystems for Life • Climate Change Situation Analysis
Address Sector BCCSAP Theme BCCSAP Programmee
ChairmanBangladesh Unnayan Parishad (BUP)House # 50, Road # 8, Block-D, Niketon,Gulshan-1, Dhaka - 1212, BangladeshPhone : +880 2 8853958-60; 8853962Fax: +880 2 8850036Dhaka-1205, BangladeshE-mails: [email protected] site: http://www.bup-bd.org
Socio-Economic Research and Knowledge Management
Climate change impact and adaptation for different sectors
Researcher, Institute for Defence Studies and Analyses, The Institute for Defence Studies and Analyses1, Development Enclave, (near USI)Rao Tula Ram MargNew Delhi 110 010, IndiaPhone: +91-11-2671 7983 (30 lines)Fax: +91-11-2615 4191E-mail: [email protected]
Socio-Economic Research and Knowledge Management
Monitoring of internal and external migration
Associate Professor, Melbourne School of Land and Environment Department of Resource Management & Geography Office 2.35, 221 Bouverie StreetTel. (+61 3) or (03) 8344 0819Fax (+61 3) or (03) 9349 4218E-mail [email protected]
Socio-Economic Food Security, Social Protection and Health
Livelihood protection in ecologically fragile areas; and
Acting Head, Department of Environmental Economics, Institute for Environmental Studies (IVM), VU University Amsterdam.Telephone:+31 20 59 85608E-mail:[email protected]
Socio-Economic Research and Knowledge Management
Climate change impact and adaptation for different sectors
Senior Fellow, Centre for Development Finance, Institute for Financial Management & Research (IFMR), ChennaiEmail: [email protected]
Socio-Economic Research and Knowledge Management
Monitoring of internal and external migration
Department of Sociology, Criminology and Cultural Studies, University of Greenwich, Greenwich, London.Email: [email protected] Tel: 020 8331 8944
Socio-Economic Capacity Building and Institutional Strengthening
Strengthening gender consideration in climate change

Climate Change Situation Analysis • Ecosystems for Life124
Publication reference Key Personnel
Choudhury, A. M.; S. Neelormi; D. A. Quadir; S. Mallick; and A. U. Ahmed (2005) “Socio-Economic and Physical Perspectives of Water Related Vulnerability to Climate Change: Results of Field Study in Bangladesh”, Science and Culture, Vol. 71, No. 7/8, pp. 225-238.
S. Neelormi
Chowdhury, Ehsan Hafiz and Atiq Kainan Ahmed (2005) Strengthening Disaster Risk Management in the Agricultural Sector in Bangladesh -- Study on Physical and Environmental Context, Institutional Analysis and Vulnerable Group Profiling in Selected Project Pilot Areas in the NW of Bangladesh (Dhaka: Center for Environmental and Geographic Information Services (CEGIS));available at: http://www.fao.org/sd/dim_pe4/docs/pe4_051201_n.pdf.
Ehsan Hafiz Chowdhury
Chowdhury, Naved Ahmed (2008) Climate Change, Vulnerability and Livelihood Possibilities and Prospect of the Charlands of Bangladesh (Dhaka: Unnayan Onneshan); available at: http://www.unnayan.org/env.unit/paper4.pdf.
Naved Ahmed Chowdhury
Chowdhury, Naved Ahmed (2008) Men, Women and the Environment Gender Issues in Climate Change (Dhaka: Unnayan Onneshan); available at: http://www.unnayan.org/env.unit/paper5.pdf.
Naved Ahmed Chowdhury
Chowhan, Gopal; Shyamal Kanti Barman; SAFE Development Group; with support from the RVCC Team (2005) The Reducing Vulnerability to Climate Change (RVCC) Project: Reflecting on Lessons Learned (Dhaka: CARE Bangladesh (March); available at: http://www.carebd.org/RVCC%20EoP%20Lessons%20Learned-Strategic-Final.pdf.
Gopal Chowhan
Christian Aid (2007) Human Tide: The Real Migration Crisis (London: Christian Aid, May); available at: http://www.christian-aid.org.uk/Images/human_tide3__tcm15-23335.pdf.
Christian Aid
Dasgupta, Susmita; Benoit Laplante; Craig Meisner; David Wheeler; and Jianping Yan (2007) “The Impact of Sea Level Rise on Developing Countries: A Comparative Analysis”, World Bank Policy Research Working Paper, No. 4136 (February).
Susmita Dasgupta

125Ecosystems for Life • Climate Change Situation Analysis
Address Sector BCCSAP Theme BCCSAP Programmee
Associate Professor, Department of Economics, Jahangirnagar University, Savar, Dhaka.Email: [email protected]
Socio-Economic Research and Knowledge Management
Climate change impact and adaptation for different sectors
Director, DatabaseIT DivisionCenter for Environmental and Geographic Information Services (CEGIS)House 6, Road 23/C, Gulshan 1,Dhaka 1212Phone: 8821570-1, 8817648-52Fax: 8855935, 8823128
Socio-Economic Research and Knowledge Management
Vulnerability assessment
Unnayan OnneshanHouse 40/A, Road 10/A,Dhanomondi, Dhaka,Bangladesh
Socio-Economic Food Security, Social Protection and Health
Livelihood protection in ecologically fragile areas; and
Unnayan Onneshan House 40/A, Road 10/A, Dhanomondi, Dhaka,Bangladesh
Socio-Economic Food Security, Social Protection and Health
Livelihood protection of vulnerable socioeconomic groups, including women.
Gopal ChowhanExecutive Director, Sustainable Agriculture and Farming Enterprise (SAFE) Development GroupDhaka, Bangladesh
Socio-Economic Food Security, Social Protection and Health
Livelihood protection in ecologically fragile areas; and
Socio-Economic Research and Knowledge Management
Monitoring of internal and external migration
Lead Environmental EconomistLocation: Washington, District of Columbia (United States)Homepage: http://econ.worldbank.org/researchEmail: [email protected]: 1818 H Street, N.W., Washington, DC 20433Email: [email protected]
Socio-Economic Research and Knowledge Management
Preparatory studies for adaptation against rising sea levels,

Climate Change Situation Analysis • Ecosystems for Life126
Publication reference Key Personnel
Ericksen, N. J.; Qazi Kholiquzzaman Ahmad; and A. R. Chowdhury (1993) Socio-Economic Implications of Climate Change for Bangladesh (Dhaka: Bangladesh Unnayan Parishad, Briefing Document No. 4); available at: http://www.waikato.ac.nz/igci/downloads/BriefingDoc4.pdf; also published in: Richard A. Warrick and Qazi Kholiquzzaman Ahmad (eds.) The Implications of Climate and Sea-Level Change for Bangladesh (Dordrecht and Boston: Kluwer Academic Publishers, 1996), pp. 205-287 (Chapter 5).
Prof. Neil Ericksen
Gaan, Narottam (2005) “Environmental scarcity, migration and future sea level rise in Bangladesh: security implications on India”, Asian Profile, Vol. 33, No. 6 (December), pp. 617-630.
Narottam Gaan
Gunter, Bernhard G.; Atiq Rahman; and A. F. M. Ataur Rahman (2008) How Vulnerable are Bangladesh’s Indigenous People to Climate Change?, Falls Church, VA, USA: Bangladesh Development Research Center (BDRC), Bangladesh Development Research Working Paper Series, No. 1 (April); available at: http://www.bangladeshstudies.org/files/WPS_no1-rev.pdf.
Gunter, Bernhard G.
Hadi, Abdullahel (2001) “International Migration and the Change of Women’s Position among the Left-Behind in Rural Bangladesh”, International Journal of Population Geography, Vol. 7, No. 1, pp. 53-62
Abdullahel Hadi
Hossain, M. (1989) “The Greenhouse Effect and the Coastal Area of Bangladesh: Its People and Economy”, in: H. J. Moudud, H. E. Rashid, A. A. Rahman, and M. Hossain (eds.) The Greenhouse Effect and Coastal Area of Bangladesh. Proceedings of an International Conference held in Dhaka, Bangladesh, 5th March 1989 (Dhaka, Bangladesh Centre for Advanced Studies)
M. Hossain
Huq, M. (1989) “Environmentally Sound Measures for Countering “Greenhouse Effect” in Bangladesh and their Cost-Effectiveness”, in: H. J. Moudud, H. E. Rashid, A. A. Rahman, and M. Hossain (eds.) The Greenhouse Effect and Coastal Area of Bangladesh. Proceedings of an International Conference held in Dhaka, Bangladesh, 5th March 1989 (Dhaka, Bangladesh Centre for Advanced Studies).
Mainul Haq

127Ecosystems for Life • Climate Change Situation Analysis
Address Sector BCCSAP Theme BCCSAP Programmee
Research Associate International Global Change Institute University of Waikato Private Bag 3105 Hamilton, New Zealand Email: [email protected] Web address: http://www.waikato.ac.nz/igci/ Phone: +64 (07) 8585628 Fax: +64 (07) 8585689
Socio-Economic Research and Knowledge Management
Climate change impact and adaptation for different sectors
Reader Political ScienceM.S. College, Baramba, CuttackOrissa, [email protected]@email.com
Socio-Economic Research and Knowledge Management
Monitoring of internal and external migration
2508 Fowler StreetFalls Church, VA 22046-2012United States of America, Tel.: (+1) 703-532-4893E-Mail: [email protected]: http://www.bangladeshstudies.org
Socio-Economic Food Security, Social Protection and Health
Livelihood protection of vulnerable socioeconomic groups, including women.
75 Mohakhali, Dhaka, BangladeshEmail: [email protected]
Socio-Economic Research and Knowledge Management
Monitoring of internal and external migration
Bangladesh Centre for Advanced Studies, Phone: (880-2) 8851237, 8852217, 8851986 Fax: (880-2) 8851417 Web: www.bcas.net Email: [email protected]
Socio-Economic Research and Knowledge Management
Macroeconomic and sector economic impacts of climate change.
Bangladesh Centre for Advanced Studies, Phone: (880-2) 8851237, 8852217, 8851986Fax: (880-2) 8851417 Web: www.bcas.netEmail: [email protected]
Socio-Economic Research and Knowledge Management
Economics of adaptation and mitigation

Climate Change Situation Analysis • Ecosystems for Life128
Publication reference Key Personnel
Hutton, David and C. Emdad Haque (2004) “Human Vulnerability, Dislocation and Resettlement: Adaptation Processes of River-Bank Erosion-Induced Displacees in Bangladesh”, Disasters, Vol. 28, No. 1, (March) pp. 41-62
David Hutton
Karim, Zahurul (1995) “Agricultural Vulnerability and Poverty Alleviation in Bangladesh”, in: T. E. Downing (ed.) Climate Change and World Food Security (Berlin, Heidelberg: Springer-Verlag (NATO ASI Series, 137)), pp. 307-346
Zahurul Karim
Khan, Mizan R. (2006) “Micro Insurance as an Instrument of Adaptation to Climate Change Impact”, in: Atiur Rahman and Mahboob Hassan (eds.) People’s Report 2004-2005: Bangladesh Environment (Dhaka: Unnayan Shamannay), pp. 305-312
Mizan Rahman Khan
Lu, Xianfu (2007) “Climate Change Impacts, Vulnerability and Adaptation in Asia and the Pacific”, Background note for the Training Workshop on Environmental Finance and GEF Portfolio Management 22-25 May 2007, Amari Watergate, Hotel, Bangkok, Thailand; available at: http://ncsp.va¬network.org/UserFiles/File/PDFs/Resource%20Center/Asia/BackgroundPaper.pdf Thailand; available at: http://ncsp.va-network.org/UserFiles/File/PDFs/Resource%20Center/Asia/BackgroundPaper.pdf
Xianfu Lu
McGranahan, Gordon; Deborah Balk; and Bridget Anderson (2007) “The rising tide: assessing the risks of climate change and human settlements in low elevation coastal zones” Environment & Urbanization, Vol. 19, No. 1, pp. 17-37
Gordon McGranahan
Moench, Marcus and Ajaya Dixit (eds.) (2004) Adaptive capacity and livelihood resilience: adaptive strategies for responding to floods and droughts in South Asia--Identifying factors which enable South Asian communities to adapt to floods, droughts and climatic variability (Boulder and Kathmandu: Institute for Social and Environmental Transition)
Marcus Moench

129Ecosystems for Life • Climate Change Situation Analysis
Address Sector BCCSAP Theme BCCSAP Programmee
National Resources Institute, University of Manitoba, 70 Dysart Road, Winnipeg, Manitoba, Canada R3T 2N2. E-mail : [email protected]
Socio-Economic Research and Knowledge Management
Monitoring of internal and external migration
Apt # 4-D, House # 74, Silicon GardenRoad No.11/A, Dhanmondi R/ADhaka-1205, Bangladesh.Telephone: (Home) 8802-8130875, (Cell) 880 173 040583E-mail: [email protected]; [email protected]
Socio-Economic Research and Knowledge Management
Vulnerability assessment
Professor, Professor, the Chair of the Department of Environmental Science and Management, North South University, Email:[email protected], Phone(Office):8852000 ext. 2051, Phone(Home): 8110690, Mobile: 01713038306, North South University, Bangladesh
Socio-Economic Research and Knowledge Management
Economics of adaptation and mitigation
Technical Advisor: Climate Change Adaptation (NCSP)UNDP, Tel: (1-917) 378-7316, Fax: (1-212) 906-6998
Socio-Economic Research and Knowledge Management
Economics of adaptation and mitigation
IIED, 3 Endsleigh Street, London WC1H 0DD, UK Email: [email protected]
Socio-Economic Research and Knowledge Management
Vulnerability assessment
Director, ISET Boulder, Colorado Email: [email protected]
Socio-Economic Food Security, Social Protection and Health
Livelihood protection in ecologically fragile areas; and

Climate Change Situation Analysis • Ecosystems for Life130
Publication reference Key Personnel
Nasreen, Mahbuba (2008) Impact of Climate Change on Food Security in Bangladesh: Gender and Disaster Perspectives; Presentation made at the International Symposium on Climate Change and Food Security in South Asia (Dhaka, August 25-29); available at: http://www.wmo.ch/pages/prog/wcp/agm/meetings/rsama08/rsama08_present.html.
Mahbuba Nasreen
Nicholls, Robert J.; N. Mimura; and J. C. Topping (1995) “Climate Change in South and South-East Asia: Some Implications for Coastal Areas”, Journal of Global Environmental Engineering, Vol. 1, pp. 137-154.
Robert J. Nicholls
Paul, Bimal Kanti (2005) “Evidence against disaster-induced migration: the 2004 tornado in north-central Bangladesh”, Disasters, Vol. 29, No. 4, pp. 370-385.
Bimal Kanti Paul
Pouliotte Jennifer; Nazrul Islam; Barry Smit; and Shafiqul Islam (2006) “Livelihoods in rural Bangladesh”, Tiempo, Issue 59 (April), pp. 18-22; available at: http://www.cru.uea.ac.uk/tiempo/portal/archive/pdf/tiempo59low.pdf.
Jennifer Pouliotte
Rahman, Atiq; Nick Robins; and Annie Roncerel (eds.) (1993) Exploding the Population Myth – Consumption versus Population: Which is the Climate Bomb? (Brussels, Dhaka, Roma, and Santiago: Climate Network Europe (CNE), Bangladesh Centre for Advanced Studies (BCAS)/ Climate Action Network South Asia (CANSA), Lega per l’Ambiente, and Centre for Technology (TEKHNE)).
Dr. Atik Rahman
Rajan, Sudhir Chella (2008) Climate Migrants in South Asia: Estimates and Solutions - A Report by Greenpeace, Bangalore, India: Greeenpeace India (March); available at: http://www.greenpeace.org/raw/content/india/blue-alert-report.pdf.
Sudhir Chella Rajan
Reid, Hannah and Andrew Simms with Victoria Johnson (2007) Up in Smoke? Asia and the Pacific (London: new economics foundation (nef) and International Institute for Environment and Development (IIED), November); available at: http://www.iied.org/pubs/pdfs/10020IIED.pdf.
Hannah Reid

131Ecosystems for Life • Climate Change Situation Analysis
Address Sector BCCSAP Theme BCCSAP Programmee
Professor of Sociology, University of Dhaka Email: [email protected]
Socio-Economic Food Security, Social Protection and Health
Livelihood protection of vulnerable socioeconomic groups, including women.
Flood Hazard Research Centre, Middlesex University, Enfield, London EN3 4SF, United KingdomTel: 44-20-8362-5569 Fax: 44-20-8362-6957Email: [email protected]
Socio-Economic Research and Knowledge Management
Climate change impact and adaptation for different sectors
Department of Geography Kansas State University, US E-mail: [email protected]
Socio-Economic Research and Knowledge Management
Monitoring of internal and external migration
Department of Geography, University of Guelph, Guelph, Ontario, N2G 2W1 Canada Email: [email protected]
Socio-Economic Food Security, Social Protection and Health
Livelihood protection of vulnerable socioeconomic groups, including women.
Executive Director, Bangladesh Centre for Advanced Studies (BCAS); Gulshan-1, Dhaka, BangladeshPhone: (880-2) 8851237, 8852217, 8851986Fax: (880-2) 8851417 Web: www.bcas.netEmail: [email protected]
Socio-Economic Research and Knowledge Management
Climate change impact and adaptation for different sectors
DoHSS, 331C HSB, IIT Madras, Chennai - 600 036 Phone: +91 (44) 2257 4525
Socio-Economic Research and Knowledge Management
Monitoring of internal and external migration
Senior Researcher, Climate Change GroupTel:+44 (0) 20 7388 2117Fax:+44 (0) 20 7388 2826Email:[email protected]
Socio-Economic Research and Knowledge Management
Climate change impact and adaptation for different sectors

Climate Change Situation Analysis • Ecosystems for Life132
Publication reference Key Personnel
Satterthwaite, David; Saleemul Huq; Mark Pelling; Hannah Reid; and Patricia Romero Lankao (2007) “Adapting to Climate Change in Urban Areas - The possibilities and constraints in low- and middle-income nations” (London, UK: International Institute for Environment and Development (IIED), Human Settlements Discussion Paper Series, Theme: Climate Change and Cities-1); available at: http://www.iied.org/pubs/pdfs/10549IIED.pdf.
David Satterthwaite
Schaerer, Claudia and Ahsan Uddin Ahmed (2004) “Adaptation to Climate Change in Vulnerable Communities: Lessons from Practice in Southwestern Bangladesh”, in: Ahsan Uddin Ahmed and N. Haque (eds.) Adaptation to Climate Change Knowledge Sharing for Capacity Building [Workshop Proceedings held in COP-9 at Milan (December, 10, 2003)] (Dhaka: Climate Action Network South Asia (CANSA)).
Claudia Schaerer
Schubert, Renate; Hans Joachim Schellnhuber; Nina Buchmann; Astrid Epiney; Rainer Grießhammer; Margareta Kulessa; Dirk Messner; Stefan Rahmstorf; and Jürgen Schmid (2008) Climate Change as a Security Risk (London, UK and Sterling, VA, USA: Earthscan Publications); 20-page Summary available at: http://www.wbgu.de/wbgu_jg2007_kurz_engl.pdf
Renate Schubert
Smith, Dan and Janani Vivekananda (2007) A Climate of Conflict: The Links between Climate Change, Peace and War (London, UK: International Alert, November); available at: http://www.waterwiki.net/images/6/6b/International_Alert.pdf.
Dan Smith
Sperling, Frank (ed.) (2003) Poverty and Climate Change: Reducing the Vulnerability of the Poor through Adaptation, (Abidjan, Cote d’Ivoire; Manila, The Philippines, et al.: African Development Bank (AfDB), Asian Development Bank (AsDB), the United Kingdom’s Department for International Development (DFID), The Netherlands, European Community, Germany, Organization for Economic Co-Operation and Development (OECD), United Nations Development Program (UNDP) United Nations Environment Program (UNEP) and the World Bank; available at: http://povertymap.net/publications/doc/PovertyAndClimateChange_WorldBank.pdf.
Frank Sperling

133Ecosystems for Life • Climate Change Situation Analysis
Address Sector BCCSAP Theme BCCSAP Programmee
Senior Fellow, Human Settlements GroupTel:+44 (0) 20 7388 2117Fax:+44 (0) 20 7388 2826Email:[email protected]
Socio-Economic Research and Knowledge Management
Climate change impact and adaptation for different sectors
Ms. Claudia Schaerer Project Coordinator Reducing Vulnerability to Climate Change (RVCC) Project, CARE Bangladesh, PO Box-31, Khulna-9000 Email: [email protected]
Socio-Economic Food Security, Social Protection and Health
Livelihood protection of vulnerable socioeconomic groups, including women.
Prof. Dr. Renate SchubertInstitute for Environmental Decisions (IED), WEH G 11Weinbergstrasse 358092 Zürich, SWITZERLANDPhone: +41 44 632 47 17Fax: +41 44 632 10 42
Socio-Economic Research and Knowledge Management
Climate change impact and adaptation for different sectors
Socio-Economic Food Security, Social Protection and Health
Livelihood protection of vulnerable socioeconomic groups, including women.
Frank Sperling, VARG Secretariat, Email: [email protected]
Socio-Economic Food Security, Social Protection and Health
Livelihood protection of vulnerable socioeconomic groups, including women.

Climate Change Situation Analysis • Ecosystems for Life134
Publication reference Key Personnel
Stern, Nicholas (2007) The Economics of Climate Change: The Stern Review (Cambridge, UK: Cambridge University Press); pre-publication version available at: http://62.164.176.164/6520.htm.
Nicholas Stern
Streatfield, Peter Kim and Zunaid Ahsan Karar (2008) “Population Challenges for Bangladesh in the Coming Decades”, Journal of Health, Population and Nutrition, Vol. 26, No. 3 (September), pp. 261¬272; available at: http://www.icddrb.org/images/jhpn263-Population_Challenges_for_Bangladesh_.pdf.
Peter Kim Streatfield
Tänzler, Dennis; Alexander Carius; and Sebastian Oberthür (2002) “Climate Change and Conflict Prevention”, (Berlin: Adelphi Research; Report on behalf of the German Federal Ministry for the Environment, Nature Conservation and Nuclear Safety); available at: http://www.adelphi-research.de/projektberichte/ClimateSide.pdf.
Dennis Tänzler
United Nations Development Programme (2007) Human Development Report 2007/2008 -Fighting climate change: Human solidarity in a divided world (Basingstoke, UK and New York, NY, USA: Palgrave Macmillan); available at: http://hdr.undp.org/en/reports/global/hdr2007-2008/.
Mr. Aminul Islam
Wahhab, Md. Abdul (1998) “Climate Change Mitigation in Asia and Financing Mechanisms (contributions from Bangladesh)”, in: P. R. Shulka and Pramod Deo (eds.) Climate Change Mitigation in Asia and Financing Mechanisms, Proceedings of a Regional Conference, Goa, India, 4-6 May 1998 (Roskilde, Denmark: UNEP Collaborating Center on Energy and Environment, Riso National Laboratory, December), pp. I.19-I.26; available at: http://www.uneprisoe.org/EconomicsGHG/Conferences/goapart1.pdf.
Md. Abdul Wahhab

135Ecosystems for Life • Climate Change Situation Analysis
Address Sector BCCSAP Theme BCCSAP Programmee
Professor Nicholas SternIG Patel Chair and Director, LSE Asia Research Centre; EOPP Associate Tel: +44 (0)20 7955 7871Fax: +44 (0)20 7955 6951 Email: [email protected] , R536
Socio-Economic Research and Knowledge Management
Economics of adaptation and mitigation
Dr Peter Kim StreatfieldHead, Health & Demographic Surveillance, HDSU68 Shahid Tajuddin Ahmed Sarani Mohakhali (GPO Box 128, Dhaka 1000), Dhaka 1212 Bangladesh Email: [email protected]
Socio-Economic Research and Knowledge Management
Climate change impact and adaptation for different sectors
Sr. Project ManagerAdelphiCasper Theyss Strasse 14a 14193 BerlinTel: +49 (0)30-8900068-20Fax: +49 (0)30-8900068-10Email: [email protected]
Socio-Economic Research and Knowledge Management
Monitoring of internal and external migration
UN Offices, 18th Floor, IDB Bhaban, Agargaon, Sher-e-Bangla Nagar, Dhaka 1207, BangladeshPhone: +880-2 8118600 Ext 2409Fax: +880-2 8113196Email: [email protected]
Socio-Economic Food Security, Social Protection and Health
Livelihood protection of vulnerable socioeconomic groups, including women.
Department of Environment and Forest, Government of Bangladesh, Chittagong Division, Chittagong
Socio-Economic Research and Knowledge Management
Economics of adaptation and mitigation

Climate Change Situation Analysis • Ecosystems for Life136
Endnotes:1 Currently Bangladesh’s position is to keep the temperature increase below 20C in the global climate negotiations.2 This area represents 75% of net cultivable area (7.3 million ha) in 6 of 8 hydrological regions. 3 F0, F1, F2, F3 and F4 type of land classification corresponding to the depth of inundation of 0-30 cm, 30-90 cm, 90- 120
cm, 120-360 cm and greater than 360 cm.4 Outline Perspective Plan of Bangladesh, 2010 – 2021, Planning Commission, GoB, Dhaka, p-48.5 Ibid. Population growth assumed to reduce to 1.2% per annum and income elasticity of demand for rice is assumed to
reduce from 0.31 to 0.2.6 Source: FAO, 2005. FAOSTAT database.7 According to the Poverty Reduction Strategy Paper (PRSP) for Bangladesh, the food poverty line is estimated by costing
a fixed-bundle of food items corresponding to the age-sex adjusted normative calorie requirement of 2,122 kcal per day per person.
Reference:• Ahmed, A. U. (2006). Bangladesh: Climate Change Impacts and Vulnerability - A Synthesis. Dhaka: Dhaka: GoB, MoEF,
Department of Environment, Climate Change Cell; http://www.climatechangecell-bd.org/publications/06ccimpactvulnerability.pdf.
• Ahmed, A. U., Huq, S., Karim, Z., Asaduzzaman, M., Rahman, A. A., Alam, M., et al. (1996). Vulnerability and Adaptation Assessments for Bangladesh. In J. B. Smith, S. Huq, S. Lenhart, L. J. Mata, I. Nemesova, & S. Toure, Vulnerability and
Adaptation to Climate Change: Interim Results from the US Country Studies Program. Dordrecht: Dordrecht, The Netherlands: Kluwer Academic Publishers.
• Bangladesh Bureau of Statistics (BBS). (2005). Household Income and Expenditure Survey. Dhaka: Statistics Division, Ministry of Planning.
• Bangladesh Bureau of Statistics. (2008). Statistical Yearbook of Bangladesh. Dhaka: Statistics Division, Ministry of Planning.
• Brichieri-Colombi, S., and Bradnock, R. (2003). Geopolitics, water and development in South Asia: cooperative development in the Ganges-Brahmaputra delta. The Geographical Journal , Vol. 169, pp.43-64.
• Centre for Environmental and Geographic Information Services (CEGIS). (2010). Erosion and Livelihood Study. Dhaka: United Nations Development Programme (UNDP).
• Government of the People’s Republic of Bangladesh. (2010). Ensuring Food Security through increased Agricultural
Production with Efficient Water Resource Management. Dhaka: Ministry of Agriculture, Ministry of Food & Disaster Management, Ministry of Water Resources and Ministry of Fisheries and Livestock.
• Mukherjee, N., Choudhury, G. A., Khan, M. F., & Islam, A. K. (2011). Implication of Changing consumption Pattern on Food Sesurity’, 3rd International Conference on Water & Flood Management (ICWFM-2011). Dhaka: IWFM, BUET.
• Sarwar, M. G. (2005). Impacts of Sea Level Rise on the Coastal Zone of Bangladesh (Masters Thesis). Lund University, Sweden: Lund University International Masters Programme in Environmental Science.
• Siddiqui, N. A. (2006). Banglapedia. See: http://www.banglapedia.org/httpdocs/HT/S_0602.HTM• Tanner, T., Hassan, A., Islam, K., Conway, D., Mechler, R., Ahmed, A., et al. (2007). ORCHID: Piloting Climate Risk Screening
in DFID Bangladesh (Detailed Research Report). UK: Institute of Development Studies, University of Sussex.• WARPO. (2004). National Water Resources Management Plan (NWMP). Dhaka: Ministry of Water Resources.• World Bank. (2000). Bangladesh: Climate Change and Sustainable Development. Report No. 21104 BD. Dhaka: World Bank,
South Asia Rural Development Team;http://go.worldbank.org/CW8WDU9WQ0.• World Food Programme. (n.d.). Agricultural Production & National Food Balance . See: http://foodsecurityatlas.org/bgd/
country/availability/agricultural-production

137Ecosystems for Life • Climate Change Situation Analysis

Climate Change Situation Analysis • Ecosystems for Life138

139Ecosystems for Life • Climate Change Situation Analysis
ECOSYSTEMS FOR LIFE: A BANGLADESH-INDIA INITIATIVEDistinguished members of the Project Advisory Committee (PAC)
Bangladesh• Dr Qazi Kholiquzzaman Ahmad, Chairman, Palli Karma-Sahayak Foundation (PKSF), Dhaka• Mr C M Shafi Sami, Former Adviser to the Caretaker Government, Bangladesh• Dr Mahabub Hossain, Executive Director, BRAC, Dhaka• Professor AAMS Arefin Siddique, Vice Chancellor, Dhaka University, Dhaka• Advocate Sultana Kamal, Executive Director, Ain-o-Salish Kendra, Dhaka• Dr M A Quassem, Chairman, National Disaster Management Advisory Committee, Dhaka• Dr Atiq Rahman, Executive Director, Bangladesh Centre for Advanced Studies (BCAS), Dhaka• Professor M Monowar Hossain, Executive Director, Institute of Water Modelling, Dhaka• Professor K B Sajjadur Rasheed, Former Professor, Department of Geography, Dhaka UniversityIndia• Mr Ashok Jaitly, Distinguished Fellow and Director, Water Resources Division, The Energy
Research Institute (TERI), New Delhi• Ms Meena Gupta, Former Secretary, Ministry of Environment and Forests, Government of India• Mr M Gopalakrishnan, Secretary General, International Commission on Irrigation and Drainage
(ICID), New Delhi• Prof Jayanta Bandhopadhya, Professor and Head, Centre for Development and Environment
Policy, Indian Institute of Management, Calcutta• Prof A K Gosain, Professor of Civil Engineering, Indian Institute of Technology, New Delhi• Mr Shiv Shankar Mukherjee, Former Ambassador of India• Mr P R Sinha, Director, Wildife Institute of India (Dehradun), Member Secretary, IUCN National
Committee & IUCN Member, India• Mr Homi R Khusrokhan, Vice President, Bombay Natural History Society (BNHS), Mumbai
and Former Managing Director, Tata ChemicalsEx-Officio Members• Ms. Aban Marker Kabraji, Regional Director, IUCN Asia and Co-Chair PAC• Dr T. P. Singh, Deputy Regional Director Programme, IUCN Asia and Permanent Member, PAC• Mr. Ganesh Pangare, Head, Asia Water Programme, IUCN Asia and Permanent Member, PAC• Mr. Ishtiaq Uddin Ahmed, Country Representative IUCN Bangladesh and Permanent Member, PAC• Ms. Meenakshi Datta Ghosh, Country Representative, IUCN India and Permanent Member, PAC• Mr. Frank van der Valk, Project Director, Ecosystems for Life and Member Secretary, PAC• Ms. Bushra Nishat, Project Manager (Bangladesh), Ecosystems for Life and Member Secretary, NAC• Mr. Kazimuddin Ahmed - Project Manager (India), Ecosystems for Life and Member Secretary, NAC
IUCN Project Team• Mr. Ganesh Pangare, Head, Asia Water Programme, IUCN Asia • Mr. Frank van der Valk, Project Director, Ecosystems for Life• Ms. Bushra Nishat, Project Manager (Bangladesh), Ecosystems for Life• Mr. Kazimuddin Ahmed - Project Manager (India), Ecosystems for Life• Mr. Mohammad Shahad Mahabub Chowdhury – Dialogue Coordinator (Bangladesh),
Ecosystems for Life• Ms. Sushmita Mandal – Dialogue Coordinator (India), Ecosystems for Life• Mr. AJM Zobaidur Rahman Soeb – Communications Officer, Ecosystems for Life• Mr. Md. Emran Hasan – GIS Associate (Bangladesh), Ecosystems for Life

DIALOGUE FOR SUSTAINABLE MANAGEMENT OF TRANS-BOUNDARY WATER REGIMES IN SOUTH ASIA
Situation Analysis on
INTERNATIONAL UNIONFOR CONSERVATION OF NATURE
Asia Regional Office63 Sukhumvit Soi 39Bangkok 10110, ThailandTel: +66 2 662 4029Fax: +66 2 662 4389www.iucn.org/asia
Bangladesh Country OfficeHouse 16, Road 2/3, BananiDhaka 1213, BangladeshTel: +8802 9890423Fax: +8802 9892854www.iucn.org/bangladesh
India Country Office2nd Floor, 20 Anand Lok, AugustKranti Marg, New Delhi 110049, IndiaTel/Fax: +91 11 4605 2583www.iucn.org/india
Climate Change