Embed Size (px)
Citation preview

International Journal of Multimedia and Ubiquitous Engineering
Vol.10, No.6 (2015), pp.311-328
http://dx.doi.org/10.14257/ijmue.2015.10.6.30
ISSN: 1975-0080 IJMUE
Copyright ⓒ 2015 SERSC
Site Specific Soil Fertility Ranking and Seasonal Paddy Variety
Selection: An Intuitionistic Fuzzy Rough Set and Fuzzy Bayesian
Based Decision Model
K. Lavanya,
M. A. Saleem Durai and N. Ch. S. N. Iyengar
School of computing science and engineering,
VIT University, Vellore, Tamilnadu, India, [email protected],[email protected],[email protected].
Abstract
In decision making, crisp ranking is not possible when the entire attribute
characteristics and their degree of importance are known precisely. In real world
situations decision making takes place in an environment where the goals, the constraints,
and the consequences of possible actions are not known precisely. Thus the best condition
for classic decision making problem may not be satisfied when the situation involves both
fuzzy and crisp data. Site specific soil fertility and seasonal crop selection data are
characterized by high degree of fuzziness and uncertainty. In our model, intuitionistic
fuzzy rough set establishes a close connection between the concepts of similarity and
dissimilarity thereby providing an excellent framework for ranking soil fertility. Further
fuzzy Bayesian incorporates both fuzzy and uncertainty in the probability model yielding
more realistic seasonal paddy variety selection. The decision model introduced in this
paper is suitable for both data rich and data poor environment. The results illustrate that
the soil fertility ranking and successive paddy variety selection can help to sustain the soil
fertility in subsequent rotations and minimize the loss of nutrients from the sites.
Keywords: Fuzzy Bayesian, Uncertainty, Similarity, Dissimilarity, Ranking, Crop
selection
1. Introduction
India has the largest paddy output in the world and is also the second largest exporter
of rice in the world. Soil is the natural and vital resource for growing food, fiber and
firewood to meet human needs. Declining soil fertility is a major constraint on crop
production in the semi-arid highlands of Tamilnadu, India. One of the major constraints
for crop production faced by smallholder farmers is the inadequate supply of nutrients
[15]. Farmers either entirely discard the conventional practice of using natural fertilizer to
reinstate soil fertility, or unable to put down land uncultivated for long enough for it to be
effective. Reviewing the past, most research concentrated on trials to decide the suitable
amount, type of fertilizer for best yields in specific soil types and agro-ecological
locations. Here we concentrate in the civilizing farmer’s knowledge and their experience
as an essential element to build local systems of knowledge related to specific locations
and understanding the local conditions of production. Then the identified soil samples are
ranked based on intuitionistic fuzzy proximity relation and rough sets according to their
fertility and potential productivity. Fuzzy theory provides a tool to describe the
characteristics of a too complex or ill-defined system to admit precise mathematical
analysis. Each element of the universe of discourse is indicated by the degree of
belongingness to a set in the range [0-1]. The degree of non-belongingness is just
automatically the complement to 1 of the membership degree. But, in real time there is
chance of hesitation. Atanassov [1] introduced the concept of intuitionistic fuzzy set

International Journal of Multimedia and Ubiquitous Engineering
Vol.10, No.6 (2015)
312 Copyright ⓒ 2015 SERSC
which is a natural generalization of fuzzy set, useful in modeling many real life situations.
Each intuitionistic fuzzy number is interpreted as an ensemble of fuzzy numbers. This
enables to define a fuzzy rank and characteristic vagueness factor for each intuitionistic
fuzzy number. We presented intuitionistic fuzzy sets as a tool for reasoning in the
presence of imperfect facts and imprecise knowledge. Diverse paddy varieties have
unique needs for nutrients, light, water, temperature and air [21]. When either of these
basic needs is not met, the crop will be stressed and will not grow properly. Selecting crop
varieties is therefore a very important exercise that a farmer needs to undertake. Classical
Bayesian method characterizes future state prediction as probability events. But the crop
selection (fuzzy) data are vague, uncertain and ambiguous. The fusion of fuzzy sets with
Bayesian enables to combine uncertainty handling with approximate reasoning. This
enhances the representative component of Bayes inference using the knowledge inherent
in fuzzy logic, leading to better robustness, noise immunity, and applicability in
uncertain/imprecise contexts.
The structure of paper is organized as follows: Section 2 and 3 highlights the
background study. Proposed System is presented in Section 4 and evaluation of the
proposed system is discussed in Section 5.
2. Related Works
In this section, the various literature studies related to decision models for uncertain
and vague information are reviewed. De Cock et al., [3] represented linguistic hedges (eg
cool, warm) as fuzzy rough approximations using mutual similarity relations in the
domain of discourse. H.Garg et al., [4] presented a hybridized technique named as particle
swarm optimization based vague cut set for determining the membership and non-
membership function of fuzzy system reliability. To remove uncertainty the system uses
ordinary arithmetic operations instead of fuzzy arithmetic operation and particle swarm
optimization to construct membership functions. A.Zeng et al., [5] used principal
component analysis based quantitative index to measure the relative importance of
different conditions constructed by all condition attributes that strengthens the attribute
and their value reductions for maintaining the decision table's discernibility relations.
Z.S.Xu et al.,[7] developed the concepts of intuitionistic fuzzy weighted geometric
operator, intuitionistic fuzzy ordered weighted geometric operator, and intuitionistic fuzzy
hybrid geometric operator to accommodate the environment in which the given
arguments are intuitionistic fuzzy sets characterized by a membership function and a non-
membership function. M.Kucukvar et al., [9] proposed a fuzzy multi-criteria decision
making method for ranking the life cycle sustainability performance of different pavement
alternatives constructed with hot-mix and warm-mix asphalt mixtures. It was tested in
several life cycle phases such as raw material extraction and processing, manufacturing
and end-of-life. Cesar et al., [10] presented an approach to predict compressor
performance using Bayesian networks and a hybrid Fuzzy–Bayesian network. The
proposed Fuzzy–Bayesian network structure achieved a significant time reduction to one
third of the complete test time on average, in the refrigerating capacity evaluation.
Liessman Sturlaugson et al.,[12] illustrated Bayesian networks (BNs) as a common data-
driven approach for representing and reasoning in the presence of uncertainty. Bayesian is
used as an intractable decider when the complexity of network increases with much
number of nodes and states. N.Cagman et al.,[13] demonstrated fuzzy soft aggregation
operator for constructing more efficient decision making method. The crisp parameter sets
were approximated by fuzzy subsets of universe and the attribute with largest membership
grade was represented as the decision value. According to Jiang Y et al., [14] the
adjustable approach to fuzzy soft sets leads to dynamic decision making. The designed
approach is specific to intuitionistic fuzzy soft by using level soft sets of intuitionistic
fuzzy soft sets. Kukuvar et al.,[16] utilized intuitionistic fuzzy entropy method to identify

International Journal of Multimedia and Ubiquitous Engineering
Vol.10, No.6 (2015)
Copyright ⓒ 2015 SERSC 313
the importance of phases and criteria, intuitionistic fuzzy weighted geometric averaging
operator to establish a sub-decision making matrix based on weights of attribute, and
intuitionistic fuzzy weighted arithmetic averaging operator to build a super decision
matrix depending on weights of different life cycle phases. Chu et al.,[17] aimed to
develop a method for solving pattern recognition problems under the Atanassov's
intuitionistic fuzzy sets based on similarity measures. . In addition for the convenience of
computing and ranking processes, a computer interface decision support system was also
developed to help decision maker make diagnoses more efficiently. Shu-Ping et al.,[18]
concentrated in multi attribute decision making problems whose uncertain attributes are
expressed using triangular intuitionistic fuzzy numbers. It used the ratio of the possibility
mean to the possibility standard deviation to solve possibility mean and variance of
triangular intuitionistic fuzzy numbers. Polat.S et al.,[20] considered a priority ranking
system for contaminated sites in which vagueness in parameter values are considered. It
aims to evaluate potential human health risks due to contamination using sufficiently
comprehensive and readily available parameters in describing the fate and transport of
contaminants in air, soil, and groundwater. The Vagueness in these parameter values were
solved by means of fuzzy set theory. Mueller et al.,[21] elaborated studies of soil structure
importance and its preservation methods for overall soil quality assessment. According to
their results soils with clay contents > 30% ie., unfavorable soil structure could not be
reliably recognized for evaluation of visual soil structure. C.J. Pilbeam et al.,[22] used
triangulated data to determine the existing practices for soil fertility management, the
extent of such practices, and the perception of the direction of changes in soil fertility.
The survey results showed that the two principal farmer practices for retaining soil
fertility are the application of farmyard manure (FYM) and of chemical fertilizer (mainly
urea and di ammonium phosphate).W.S. Lee et al., [24] made a comparative study of
diverse types of sensors and instruments such as field-based electronic sensors, spectro
radiometers, machine vision, airborne multispectral and hyperspectral remote sensing,
satellite imagery, thermal imaging, RFID, and machine olfaction system. It also presented
a review of these sensing technologies and discusses how they are used for precision
agriculture and crop management, especially for specialty crops. From the related works it
is evident that the imprecise and vague nature of information in decision making have
large impact in aspects such as accuracy, reliability and time consumption.
3. Background Study
3.1 Information Table
Given (U, A) be an information system where U be the finite non empty set (universe)
of objects and A is non-empty finite set of attributes (features, variables).For every a ε A,
Va is the set of values attribute ‘a’ may take, called domain of attribute A. In addition
every attribute a ε A defines an information function, Da : U→V.
Table1. Coded Information Table
U a1 a2 D
x1 large 200 Excellent
x2 large 100 Excellent
x3 large 250 Excellent
x4 medium 200 Average
x5 medium 200 Average
x6 medium 100 Excellent
x7 medium 100 Bad
x8 medium 100 Bad
x9 small 200 Average

International Journal of Multimedia and Ubiquitous Engineering
Vol.10, No.6 (2015)
314 Copyright ⓒ 2015 SERSC
x10 small 250 Average
In Table 1,U={x1,x2,x3,x4,x5,x6…………x10};A={a1,a2,d}.The domains of attributes are
V1 (for a1) = {large, medium};V2 (for a2) = {100,200,250};V3(for d) = {excellent, average,
bad}
3.2 Ordered Information Table
An information table does not consider any semantic relationships between distinct
values of a particular attribute. By incorporating semantics information, we may obtain
various generalizations of information tables. Ordered information tables may be viewed
as information Tables with added semantics [1].
An ordered information table is a pair:
OIT= {IT, af / a ε A}
Where IT is information table and af is weak order on Va. An ordering of values of a
particular attribute naturally induces ordering of objects namely Va1 af Va2 If and If
only f (Va1) af f (Va2)
An object xi is ranked ahead of object xj if and only if the value of xi on the attribute a
is ranked ahead of the value of xj on the attribute a .Suppose for the information Table 1,
the ordering can be defined as follows
1af : large 1af : medium
1af : small
2af : 250
2af : 200 2af : 100
df : excellent df : average df : bad
3.3 Inutionistic Fuzzy Sets
In Fuzzy set theory, the membership of every element to a fuzzy set is a single value
between [0-1] .But in real cases there may be some hesitation cases. The concept of
Intuitionist fuzzy gives the possibility to model unknown information with an additional
degree. An intuitionistic fuzzy set is an object having the following form
A= {( µA(a) , (a)A , αA(a) ) / a ε A }
Where µA(a), (a)A , αA(a) represent membership, non-membership and intermediate
degree of a in A respectively with the condition
0 ≤ µA(a)+ (a)A +αA(a) ≤ 1 , for all a ε A
µA(a) → [0, 1], a ε A→ µA(a) ε [0, 1]
(a)A → [0,1] , a ε A→ (a)A ε [0,1]
αA(a) → [0,1] , a ε A→ αA(a) ε [0,1]
3.4 Intuitionistic Fuzzy Proximity Relation
The concept of intuitionistic fuzzy proximity relation finds the attribute values that are
(α,β) identical before introducing the feature ranking(α=similarity; β=dissimilarity) [8].
This is because feature extraction is not possible when the information gain of each
attribute is not known. In discernibility matrix of Table 1 if value of α= 1, β =0, then the
relation reduces to indiscernibility relation
3.5 Rough Set
Rough set is a formal approximation of a crisp set (i.e., conventional set) in terms of a
pair of sets which give the lower and the upper approximation of the original set [2]. It
analyzes attributes with real values and categorizes them into intervals.

International Journal of Multimedia and Ubiquitous Engineering
Vol.10, No.6 (2015)
Copyright ⓒ 2015 SERSC 315
3.6 Indiscernibility Relation
Two objects xi , xj are said to be indiscernible by their set of attributes a where a ε A, if
a(xi)=a(xj) i.e., every element in the subset a must be equal. It is generally represented as
Ind(A)
3.7 Lower and Upper Approximations
For data analysis rough set approach defines two basic concepts namely the lower and
the upper approximations of a set. The lower approximation of the set X is a set of
objects xi, belonging to the elementary sets contained in X (of space R). The upper
approximation is the union of elementary sets with a non empty intersection to X.
{ / : }RX Y U R Y X
{ / : }RX Y U R Y X
The R–boundary of X, ( )RBN X is given by ( )RBN X RX RX . We say X is rough
with respect to R if and only if RX RX , equivalently ( )RBN . X is said to be R –
definable if and only if RX RX or ( )RBN X . So, a set is rough with respect to R if
and only if it is not R – definable
4. Architecture
Decision dependency has become a common form of knowledge representation owing
to its properties of expressiveness and ease of understanding. A real time decision Table
includes a vector of decision and conditional attributes that describe the objectives and
constraints. These attributes describe the characteristics, qualities or performance
parameters of alternatives. The real time decision making makes the choice of reasonable
and justifiable from divisive alternatives [13]. The existence of fuzzy and crisp data has a
high degree of uncertainty that leads to inappropriate conclusions due to differences in
priorities and objectives. The application of rough intuitionistic fuzzy concepts to ranking
of decision dependencies and fuzzy Bayesian for selection of particular object from a
decision table results in non-redundant set of decisions.
Figure 1. Proposed Architecture

International Journal of Multimedia and Ubiquitous Engineering
Vol.10, No.6 (2015)
316 Copyright ⓒ 2015 SERSC
Phase-I
It involves in the generation of soil ranking to determine fertility with respect to the
number of data set.
Phase-II It applies combined fuzzy and Bayesian methodology on the crop selection parameters
to decide appropriate paddy variety for cultivation.
4.1 Data Description
This study was carried out in Ariyur village of Kaveripakkam block, Vellore district,
Tamilnadu, India. The major crops cultivated are paddy and sugarcane. The predominant
agricultural practice is small-scale mixed subsistence farming. Average landholdings in
the village are less than one hectare. A total of 100 soil samples were collected from
farmers of various age groups. The collected samples were analyzed in the district soil test
laboratory (STL) of Department of Agriculture. The main soil types identified were red
sandy loam, clay loam and saline. 20% of soil samples were used for ranking soil fertility
and 80% were used for specific paddy variety selection.
4.2 Intuitionistic Fuzzy Rough Set based Soil Fertility Ranking
Rough set theory is used to study mixed types of data such as continuous, valued and
symbolic data [3].It is a generalization of crisp rough set to deal with data sets of real time
attributes. Intuitionistic Fuzzy Rough set employs a fuzzy similarity relation to
characterize the similarity degree between two objects thereby encapsulates the distinct
concepts of vagueness and indiscernibility in uncertain data (Algorithm I)
Soil is a major source of three main nutrients namely nitrogen (N), phosphorus (P) and
potassium (K). Together they make up the trio known as NPK. Other important nutrients
are calcium, magnesium and sulfur. Plants also need small quantities of iron, manganese,
zinc and copper, known as trace elements. It is necessary to identify soil fertility so that
essential nutrient supplement can be identified at proper stage and also to minimize the
Algorithm I: Learn from soil samples for Fertility Ranking
Input : The set of soil samples partitioned over decision d on U; S X T Matrix
Output : Ranking of soil samples
For each record in database (1….N)
Remove irrelevant objects
For each attribute X in (1…S)
For each attribute Y in (1….T)
Consider the degree of resemblance (X, Y) and
generate equivalence classes
Similarity
function(α)
Dissimilarity
function(β)
| |1
( 1)
x y
n
| |
( 1)
x y
n
Where,
x and y are the attribute values for
two data objects
n is the maximum possible range
End for
End for
Group and rank data tuples in U using Intuitionistic fuzzy proximity relation and Rough sets
End for

International Journal of Multimedia and Ubiquitous Engineering
Vol.10, No.6 (2015)
Copyright ⓒ 2015 SERSC 317
usage of unhealthy inorganic chemical fertilizers thereby the financial burden. The major
attributes that play a vital role and the notations that are used in our analysis is given in
Table 2
Table 2. Notation Representation
Attribute Notation Possible Range
Electrical
Conductivity
Ec 1-3
Acidity/Alkalinity pH 1-7.5
Nitrogen N 1-450
kg/hectare
Phosphorous P 1-22
kg/hectare
Potassium K 1-280
kg/hectare
Zinc Zn 1-3 ppm
Copper Cu 1-3 ppm
Iron Fe 1-8 ppm
Manganese Mn 1-4 ppm
Table 3 represents the nutrient status of soil samples (20%) collected from Ariyur
village. It forms as target data set where the attributes are defined based on the problem
objective. Literature and numerical values for soil fertility factors were collected and
studied. The nutrient values forms the attribute set for our analysis. The soil fertility
ranking becomes our decision variable. Columns of the table are labeled by nutrients
(attributes) and rows by soil samples (objects), whereas each cell of the Table is attribute
values. Therefore, each row of the Table can be seen as information about specific farmer
field.
Table 3. Nutrition Status of Soil Samples
Samples EC PH N P K Zn Cu Fe Mn
x1 0.24 7.3 113 11.5 96 0.5 2.2 7.5 3.3
x2 0.25 7.2 65 126 92 0.5 2.6 7.3 3.6
x3 0.25 7.3 135 9.3 96 0.60 1.60 3.60 2.30
x4 0.23 7.3 131 4.9 88 0.60 1.30 3.30 2.50
x5 0.21 7.6 195 8.2 84 0.50 1.20 3.20 2.40
x6 0.26 7.5 116 9.3 92 0.50 1.10 3.10 2.00
x7 0.21 7.5 120 10.4 84 0.50 1.00 4.00 2.10
x8 0.24 7.5 105 11.5 129 0.60 1.40 4.40 2.20
x9 0.26 7.4 120 12.6 88 0.70 2.50 4.50 2.30
x10 0.24 7.4 143 10.4 111 0.70 2.30 3.30 2.50
x11 0.25 7.5 131 9.3 96 0.80 2.20 3.60 2.40
x12 0.35 7.3 210 8.2 88 0.80 2.60 3.30 2.60
x13 0.34 7.4 120 11.5 100 0.70 2.10 3.20 2.10
x14 0.26 7.5 168 9.3 92 0.90 2.70 3.10 2.60
x15 0.36 7.6 135 8.2 88 0.90 2.80 3.00 2.20
x16 0.24 7.3 120 10.4 96 0.50 2.30 3.40 2.30
x17 0.29 7.2 105 11.5 100 0.60 2.40 3.50 2.50

International Journal of Multimedia and Ubiquitous Engineering
Vol.10, No.6 (2015)
318 Copyright ⓒ 2015 SERSC
x18 0.26 7.7 153 7.1 150 0.60 1.30 3.30 2.40
x19 0.37 7.3 210 10.4 169 0.60 1.20 3.10 2.10
x20 0.28 7.4 172.5 11.5 169 0.60 1.10 4.00 2.20
We aim to rank soil fertility using the fuzzy proximity relation so as to decide the
amount of fertilizer usage with the help of domain expertise knowledge. Using the
algorithm for soil fertility ranking, the intuitionistic fuzzy proximity relations is applied
for the samples {x1,x2…..x20} to calculate approximate similarity and dissimilarity between
them. Considering the degree of resemblance measures α>0.90 and β<0.10 (similarity and
dissimilarity) in nutrition status values, the obtained equivalence classes are represented
in Table 4. Due to limitation of pages the calculation for pH, N, P, K, Zn, Cu and Fe are
omitted.
Table 4.1 Intuitionistic Fuzzy Proximity Relation of Ec
EC x1 x2 x 3 x 4 x 5 x6 x7 x8 x9 x10 x11 x12 x13 x14 x15 x16 x17 x18 x19 x20
x1 1.0,
0.0
0.95,
0.05
0.95,
0.05
0.95,
0.05
0.95,
0.05
0.95,
0.05
0.95,
0.05
0.95,
0.05
0.95,
0.05
0.95,
0.05
0.95,
0.05
0.95,
0.05
0.95,
0.05
0.95,
0.05
0.95,
0.05
0.95,
0.05
0.95,
0.05
0.95,
0.05
0.95,
0.05
0.95,
0.05
x 2 0.95,
0.05
1.0,
0.0
0.97,
0.009
0.97,
0.009
0.97,
0.009
0.97,
0.009
0.97,
0.009
0.97,
0.009
0.97,
0.009
0.97,
0.009
0.97,
0.009
0.97,
0.009
0.97,
0.009
0.97,
0.009
0.97,
0.009
0.97,
0.009
0.97,
0.009
0.97,
0.009
0.97,
0.009
0.97,
0.009
x3 0.99,
0.006
0.97,
0.009
1.0,
0.0
0.99,
0.014
0.99,
0.014
0.99,
0.014
0.99,
0.014
0.99,
0.014
0.99,
0.014
0.99,
0.014
0.99,
0.014
0.99,
0.014
0.99,
0.014
0.99,
0.014
0.99,
0.014
0.99,
0.014
0.99,
0.014
0.99,
0.014
0.99,
0.014
0.99,
0.014
x4 0.99,
0.006
0.94,
0.06
0.99,
0.014
1.0,
0.0
0.99,
0.007
0.99,
0.007
0.99,
0.007
0.99,
0.007
0.99,
0.007
0.99,
0.007
0.99,
0.007
0.99,
0.007
0.99,
0.007
0.99,
0.007
0.99,
0.007
0.99,
0.007
0.99,
0.007
0.99,
0.007
0.99,
0.007
0.99,
0.007
x5 1.0,
0.003
0.96,
0.04
0.95,
0.05
0.99,
0.007
1.0,
0.0
0.96,
0.036
0.96,
0.036
0.96,
0.036
0.96,
0.036
0.96,
0.036
0.96,
0.036
0.96,
0.036
0.96,
0.036
0.96,
0.036
0.96,
0.036
0.96,
0.036
0.96,
0.036
0.96,
0.036
0.96,
0.036
0.96,
0.036
x6 0.99,
0.004
0.91,
0.09
0.98,
0.021
0.97,
0.027
0.96,
0.036
1.0,
0.0
0.97,
0.03
0.97,
0.03
0.97,
0.03
0.97,
0.03
0.97,
0.03
0.97,
0.03
0.97,
0.03
0.97,
0.03
0.97,
0.03
0.97,
0.03
0.97,
0.03
0.97,
0.03
0.97,
0.03
0.97,
0.03
x7 0.99,
0.014
0.94,
0.06
0.97,
0.031
1.0,
0.0
0.99,
0.01
0.97,
0.03
1.0,
0.0
1.0,
0.002
1.0,
0.002
1.0,
0.002
1.0,
0.002
1.0,
0.002
1.0,
0.002
1.0,
0.002
1.0,
0.002
1.0,
0.002
1.0,
0.002
1.0,
0.002
1.0,
0.002
1.0,
0.002
x8 0.99,
0.006
0.94,
0.06
0.96,
0.036
1.0,
0.002
0.98,
0.02
0.98,
0.02
1.0,
0.002
1.0,
0.0
0.99,
0.007
0.99,
0.007
0.99,
0.007
0.99,
0.007
0.99,
0.007
0.99,
0.007
0.99,
0.007
0.99,
0.007
0.99,
0.007
0.99,
0.007
0.99,
0.007
0.99,
0.007
x9 0.98,
0.02
0.94,
0.06
0.98,
0.02
0.99,
0.009
0.97,
0.03
0.99,
0.011
0.99,
0.009
0.99,
0.007
1.0,
0.0
0.98,
0.018
0.98,
0.018
0.98,
0.018
0.98,
0.018
0.98,
0.018
0.98,
0.018
0.98,
0.018
0.98,
0.018
0.98,
0.018
0.98,
0.018
0.98,
0.018
x10 1.0,
0.003
0.92,
0.08
0.97,
0.03
1.0,
0.002
0.99,
0.01
0.97,
0.03
1.0,
0.002
1.0,
0.003
0.98,
0.018
1.0,
0.0
0.99,
0.005
0.99,
0.005
0.99,
0.005
0.99,
0.005
0.99,
0.005
0.99,
0.005
0.99,
0.005
0.99,
0.005
0.99,
0.005
0.99,
0.005
x11 0.99,
0.007
0.93,
0.07
0.96,
0.04
1.0,
0.003
1.0,
0.002
0.98,
0.011
1.0,
0.003
1.0,
0.002
0.99,
0.006
0.99,
0.005
1.0,
0.0
0.99,
0.008
0.99,
0.008
0.99,
0.008
0.99,
0.008
0.99,
0.008
0.99,
0.008
0.99,
0.008
0.99,
0.008
0.99,
0.008
x12 0.97,
0.03
0.92,
0.08
1.0,
0.002
0.98,
0.02
1.0,
0.003
0.99,
0.01
0.98,
0.016
0.99,
0.009
1.0,
0.002
0.98,
0.02
0.99,
0.008
1.0,
0.0
0.95,
0.04
0.95,
0.04
0.95,
0.04
0.95,
0.04
0.95,
0.04
0.95,
0.04
0.95,
0.04
0.95,
0.04
x13 0.98,
0.018
0.97,
0.026
0.98,
0.02
0.97,
0.025
0.99,
0.01
0.94,
0.06
0.97,
0.031
0.97,
0.03
0.95,
0.05
0.97,
0.03
0.96,
0.04
0.95,
0.04
1.0,
0.0
0.98,
0.019
0.98,
0.019
0.98,
0.019
0.98,
0.019
0.98,
0.019
0.98,
0.019
0.98,
0.019
x14 1.0,
0.002
0.95,
0.05
0.98,
0.02
1.0,
0.003
0.99,
0.01
0.97,
0.026
1.0,
0.003
0.99,
0.005
0.98,
0.02
1.0,
0.002
00.99,
0.006
0.98,
0.02
0.98,
0.019
1.0,
0.0
1.0,
0.002
1.0,
0.002
1.0,
0.002
1.0,
0.002
1.0,
0.002
1.0,
0.002

International Journal of Multimedia and Ubiquitous Engineering
Vol.10, No.6 (2015)
Copyright ⓒ 2015 SERSC 319
x15 1.0,
0.003
0.93,
0.07
0.97,
0.025
1.0,
0.002
0.99,
0.01
0.97,
0.03
1.0,
0.003
1.0,
0.003
0.98,
0.016
1.0,
0.0
0.99,
0.005
0.98,
0.018
0.97,
0.027
1.0,
0.002
1.0,
0.0
0.99,
0.005
0.99,
0.005
0.99,
0.005
0.99,
0.005
0.99,
0.005
x16 0.99,
0.007
0.93,
0.07
1.0,
0.001
1.0,
0.003
0.98,
0.02
0.98,
0.018
1.0,
0.02
1.0,
0.002
0.99,
0.006
0.99,
0.005
1.0,
0.0
0.99,
0.008
0.96,
0.044
0.99,
0.006
0.99,
0.005
1.0,
0.0
0.97,
0.031
0.97,
0.031
0.97,
0.031
0.97,
0.031
x17 0.99,
0.005
0.96,
0.036
0.99,
0.014
0.98,
0.02
1.0,
0.003
0.95,
0.046
0.98,
0.02
0.98,
0.016
0.96,
0.04
0.98,
0.017
0.97,
0.027
0.96,
0.038
0.99,
0.013
0.99,
0.006
0.98,
0.017
0.97,
0.031
1.0,
0.0
0.99,
0.014
0.99,
0.014
0.99,
0.014
x18 1.0,
0.002
0.95,
0.052
0.98,
0.017
0.99,
0.011
1.0,
0.002
0.96,
0.04
0.99,
0.005
0.99,
0.007
0.97,
0.03
0.99,
0.014
0.98,
0.02
0.97,
0.025
0.98,
0.017
1.0,
0.003
0.99,
0.014
0.98,
0.018
0.99,
0.014
1.0,
0.0
1.0,
0.003
1.0,
0.003
x19 1.0,
0.002
1.0,
0.002
1.0,
0.001
1.0,
0.003
0.99,
0.014
0.97,
0.03
1.0,
0.003
0.99,
0.005
0.98,
0.016
1.0,
0.002
0.99,
0.006
0.98,
0.015
0.98,
0.019
1.0,
0.0
1.0,
0.002
0.99,
0.01
0.99,
0.006
1.0,
0.003
1.0,
0.0
0.99,
0.006
x20 0.99,
0.005
0.96,
0.04
0.99,
0.014
0.98,
0.019
1.0,
0.003
0.95,
0.05
0.98,
0.016
0.98,
0.017
0.96,
0.04
0.98,
0.017
0.97,
0.027
0.96,
0.038
0.99,
0.003
0.99,
0.006
0.98,
0.017
0.97,
0.03
1.0,
0.0
0.99,
0.005
0.99,
0.006
1.0,
0.0
Table 4.2 Intuitionistic Fuzzy Proximity Relation of Mn Mn x1 x2 x3 x4 x5 x6 x7 x8 x9 x10 x11 x12 x13 x14 x15 x16 x17 x18 x19 x20
x1 1.0,
0.0
0.98,
0.021
0.98,
0.02
0.03,
0.97
0.73,
0.27
0.08,
0.916
0.93,
0.07
0.41,
0.59
0.91,
0.087
0.88,
0.22
0.84,
0.16
0.85,
0.153
0.98,
0.018
0.78,
0.22
1.0,
0.0
0.81,
0.19
0.89,
0.11
0.81,
0.192
0.93,
0.068
0.98,
0.02
x2 0.98,
0.021
1.0,
0.0
1.0,
0.0
1.0,
0.02
0.97,
0.009
0.95,
0.052
0.81,
0.19
0.88,
0.12
0.93,
0.07
0.78,
0.22
0.83,
0.17
0.86,
0.14
1.0,
0.0
0.95,
0.047
0.98,
0.016
0.88,
0.12
0.83,
0.165
0.98,
0.016
0.93,
0.067
0.95,
0.05
x3 0.98,
0.021
1.0,
0.0
1.0,
0.0
0.90,
0.095
0.79,
0.21
0.95,
0.042
0.91,
0.09
0.98,
0.02
0.93,
0.065
0.781,
0.22
0.83,
0.17
0.86,
0.14
1.0,
0.0
0.95,
0.05
0.98,
0.02
0.85,
0.15
0.88,
0.12
0.87,
0.13
0.84,
0.16
0.93,
0.07
x4 0.98,
0.021
1.0,
0.0
0.90,
0.095
1.0,
0.0
0.87,
0.13
0.96,
0.041
0.90,
0.097
0.83,
0.17
0.98,
0.015
0.78,
0.224
0.93,
0.07
1.0,
0.02
0.95,
0.046
0.93,
0.07
0.83,
0.166
0.88,
0.12
0.93,
0.07
0.71,
0.29
0.86,
0.14
0.97,
0.03
x5 0.98,
0.021
1.0,
0.0
0.90,
0.095
0.87,
0.13
1.0,
0.0
0.96,
0.04
0.91,
0.09
0.88,
0.12
0.89,
0.11
0.85,
0.15
0.90,
0.10
0.93,
0.068
0.90,
0.095
0.95,
0.048
0.91,
0.087
0.98,
0.02
0.93,
0.07
0.98,
0.02
0.99,
0.014
0.60,
0.40
x6 0.98,
0.021
1.0,
0.0
0.90,
0.095
0.87,
0.13
0.96,
0.04
1.0,
0.0
0.95,
0.045
0.94,
0.06
0.97,
0.032
0.96,
0.04
0.97,
0.03
0.90,
0.097
0.80,
0.20
0.87,
0.13
0.81,
0.19
0.94,
0.06
0.94,
0.06
0.85,
0.15
0.75,
0.25
0.83,
0.17
x7 0.98,
0.021
1.0,
0.0
0.90,
0.095
0.87,
0.13
0.96,
0.04
0.95,
0.045
1.0,
0.0
0.73,
0.266
0.88,
0.12
0.75,
0.25
0.88,
0.12
0.68,
0.322
0.11,
0.89
0.96,
0.04
0.83,
0.165
0.73,
0.265
0.98,
0.018
0.63,
0.37
0.81,
0.19
0.86,
0.137
x8 0.98,
0.021
1.0,
0.0
0.90,
0.095
0.87,
0.13
0.96,
0.04
0.95,
0.045
0.73,
0.266
1.0,
0.0
0.60,
0.40
0.53,
0.472
0.85,
0.153
0.96,
0.041
0.38,
0.62
0.63,
0.365
0.71,
0.294
1.0,
0.0
0.85,
0.154
0.90,
0.098
0.93,
0.07
0.65,
0.35
x9 0.98,
0.021
1.0,
0.0
0.90,
0.095
0.87,
0.13
0.96,
0.04
0.95,
0.045
0.73,
0.266
0.60,
0.40
1.0,
0.0
0.87,
0.13
0.76,
0.24
0.56,
0.44
0.93,
0.07
0.93,
0.07
0.91,
0.08
0.86,
0.14
0.96,
0.041
0.95,
0.049
0.68,
0.317
0.93,
0.066
x10 0.98,
0.021
1.0,
0.0
0.90,
0.095
0.87,
0.13
0.96,
0.04
0.95,
0.045
0.73,
0.266
0.60,
0.40
0.87,
0.13
1.0,
1.0
0.98,
0.022
0.71,
0.292
0.81,
0.192
0.80,
0.20
0.85,
0.15
0.97,
0.034
0.70,
0.295
0.73,
0.27
0.90,
0.10
0.83,
0.17
x11 0.98,
0.021
1.0,
0.0
0.90,
0.095
0.87,
0.13
0.96,
0.04
0.95,
0.045
0.73,
0.266
0.60,
0.40
0.87,
0.13
0.98,
0.022
1.0,
0.0
0.81,
0.194
0.83,
0.17
0.88,
0.122
0.86,
0.139
0.85,
0.153
0.71,
0.286
0.75,
0.25
0.93,
0.07
0.48,
0.52
x12 0.98,
0.021
1.0,
0.0
0.90,
0.095
0.87,
0.13
0.96,
0.04
0.95,
0.045
0.73,
0.266
0.60,
0.40
0.87,
0.13
0.98,
0.022
0.81,
0.194
1.0,
0.0
0.43,
0.57
0.68,
0.32
0.45,
0.55
0.96,
0.04
0.90,
0.20
0.95,
0.05
0.88,
0.12
0.68,
0.32
x13 0.98,
0.021
1.0,
0.0
0.90,
0.095
0.87,
0.13
0.96,
0.04
0.95,
0.045
0.73,
0.266
0.60,
0.40
0.87,
0.13
0.98,
0.022
0.81,
0.194
0.43,
0.57
1.0,
0.0
0.75,
0.25
0.98,
0.015
0.68,
0.32
0.53,
0.47
0.48,
0.52
0.30,
0.70
0.75,
0.25
x14 0.98, 1.0, 0.90, 0.87, 0.96, 0.95, 0.73, 0.60, 0.87, 0.98, 0.81, 0.43, 0.75, 1.0, 0.78, 0.63, 0.78, 0.73, 0.55, 1.0,

International Journal of Multimedia and Ubiquitous Engineering
Vol.10, No.6 (2015)
320 Copyright ⓒ 2015 SERSC
0.021 0.0 0.095 0.13 0.04 0.045 0.266 0.40 0.13 0.022 0.194 0.57 0.25 0.0 0.22 0.366 0.22 0.27 0.45 0.0
x15 0.98,
0.021
1.0,
0.0
0.90,
0.095
0.87,
0.13
0.96,
0.04
0.95,
0.045
0.73,
0.266
0.60,
0.40
0.87,
0.13
0.98,
0.022
0.81,
0.194
0.43,
0.57
0.75,
0.25
0.78,
0.22
1.0,
0.0
0.61,
0.39
0.55,
0.45
0.51,
0.49
0.43,
0.566
0.78,
0.22
x16 0.98,
0.021
1.0,
0.0
0.90,
0.095
0.87,
0.13
0.96,
0.04
0.95,
0.045
0.73,
0.266
0.60,
0.40
0.87,
0.13
0.98,
0.022
0.81,
0.194
0.43,
0.57
0.75,
0.25
0.78,
0.22
0.61,
0.39
1.0,
0.0
0.85,
0.15
0.90,
0.10
0.93,
0.07
0.63,
0.37
x17 0.98,
0.021
1.0,
0.0
0.90,
0.095
0.87,
0.13
0.96,
0.04
0.95,
0.045
0.73,
0.266
0.60,
0.40
0.87,
0.13
0.98,
0.022
0.81,
0.194
0.43,
0.57
0.75,
0.25
0.78,
0.22
0.61,
0.39
0.85,
0.15
1.0,
0.0
0.96,
0.04
0.78,
0.22
0.78,
0.22
x18 0.98,
0.021
1.0,
0.0
0.90,
0.095
0.87,
0.13
0.96,
0.04
0.95,
0.045
0.73,
0.266
0.60,
0.40
0.87,
0.13
0.98,
0.022
0.81,
0.194
0.43,
0.57
0.75,
0.25
0.78,
0.22
0.61,
0.39
0.85,
0.15
0.96,
0.04
1.0,
0.0
0.83,
0.17
0.73,
0.27
x19 0.98,
0.021
1.0,
0.0
0.90,
0.095
0.87,
0.13
0.96,
0.04
0.95,
0.045
0.73,
0.266
0.60,
0.40
0.87,
0.13
0.98,
0.022
0.81,
0.194
0.43,
0.57
0.75,
0.25
0.78,
0.22
0.61,
0.39
0.85,
0.15
0.96,
0.04
0.83,
0.17
1.0,
0.0
0.95,
0.051
x20 0.98,
0.021
1.0,
0.0
0.90,
0.095
0.87,
0.13
0.96,
0.04
0.95,
0.045
0.73,
0.266
0.60,
0.40
0.87,
0.13
0.98,
0.022
0.81,
0.194
0.43,
0.57
0.75,
0.25
0.78,
0.22
0.61,
0.39
0.85,
0.15
0.96,
0.04
0.83,
0.17
0.95,
0.051
1.0,
0.0
By considering the almost similarity of 90% and dissimilarity of 10% ,it is
observed from Table4.1 that R(x1,x1)=1.0,0; R(x2,x5)=0.97,0.009; R(x3,x6)=0.99,0.014; R(
x4,x7)=0.99,0.0007; R(x5,x8)=0.96,0.036;R(x6,x9)=0.97,0.03;R(x7,x10)=1.0,0.002;R(x8,x11)
=0.99,0.007;R(x9,x12)=0.98,0.018;R(x10,x11)=0.99,0.005;R(x11,x12)=0.99,0.008;R(x12,x13)=
0.95,0.04;R(x13,x14)=0.98,0.019;R(x14,x15)=1,0.002;R(x15,x16)=0.99,0.005;R(x16,x17)=0.97,
0.031;R(x17,x18)=0.99,0.014;R(x18,x19)=1,0.003;R(x19,x20)=0.99,0.006;R(x1,x20)=0.95,0.05.
Thus the samples are alpha (α) and beta (β) identical. Therefore we get
U/EC={x1,x2,x3,x4,x5,x6,x7,x8,x9,x10,x11, x12, x13, x14, x15, x16, x17, x18, x19, x20}.
From the observations of Algorithm I, the attributes {U/P, U/K,U/Cu, U/Fe} and
{U/N} classifies the soil samples into two and three groups respectively. Since the
equivalence classes{U/Ec,U/PH,U/Zn,U/Mn} contains only one group, the soil samples
are indiscernible according to the attribute set and hence do not require any ordering
while extracting knowledge from the information system. The ordered information table
of the soil samples (Table 2) is given in Table 5.
Table 5. Intuitionistic Fuzzy Sets and Ordering
Intuitionistic fuzzy sets Ordering
U/Ec {i1,i2,i3,i4,i5,i6,i7,i8,i9,i10, i11, i12, i13, i14, i15, i16, i17, i18, i19, i20} < {0} normal
U/PH {i1,i2,i3,i4,i5,i6,i7,i8,i9,i10,i11,i12, i13, i14, i15, i16, i17, i18, i19, i20} < {0} normal
U/N {i2,i8,i17 },{,i1,i3,i4,i5,i6,i7,i9,i10, i11, i13, i14, i15, i16, i18, i20},{i12, i19} < {1} low < {2} medium <
{3} high
U/P {i3,i4,i5,i6,i11,i12,i14,i15,i18},{i1,i2,i7,i19,,i10,i13,i16,i17,i19,i20} < {1} low < {2} medium
U/K {i1,i2,i3,i4,i5,i6,i7,i9, i10, i11, i12, i13, i14, i15, i16, i17},{i8, i18, i19, i20} < {1} low < {2} medium
U/Zn {i1,i2,i3,i4,i5,i6,i7,i8,i9, i10, i11, i12, i13, i14, i15, i16, i17, i18, i19, i20} < {0} optimum
U/Cu {i7,i20},{i1,i2,i3,i4,i5,i6,i8,i9, i10, i11, i12, i13, i14, i15, i16, i17, i18, i19} < {1} less < {2} optimum
U/Fe {i3,i4,i5,i6, i11, i12, i13, i14, i15, i16, i17, i18, i19},{i1,i2,i7,i8,i9,i10,i20} < {1} less < {2} optimum
U/Mn {i1,i2,i3,i4,i5,i6,i7,i8,i9, i10, i11, i12, i13, i14, i15, i16, i17, i18, i19, i20} < {0} optimum
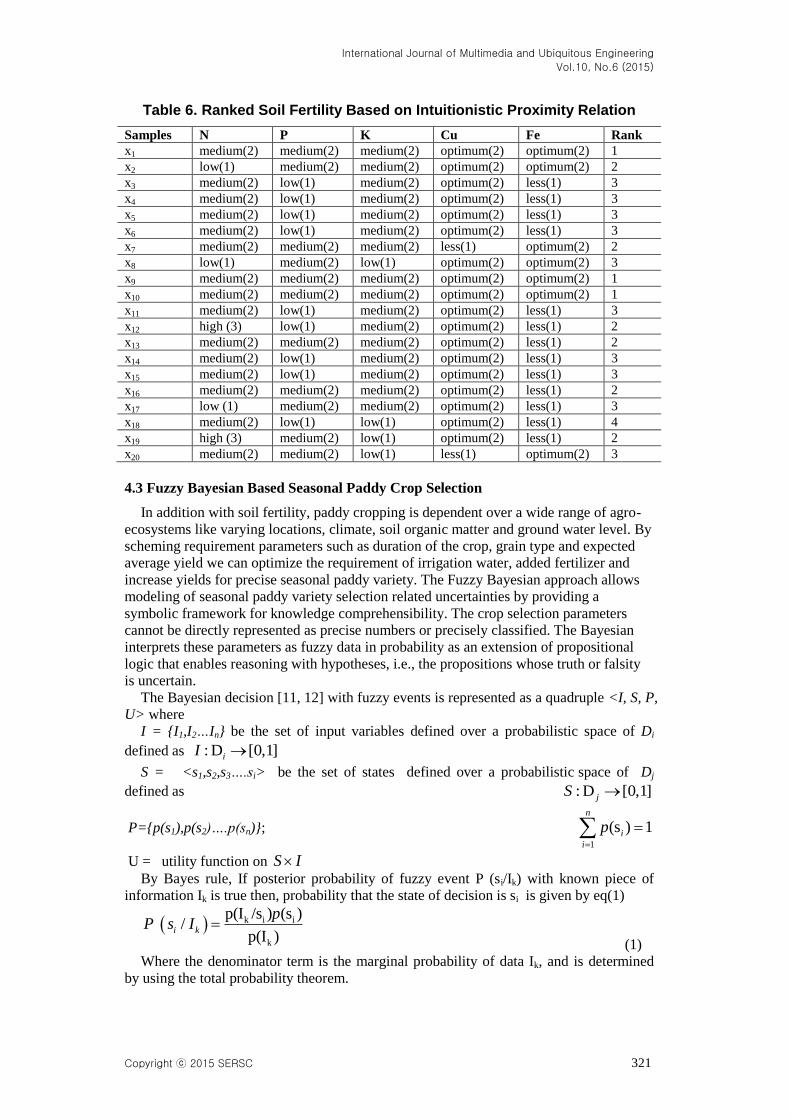
For ordering the soil samples we assign weights to the attribute values using rough set
theory. In order to compute the rank xk ; k={1,2….20} we add the weights of the attribute
values and rank them according to the total sum obtained from highest to lowest.
However, it is identified that the total sum remains same for certain samples. It indicates
that these samples cannot be distinguished from one another according to the attribute
nutrient values and eliminated from soil fertility ranking.
International Journal of Multimedia and Ubiquitous Engineering
Vol.10, No.6 (2015)
Copyright ⓒ 2015 SERSC 321
Table 6. Ranked Soil Fertility Based on Intuitionistic Proximity Relation
Samples N P K Cu Fe Rank
x1 medium(2) medium(2) medium(2) optimum(2) optimum(2) 1
x2 low(1) medium(2) medium(2) optimum(2) optimum(2) 2
x3 medium(2) low(1) medium(2) optimum(2) less(1) 3
x4 medium(2) low(1) medium(2) optimum(2) less(1) 3
x5 medium(2) low(1) medium(2) optimum(2) less(1) 3
x6 medium(2) low(1) medium(2) optimum(2) less(1) 3
x7 medium(2) medium(2) medium(2) less(1) optimum(2) 2
x8 low(1) medium(2) low(1) optimum(2) optimum(2) 3
x9 medium(2) medium(2) medium(2) optimum(2) optimum(2) 1
x10 medium(2) medium(2) medium(2) optimum(2) optimum(2) 1
x11 medium(2) low(1) medium(2) optimum(2) less(1) 3
x12 high (3) low(1) medium(2) optimum(2) less(1) 2
x13 medium(2) medium(2) medium(2) optimum(2) less(1) 2
x14 medium(2) low(1) medium(2) optimum(2) less(1) 3
x15 medium(2) low(1) medium(2) optimum(2) less(1) 3
x16 medium(2) medium(2) medium(2) optimum(2) less(1) 2
x17 low (1) medium(2) medium(2) optimum(2) less(1) 3
x18 medium(2) low(1) low(1) optimum(2) less(1) 4
x19 high (3) medium(2) low(1) optimum(2) less(1) 2
x20 medium(2) medium(2) low(1) less(1) optimum(2) 3
4.3 Fuzzy Bayesian Based Seasonal Paddy Crop Selection
In addition with soil fertility, paddy cropping is dependent over a wide range of agro-
ecosystems like varying locations, climate, soil organic matter and ground water level. By
scheming requirement parameters such as duration of the crop, grain type and expected
average yield we can optimize the requirement of irrigation water, added fertilizer and
increase yields for precise seasonal paddy variety. The Fuzzy Bayesian approach allows
modeling of seasonal paddy variety selection related uncertainties by providing a
symbolic framework for knowledge comprehensibility. The crop selection parameters
cannot be directly represented as precise numbers or precisely classified. The Bayesian
interprets these parameters as fuzzy data in probability as an extension of propositional
logic that enables reasoning with hypotheses, i.e., the propositions whose truth or falsity
is uncertain.
The Bayesian decision [11, 12] with fuzzy events is represented as a quadruple <I, S, P,
U> where
I = {I1,I2…In} be the set of input variables defined over a probabilistic space of Di
defined as : D [0,1]iI
S = <s1,s2,s3….si> be the set of states defined over a probabilistic space of Dj
defined as : D [0,1]jS
P={p(s1),p(s2)….p(sn)};1
(s ) 1n
i
i
p
U = utility function on S I
By Bayes rule, If posterior probability of fuzzy event P (si/Ik) with known piece of
information Ik is true then, probability that the state of decision is si is given by eq(1)
k i i
k
p(I /s ) (s
)
p( )/
Ii kP s I
p
(1)
Where the denominator term is the marginal probability of data Ik, and is determined
by using the total probability theorem.

International Journal of Multimedia and Ubiquitous Engineering
Vol.10, No.6 (2015)
322 Copyright ⓒ 2015 SERSC
1
(I ) (I / S ) ( )n
k k i i
i
p p p s
(2)
The expected utility for the jth alternative for the given data Ik is is given by eq (3)
1
( / ) ( / )n
j k ij i k
i
E u I u p s I
(3)
The maximum expected utility for the given observed data and new data Ik is given by
eq (4) and (5) respectively *( / ) ( / ) (I )k j k kE u I E u I p
(4)
*
1
( ) ( / ) p(I )n
j k k
i
E u E u I
(5)
The value of information V(x) in new data can be assessed by difference between
maximum expected utility in observed data and the maximum expected utility in new data
V(x) =|*( )E u -
*( / )kE u I | (6)
Algorithm II : Learn from rules for Seasonal crop selection
Input : D, a dataset of soil samples
Sij , seasonal paddy variety
I, Input Variables: Duration, Average yield, Grain type
U, Utility matrix of costs
Output: Decision rule set for selective objective: Sij
1. Define fuzzy states for duration, average yield and grain type
2. Define orthogonal fuzzy information system for Sij
3. For the training data, identify utility matrix and prior probability
4. For the testing data find posterior, conditional probability
5. Determine the value of information to choose the approximate alternative Sij.
4.3.1 Illustrative Example: For realizing optimum productivity of paddy in related
production environment (Vellore district, Tamilnadu, India) the choice of an appropriate
variety is extremely essential. In our study, the criteria considered for paddy variety
selection are duration, average yield and grain type. The fuzzy Bayesian decision-
theoretic analysis in Algorithm II adapts a systematic method for determining the precise
decision by using more familiar notions of costs (utility matrix) and risks.
Table 7. Salient Paddy Selection Parameters
S.No
Duration(days)
Average Yield
(kg/ha) Grain Type Variety
x1 110 4000 medium ADT36
x2 105 6200 short bold ADT 37
x3 115 5600 short bold ASD 16
x4 105-110 5900 medium slender ASD 18
x5 110 4900 medium slender ADT 43
x6 95-100 4500 medium slender MDU 5
x7 130 6000 long slender IR 50
x8 110-115 5832 medium slender CO47
x9 110 5400 medium slender ADT 45
x10 118 6200 medium slender ADT 47

International Journal of Multimedia and Ubiquitous Engineering
Vol.10, No.6 (2015)
Copyright ⓒ 2015 SERSC 323
x11 94-99 4800 long slender ADT 48
x12 110-115 7500 medium slender CORH3
4.3.2 Define the Fuzzy States of Nature: In fuzzy set, the input variable is linguistically
described or approximately measured based on complexity of situation. Let I= {Duration,
Average Yield, Grain type} be the input variables and the membership functions are
derived for each fuzzy set based on the expertise knowledge of crop selection parameters.
Input variables Fuzzy states
Duration (I1) short
1-105 days
medium
106-135 days
long
136-150 days
Average Yield(I2) low
2000-3000 kg/ha
medium
3001-
3999 kg/ha
high
4000-6200 kg/ha
Grain Type(I3) Short medium Long
4.3.3 Define Fuzzy Alternatives: Defining the decision alternative helps us to decide the
plantation of suitable paddy variety adaptable to average yield, duration of the crop and
soil fertility. Let Sij={Sornavari , Samba, Navarai} and Sij is the representation of
selective jth paddy variety of ith season subjective to environmental constrains.
Sij Paddy Varieties
Sornavari (S1j) ADT 36, ADT 37, ASD 16, ASD 18, ADT 43, MDU 5, IR 50, CO47,
ADT(R)45, ADT(R)47, ADT(R)48, CORH3 Samba (S2j) CR 1009, ADT 44, Bhavani, I.White Ponni, CO 43, Paiyur 1, TRY 1*, TRY
3*, CORH 4, CO (R) 48, CO (R) 49, CO (R) 50, ADT (R) 49, TNAU Rice
ADT 50 Navarai (S3j) ADT 36, ADT 39, ASD 16, ASD 18, MDU 5, CO 47,CORH 3, ADT 43, ADT
(R) 45 4.3.4 Define New Data Samples: To test the effectiveness of the proposed method, our
study considers a target dataset of 70 elements. The data were checked for consistency
and completeness .The unreliable and unrelated data were removed to avoid complexity.
We randomly divided the 50 datasets into the training data set of 40 records (90%) and
testing data set of 10 records (10%).
Duration
Average
Yield
Grain
Type Variety
70 4000 medium ?
4.3.5Define orthogonal Fuzzy Information System and the Prior Probabilities:
Considering the testing data as inherently fuzzy, an orthogonal fuzzy information
system O{P,M,G}={Poor,Moderate,Good} with membership values are defined. It means
that the sum of the membership values for each fuzzy event I, for every data point in the
information universe, Ik, equals unity.
Duration Average Yield Grain Type
µP(Ik) 0.11 0.2 0.2
International Journal of Multimedia and Ubiquitous Engineering
Vol.10, No.6 (2015)
324 Copyright ⓒ 2015 SERSC
µm(Ik) 0.8 0.4 0.8
µg(Ik) 0.09 0.6 0.2
The prior probability of state Sij is computed based on prior expertise knowledge for
the training data before adding the testing data. According to expertise knowledge
Sonavarai(S1j) crop cultivation are more preferable than Samba (S2j) and Navarai (S3j)
crops.
Sij Probability
Sornavari p(s1j)=0.5
Samba p(s2j)=0.3
Navarai p(s3j)=0.2
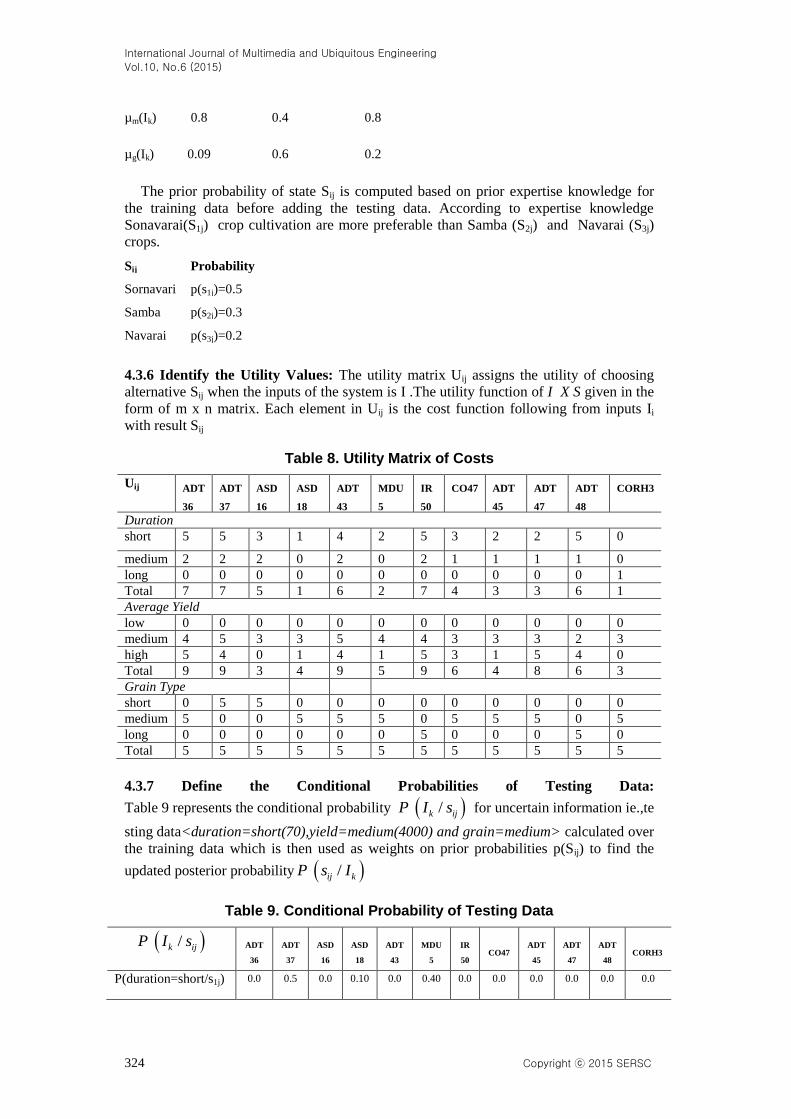
4.3.6 Identify the Utility Values: The utility matrix Uij assigns the utility of choosing
alternative Sij when the inputs of the system is I .The utility function of I X S given in the
form of m x n matrix. Each element in Uij is the cost function following from inputs Ii
with result Sij
Table 8. Utility Matrix of Costs
Uij ADT
36
ADT
37
ASD
16 ASD
18 ADT
43 MDU
5 IR
50 CO47 ADT
45 ADT
47 ADT
48 CORH3
Duration
short 5 5 3 1 4 2 5 3 2 2 5 0
medium 2 2 2 0 2 0 2 1 1 1 1 0
long 0 0 0 0 0 0 0 0 0 0 0 1
Total 7 7 5 1 6 2 7 4 3 3 6 1
Average Yield
low 0 0 0 0 0 0 0 0 0 0 0 0
medium 4 5 3 3 5 4 4 3 3 3 2 3
high 5 4 0 1 4 1 5 3 1 5 4 0
Total 9 9 3 4 9 5 9 6 4 8 6 3
Grain Type
short 0 5 5 0 0 0 0 0 0 0 0 0
medium 5 0 0 5 5 5 0 5 5 5 0 5
long 0 0 0 0 0 0 5 0 0 0 5 0
Total 5 5 5 5 5 5 5 5 5 5 5 5
4.3.7 Define the Conditional Probabilities of Testing Data:
Table 9 represents the conditional probability /k ijP I s for uncertain information ie.,te
sting data<duration=short(70),yield=medium(4000) and grain=medium> calculated over
the training data which is then used as weights on prior probabilities p(Sij) to find the
updated posterior probability /ij kP s I
Table 9. Conditional Probability of Testing Data
/k ijP I s ADT
36 ADT
37 ASD
16 ASD
18 ADT
43 MDU
5 IR
50 CO47
ADT
45 ADT
47 ADT
48 CORH3
P(duration=short/s1j) 0.0 0.5 0.0 0.10 0.0 0.40 0.0 0.0 0.0 0.0 0.0 0.0

International Journal of Multimedia and Ubiquitous Engineering
Vol.10, No.6 (2015)
Copyright ⓒ 2015 SERSC 325
P(yield=medium/ s2j) 0.30 0.0 0.06 0.0 0.3 0.0 0.0 0.03 0.06 0.0 0.3 0.06
P(grain=medium/ s3j) 0.23 0.0 0.0 0.1 0.1 0.12 0.0 0.01 0.01 0.13 0.0 0.18
4.3.8 Define the Posterior Probability of Testing Data: Table 10 summarizes
calculations for the posterior probabilities /ij kP s I ,the marginal probabilities p(Ik),
the expected conditional utilities E(U/Ik) and value of uncertainty v(Ik) of the testing data
<duration=short(70), yield=medium(4000) and grain=medium>. Typical calculations for
values in the table are given below.
Table 10. Posterior Probability of Testing Data
ADT 36 ADT 37 ASD 16 ASD
18 ADT
43 MDU
5 IR
50 CO47 ADT 45 ADT 47
ADT
48 CORH3
P(s1j/
duration=short) 0 0.3 0 0.2 0 0.3 0 0 0 0 0 0
P(s2j/
yield=medium) 1 0 0.2 0 1 0 0 0.13 0.2 0 1 0.2
P(s3j
/grain=medium) 1 0 0 0.5 0.5 0.06 0 0.05 0.05 0.65 0 0.9
P(Ik) 1 0.15 0.10 0.35 0.75 0.18 0 0.09 0.125 0.325 0.5 0.55
E(U/Ik) 9 1.5 0.06 0.35 0.45 0.06 0 0.38 0.75 3.25 2 0.51
E(U*/Ik) 9 0.225 0.006 0.12 0.34 0.01 0 0.03 0.09 1.05 1 0.28
v(Ik) 78.16 0 0 0 0 0 0 0 0 0 0 0
The marginal probability p(Ik) and posterior probabilities /ij kP s I of the testing
data are calculated based on the conditional probabilities
/k ijP I s in Table 9 and the prior probabilities P(Sij).
By equation 1,
P(sADT 36/duration=short) =(0 * 0.5)/(0.5) =0
P(sADT 45 /yield=medium)= (0.06* 0.3)/0.07=0.2
By equation 2,
P(Ik)=0+1(0.5)+1(0.5)=1; for ADT 36
P(Ik)=0+0.2(0.5)+0.9(0.5)=0.55;for CORH3
The expected conditional probability E(U/Ik) is actually the sum of pair wise products
of the values in the utility matrix (Table 8) and posterior probability values and is
calculated using the equation 3 .
E(U/MDU 5)=0.3(2)+0(0)+0.06(0) =0.06
E(U/DT48)=0(5)+1(2)+0(0) =2
The overall expected utility for the testing data Ik is derived using equation 5 which is
sum of pair wise values in row 5,6 of Table 10
E(U*)=9(9)+1.5(0.225)+0.06(0.006)+0.35(0.12)+0.45(0.34)+0.06(0.01)+0+0.38(0.0
3)+0.75(0.09)+3.25(1.05)+2(1)+0.51(0.28)=87.16
Finally to decide appropriate alternative to choose in Table 10, we find
) ( )
1
kMax Uij
i
E U* /S with Max( I Λkijfavoring every element in Ik. For the

International Journal of Multimedia and Ubiquitous Engineering
Vol.10, No.6 (2015)
326 Copyright ⓒ 2015 SERSC
testing data <duration=short, yield=medium and grain=medium> the favorable crop
variety is ADT 36 ie., . )E UM x( * /Ika =9 and ( )
1
kMax Uij
i
=9+5+5=14
4.3.9 Determine the Value of Uncertainty in Testing Data: The value of uncertainty in
testing data for ADT 36 ε Sij is obtained by equation 6.
For V(<duration=short(70),yield=medium(4000) and grain=medium>)=87.16-9=78.16
which is greater than all other value of information v(Ik) so still ADT 36 is the
suitable choice of crop variety.
5. Performance Analysis
The proposed algorithm works in two phases. The first phase involves the generation
of soil fertility and the second phase is the application of combined fuzzy and Bayesian
on the objective function to select appropriate paddy variety for cultivation. For fuzzy
Bayesian we randomly divided the target data set into two groups called training dataset
(90%) and testing dataset (10%).After performing data cleaning and pre processing, the
training dataset builds the knowledge mining model and the testing dataset checks the
accuracy of variety selection by the hybrid intelligent system. In order to validate our
approach we have compared it with some conventional decision making algorithms and
the results are shown in Table 11.
Accuracy: It is the degree of correctness to calculate the performance of the system. The
higher the accuracy the better the performance of the system.
Accuracy=TP+TN/TP+TN+FP+FN
Sensitivity: It is a measure of how a system properly identifies condition and concludes
solution. (ie) identifying specific paddy variety under specific selection parameters.
Sensitivity = TP/TP+FN
Specificity: It is a measure of how a system properly identifies the wrong solutions. (ie)
probability that the system indicates negative selection of paddy varieties.
Specificity = TN/TN+FP
Table 11. Performance Evaluation of Target Data
Method Performance
Training Data Testing Data Samples Average
Accuracy
Average
Specificity
Average
Sensitivity
Samples Average
Accuracy
Average
Specificity
Average
Sensitivity
Neural
network
70 80.7% 67% 60% 10 84.2% 64% 61%
Fuzzy
bayesian
70 90.2% 85% 70% 10 93.8% 86% 73%
Navie
bayesian
70 79.5% 77% 57% 10 66.7% 77% 57%
6. Conclusion
The universe of discourse represents real time decision problems involving continuous
or mixture of discrete and continuous variables. These variables are modeled using
linguistic hedges of fuzzy numbers .A variety of statistical analysis methods fed into
decision methodology provides good approximate solutions for moderate sized problems.
Intuitionistic fuzzy rough and fuzzy bayesian sapproach of uncertainty management
solves conceptual and inferential issues of high structural and high dimensional domains.

International Journal of Multimedia and Ubiquitous Engineering
Vol.10, No.6 (2015)
Copyright ⓒ 2015 SERSC 327
Our work provides a framework that allows us to systematically explore options, develop
and examine beliefs. This methodology not only helps to make a considered choice but
develop arguments explaining why the policy was chosen in a logical and consistent
manner. The simulation was tested real time against the soil test samples of Vellore
district, Tamilnadu, India and the results proved consistent precision and accuracy than
other conventional decision making techniques.
References
[1] Atanassov K. T., “Intuitionistic fuzzy sets,” Fuzzy Sets and Systems, vol. 20, (1986), pp. 87–96.
[2] Pawlak Z. and Skowron A., “Rudiments of rough sets,” Information Science, An International Journal,
vol. 177 no. 1, (2007), pp. 3–27.
[3] De C., Radzikowska A. M. and Kerre E. E., “A fuzzy–rough approach to the representation of linguistic
hedges,” Technologies for Constructing Intelligent Systems 1 Studies in Fuzziness and Soft Computing,
vol. 89, (2002), pp. 33-42
[4] Garg H., “An approach for analyzing fuzzy system reliability using particle swarm optimization and
intuitionistic fuzzy set theory,” Journal of Multiple-Valued Logic and Soft Computing, vol. 3-4, (2013),
pp. 335-354
[5] Zeng A., Pan D., Zheng Q. L., “Knowledge Acquisition Based on Rough Set Theory and Principal
Component Analysis,” IEEE Intelligent Systems, (2006), pp. 78 – 85.
[6] Hsiao C. C., Yi W. K., “A predictor from numerical data based on fuzzy sets and rough sets,” 3rd
International Workshop on Advanced Computational Intelligence, IWACI, Suzhou, China, August 25-
27, (2010), pp. 139-144.
[7] Xu Z. S., Yager R. R., “Some geometric aggregation operators based on intuitionistic fuzzy ,”
sets.International Journal of General Systems, vol. 35, (2006), pp. 417–433.
[8] Deschrijver G., Kerre E., “Aggregation operators in interval-valued fuzzy and Atanassov’s intuitionistic
fuzzy set theory,” Studies in Fuzziness and Soft Computing, vol. 220, (2008), pp. 183–203.
[9] Kucukvar M., “Ranking the sustainability performance of pavements: An intuitionistic fuzzy decision
making method,” Automation in Construction, vol. 40, (2014), pp. 33–43.
[10] Cesar A. P., Carlos A. F., Silvia M. N., Rodolfo C.C. F. and Marco A. D. O., “Fuzzy–Bayesian network
for refrigeration compressor performance prediction and test time reduction,” Expert Systems with
Applications, vol. 39 no. 4, (2012), pp. 4268–4273.
[11] Liessman S. and John S., “Principal component analysis preprocessing with bayesian networks for
battery capacity estimation,” I2MTC, IEEE, (2013), pp. 98-101.
[12] Cagman N., Enginoglu S. and Citak F., “Fuzzy Soft Set Theory and Its Applications,” Iran Journal of
Fuzzy systems, vol. 8 no. 3, (2011), pp. 137-147.
[13] Jiang Y. and Tang Y. C., “An adjustable approach to intuitionistic fuzzy soft sets based decision
making,” Applied Mathematical Modeling, vol. 35, (2011), pp. 824-836.
[14] “http://agritech.tnau.ac.in/agriculture/agri_resourcemgt_soil.html.”
[15] Kucukvar M., Gumus S. E. G. and Tatari O., “Ranking the sustainability performance of pavements: An
intuitionistic fuzzy decision making method,” Automation in Construction, vol. 40, (2014), pp. 33-43.
[16] Chu C. H., Hung K. C. and Julian P., “A complete pattern recognition approach under Atanassov's
intuitionistic fuzzy sets,” Knowledge-Based Systems, vol. 66, (2014), pp. 36-45.
[17] Shu P. W. and Deng F. L., “Possibility mean and variance based method for multi-attribute decision
making with triangular intuitionistic fuzzy numbers,” Journal of Intelligent and Fuzzy Systems, vol. 24
no. 4, (2013), pp. 743-754.
[18] Klaus S., “Revolution in the paddy field,” Appropriate Technology, vol. 39 no. 4, (2012), pp. 38-41.
[19] Polat S., Aksoy A. and Unlu K., “A fuzzy rule based remedial priority ranking system for
contaminated sites,” Groundwater, May 19, (2014).
[20] Mueller L., Shepherd G., Schindler U., Ball B. C., Munkholm L. J., Hennings V., Smolentseva E.,
Rukhovic O., Lukin S. and Hu C., “Evaluation of soil structure in the framework of an overall soil
quality rating,” Soil and Tillage Research, vol. 127, (2013), pp. 74-84.
[21] Pilbeam C. J., Mathema B., Gregory P. J. and Shakya P. B., “Soil fertility management in the mid-hills
of Nepal: Practices and perceptions,” Agriculture and Human Values, vol. 22 no. 2, (2005), pp. 243-258.
[22] Allan L. J., “Building a web-based information system for variety selection in field crops—objectives
and results,” Computers and Electronics in Agriculture, vol. 32 no. 3, (2001), pp. 195–211.
[23] Lee W. S., Alchanatis V., Yang C., Hirafuji M., Moshou D. and Li C., “Sensing technologies for
precision specialty crop production,” Computers and Electronics in Agriculture, vol. 74 no. 1, (2010),
pp. 2–33.
[24] Marta C. P. and Carlos J. A. L., “Model for decision-making in agricultural production planning,”
Computers and Electronics in Agriculture, vol. 828, (2012), pp. 7–95.

International Journal of Multimedia and Ubiquitous Engineering
Vol.10, No.6 (2015)
328 Copyright ⓒ 2015 SERSC
Authors
K. Lavanya, she is working as Assistant Professor in the school
of computing science and engineering at VIT University, Vellore,
Tamilnadu, India. Her area of interests includes Distributed
Systems, Artificial Intelligence, High Performance computing and
Intelligent computing. She is currently doing her research work in
the interdisciplinary field of agriculture, computer science and tries
to solve out the problems in agriculture farming practices such as
marketing, crop management activities, disease control etc., using
machine learning techniques.
M. A. Saleem Durai, he received the MCA from Bharathidasan
University,Tiruchirapalli, Tamilnadu, India in 1998; M. Phil. from
from Madurai Kamaraj University, India in 2008 and completed his
PhD at VIT University Vellore,India in 2011. He is an Associate
Professor in the School of Computing Sciences and Engineering at
VIT University, Vellore, Tamilnadu, India. He has authored many
International and National journal papers to his credit. His research
interests include data mining, fuzzy logic, cloud computing and
rough sets. Mr. Saleem Durai is associated with many professional
bodies CSI and IEEE.
N. Ch. S. N. Iyengar, (1961) he is currently Senior Professor at
the School of Computing Science and Engineering at VIT
University, Vellore-632014, Tamil Nadu, India. His research
interests include Agent-Based Distributed Secure Computing,
Intelligent Computing, Network Security, Secured Cloud
Computing and Fluid Dynamics. He authored several textbooks
and had nearly 167 research publications in reputed peer reviewed
international journals. He served as PCM/reviewer for many
international conferences. He is Editor in Chief of International
Journal of Software Engineering and Applications( IJSEA) of
AIRCC, Guest Editor for Special Issue on Cloud Computing and
Services of International Journal of Communications, Network and
System Sciences and Editorial Board member for International
Journals like IJConvC (Inderscience -China) etc.