Embed Size (px)
Citation preview

Journal of Information Engineering and Applications www.iiste.org
ISSN 2224-5782 (print) ISSN 2225-0506 (online)
Vol.3, No.9, 2013
48
Site-Specific Assessment of Node B using Key Service Quality
Indicators over 3G/UMTS Networks from Outdoor Drive-Test
Measurements
Isabona Joseph and Konyeha. C. C
Department of Basic Sciences, Benson Idahosa University, PMB.1100, Benin City, Nigeria
Email: [email protected], [email protected] and [email protected]
Abstract
Periodic service quality monitoring of a deployed cellular communication network by means of an innovative
expert-driven field test analysis provides an in-depth understanding of the status and performances of the
network as well as of the statistical behaviour of the user population. Such knowledge allows for a better
engineering and operation of the whole network, and specifically the early detection of hidden risks and
emerging troubles. In this paper, an experimental performance assessment of Node B based on key quality
parameters considered for design, planning and network optimization was carried out via drive test at Ugbor
avenue, BIU Campus and Gapiona avenue, all located in G. R. A, Benin City. It was established that the Ec/lo
range measured for BEN 035 (BIU) indicates that the BS will be able to support services demanded by more
subscribers accessing the network. Proper tuning is required on this BTS to eliminate the possibility of noise
interference by this BS on nearby BSs when the loading is low. It was discovered that the QoS is very poor in the
environs of BEN026, with the result that UEs will not be able to access data due to rapid data rate decreases,
network login difficulty, difficulty in call initiation, no network, and high call drop rate. Hence the CPICH power
level should be adjusted so that base station can provide service to users; however this does not guarantee that
the interference caused by other nearby base stations is within the acceptable range to establish the session. At
BEN 098 (Gapiona avenue) the Ec/lo is below the standard which is -9 dB for data which low means the QoS at
Gapiona avenue is very poor and can only serve for voice calls with no data capacity whatsoever. The bond
between RSSI/RSCP and Ec/Io performance at the different measurement locations of Node B were also
assessed. It was observed from the results that Ec/Io degrades when RSSI/RSCP decreases. Degrading Ec/Io can
be an indication of increased other cell interference which will also increase the need for downlink traffic power.
1. Introduction
The market for cellular and personal communication system (PCS) services has experienced
tremendous growth in the recent years. Today millions of people around the world use cellular phones. It is
estimated in [1] that by 2013, about 350 million people will be connected to the cellular communications
network, which means approximately 200,000 new subscribers every day or 140 new subscribers every minute.
This rapid worldwide growth in cellular telephone subscribers especially over these past two decades has
evidently showed that the wireless communication is an effective means for transferring information in today’s
society.
The cellular communication network has gone through three generations and is now evolving toward
the fourth generation. The evolution has been driven by ever the increasing demand and technological
development. First generation (1G) systems developed in the early 1980s employs a frequency division multiple
access (FDMA) system, in which the bandwidth is divided into a number of channels and distributed among
users with a finite portion of bandwidth for permanent use. Second generation (2G) systems deployed in the
early 1990s uses a Time Division Multiple access (TDMA) in which in the entire bandwidth is available to the
user but only for a finite period of time. Although 2G wireless system, such as the GSM is successful in many
countries, they cannot still meet the requirement of high speed data and user capacity in densely areas, since they
were designed with voice-oriented services in mind. Consequently, only a limited number of messaging and data
services are supported. This limitation in 2G systems piloted the development of third generation (3G)
communication systems. The 3G have been created to support the effective delivery of high-speed packet data
services. 3G employs Code Division Multiple Access (CDMA), in which all the users occupy the same
bandwidth; however they are all assigned separate codes, which differentiate them from each other.
Recently, in [2], it has also been estimated that 3G hand set shipments will exceed GSM shipment and
the shipment will approach approximately one billion (1 billion) by 2013. A specific report on 3G-CDMA
subscribers’ growth forecast is showed in figure 1

Journal of Information Engineering and Applications www.iiste.org
ISSN 2224-5782 (print) ISSN 2225-0506 (online)
Vol.3, No.9, 2013
49
Fig 1: GSM and 3G CDMA growth forecast [2]
And the curve is still headed upward as subscribers take advantage of new data services offered by the
3G-CDMA based networks at an exhilarating rate.
To maintain the above growth and retain existing customers, as well as attracting new ones, the wireless
service providers need to deliver new services, consistently, reliably and economically. More importantly,
wireless service providers must be ready to continue to maintain the highest quality of service (QoS) to both
residential and industrial subscribers. That is where network performance assessment monitoring for
optimization comes in. This work will show how well the QoS performs over the 3G/UMTS wireless network
via measurement-based performance monitoring.
2. Problem Statement/ Research Motivation
Capacity increase was one of the main motivations for introducing 2G systems in the early 1990s.The
advent of 2G-based radio mobile communication such as the GSM started its commercial operation in Nigeria in
2001. GSM system is very good at delivering voice services to its subscribers, and is the most common 2G
system in all over the world. However, for data service, the situation is not the same. This has led to continuous
network facility upgrade over existing GSM system in order to support more efficient data services.
Recently, a totally new air interface, namely third generation (3G)-based WCDMA air interface for UMTS
is being deployed on existing GSM core network in Nigeria with the goal of supporting more efficient data
services. The introduction of 3G wireless networks has brought some new services such as video and data
services that were not available in 2G GSM networks.
Specifically, in 2007, four applicants were successful in obtaining a 10MHz lot each in the 2GHz band for
third generation (3G) mobile services in Nigeria. The successful operators were: Alheri Engineering Celtel, now
Airtel Nigeria, GloMobile and MTN Nigeria Communications. In early 2008, GloMobile launched the first
commercial 3G service on their UMTS/HSPA network, followed closely by MTN.
Despite the good number on telecom companies operating the 3G-CDMA based technology and
services mentioned above, subscribers’ satisfaction and quality of service (QoS) in some part of the country is
far below expectation. There has been series of complaints arising from frequent call outages, call conversation
echoes, drop calls, among others, from mobile subscribers. Some users even resort to the option of subscribing to
more than one service provider, just to maintain seamless connectivity, thereby losing a fortune to the network
operators. A rising churn rate (i.e. number of subscribers cancelling a contract and setting up a new one with a
competitor operator) is an indicator that there might also be something wrong in the technical field.
Moreover, UMTS network planning is far more complicated than GSM voice planning [3]. Because in
UMTS, it is not possible to think of minimum received signal level to achieve one maximum interference
threshold. Each service needs a specific threshold values and also network behavior changes with traffic.
Accordingly, once a commercial telecommunication network starts its operation, the service providers must
continually monitor the network for performance assessment throughout life cycle. This is to aid the network for
optimisation purposes. This arises from traffic growth and geographical coverage demands with QoS guarantee,
continuous changes in the radio path, including the addition of new buildings, growth of trees, changing foliage
conditions and equipment deterioration, all of which contribute in the RF properties in the system [4]. In addition,
interference levels changes as new cells are added (including interference from competing networks), and as the
subscriber base increases, or the geographic distribution of traffic changes
Performance measurement is an effective means of assessing or scanning the whole network at any time and
systematically searching for errors, bottlenecks and suspicious behaviour.
In this paper, we present a measurement-based network performance assessment of a pioneer UMTS
network service provider, operating in typical built-up environments, by tackling those QoS performance
parameters such as received signal code power (RSCP) and the energy per chip to total received power (Ec/Io),

Journal of Information Engineering and Applications www.iiste.org
ISSN 2224-5782 (print) ISSN 2225-0506 (online)
Vol.3, No.9, 2013
50
among others, that most influence their planned service quality of the system. For confidential and legal
purposes, the names of the service provider will be designated as Operator A throughout the research.
3. Node B in UMTS
Node B corresponds to the Base Transceiver Station (BTS) in UMTS. Node B can manage one or more cells
connected to RNC over interface Iub. Node B includes CDMA receiver which convert the radio interface signal
into data stream and then forward to radio network controller (RNC) over Iub interface. The CDMA transmitter
prepares incoming data for transport over radio interface and routes it to power amplifier, and because of the
large distance between the RNC and the Node B time critical tasks are not stored in RNC. The RNC knows the
exact picture of the cell current situation and makes a sensible decision on power control, handover and call
admission control. The mobile station and Node B continuously measures the quality of connection and
interference level and the result is transmitted to RNC. Node B, in some cases handles the splitting and
combining data streams of different sectors [5]. Specifically, the Node B has as main tasks to make the
transmission and reception of radio signal, filtering of the signal, amplification, modulation and demodulation of
the signal and be an interface to the Radio Network Controller (RNC) [6]. The Common Pilot Channel (CPICH)
transmits a carrier used to estimate the channel parameters; is the physical reference for other channels. It is used
to control power, consistent transmission and detection, cannel estimation, measurement of adjacent cells and
obtaining of the Scrambling Code (SC) [3].
4. Key Drive-Test Service Quality Parameters
When a network is tested from the radio interface, normally using drive-test equipment, a set of quality
parameters and indicators can be obtained. The most relevant ones for the assessment of a are network are[7][8]:
- Radio link quality parameters, mainly CPICH Received Signal Code Power (RSCP) and CPICH Ec/Io.
- Radio Resource Management data, related to Neighbors Lists, Handover parameters, Cell Reselection
procedures and Active Set Management.
- Quality of Service indicators, measuring Throughput in MAC and Application Layers, Block Error Rate
(BLER) and Mean Opinion Score (MOS) for video quality.
4.1 RSCP Parameter
RSCP stands for Received Signal Code Power – the energy per chip in CPICH averaged over 512 chips. It is the
collected RF energy after the correlation / descrambling process, usually given in dBm. In our previous work in
[9], an experimental study of UMTS radio signal propagation characteristics was carried for signal coverage
monitoring and prediction by field measurement in the present study locations. Though, experience shows that,
at the coverage borders, measuring a parameter comparable to the field strength (in UMTS expressed as RSCP)
is sufficient to evaluate coverage. However, for proper function of UMTS equipment, it is not only sufficient to
provide enough field strength. Moreover, for the downlink, CPICH coverage should be verified by considering
not only if the received signal code power (RSCP) of the pilot channel (CPICH) is sufficient once all the margins
are included, but also by estimating the level of interference generated by the other cells. Such interference is
typically quantified by the energy per chip to total received power (Ec/Io) of the CPICH. Such quantity
effectively estimated how much of the received signal can be used at a given location, or put it in other word,
how clean is the signal received.
4.2 Ec/Io Service Parameter
Ec/Io is the ratio of the energy per chip in CPICH to the total received power density (including CPICH itself).
This is the ratio of the received energy per chip (= Ec) and the interference level (Io), usually given in dB. Io =
own cell interference + surrounding cell interference + noise density. In case no true interference is present, the
interference level is equal to the noise level. Interference is typically measured by the energy per chip to total
received power (Ec/Io) of the CPICH, that is to say, how clear is the signal that is received. Ec/Io is defined by
the pilot cannel, is measured before of the dispreading, all channels contribute to the total power of Io. Therefore
it is possible that even at a location close to a base station, with a high RSCP; no logon is possible, due to high
interference levels from a second nearby base station. This effect is called “pilot pollution” and network planners
try to avoid too close spacing of base stations to minimize regions where it can occur. The value of Ec/Io must
be -9dB or higher in 95% of coverage area, so that a UE is associated with a Node B and set in a voice call [10].
4.3 RSSI Parameter
The Received Signal Strength Indicator (RSSI) is a value that takes into account both RSCP and Ec/I0. It is
calculated in dBm by [11]:
RSSI[dBm] = RSCP[dBm] - Ec/I0[dB] (1)
RSSI is used to measure the power between the received radio signals [12]. For each Node B, there is a threshold
point below which connection break with active base station. Therefore the signal strength must be greater than
threshold point to maintain the connection with active base station. The signal gets weaker as mobile moves far

Journal of Information Engineering and Applications www.iiste.org
ISSN 2224-5782 (print) ISSN 2225-0506 (online)
Vol.3, No.9, 2013
51
away from active base station and gets stronger signal towards new base station as it move closer. As with RSCP
and Ec/I0, it can only be measured in the code domain and needs the special monitoring equipment as described
above.
5. Drive-Test Equipment and Measurement locations
The measurements were conducted from a UMTS network of a Nigerian telecom operator with Node B,
located at the BIU Campus, Ugbor and Gapiona Avenues, all evenly distributed in Government Reservation
Area (GRA), Benin City. The driving routes in these different locations are shown in figure 2-4. The measured
(Ec/Io) and RSCP at different transmitter-receiver (T-R) separation distance (d) are recorded in dB and dBm
respectively. Every point of measurements is recorded evenly from all the predefined routes of three base
stations. Each measurement point is represented in an average of a set of samples taken over a small area (10m2)
in order to remove the effects of fast fading [13].
The data collection tool consisted of ERICSSON TEMS (i.e. a 3G Test Mobile Systems) Cell-Planner
tool with an antenna mounted on a moving vehicle 1.5 meter above ground level, Global Positioning System
Receiver Set (GPS system) and a personal computer and a piece of compass. The personal computer houses the
operating system and the data collection software (ERICSSON TEMS Investigation 8.0). The personal computer
serves as the communication hub for all other equipment in the system. The GPS operates with global
positioning satellites to provide the location tracking for the system during data collection position on a global
map which has been installed on the personal computer. The compass help to determine the various azimuth
angles of the base station transmitters. Average height of transmit antenna is about 30 – 32 meter above ground
level, with the same transmit power. Sampling rate of the collected data, on the average, is about 2 – 3 samples
per meter. Figure 2 shows a scheme of equipment we have used in the measurements.
Figure 2: Measurement equipment
The TEMS software simulates the drive test in real time, that is, it shows the path taken as well as the different
Rx levels with different colour codes, as shown in Figure. 3. The green colour is the best case signal reception (-
70~-10), red being the worst case (-120~-100), that is, almost no signal and intermediate colours (for example,
orange) are regions of call drops or bad quality signal.
Figure 3: Drive Test Simulation using a Probe
6. Results and Discussion
Figs. 4a – 6a and figs 4b – 6b below show the plot of Ec/lo at various distance of from the Base Station and their
analysis solution worksheetof drive test areas for BIU Campus, Gapiona Avenue and Ugbor Avenue. We have
fitted a line of best fit to the graphs in 4a – 6a to predict an optimized QoS for each area plotted.

Journal of Information Engineering and Applications www.iiste.org
ISSN 2224-5782 (print) ISSN 2225-0506 (online)
Vol.3, No.9, 2013
52
Figure 4a: Plot of Ec/lo vs distance for BEN 035 (BIU)
Figure4b: Ec/Io distribution worksheet for site BEN 035 in drive test area
The trend line fitted indicates that the QoS decreases with increase in the distance of the UE from the base
station as expected. This is expected but the implication of this is that data rate decreases, network logging
becomes impossible, calls cannot be initiated, network signal disappears, and calls are dropped. This low
throughput could have been caused by the effect of missing neighbours, low 3G network coverage or no 3G
network coverage at all. The Ec/lo range measured for BEN 035 (BIU) is between -12 and -7.5. Using our model
where Ec/Io = -0.001(d) - 9.3129 we can improve the Ec/lo to between -10.1 and -9.4 which is comparable to the
standard which is -9 dB for data services.
Figure 5a: Plot of Ec/lo vs distance for BEN 026 (UGBOR)
Ec/Io = -0.001(d) - 9.3129
-13
-12
-11
-10
-9
-8
-7
-6
0 100 200 300 400 500 600 700 800
Ec/
Io(d
B)
Distance (m)
Ec/Io(dB)
线性 (Ec/Io(dB))
y = -0.0088x - 7.2361
-18
-16
-14
-12
-10
-8
-6
-4
-2
0
0 100 200 300 400 500 600 700 800 900
Ec/
Io(d
B)
Distance (m)
Ec/Io(dB)
线性 (Ec/Io(dB))
Journal of Information Engineering and Applications www.iiste.org
ISSN 2224-5782 (print) ISSN 2225-0506 (online)
Vol.3, No.9, 2013
53
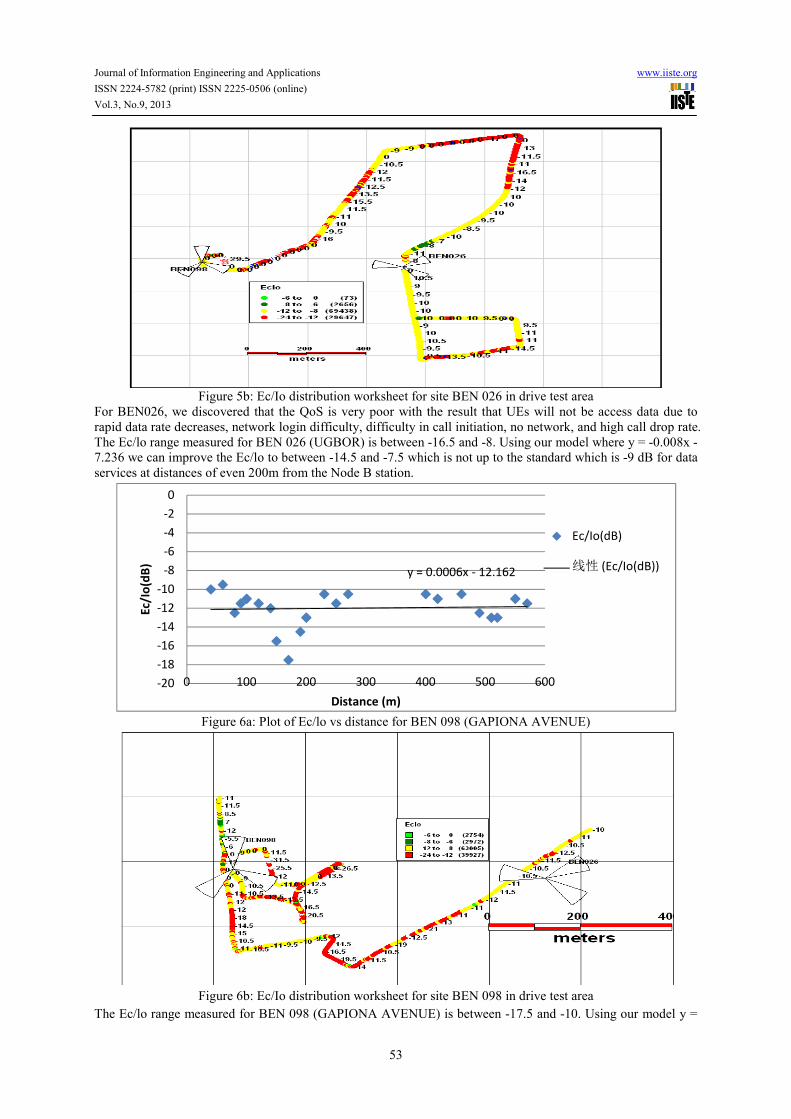
Figure 5b: Ec/Io distribution worksheet for site BEN 026 in drive test area
For BEN026, we discovered that the QoS is very poor with the result that UEs will not be access data due to
rapid data rate decreases, network login difficulty, difficulty in call initiation, no network, and high call drop rate.
The Ec/lo range measured for BEN 026 (UGBOR) is between -16.5 and -8. Using our model where y = -0.008x -
7.236 we can improve the Ec/lo to between -14.5 and -7.5 which is not up to the standard which is -9 dB for data
services at distances of even 200m from the Node B station.
Figure 6a: Plot of Ec/lo vs distance for BEN 098 (GAPIONA AVENUE)
Figure 6b: Ec/Io distribution worksheet for site BEN 098 in drive test area
The Ec/lo range measured for BEN 098 (GAPIONA AVENUE) is between -17.5 and -10. Using our model y =
y = 0.0006x - 12.162
-20
-18
-16
-14
-12
-10
-8
-6
-4
-2
0
0 100 200 300 400 500 600
Ec/
Io(d
B)
Distance (m)
Ec/Io(dB)
线性 (Ec/Io(dB))

Journal of Information Engineering and Applications
ISSN 2224-5782 (print) ISSN 2225-0506 (online)
Vol.3, No.9, 2013
0.000001x - 12.16 we cannot improve the Ec/lo up
at Gapiona avenue is very poor and can only serve for voice calls with no data capacity whatsoever.
Presented in figures 7-9are charts showing the bond between RSSI/RSCP and Ec/Io values at the
different measurement location of Node B. It can be observed from the charts that Ec/Io degrades when
RSSI/RSCP decreases. Degrading Ec/Io is an indication of increased other cell interference which will also
increase the need for downlink traffic power. Pow
may not be available, thus the coverage not being met in loaded condition: this represent the coverage and
capacity trade-off for the downlink in a WCDMA systems. Also, looking at the charts,
most sensitive parameter to observe. However, UMTS network planners mostly design their network to provide
certain RSCP and Ec/Io values. Moreover, it should be noted that the total received signal power (Received
Signal Strength Indicator – RSSI) is never considered in a WCDMA system as an
mainly due to the inability to estimate the quality by this value: 10 weak cells would result in a strong RSSI, but
the lack of any dominant server would yield poor system performance. This concept is sometime called pilot
pollution, where multiple servers contribute to a high RSSI, but where the signal cannot be used due to lack of
strong dominant server.
Figure 7: Ec /Io assessment at different RSSI/RSCP in site
Figure 8: Ec /Io assessment at different RSSI/RSC
-80
-75
-70
-65
-60
-55
-7.5 -11.5 -10.5
RS
SI/
RS
CP
(dB
m)
Energy per chip to total received power,Ec/Io
-83
-73
-63
-53
-43
RS
SI/
RS
CP
(dB
m)
Energy per chip to total received power,Ec/Io (dB)
Journal of Information Engineering and Applications
0506 (online)
54
12.16 we cannot improve the Ec/lo up to the standard which is -9 dB for data which means the QoS
at Gapiona avenue is very poor and can only serve for voice calls with no data capacity whatsoever.
9are charts showing the bond between RSSI/RSCP and Ec/Io values at the
fferent measurement location of Node B. It can be observed from the charts that Ec/Io degrades when
RSSI/RSCP decreases. Degrading Ec/Io is an indication of increased other cell interference which will also
increase the need for downlink traffic power. Power being a limited resource, the higher required transmit power
may not be available, thus the coverage not being met in loaded condition: this represent the coverage and
off for the downlink in a WCDMA systems. Also, looking at the charts, the RSSI seems to be the
most sensitive parameter to observe. However, UMTS network planners mostly design their network to provide
certain RSCP and Ec/Io values. Moreover, it should be noted that the total received signal power (Received
RSSI) is never considered in a WCDMA system as an indication of coverage. It is
mainly due to the inability to estimate the quality by this value: 10 weak cells would result in a strong RSSI, but
the lack of any dominant server would yield poor system performance. This concept is sometime called pilot
lution, where multiple servers contribute to a high RSSI, but where the signal cannot be used due to lack of
Figure 7: Ec /Io assessment at different RSSI/RSCP in site BEN-035
Figure 8: Ec /Io assessment at different RSSI/RSCP in site BEN-098
10.5 -9.5 -9.5 -10 -10.5 -8 -10 -11
Energy per chip to total received power,Ec/Io (dB)
Energy per chip to total received power,Ec/Io (dB)
www.iiste.org
9 dB for data which means the QoS
at Gapiona avenue is very poor and can only serve for voice calls with no data capacity whatsoever.
9are charts showing the bond between RSSI/RSCP and Ec/Io values at the
fferent measurement location of Node B. It can be observed from the charts that Ec/Io degrades when
RSSI/RSCP decreases. Degrading Ec/Io is an indication of increased other cell interference which will also
er being a limited resource, the higher required transmit power
may not be available, thus the coverage not being met in loaded condition: this represent the coverage and
the RSSI seems to be the
most sensitive parameter to observe. However, UMTS network planners mostly design their network to provide
certain RSCP and Ec/Io values. Moreover, it should be noted that the total received signal power (Received
indication of coverage. It is
mainly due to the inability to estimate the quality by this value: 10 weak cells would result in a strong RSSI, but
the lack of any dominant server would yield poor system performance. This concept is sometime called pilot
lution, where multiple servers contribute to a high RSSI, but where the signal cannot be used due to lack of
035
098
RSCP(dBm)
RSSI(dBm)
RSCP(dBm)
RSSI(dBm)

Journal of Information Engineering and Applications
ISSN 2224-5782 (print) ISSN 2225-0506 (online)
Vol.3, No.9, 2013
Figure 9: Ec /Io assessment at different RSSI/RSCP in site
7. Conclusion
The current evolution of 3G networks worldwide is driven by new and faster data services and the introduction
of HSDPA technology to support it. This growth
configuration in order to offer the required transmission capacity while maintaining the Quality of Service (QoS)
indicators above acceptable levels.
One of the major drawbacks of Wideband Code Divis
the Universal Mobile Telecommunications System (UMTS), is that its performance is highly dependent on the
interference level, which at the same time is related to the load of the cells. This makes crucia
optimization process that ensures the minimum interference levels by adjusting the configuration of some
parameters of the network, so as to reach the maximum feasible QoS.All possible optimization techniques start
with the measure of Key Performance Indicators (KPI) obtained at different elements of the Network. The most
used are the Operations and Maintenance Centre (OMC) and the Testing Equipment (Call
Drive-Test (DT) tools).
In this paper, we have studied the QoS of th
We have concluded that the Ec/lo range measured for BEN 035 (BIU) is between
the BTS will be able to support services demanded by more subscribers accessing the network. With
tuning using our model we can improve the Ec/lo to between
which is -9 dB for data services. This tuning is required to eliminate the possibility of noise interference by this
BTS on nearby BTSs when the loading is low. We discovered that the QoS is very poor in the environs of
BEN026, with the result that UEs will not be able to access data due to rapid data rate decreases, network login
difficulty, difficulty in call initiation, no network, and hi
adjusted so that base station can provide service to the users; however this does not guarantee that the
interference caused by other nearby base stations is within the acceptable range to establish the se
098 (GAPIONA AVENUE) the Ec/lo is between
up to the standard which is -9 dB for data which means the QoS at Gapiona Avenue is very poor and can only
serve for voice calls with no data capacity whatsoever. We suggest re
meet the service quality requirement for the area.
References
[1] Agrawal, A. (2009). Trends in Wireless Communication.
wwww.ieee-infocom.org/docs/infocom
[2] CDG, (2011). CDMA2000 Market Trend
[3] Jaana, L., Achim, W. and Tomás, N. (2006). “Radio Network Planning and Optimization for UMTS,” 2nd
Edition, John Wiley and Sons, Hoboken.
[4] www.agilent.com/find/wireless
[5] Qinqing Zhang MooiChooChuah (2006).
LANS.: Springer Science-l-Business Media, Inc.
-100
-90
-80
-70
-60
-50
-40
-8.5
-9.5 -8
-8.5
RS
SI/
RS
CP
(dB
m)
Energy per chip to total received power, Ec/Io (dB)
Journal of Information Engineering and Applications
0506 (online)
55
Figure 9: Ec /Io assessment at different RSSI/RSCP in site BEN-026
The current evolution of 3G networks worldwide is driven by new and faster data services and the introduction
of HSDPA technology to support it. This growth adds more constraints to the Radio Access Network (RAN)
configuration in order to offer the required transmission capacity while maintaining the Quality of Service (QoS)
One of the major drawbacks of Wideband Code Division Multiple Access (WCDMA)-based technologies, like
the Universal Mobile Telecommunications System (UMTS), is that its performance is highly dependent on the
interference level, which at the same time is related to the load of the cells. This makes crucia
optimization process that ensures the minimum interference levels by adjusting the configuration of some
parameters of the network, so as to reach the maximum feasible QoS.All possible optimization techniques start
ormance Indicators (KPI) obtained at different elements of the Network. The most
used are the Operations and Maintenance Centre (OMC) and the Testing Equipment (Call
In this paper, we have studied the QoS of three UMTS type 3G network BTSs in G.R.A, Benin City.
We have concluded that the Ec/lo range measured for BEN 035 (BIU) is between -12 and
the BTS will be able to support services demanded by more subscribers accessing the network. With
tuning using our model we can improve the Ec/lo to between -10.1 and -9.4 which is comparable to the standard
9 dB for data services. This tuning is required to eliminate the possibility of noise interference by this
en the loading is low. We discovered that the QoS is very poor in the environs of
BEN026, with the result that UEs will not be able to access data due to rapid data rate decreases, network login
difficulty, difficulty in call initiation, no network, and high call drop rate. The CPICH power level should be
adjusted so that base station can provide service to the users; however this does not guarantee that the
interference caused by other nearby base stations is within the acceptable range to establish the se
098 (GAPIONA AVENUE) the Ec/lo is between -17.5 and -10. Using our model we cannot improve the Ec/lo
9 dB for data which means the QoS at Gapiona Avenue is very poor and can only
capacity whatsoever. We suggest re-planning and re-dimensioning the BTS to
meet the service quality requirement for the area.
[1] Agrawal, A. (2009). Trends in Wireless Communication.
infocom.org/docs/infocom
0 Market Trends and Facts, www.cdg.org.
[3] Jaana, L., Achim, W. and Tomás, N. (2006). “Radio Network Planning and Optimization for UMTS,” 2nd
Edition, John Wiley and Sons, Hoboken.
qing Zhang MooiChooChuah (2006). Design and Performance of 3G Wireless Networks and wireless
Business Media, Inc.
-8.5
-10
-9.5 -9
-10.5
-10
-11
-12
-14.5
-13
-16.5
Energy per chip to total received power, Ec/Io (dB)
www.iiste.org
026
The current evolution of 3G networks worldwide is driven by new and faster data services and the introduction
adds more constraints to the Radio Access Network (RAN)
configuration in order to offer the required transmission capacity while maintaining the Quality of Service (QoS)
based technologies, like
the Universal Mobile Telecommunications System (UMTS), is that its performance is highly dependent on the
interference level, which at the same time is related to the load of the cells. This makes crucial to find an
optimization process that ensures the minimum interference levels by adjusting the configuration of some
parameters of the network, so as to reach the maximum feasible QoS.All possible optimization techniques start
ormance Indicators (KPI) obtained at different elements of the Network. The most
used are the Operations and Maintenance Centre (OMC) and the Testing Equipment (Call-Tracing terminals and
ree UMTS type 3G network BTSs in G.R.A, Benin City.
12 and -7.5, indicating that
the BTS will be able to support services demanded by more subscribers accessing the network. With proper
9.4 which is comparable to the standard
9 dB for data services. This tuning is required to eliminate the possibility of noise interference by this
en the loading is low. We discovered that the QoS is very poor in the environs of
BEN026, with the result that UEs will not be able to access data due to rapid data rate decreases, network login
gh call drop rate. The CPICH power level should be
adjusted so that base station can provide service to the users; however this does not guarantee that the
interference caused by other nearby base stations is within the acceptable range to establish the session. At BEN
10. Using our model we cannot improve the Ec/lo
9 dB for data which means the QoS at Gapiona Avenue is very poor and can only
dimensioning the BTS to
[3] Jaana, L., Achim, W. and Tomás, N. (2006). “Radio Network Planning and Optimization for UMTS,” 2nd
Design and Performance of 3G Wireless Networks and wireless
-15.5
RSSI(dBm
)RSCP(dB
m)

Journal of Information Engineering and Applications www.iiste.org
ISSN 2224-5782 (print) ISSN 2225-0506 (online)
Vol.3, No.9, 2013
56
[6] Tachikawa, K. (2002). “WCDMA Mobile Communications Sys-tem,” John Wiley & Sons, Hoboken.
[7] Isabona, J and Azi, S.O (2013). Performance Optimisation of CDMA2000 Cellular Networks in South-South
Nigeria, Ph.D Thesis, Faculty of Physical Sciences, University of Benin, Benin City.
[8]WCDMA Network Planning and Optimization 80-W0853-1, Revision B, QUALCOMM, Mayo 2006.
[9] Isabona, J. and Konyeha, C. C. (2013). Experimental Study of UMTS Radio Signal Propagation
Characteristics by Field Measurement. American Journal of Engineering Research (AJER) Vol. 2, Issue 7,
pp-99-106.
[10] Sonia Jazmín .P. R., Sergio Vidal, B., José Iván , Z. C. and Mariana A. E. G. (2011). Analysis of
Performance of Node B. www.cisce.escom.ipn.mx/papers/4.pdf
[11] ECC Report (2007): UMTS Coverage Measurement, Electronic Communications Committee Report 103
within the European Conference of Postal and Telecommunications Administrations (CEPT)
[12] Maitham Al-Safwani and Asrar U.H. Sheikh, “Signal Strength Measurement at VHF in the Eastern Region
of Saudi Arabia”, The Arabian Journal for Science and Engineering, Vol. 28, No.2C, pp.3 -18, December
2003.
[13] Tachikawa. K. (2002). WCDMA Mobile Communications System, John Wiley & Sons, pp 78-83.
Joseph Isabona is a lecturer in the department of Basic Sciences (Physics Unit),
Benson Idahosa University, Benin City, Nigeria. He received Ph.D and M.Sc. degrees
in Physics Electronics, 2013 and 2007 from the University of Benin and Uyo
respectively, and a B.Sc in Physics in 2003, from Ambrose Alli University, Ekpoma,
Edo State. He is a member of the Nigerian Association of Mathematical Physics
(NAMP) and Nigeria Institute of Physics. He has published both nationally and
internationally in the area of wireless communications. His area of specialization is
signal processing and radio resource management in wireless networks.
Konyeha Cyprian is an academic staff of Benson Idahosa University, Benin City, where
he lectures Physics and Electronics subjects. He received an M.Eng. degree in Electronics
and Telecoms Engineering from the University of Benin in 2008 and an MBA degree
from the University of Lagos in 2004. He is a member of Nigeria Society of Engineers.
His research Interests include RF planning and optimization for 2G, 3G and 4G mobile
networks, communication networks simulation using opnet ITGAE and NS2, simulation
and field studies of WLANs, WLAN security, studies in wireless sensor networks,
software defined radio, communication channel performance enhancement.

This academic article was published by The International Institute for Science,
Technology and Education (IISTE). The IISTE is a pioneer in the Open Access
Publishing service based in the U.S. and Europe. The aim of the institute is
Accelerating Global Knowledge Sharing.
More information about the publisher can be found in the IISTE’s homepage:
http://www.iiste.org
CALL FOR JOURNAL PAPERS
The IISTE is currently hosting more than 30 peer-reviewed academic journals and
collaborating with academic institutions around the world. There’s no deadline for
submission. Prospective authors of IISTE journals can find the submission
instruction on the following page: http://www.iiste.org/journals/ The IISTE
editorial team promises to the review and publish all the qualified submissions in a
fast manner. All the journals articles are available online to the readers all over the
world without financial, legal, or technical barriers other than those inseparable from
gaining access to the internet itself. Printed version of the journals is also available
upon request of readers and authors.
MORE RESOURCES
Book publication information: http://www.iiste.org/book/
Recent conferences: http://www.iiste.org/conference/
IISTE Knowledge Sharing Partners
EBSCO, Index Copernicus, Ulrich's Periodicals Directory, JournalTOCS, PKP Open
Archives Harvester, Bielefeld Academic Search Engine, Elektronische
Zeitschriftenbibliothek EZB, Open J-Gate, OCLC WorldCat, Universe Digtial
Library , NewJour, Google Scholar


![[Site Name] [Node Title] [Node Changed Custom Y m d] (34)](https://img.pdfslide.us/doc/110x75/577cdd3c1a28ab9e78ac8deb/site-name-node-title-node-changed-custom-y-m-d-34.jpg)
![[site-name] - [node-title] - [node-changed-custom-Y-m-d] (1).pdf](https://img.pdfslide.us/doc/110x75/577cdd3c1a28ab9e78ac8de5/site-name-node-title-node-changed-custom-y-m-d-1pdf.jpg)