Embed Size (px)
Citation preview

Page 1/21
Intrinsic Parametric Approach to GroundwaterVulnerability Assessment: A Case Study of Ijero MiningSite, Ijero-Ekiti.Ayodele O. Falade ( [email protected] )
Achievers UniversityTemitope E. Oni
federal Polytechnic Ado EkitiAkinfolayan Oyeneyin
Achievers University
Research Article
Keywords: Aquifer, Vertical Electrical Sounding (VES), longitudinal conductance (LC), Geo-electric LayerSusceptibility Indexing (GLSI), Resistivity
Posted Date: September 23rd, 2021
DOI: https://doi.org/10.21203/rs.3.rs-790326/v1
License: This work is licensed under a Creative Commons Attribution 4.0 International License. Read FullLicense

Page 2/21
AbstractThe research was conducted to unravel the aquifer protective capacity and groundwater yield of theenvironment of a mining site at Ijero-Ekiti, Nigeria. The electrical resistivity method was employed and datagotten were used in combining the conventional longitudinal conductance and a new approach that indexesthe resistivity and thickness considering some layers which could be protective and have low resistivity likeclay material. The area is characterized by the Nigeria Basement Complex consisting of Precambrian rocks,made up of the migmatite gneiss, amphibole schist, quartzite, calc gneiss, schist biotite gneiss, biotite-schist,epidiorite, pegmatite and granite. A total of 9 points were sounded with maximum current electrode separationof 50 – 80 m. The sounding data were interpreted with the aid of partial curve-matching and computeriteration. Result of the interpretation of the geophysical data shows that the area is composed of variablesubsurface layering that ranges from three to four layers. Groundwater potential zones were delineated basedon the geo-electrical data. The study reveals that VES 1, 3, 4, 5 and 8 have high to medium groundwaterpotential. However, VES 2, 6 and 9 are characterized by low groundwater potential. The distinct aquiferprotective zones identi�ed in the study area using longitudinal conductance and geoelectric layer susceptibilityindexing are poor and weak. The study has been able to detect the groundwater yield and the protectivecapacity of the overburden in the northeastern part of Ijero-Ekiti where a mining site is located using electricalmethod. Geochemical analysis of water and soil samples from the area is recommended to understand theright treatment required for some of the groundwater sources for drinking.
IntroductionMining has proven its signi�cant role in the global economic growth. This starts from huge bene�ts derived bythe operating companies, a source of revenue to the government and employment generation to a large numberof people. However, the negative impact of mining on the environment at local, regional and global levelscontinues to be a general interest (Obiora, 2015). Mining is often referred to as a practice that has negativeimpact on environment of both extent and diversity. Tahseen (2016) listed some of these effects to includebiodiversity loss, formation of sinkhole, erosion and groundwater contamination by impurities from the miningprocess especially in open-pit mining.
Water is natural gift given to us by nature, a basic and a non-negotiable ingredient that supports life just like air.Water is generally de�ned as a universal solvent because it is a valuable natural asset, an essential necessityfor human, and a prime resource (National Water Policy, 1987). According to Oladejo et al., 2013; Akinrinadeand Adesina, 2016; Adagunodo et al., 2018; Anomohanran et al., 2017; Emenike et al.,2017, Water is the mostvital natural resource that sustains life and could be gotten from surface �ow as rivers and streams, thetroposphere as rain, and subsurface �ow as groundwater.
Groundwater is water that occurs in saturated zone with the source mainly from atmospheric precipitation,which has percolated down into the subsurface (Obiora et al., 2015; Kwami et al., 2018). Porous and fracturedrock formations (aquifer) in the subsurface abhor groundwater and are identi�ed through scienti�c methodsbefore locating and extracting groundwater (Todd, 1980; Adagunodo, 2017). Naturally, Groundwater is excellentin quality, often having nothing to do with colour, pathogens, turbidity, and can be consumed/taken directly
Page 3/21
without being treated (Jain et al., 1996). It has peculiar features which makes it appropriate for public supplyand therefore an indispensable resource (Offodile, 1983).
In the Basement Complex environment in Africa, groundwater exploration is often conducted using VerticalElectrical Sounding (VES) (Olasehinde and Bayewu, 2011; Oloruntola and Adeyemi, 2014, Falade et al., 2019).The success rate achieved in the exploitation of groundwater within the basement complex terrain requires acomprehensive knowledge of the hydro-geological properties of the aquifer units with respect to howsusceptible/vulnerable they are to environmental contamination/pollution.
Contamination of groundwater occurs when constituents or materials of different chemical composition andunhealthy bene�t for human, comes in contact with groundwater and its pot-ability altered. The pot-ability ofgroundwater can be altered by leachate from waste sites, saline intrusion, mining activities, oil spillage, sewage(from underlined petroleum pipes, latrines and septic tanks) (Obiora et al., 2015).
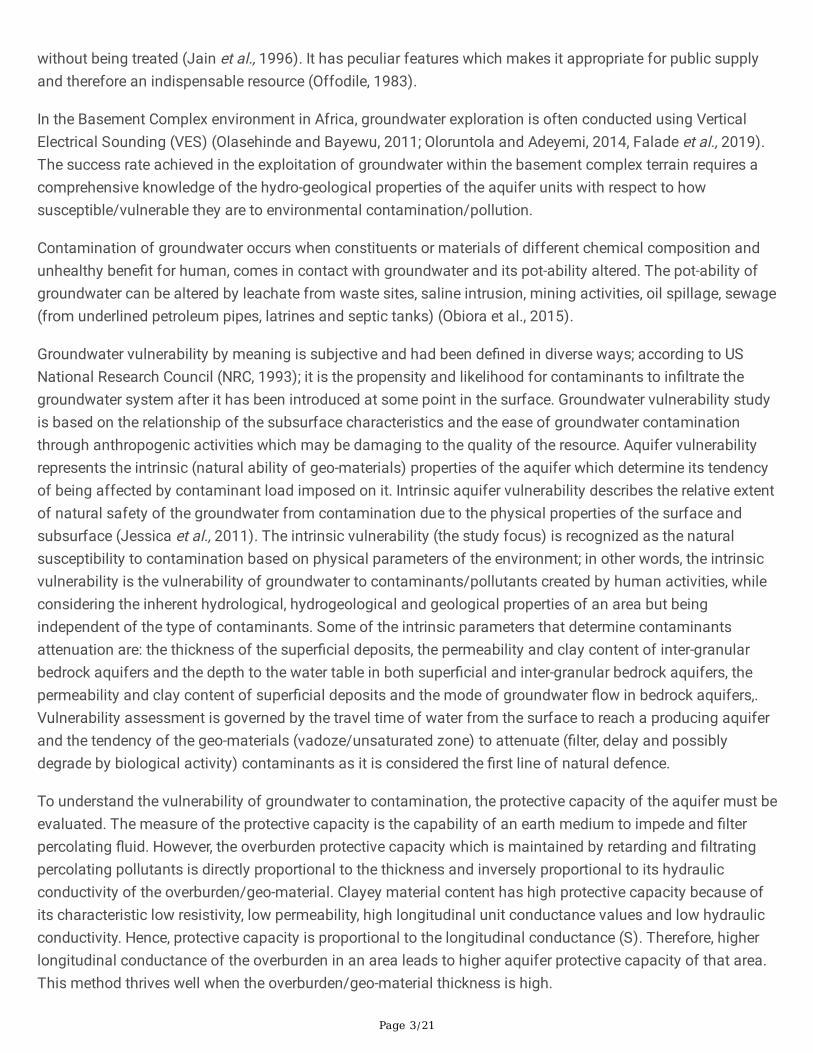
Groundwater vulnerability by meaning is subjective and had been de�ned in diverse ways; according to USNational Research Council (NRC, 1993); it is the propensity and likelihood for contaminants to in�ltrate thegroundwater system after it has been introduced at some point in the surface. Groundwater vulnerability studyis based on the relationship of the subsurface characteristics and the ease of groundwater contaminationthrough anthropogenic activities which may be damaging to the quality of the resource. Aquifer vulnerabilityrepresents the intrinsic (natural ability of geo-materials) properties of the aquifer which determine its tendencyof being affected by contaminant load imposed on it. Intrinsic aquifer vulnerability describes the relative extentof natural safety of the groundwater from contamination due to the physical properties of the surface andsubsurface (Jessica et al., 2011). The intrinsic vulnerability (the study focus) is recognized as the naturalsusceptibility to contamination based on physical parameters of the environment; in other words, the intrinsicvulnerability is the vulnerability of groundwater to contaminants/pollutants created by human activities, whileconsidering the inherent hydrological, hydrogeological and geological properties of an area but beingindependent of the type of contaminants. Some of the intrinsic parameters that determine contaminantsattenuation are: the thickness of the super�cial deposits, the permeability and clay content of inter-granularbedrock aquifers and the depth to the water table in both super�cial and inter-granular bedrock aquifers, thepermeability and clay content of super�cial deposits and the mode of groundwater �ow in bedrock aquifers,.Vulnerability assessment is governed by the travel time of water from the surface to reach a producing aquiferand the tendency of the geo-materials (vadoze/unsaturated zone) to attenuate (�lter, delay and possiblydegrade by biological activity) contaminants as it is considered the �rst line of natural defence.
To understand the vulnerability of groundwater to contamination, the protective capacity of the aquifer must beevaluated. The measure of the protective capacity is the capability of an earth medium to impede and �lterpercolating �uid. However, the overburden protective capacity which is maintained by retarding and �ltratingpercolating pollutants is directly proportional to the thickness and inversely proportional to its hydraulicconductivity of the overburden/geo-material. Clayey material content has high protective capacity because ofits characteristic low resistivity, low permeability, high longitudinal unit conductance values and low hydraulicconductivity. Hence, protective capacity is proportional to the longitudinal conductance (S). Therefore, higherlongitudinal conductance of the overburden in an area leads to higher aquifer protective capacity of that area.This method thrives well when the overburden/geo-material thickness is high.

Page 4/21
Geo-electric Layer Susceptibility Index (GLSI) (Oni et al., 2017) was used in assessing the protective capacity ofan overburden. The method accounts for the effectiveness of geo material like laterite that has capacity likeclay to �lter and degrade contaminants due to its low permeability, but highly resistive compared to clay thatexhibits low resistivity.
This study focuses on understanding how to protect groundwater resources using electrical methods ratherthan only detecting new groundwater resources. Electrical prospecting methods, over the years have becomevery effective tools for distinguishing shallow geological targets, environmental and engineering applicationsas �uid migration, contaminant detection, structural mapping of internal land�ll, imagery of faults andengineered hydraulic barriers as well as landslide investigations. Several researchers have proved thesensitivity and e�ciency of electrical resistivity method in groundwater prospection and environmentalinvestigation (Omosuyi et al., 2008; Abiola et al., 2009; Ariyo and Adeyemi, 2009; Mbimbe, et al., 2010; Murainaet al., 2012; Ogungbemi et al., 2013; Obiora et al., 2015; Olatunji et al., 2015; Anomoharan et al., 2017; Falade etal., 2019; Akintorinwa et al., 2020).
Location and geology of study area
The research area is located at the North-Eastern part of Ijero-Ekiti, a mining site and its environment (Figures1and 2). It is located between Latitudes 7º 49’36” N and 7º 49’53” N; Longitudes 5º 3’58” E and 5º4’19” E; withan elevation above sea level of 532m. It is accessible by road transport; a federal road network from Akurethrough Ado - Ekiti, the state capital.
Ijero-Ekiti lies in the Northwestern part of Ekiti State. The research area is largely characterized by thebasement complex rocks of Southwestern part of Nigeria. It consists of the quartzite, migmatite gneiss, schistbiotite gneiss, epidiorite, granite, calc-gneiss, biotite-schist, pegmatite and amphibole schist (Figure 3). Variedgranitic rocks constitute about 25% of the whole area of Ijero-Ekiti, composed of �ne-grained granite andmedium to coarse-grained varieties with porphyritic texture while the low-lying charnockitic rocks areassociated with coarse-grained porphyritic granites. Xenoliths are often formed in both charnockitic andgranitic bodies. The quartzites occur as elongated bodies enclosed within the migmatitic, charnockitic andgranitic rocks. Most exposed low-lying migmatites are characterized typically by foliation and intrusion ofgranitic and charnockitic rocks in some places.
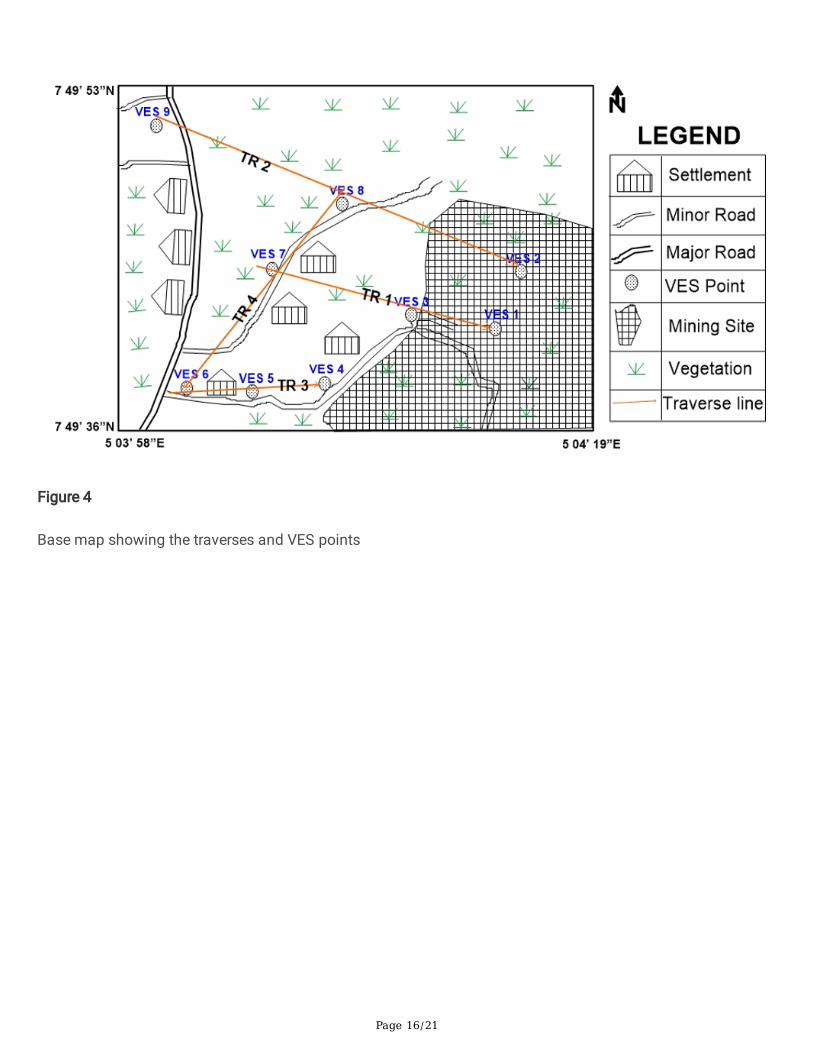
Research MethodologyResistivity survey was conducted by adopting the Schlumberger electrode configuration. Vertical ElectricalSoundings (VES) were carried out and the apparent resistivity (ρa) measurements plotted against AB/2. Themaximum electrode separation is between 50 m – 80 m. Four (4) traverses were cut and PETRO-ZENITHresistivity meter was used to acquire data in nine (9) locations (Figure 4). The parameters deemed adequate toquantify the extent of vulnerability in the area were deduced from the geo-electric parameters through the useof longitudinal conductance and GLSI.
Longitudinal Conductance
Page 5/21
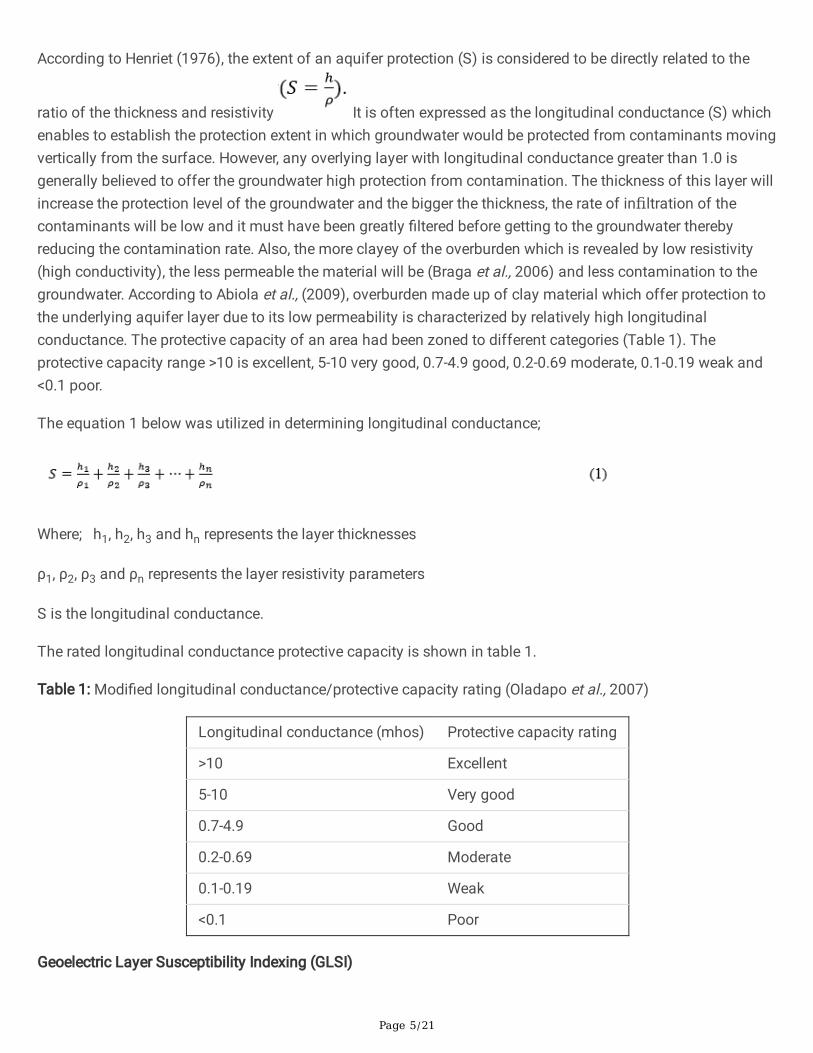
According to Henriet (1976), the extent of an aquifer protection (S) is considered to be directly related to the
ratio of the thickness and resistivity It is often expressed as the longitudinal conductance (S) whichenables to establish the protection extent in which groundwater would be protected from contaminants movingvertically from the surface. However, any overlying layer with longitudinal conductance greater than 1.0 isgenerally believed to offer the groundwater high protection from contamination. The thickness of this layer willincrease the protection level of the groundwater and the bigger the thickness, the rate of infiltration of thecontaminants will be low and it must have been greatly �ltered before getting to the groundwater therebyreducing the contamination rate. Also, the more clayey of the overburden which is revealed by low resistivity(high conductivity), the less permeable the material will be (Braga et al., 2006) and less contamination to thegroundwater. According to Abiola et al., (2009), overburden made up of clay material which offer protection tothe underlying aquifer layer due to its low permeability is characterized by relatively high longitudinalconductance. The protective capacity of an area had been zoned to different categories (Table 1). Theprotective capacity range >10 is excellent, 5-10 very good, 0.7-4.9 good, 0.2-0.69 moderate, 0.1-0.19 weak and<0.1 poor.
The equation 1 below was utilized in determining longitudinal conductance;
Where; h1, h2, h3 and hn represents the layer thicknesses
ρ1, ρ2, ρ3 and ρn represents the layer resistivity parameters
S is the longitudinal conductance.
The rated longitudinal conductance protective capacity is shown in table 1.
Table 1: Modi�ed longitudinal conductance/protective capacity rating (Oladapo et al., 2007)
Longitudinal conductance (mhos) Protective capacity rating
>10 Excellent
5-10 Very good
0.7-4.9 Good
0.2-0.69 Moderate
0.1-0.19 Weak
<0.1 Poor
Geoelectric Layer Susceptibility Indexing (GLSI)

Page 6/21
A hydrogeologic approach that indexes the geoelectric parameters inferred from the differences in electricalresistivity between rock sequences in the subsurface is applied in Geoelectric Layer Susceptibility Indexing(GLSI) (Oni et al., 2017). It is an empirical complementary concept initiated to enhance other methods ofassessing vulnerability. GLSI assigns index to each geoelectric parameter (layer resistivity and thickness)(Tables 2-4) in contrast to longitudinal conductance approach where indices were assigned to the ratios of thegeoelectric parameters (layer thickness and resistivity). GLSI is determined by equation 2. GLSI accounts forthe properties of lateritic materials which has low permeability (con�ning material) like clay but high resistivitydue to the degree of induration.
Where; ρ1r represents the �rst layer resistivity index rating,
h1r represents the �rst layer thickness index rating
ρ2r represents the second layer resistivity index rating,
h2r represents the second layer thickness index rating
ρnr represents the nth layer resistivity index rating
hnr represents the nth layer thickness index rating
N is the number of geoelectric layers overlying the Aquifer
Multi Criteria Decision Analysis (MCDA) according to Roy (1988) is adopted in GLSI. In this approach, ratedparameters are assigned indices. Normalization of the assigned parameter indices are conducted by dividingthem with the number of geoelectric layers (N) delineated from the resistivity curve to be above the aquifer.
Table 2: Index Rating of Resistivity Parameters Applied in GLSI
Resistivity range (Ω-m) Lithology Susceptibility index rating
<20 Clay/silt 1
20-50 Sandy clay 2
51-100 Clayey sand 3
101-150 Sand 4
151-400 Lateritic sand 2
>401 Laterite 1
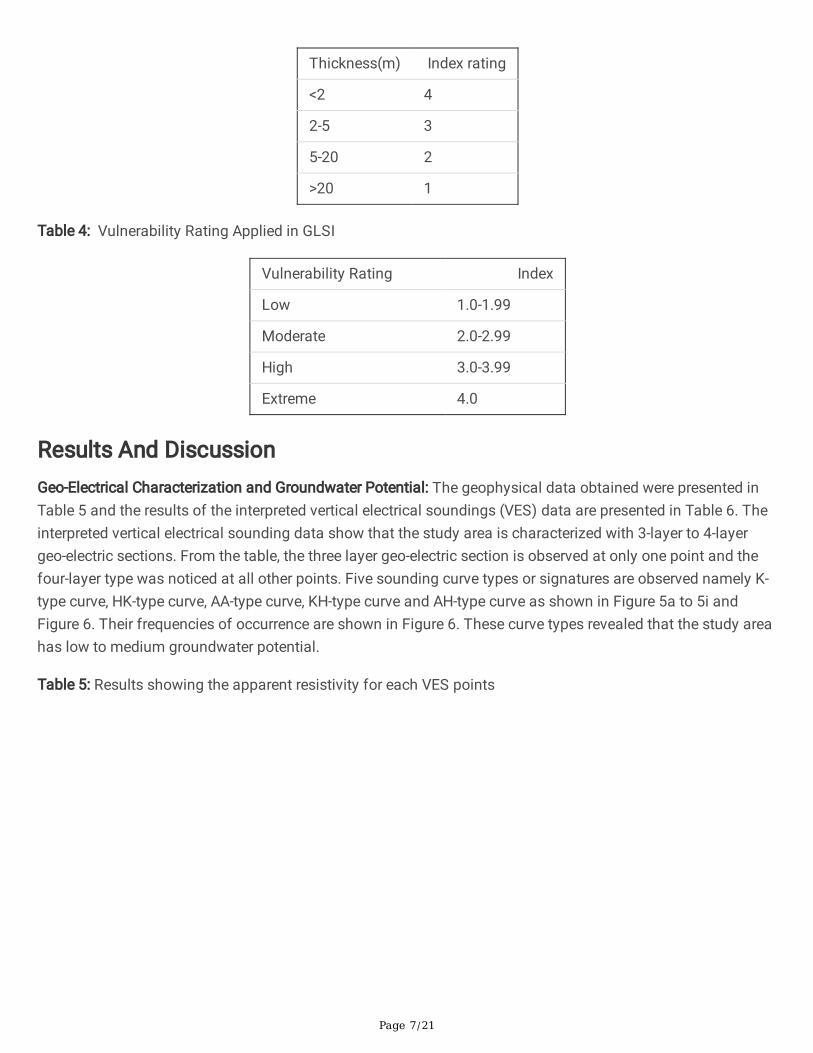
Table 3: Index rating of Layer Thickness Applied in GLSI
Page 7/21
Thickness(m) Index rating
<2 4
2-5 3
5-20 2
>20 1
Table 4: Vulnerability Rating Applied in GLSI
Vulnerability Rating Index
Low 1.0-1.99
Moderate 2.0-2.99
High 3.0-3.99
Extreme 4.0
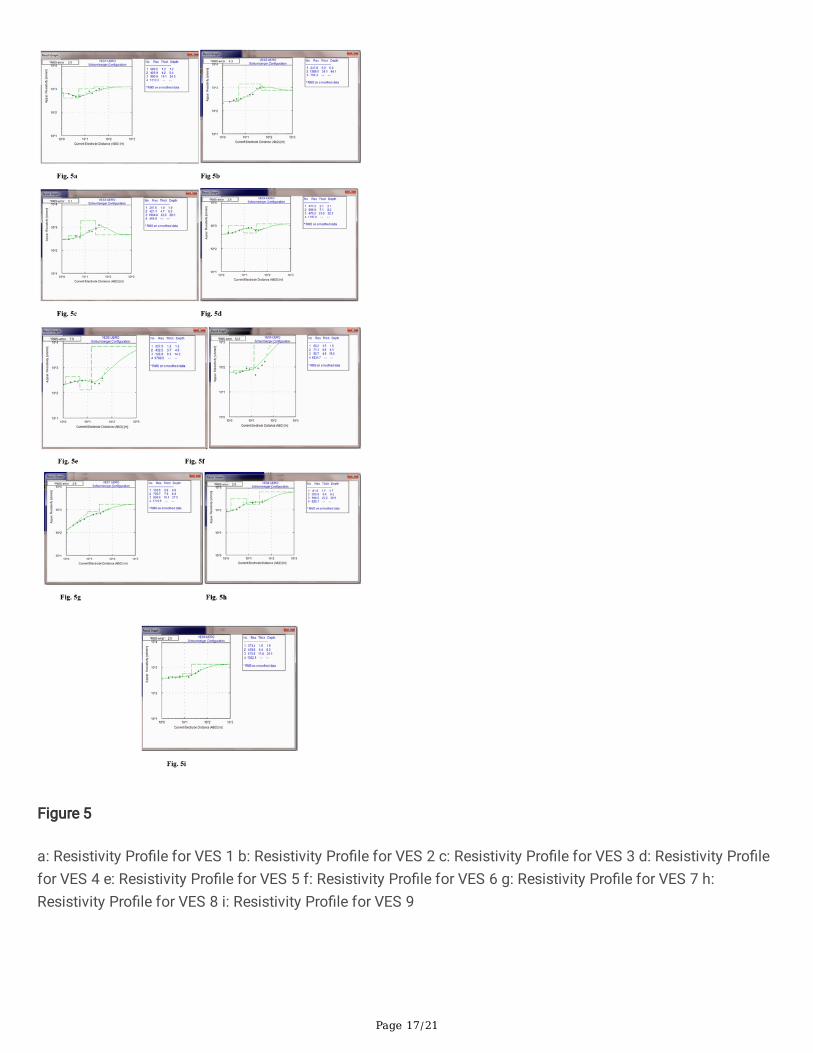
Results And DiscussionGeo-Electrical Characterization and Groundwater Potential: The geophysical data obtained were presented inTable 5 and the results of the interpreted vertical electrical soundings (VES) data are presented in Table 6. Theinterpreted vertical electrical sounding data show that the study area is characterized with 3-layer to 4-layergeo-electric sections. From the table, the three layer geo-electric section is observed at only one point and thefour-layer type was noticed at all other points. Five sounding curve types or signatures are observed namely K-type curve, HK-type curve, AA-type curve, KH-type curve and AH-type curve as shown in Figure 5a to 5i andFigure 6. Their frequencies of occurrence are shown in Figure 6. These curve types revealed that the study areahas low to medium groundwater potential.
Table 5: Results showing the apparent resistivity for each VES points

Page 8/21
VESNO
AB/2
1 2 3 4 5 6 7 8 9
1 685.21 204.73 302.51 405.44 208.38 64.73 116.38 88.35 346.69
2 618.6 237.54 297.86 491.16 264.68 54.55 211.65 81.94 386.08
3 510.13 281.65 324.07 481.29 290.13 61.64 274.3 102.93 410.98
4 454.46 313.7 410.22 528.86 266.44 68.03 314.7 126.69 396.14
6 459.23 334.81 373.27 608.6 305.2 87.72 377.8 164.17 438.37
6 524.84 325.76 334.81 616.4 291.82 102.94 211.63 275.99 380.06
8 585.17 394.13 888.81 665.6 309.68 80.92 764.13 203.09 438.37
12 728.51 409.23 737.49 742.01 318.24 77.5 1251 223.09 456.97
15 628.11 393.94 1484.6 763.51 319.9 93.94 243.47 193.87 422.43
15 781.18 484.26 1028.61 805.92 93.15 48.42 431.24 533.74 710.84
20 640.97 500.21 986.6 804.35 232.95 88.01 508.33 222.15 1410.1
30 838.75 913.66 1086.2 607.07 293.31 115.05 659.95 202.82 635.12
40 1013.51 1509.59 1622.16 430.08 379.91 631.07 1000.79 695.39 590.69
40 833.67 1437.78 2091.32 1779.63 228.08 160.8 1890.23 995.39 1648.92
50 918.49 2749.25 1618.13 645.62 797.28 315.7 1618.13 382.85 4194.57
60 989.09 1060.54 1106.89 684.44 840.35 550.4 1272.35 263.89
70 721.36 670.67 769.45 995.68 676.12 1375.09 2248.37
The Subsurface Sequences: Table 5 above presents the summary of interpreted geo-electric section. Four geo-electric sections were drawn along traverses 1, 2, 3 and 4. Traverses 1, 2 and 3 trends NW-SE while traverse 4trends E-W direction. The geo-electric section along traverses 1-4 in Figure 7a - 7d shows four distinct layersnamely topsoil lateritic layer, weathered layer delineated as aquifer and partly weathered basement. The geo-electric parameters obtained from depth sounding on VES1, VES3, VES4, VES5, VES6, VES7 and VES9classi�ed the area into four geo-electric layers. On VES1, 3, 4, 5, 6, 7 and 8 the top soil resistivity value rangesfrom 60 - 686 ohm-m with thickness ranging from 0.8 - 2.1m. The resistivity value of the second layer rangesbetween 71 - 997 ohm-m and 622 ohm-m with thickness range between 4.2 and 7.6m and is interpreted aslateritic layer. The third layer is the weathered layer delineated as the aquifer with resistivity range 91 - 1389ohm-m. The last layer has resistivity value ranging from 468 - 6834 ohm-m interpreted as partly weatheredbasement. VES2 is interpreted as 3 layers. The aquifer thickness ranges between 4.9 - 23m. VES 6 is 4.9 mthick and Ves4 23 m thick. It is considered fairly thick to harbor groundwater development. Others; VES1, 3,5,7,8and 9 has thickness 19.2m, 22m, 9.3m, 19.1m, 22.2m and 11.8m respectively. The total overburden thicknessranges between 4.9-9.2m. The overburden is considered generally thin.

Page 9/21
Table 6:Summarized interpreted result of the study area
VES NO h1 (m) h2 (m) h3 (m) ρ1 (Ωm) ρ2 (Ωm) ρ3 (Ωm) Curve Type
VES 1 1.2 4.2 19.2 687 402 991 HA
VES 2 5 39 - 247 1389 758 K
VES 3 1.9 4.7 22 298 421 1905 HK
VES 4 2.1 7.1 23 417 997 470 KH
VES 5 1.2 3.7 9.3 208 433 129 KH
VES 6 1.5 6.6 4.9 60 71 91 AA
VES 7 0.8 7.6 19.1 104 720 807 AA
VES 8 1.7 6.6 22 82 306 169 KH
VES 9 1.9 6.4 12 373 419 AA
Depth to Bedrock (Overburden Thickness): The depth to bedrock is the total thickness of all the overlying layersabove the fresh basement rock. Thickest overburden is found around VES 2, 3 and 4 with an overburdenthickness of about 22 m. The thinnest overburden is found around VES 5 with overburden thickness of about10m. Figure 7a - 7d shows the overburden thickness in all the VES points. Overburden thickness is one of theparameters on which groundwater potential evaluation is based. Areas that are characterized with thinoverburden are zones of probable low groundwater zones and those areas with thick overburden are zones ofprobable high groundwater zones.
Vulnerability Assessment/Protective Capacity Evaluation
Longitudinal Conductance (LC): The vulnerability of the study area is considered generally high (Figure 8). Based on longitudinal conductance model, VES 6 is considered weak having longitudinal conductance 0.12while other areas (VES) have longitudinal conductance value less than 0.1 and therefore categorized as poorprotective capacity. Poor longitudinal conductance is observed from southern to the northern part of the studyarea is indicative of poor protective capacity while the southwestern part (VES6) indicated weak protectivecapacity. The average vulnerability of the area is high because the geo-materials provide little protection to theunderlying aquifer.
Geoelectric Layer Susceptibility Indexing (GLSI): The map shown in �gure 9 reveals the vulnerability indexbased on the lithology and vadoze zone thickness of the study area. The impact of vadoze zone thickness inassessing the vulnerability of an aquifer is highly essential because a great thickness of the vadoze zone cansu�ciently delay contaminants from traveling to the aquifer layer, thereby reducing the rate of contamination.These parameters were combined and used to generate GLSI overlay index map. The map indicates lowvulnerability (1.0-1.99) at the southern part of the study area, medium vulnerability (2.0-2.99) at thenortheastern and northwestern part of the study area and high vulnerability zones (3.0-3.99) at thesouthwestern part of the area. The entire study area could be classi�ed between medium to high vulnerability,which suggest that the aquifer system in the study area has poor protective capacity.
Page 10/21
ConclusionHydrogeophysical study was conducted with the objective of categorizing the groundwater potentials and tounravel the aquifer protective capacity in the vicinity of mine at the North eastern part of Ijero Ekiti. Geo-electrical parameters show that the area is characterized with 3-layer to 4-layer subsurface sequences. The 4-layer type constitutes the dominant layer type and is observed at �ve (5) VES points. The layers of thesubsurface include topsoil, weathered/fractured layer and the fresh bedrock. Areas where thick overburden andlow resistivity values were observed constitute zones of high longitudinal conductance; this parameter wasused as a standard for rating the aquifer protective capacity. Three zones were distinctly de�ned as weak, poorand moderate aquifer protective capacity zones. The zones that are vulnerable to surface contaminant sourcesare termed as poor and weak zones and are found mostly in the southwestern and Northeastern part of thestudy area. Three groundwater potential zones were also delineated in the research area; the classi�cationcriteria used includes the resistivity and thickness of the weathered layer, overburden thickness and bedrockresistivity. Because of the instability in the basement relief and the local and discontinuous nature of thebasement aquifers, the three zones vary from place to place. Areas of high aquifer protective capacity coincidewith areas of poor groundwater potential; the former increases as the clay content of the overburden increaseswhile the latter decreases with increase in the overburden’s clay content.
DeclarationsCon�ict of Interest
The authors declared that they have no con�ict of interest.
Funding
No funding was made available for this research. It was funded by the authors.
Availability of data and material
All the data used were presented in the write up. No other data was applied
Code availability (software application or custom code)
Not applicable
Authors' contributions (optional: please review the submission guidelines from the journal whether statementsare mandatory)
Ayodele Falade: Conceptualization, Methodology, Software, Visualization, Investigation, Supervision,Visualization, Investigation, Software, Validation, Writing- Reviewing and Editing. Temitope Oni: Software,Visualization, Investigation, Conceptualization, Methodology, Software, Data curation, Validation. AkinfolayanOyeneyin: Conceptualization, Writing- Reviewing and Editing, Investigation, Methodology,

Page 11/21
Ethics approval (include appropriate approvals or waivers)
Not applicable
Consent to participate (include appropriate statements)
Not applicable
Consent for publication (include appropriate statements)
Not applicable
Acknowledgement
The authors would like to acknowledge the support provided by the local government executives and the royalking of Ijero kingdom for giving us access to the mining site and providing protection all through the dataacquisition.
References1. Abiola O, Enikanselu P A and Oladapo M I., (2009). Ground- water potential and aquifer protective capacity
of over- burden units in Ado-Ekiti, Southwestern Nigeria; Int. J. Phys. Sci. 4(3) 120–132
2. Adagunodo, T. A. (2017a). “Groundwater contamination: performance, effects, limitations and control,” inGroundwater Contamination: Performance, Limitations and Impacts, ed A. L. Powell (New York, NY: NovaScience Publishers, Inc), 33–64.
3. Adagunodo TA, Akinloye MK, Sunmonu LA, Aizebeokhai AP, Oyeyemi KD and Abodunrin FO (2018)Groundwater Exploration in Aaba Residential Area of Akure, Nigeria. Front. Earth Sci. 6:66. doi:10.3389/feart.2018.00066
4. Anomohanran, O., Ofomola, M. O., and Okocha, F. O. (2017). Investigation of groundwater in parts ofNdokwa district in Nigeria using geophysical logging and electrical resistivity methods: implications forgroundwater exploration. J. Afr. Earth Sci. 129, 108–116. doi: 10.1016/j.jafrearsci.2016.12.008
5. Akinrinade, O. J., and Adesina, R. B. (2016). Hydrogeophysical investigation of Groundwater Potential andaquifer vulnerability prediction in Basement complex terrain – A case study from Akure, SouthwesternNigeria. RMZ-M G 63, 55–66. doi: 10.1515/rmzmag-2016-0005
�. Banton, O., Seguin, M. K., Cimon, M. A., (1997). Mapping �eld scale physical properties of soil withElectrical Resistivity. Soil Sci.Soc. Am. J. 61, 1010-1017.
7. Daniel N Obiora, Adeolu E Ajala and Johnson C Ibuot, (2015). Evaluation of aquifer protective capacity ofoverburden unit and soil corrosivity in Makurdi, Benue state, Nigeria, using electrical resistivity method.Journal of Earth System Science
�. Emenike, C. P., Tenebe, I. T., Omole, D. O., Igene, B. U., Oniemayin, B. I., Omeje, M., et al. (2017). AccessingSafe Drinking Water in Sub-Saharan Africa: Issues and Challenges in South-West Nigeria. Sustain. CitiesSoc. 30, 263–272. doi: 10.1016/j.scs.2017.01.005

Page 12/21
9. Falade A. O., Amigun J. O. and Ka�sanwo O. (2019). Application of electrical and very low frequencyelectromagnetic methods in groundwater exploration of Ilara mokin, Akure, Ondo state. Earth andenvironmentak science journal
10. I. A. Kwami, J. M. Ishaku, A. M. Bello, A. Yusuf, U. Abubakar and S. Mukkafa (2018). Assessment of WaterQuality Index for the Groundwater in Gombe and Environs, North-east Nigeria. IOSR Journal of AppliedGeology and Geophysics (IOSR-JAGG) e-ISSN: 2321–0990, p-ISSN: 2321–0982.Volume 6, Issue 5 Ver. III(Sep. – Oct. 2018), PP 29-37 DOI: 10.9790/0990-0605032937
11. Jain, R.K., Jain S, Wang B, Wu R. (1996). Optimization of biolistic method for transient gene expressionand production of agronomically useful transgenic bastmati rice plants. Plant cell rep. 15:963-968
12. Jessica Liggett, Pat Lapcevic and Kate Miller (2011). A Guide to the Use of Intrinsic Aquifer VulnerabilityMapping. British Columbia Ministry of Forests, Lands and Natural Resource Operations, Nanaimo, BC. Pp2-3
13. Joel, E. S., Olasehinde, P. I., De, D. K., Omeje, M., and Adewoyin, O. O. (2016). Estimation of aquifertransmissivity from geo-physical data. A case study of Covennat University and environs, SouthwesternNigeria. Sci. Int. 28, 3379–3385. Kearey, P., Brooks, M., Hill, L., (2002). An introduction to geophysicalexploration. Blackwell Science.
14. Keller, G. V. and Frischnecht, F. C. (1966). Electrical Models in Geophysical Prospecting. Pergamon Press,Oxford, UK. pp. 523.
15. M. O. Olorunfemi, J. S. Ojo, O. M. Akintunde (1999). Hydrogeophysical evaluation of the groundwaterpotential of Akure metropolis, southwestern Nigeria. J. Min. Geol., 35(2), 1999, 207-228.
1�. Mbimbe, E. Y. Samalia N. K and D. K. Akanni, (2010); Groundwater Exploration in a basement complexterrain using Electrical Resistivity Sounding (VES): A Case Study of Rimin Gado Town and Environs, KanoState, North Central Nigeria. Continental j. Earth Sciences5 (1): 56-63.
17. Muraina Z. Mohammed, Thompson H. P., Ogunribido & Adedamola T. Funmilayo., (2012). ElectricalResistivity sounding in Araromi area of Akungba-Akoko Ondo State Southwestern Nigeria to delineate thesubsurface geologic unit and evaluate the groundwater potential of the area. Journal of Environment andEarth Science Vol 2, No.7.
1�. National Water Policy (1987), Offodile, M.E (1983). The occurrence and exploitation of groundwater inNigeria, basement complex Rocks. Journal of mining and geology, 20 (1&2: 131-146)
19. O. S. Ogungbemi, G. O. Badmus, O. G. Ayeni, O. Ologe., (2013). Geo-electric Investigation of AquiferVulnerability within Afe Babalola University, Ado –Ekiti, Southwestern Nigeria. IOSR Journal of AppliedGeology and Geophysics (IOSR-JAGG) e-ISSN: 2321–0990, p-ISSN: 2321–0982.Volume 1, Issue 5 (Nov. –Dec. 2013), PP 28-34.
20. Oladejo, O. P., Sunmonu, L. A., Ojoawo, A., Adagunodo, T. A., and Ola�soye, E. R. (2013). Geophysicalinvestigation for groundwater development at Oyo state housing estate Ogbomosho, southwesternNigeria. Res. J. Appl. Sci. Eng. Technol. 5, 1811–1815. doi: 10.19026/rjaset.5.4943
21. Olasehinde, P. I., Bayewu, O. O., (2011). Evaluation of Electrical resistivity anisotropy in geological mapping:a case study of Odo Ara, west central Nigeria. Afr. J. Environ.
22. Olatunji O. Alu, Oluwatoyin Ologe and Samuel O. Ogungbemi. (2015). Al-Hikmah HydrogeophysicalInvestigation of Kusa Mining Hill, Ijero-Ekiti Nigeria, Using Geo-Electrical and Electromagnetic Methods
Page 13/21
Journal of Pure & Applied Sciences 1 : 18-26 18.
23. Oloruntola, M.O., Adeyemi, G.O., (2014). Geophysical and hydrochemical evaluation of groundwaterpotential and character of Abeokuta area, southwestern Nigeria. J. Geogr. Geol. 6 (3), 162–177.
24. Omosuyi, G. O., Adegoke, A. O. and Adelusi, A. O. (2008). Interpretation of Electromagnetic and GeoelectricSounding Data for Groundwater Resources around Obanla-Obakekere, near Akure, Southwestern Nigeria.The Paci�c Journal of Science and Technology.Vol. 9, No.2, pp.508-525.
25. Orellana, E., Mooney, H.M (1966). Master Tables and Curves for Vertical Electrical Sounding over LayeredStructures; Intersciencia: Madrid, Spain, 1996; 34p.
2�. Oyeyemi, K. D., Aizebeokhai, A. P., Adagunodo, T. A., Olo�nnade, O. M., Sanuade, O. A., and Olaojo, A. A.(2017). Subsoil characterization using geoelectrical and geotechnical investigations: implications forfoundation studies. Int. J. Civil Eng. Technol. 8, 302–314.
27. Reynolds, J. M., (1997). An Introduction to Applied and Environmental Geophysics. Wiley.
2�. Romanus Obasi (2014). Physio-Chemical characteristics and industrial potential of lepidolite from Ijero-Aramoko pegmatite �eld, southwestern Nigerian.Sci. Technol. 5 (7), 553–556.Sounding. Interciencia,Madrid, pp. 160.
29. Scollar, I., Tabbagh, A., Hesse, A., Herzog, I., (1990). Archaeological Prospecting and Remote Sensing, 674pp.
30. Sharma, P. V., (1997). Environmental and Engineering Geophysics, Cambridge University Press.
31. Stephen O. Ariyo and Gabriel O. Adeyemi, (2009); Role of Electrical Resistivity Method for GroundwaterExploration in hard rock areas: A case study from Fidiwo/Ajebo areas of southwestern Nigeria. The Paci�cJournal of Science and Technology Volume 10, Number 1.
32. Todd., D. K. (1980). Groundwater Hydrology, 2nd Edn. New York, NY: John Willey Sons Inc.
33. Tahseen Sayara (2016). Environmental impact assessment of quarries and stone cutting industriesin Palestine: case study of Jammain. Journal of Environment Protection and SustainableDevelopment. vol. 2, No. 4, pp 32-38 (32.)
34. Vander Velpen, B. P. A., (1988). Resist Version 1.0 M.Sc Research Project, ITC, Delft Netherland. Whitmire,M. G. 1980. Geophysical activity in 1979. Geophysics 45, 1563-1579.
35. Zohdy, A. A., (1965). The Auxiliary Point Method of Electrical Sounding Interpretation and its relationship tothe Dar Zarrouk parameters. Geophysics 30, 644–660.
3�. Zohdy, A. A. R., Eaton, G. P. and Mabey, D. R. (1974). Application of Surface Geoophysics to Ground WaterInvestigation. U. S. G. S. Techniques of Water-Resource Investigation, Book 2
Figures

Page 14/21
Figure 1
Map of Ijero - Ekiti

Page 15/21
Figure 2
Base map of the study area showing the VES Points
Figure 3
Geological Map of Ijero-Ekiti (Romanus 2014).
Page 16/21
Figure 4
Base map showing the traverses and VES points
Page 17/21
Figure 5
a: Resistivity Pro�le for VES 1 b: Resistivity Pro�le for VES 2 c: Resistivity Pro�le for VES 3 d: Resistivity Pro�lefor VES 4 e: Resistivity Pro�le for VES 5 f: Resistivity Pro�le for VES 6 g: Resistivity Pro�le for VES 7 h:Resistivity Pro�le for VES 8 i: Resistivity Pro�le for VES 9

Page 18/21
Figure 6
Frequency Distribution of Curve Types

Page 19/21
Figure 7
a: Geo-electric section of traverse 1 showing VES1, VES3 and VES7 b: Geo-electric section of traverse 2showing VES2, VES8 and VES9 c: Geo-electric section of traverse 2 showing VES6, VES7 and VES8 d: Geo-electric section of traverse 4 showing VES2, VES8 and VES9

Page 20/21
Figure 8
Longitudinal conductance map of the study area

Page 21/21
Figure 9
GLSI Map of the study area.