Embed Size (px)
Citation preview
ORIGINAL PAPER
Site effect evaluation for Yanbu City urban expansionzones, western Saudi Arabia, using microtremor analysis
K. Alyousef & A. Al-Amri & M. Fnais &
Kamal Abdelrahman & Oumar Loni
Received: 14 November 2013 /Accepted: 23 January 2014# Saudi Society for Geosciences 2014
Abstract Recently, Yanbu City has been greatly growing;great developmental projects, urban community settlements,and petrochemical industries have been established. Historicaland instrumental earthquakes were felt by this city, such as theearthquake on 19May 2009which was a moderate earthquake(moment magnitude (Mw) 5.7) whose ground motions haveaffected some building structures. Yanbu City has been divid-ed by a grid of points separated by about 500 m, andmicrotremor measurements have been conducted at 141 mea-suring sites. The acquired data have been processed usingworldwide Geopsy software package to calculate the funda-mental frequency peaks and their corresponding amplificationfactors. The natural origin of these peaks has been confirmed.Based on fundamental frequency (f0), Yanbu City has beenclassified into three zones—from 0.13 to 1.0 Hz in the firstzone, from 1.0 to 4.0 Hz in the second zone, and from 4.0 to7.6 Hz in the third zone. The coastal zone of Yanbu illustratessmaller values of f0 that reflect great thickness of soft sedi-ments while the eastern zone presents an opposite phenome-non. Accordingly, high-rise buildings in the coastal zone willbe affected greatly by low frequencies originating from distantearthquakes. Most of Yanbu City has f0 values in the range of1.0–4.0 Hz. Furthermore, bedrock ground motion could
amplify as much as three times. This indicates that one- tothree-story buildings in Yanbu City are vulnerable to hazard-ous resonant shaking from local and near earthquakes.
Keywords Soft sediments . Microtremor . Predominantfrequency . Amplification factor . YanbuCity
Introduction
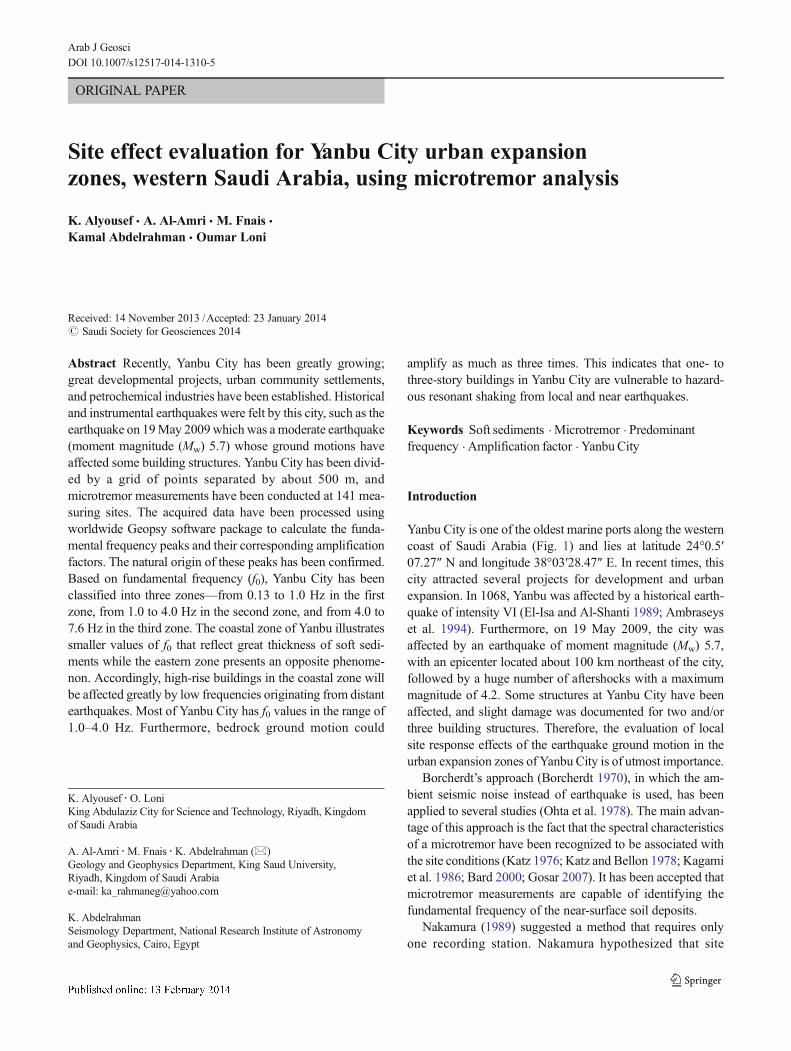
Yanbu City is one of the oldest marine ports along the westerncoast of Saudi Arabia (Fig. 1) and lies at latitude 24°0.5′07.27″ N and longitude 38°03′28.47″ E. In recent times, thiscity attracted several projects for development and urbanexpansion. In 1068, Yanbu was affected by a historical earth-quake of intensity VI (El-Isa and Al-Shanti 1989; Ambraseyset al. 1994). Furthermore, on 19 May 2009, the city wasaffected by an earthquake of moment magnitude (Mw) 5.7,with an epicenter located about 100 km northeast of the city,followed by a huge number of aftershocks with a maximummagnitude of 4.2. Some structures at Yanbu City have beenaffected, and slight damage was documented for two and/orthree building structures. Therefore, the evaluation of localsite response effects of the earthquake ground motion in theurban expansion zones of Yanbu City is of utmost importance.
Borcherdt’s approach (Borcherdt 1970), in which the am-bient seismic noise instead of earthquake is used, has beenapplied to several studies (Ohta et al. 1978). The main advan-tage of this approach is the fact that the spectral characteristicsof a microtremor have been recognized to be associated withthe site conditions (Katz 1976; Katz and Bellon 1978; Kagamiet al. 1986; Bard 2000; Gosar 2007). It has been accepted thatmicrotremor measurements are capable of identifying thefundamental frequency of the near-surface soil deposits.
Nakamura (1989) suggested a method that requires onlyone recording station. Nakamura hypothesized that site
K. Alyousef :O. LoniKing Abdulaziz City for Science and Technology, Riyadh, Kingdomof Saudi Arabia
A. Al-Amri :M. Fnais :K. Abdelrahman (*)Geology and Geophysics Department, King Saud University,Riyadh, Kingdom of Saudi Arabiae-mail: [email protected]
K. AbdelrahmanSeismology Department, National Research Institute of Astronomyand Geophysics, Cairo, Egypt
Arab J GeosciDOI 10.1007/s12517-014-1310-5
response could be estimated from the horizontal-to-verticalratio of a microtremor. Numerous authors around the world(Lermo and Chavez-Garcia 1993, 1994; Lachet and Bard1994; Field and Jacob 1995; Malagnini et al. 1996; Seekinset al. 1996; Teves-Costa Matias and Bard 1996; Theodulidiset al. 1996; Konno and Ohmachi 1998; Mucciarelli 1998;Mucciarelli et al. 1998) tested this technique, experimentallyand theoretically. Results obtained by implementingNakamura’s technique support such use of microtremor mea-surements for estimating the site response of surface deposits.Lermo and Chávez-García (1993) applied Nakamura’s tech-nique to seismic recordings of earthquakes and concluded thatthis approach is able to reliably estimate the frequency of thefundamental resonant mode and correctly predict the amplifi-cation level. Other studies (Field and Jacob 1993; Wakamatsuand Yasui 1996; Lachet and Bard 1994) indicate that theNakamura method has already proved to be one of thecheapest and most convenient techniques to estimate thefundamental frequency.
Fnais et al. (2010a, b), conducted microtremor measure-ments for the downtown of Yanbu City, where they conducted85 measurement points, while in the present work, 56 points
of microtremor measurements are acquired in the northern andsouthern urban expansion zones of the city.
Geological setting
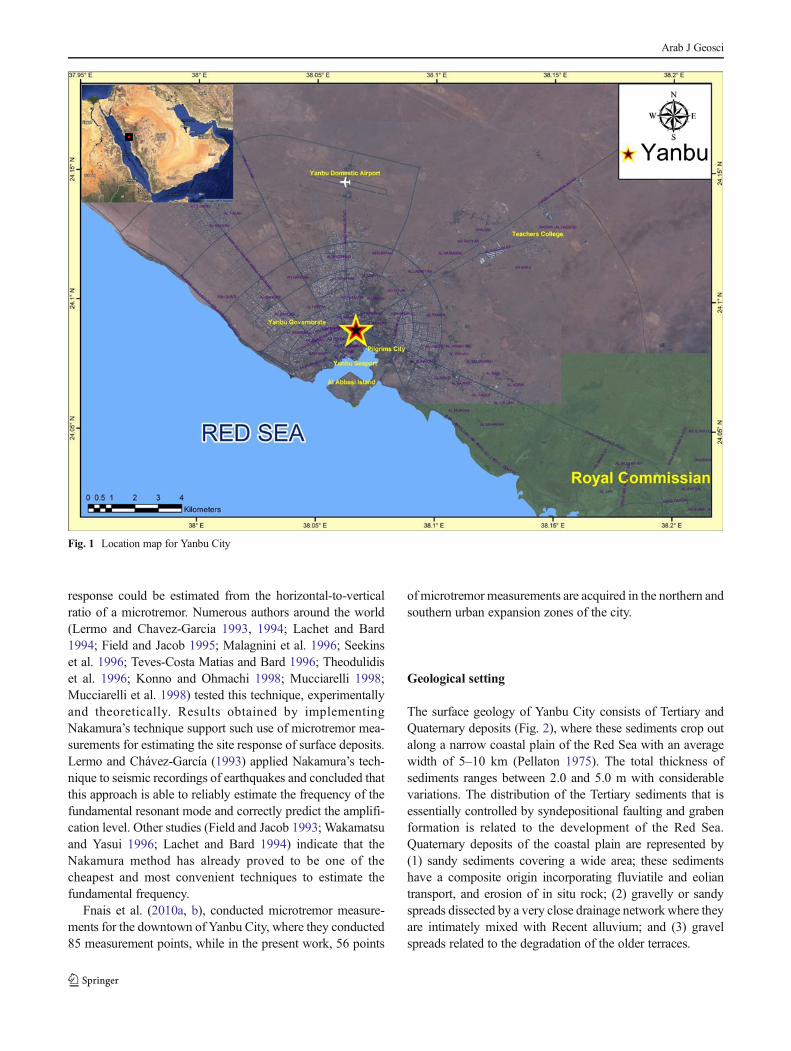
The surface geology of Yanbu City consists of Tertiary andQuaternary deposits (Fig. 2), where these sediments crop outalong a narrow coastal plain of the Red Sea with an averagewidth of 5–10 km (Pellaton 1975). The total thickness ofsediments ranges between 2.0 and 5.0 m with considerablevariations. The distribution of the Tertiary sediments that isessentially controlled by syndepositional faulting and grabenformation is related to the development of the Red Sea.Quaternary deposits of the coastal plain are represented by(1) sandy sediments covering a wide area; these sedimentshave a composite origin incorporating fluviatile and eoliantransport, and erosion of in situ rock; (2) gravelly or sandyspreads dissected by a very close drainage network where theyare intimately mixed with Recent alluvium; and (3) gravelspreads related to the degradation of the older terraces.
Fig. 1 Location map for Yanbu City
Arab J Geosci
Data acquisition
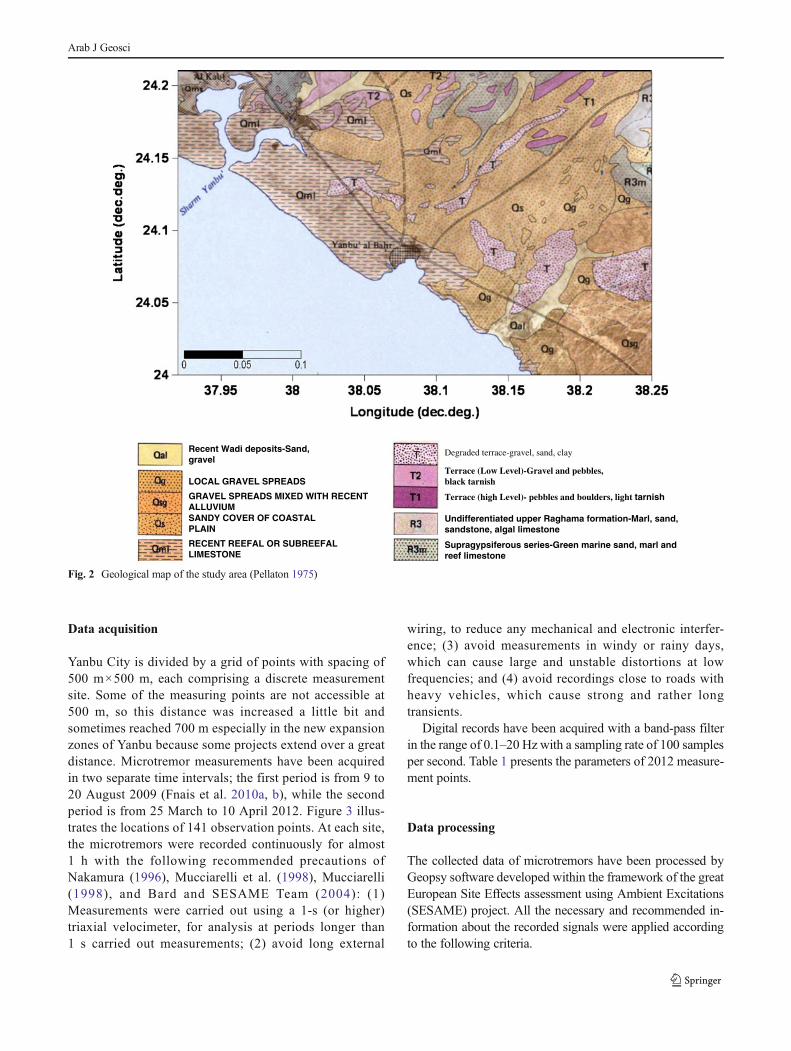
Yanbu City is divided by a grid of points with spacing of500 m×500 m, each comprising a discrete measurementsite. Some of the measuring points are not accessible at500 m, so this distance was increased a little bit andsometimes reached 700 m especially in the new expansionzones of Yanbu because some projects extend over a greatdistance. Microtremor measurements have been acquiredin two separate time intervals; the first period is from 9 to20 August 2009 (Fnais et al. 2010a, b), while the secondperiod is from 25 March to 10 April 2012. Figure 3 illus-trates the locations of 141 observation points. At each site,the microtremors were recorded continuously for almost1 h with the following recommended precautions ofNakamura (1996), Mucciarelli et al. (1998), Mucciarelli(1998), and Bard and SESAME Team (2004): (1)Measurements were carried out using a 1-s (or higher)triaxial velocimeter, for analysis at periods longer than1 s carried out measurements; (2) avoid long external
wiring, to reduce any mechanical and electronic interfer-ence; (3) avoid measurements in windy or rainy days,which can cause large and unstable distortions at lowfrequencies; and (4) avoid recordings close to roads withheavy vehicles, which cause strong and rather longtransients.
Digital records have been acquired with a band-pass filterin the range of 0.1–20 Hz with a sampling rate of 100 samplesper second. Table 1 presents the parameters of 2012 measure-ment points.
Data processing
The collected data of microtremors have been processed byGeopsy software developed within the framework of the greatEuropean Site Effects assessment using Ambient Excitations(SESAME) project. All the necessary and recommended in-formation about the recorded signals were applied accordingto the following criteria.
Degraded terrace-gravel, sand, clay
Terrace (Low Level)-Gravel and pebbles,black tarnish
Terrace (high Level)- pebbles and boulders, light tarnish
Undifferentiated upper Raghama formation-Marl, sand,sandstone, algal limestone
Supragypsiferous series-Green marine sand, marl andreef limestone
LOCAL GRAVEL SPREADS
Recent Wadi deposits-Sand,gravel
GRAVEL SPREADS MIXED WITH RECENTALLUVIUMSANDY COVER OF COASTALPLAIN
RECENT REEFAL OR SUBREEFALLIMESTONE
Fig. 2 Geological map of the study area (Pellaton 1975)
Arab J Geosci
Criteria for reliability of results
The SESAME project recommended several criteria for reli-ability of results as follows:
f 0> 10 Iwð
where Iw is window length.According to this condition, at the frequency of interest,
there are at least ten significant cycles in each window.Although not mandatory, but if the data allows, it is alwaysfruitful to check whether a more stringent condition (f0>20/Iw) can be fulfilled, which allows at least ten significant cyclesfor frequencies half the peak frequency and thus enhancesreliability of the whole peak.
According to this condition, a large number of windows areneeded. The total number of significant cycles, nc=Iw·f0, islarger than 200 (which means, for instance, for a peak of 1 Hz,there are at least 20 windows of 10 s each or, for a peak of0.5 Hz, ten windows of 40 s each). In case no window
selection is considered, all transients are taken into account.
σAð f Þ < 2 for 0:5 f 0 < f < 2 f 0 if f 0 > 0:5 Hz
or
σAð f Þ < 3 for 0:5 f 0 < f < 2 f 0 if f 0 < 0:5 Hz
This condition takes into account an acceptably low levelof scattering between all windows.
Criteria for a clear H/V peak
According to the SESAME guidelines, at least five of thefollowing criteria must be achieved for the clarity of H/Vpeaks:
∃ f − ∈f 04; f 0
� �AH Vj f −ð Þ < A0 2
Fig. 3 Microtremor measurement points in the Yanbu area
Arab J Geosci
Table 1 Characteristics of the sites of the microtremor measurements in the study area for the second period, 2012
Site code Latitude Longitude Date Start time End time Duration Sensor type Samplingfrequency
YM-86 24.02748 38.14337 27 Mar 2012 11:45 12:32 50 T.C. 100
YM-87 24.03285 38.16567 27 Mar 2012 10:17 11:01 40 T.C. 100
YM-88 24.11808 38.11967 27 Mar 2012 15:20 16:25 65 T.C. 100
YM-89 24.12153 38.11933 27 Mar 2012 13:40 14:20 40 T.C. 100
YM-90 24.0629 38.13117 27 Mar 2012 13:24 14:24 60 T.C. 100
YM-91 24.04492 38.12175 27 Mar 2012 12:05 12:45 40 T.C. 100
YM-92 24.03747 38.16887 27 Mar 2012 09:50 10:30 40 T.C. 100
YM-93 24.02285 38.15833 27 Mar 2012 10:55 11:35 40 T.C. 100
YM-94 24.05707 38.14487 27 Mar 2012 13:25 14:05 40 T.C. 100
YM-95 24.04637 38.17375 27 Mar 2012 08:50 09:42 50 T.C. 100
YM-96 24.03605 38.19825 27 Mar 2012 06:45 07:25 40 T.C. 100
YM-97 24.02902 38.19518 27 Mar 2012 07:00 07:40 40 T.C. 100
YM-98 24.02153 38.19572 27 Mar 2012 08:35 09:15 50 T.C. 100
YM-99 24.1249 38.0109 28 Mar 2012 05:30 06:18 50 T.C. 100
YM-100 24.09413 38.01017 28 Mar 2012 07:20 08:13 50 T.C. 100
YM-101 24.10597 38.09288 28 Mar 2012 11:50 12:37 45 T.C. 100
YM-102 24.1168 38.04083 28 Mar 2012 09:45 10:17 32 T.C. 100
YM-103 24.12042 38.083 28 Mar 2012 09:20 10:02 40 T.C. 100
YM-104 24.11867 38.11033 28 Mar 2012 12:05 12:26 25 T.C. 100
YM-105 24.1101 37.9931 28 Mar 2012 07:45 08:25 40 T.C. 100
YM-106 24.11647 38.01888 28 Mar 2012 05:45 06:18 40 T.C. 100
YM-107 24.1032 38.019 3 Apr 2012 18:29 19:09 40 T.C. 100
YM-108 24.11188 38.01207 3 Apr 2012 19:35 20:15 40 T.C. 100
YM-109 24.11777 38.0006 4 Apr 2012 20:45 21:25 40 T.C. 100
YM-110 24.12618 38.03447 4 Apr 2012 14:10 14:50 40 T.C. 100
YM-111 24.14765 38.02365 4 Apr 2012 15:10 15:50 40 T.C. 100
YM-112 24.13558 38.00182 4 Apr 2012 17:47 18:30 40 T.C. 100
YM-113 24.128 37.99137 4 Apr 2012 19:55 20:35 40 T.C. 100
YM-114 24.117 37.97792 4 Apr 2012 21:05 21:45 40 T.C. 100
YM-115 24.10133 38.00072 4 Apr 2012 22:05 22:45 40 T.C. 100
YM-116 24.13633 38.02935 4 Apr 2012 14:10 14:50 40 T.C. 100
YM-117 24.16242 38.01598 4 Apr 2012 15:15 15:55 40 T.C. 100
YM-118 24.14695 37.9926 4 Apr 2012 16:26 17:05 40 T.C. 100
YM-119 24.13765 37.98162 4 Apr 2012 19:25 20:05 40 T.C. 100
YM-120 24.1059 38.06088 26 Mar 2012 08:50 09:30 40 T.C. 100
YM-121 24.08662 38.0553 26 Mar 2012 10:20 11:07 40 T.C. 100
YM-122 24.10367 38.02665 26 Mar 2012 11:50 12:34 40 T.C. 100
YM-123 24.10912 38.06053 26 Mar 2012 13:35 14:15 40 T.C. 100
YM-124 24.09062 38.0896 26 Mar 2012 14:15 14:55 40 T.C. 100
YM-125 24.11997 38.13762 26 Mar 2012 15:30 16:10 40 T.C. 100
YM-126 24.12598 38.1361 26 Mar 2012 15:55 16:35 40 T.C. 100
YM-127 24.03506 38.12719 29 Mar 2012 15:05 15:45 40 T.C. 100
YM-128 24.12601 37.96688 29 Mar 2012 16:00 16:40 40 T.C. 100
YM-129 24.14318 37.97337 29 Mar 2012 16:55 17:35 40 T.C. 100
YM-130 24.15094 37.96586 29 Mar 2012 17:45 18:30 40 T.C. 100
YM-131 24.15514 37.98482 29 Mar 2012 19:00 19:40 40 T.C. 100
YM-132 24.16125 37.97795 29 Mar 2012 19:55 20:35 40 T.C. 100
YM-133 24.16697 37.98787 29 Mar 2012 20:50 21:30 40 T.C. 100
Arab J Geosci
One frequency, f−, should be lying between f0/4 and f0, suchas A0/AH/V (f−)>2.
∃ f þ ∈ f 0; 4 f 0½ � AH Vj f þð Þ < A0 2
Another frequency, f+, should be lying between f0 and 4f0,such as A0/AH/V (f
+)>2 A0>2.
f peak AH V ð f Þ � σAð f Þ½ � ¼ f 0 � 5 %
The peak should appear at the same frequency (within apercentage ±5 %) on the H/V curves corresponding to themean ±1 standard deviation.
σ f < ε f 0ð Þ
σf should be lower than the frequency-dependent thresholdε (f0), as in Table 2.
σA f 0ð Þ < θ f 0ð Þ
σA(f0) should be lower than the frequency-dependentthreshold θ (f0), as in Table 2.
where
Iw Window lengthnw Number of windows selected for the average H/V
curvenc Iw·nw·f0 is the number of significant cyclesf Current frequencyfsensor Cutoff frequencyf0 H/V peak frequencyσf Standard deviation of H/V peak frequency (f0±σf)ε f 0ð Þ Threshold value for the stability condition σf<ε(f0)A0 H/V peak amplitude at frequency f0AH/V(f) H/V curve amplitude at frequency ff− Frequency between f0/4 and f0 for which AH/V(f
−)<A0/2
f+ Frequency between f0 and 4f0 for which AH/V(f+)<
A0/2
σA(f) “Standard deviation” of AH/V(f); σA(f) is the factorby which the mean AH/V(f) curve should bemultiplied or divided
σlog H/
V(f)Standard deviation of the log AH/V(f) curve
σlog H/
V(f)Absolute value which should be added to orsubtracted from the mean logAH V
ð f Þ curve
θ f 0ð Þ Threshold value for the stability conditionσAð f Þ < θ f 0ð Þ
Vs, av Average S-wave velocity of the total depositsVs, surf S-wave velocity of the surface layerH Depth to bedrockHmin Lower-bound estimate of h
Criteria for H/V industrial origin peaks
According to SESAME (2004), in urban environments, H/Vcurves exhibit local narrow peaks or troughs. In most cases,such peaks or troughs related to some kind of machinery arerecognized by the following general characteristics:
& They may exist over a significant area up to a distance ofseveral kilometers from their source in the same localities.
& As the source is more or less “permanent” (at least withinworking hours), the original (non-smoothed) Fourier spec-tra should exhibit sharp narrow peaks at the same frequen-cy for all three components, as seen in Fig. 4.
Table 1 (continued)
Site code Latitude Longitude Date Start time End time Duration Sensor type Samplingfrequency
YM-134 24.17803 37.97833 29 Mar 2012 21:45 22:30 40 T.C. 100
YM-135 24.17702 37.9623 30 Mar 2012 14:45 15:30 40 T.C. 100
YM-136 24.15512 38.00439 30 Mar 2012 15:45 16:30 40 T.C. 100
YM-137 24.17904 38.00562 30 Mar 2012 16:50 17:30 40 T.C. 100
YM-138 24.0647 38.18338 30 Mar 2012 17:55 18:35 40 T.C. 100
YM-139 24.0574 38.20301 30 Mar 2012 19:00 19:40 40 T.C. 100
YM-140 24.12826 38.06167 30 Mar 2012 19:55 20:35 40 T.C. 100
YM-141 24.143 37.953 30 Mar 2012 20:45 21:30 40 T.C. 100
T.C. Trillium compact seismometer (Nanometrics Inc.)
Table 2 Threshold values for ϭf and ϭA (f0)
Frequency range (Hz) <0.2 0.2–0.5 0.5–1.0 1.0–2.0 >2.0
ε( f0) (Hz) 0.25f0 0.20f0 0.15f0 0.10f0 0.05f0θ( f0) for σA( f0) 3.0 2.5 2.0 1.78 1.58
Log θ( f0) for σlog H/V( f0) 0.48 0.40 0.30 0.25 0.20
Arab J Geosci
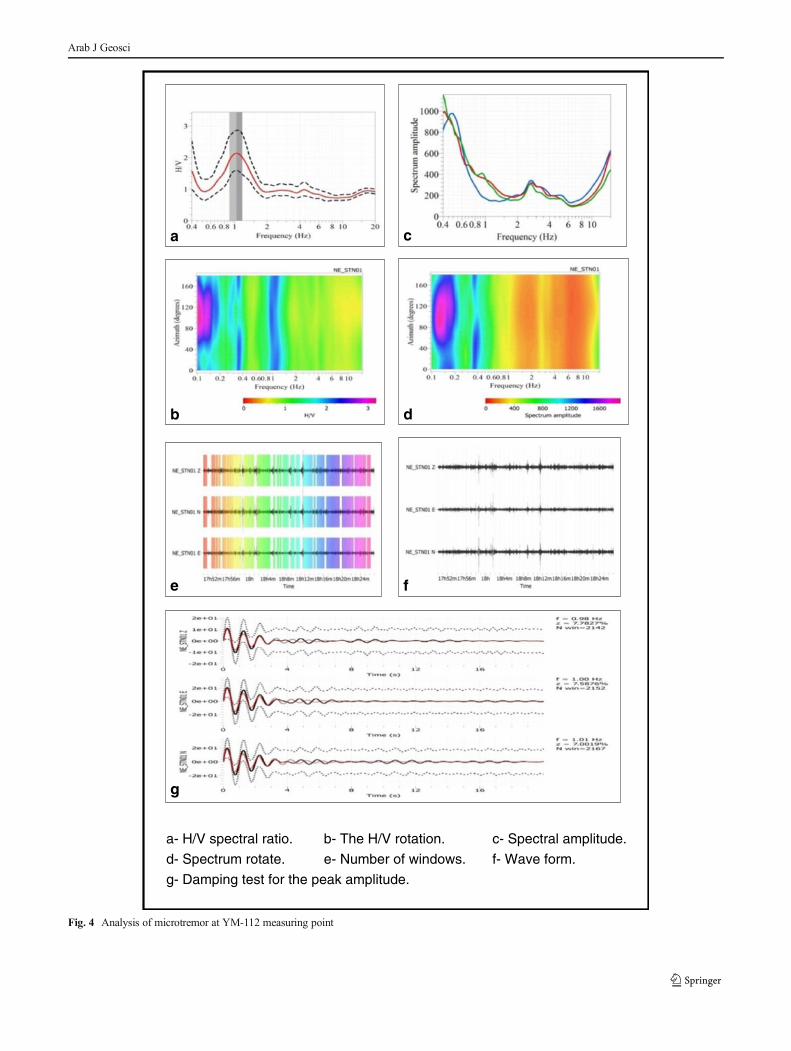
a- H/V spectral ratio. b- The H/V rotation. c- Spectral amplitude.
d- Spectrum rotate. e- Number of windows. f- Wave form.
g- Damping test for the peak amplitude.
a
b
c
d
e f
g
Fig. 4 Analysis of microtremor at YM-112 measuring point
Arab J Geosci
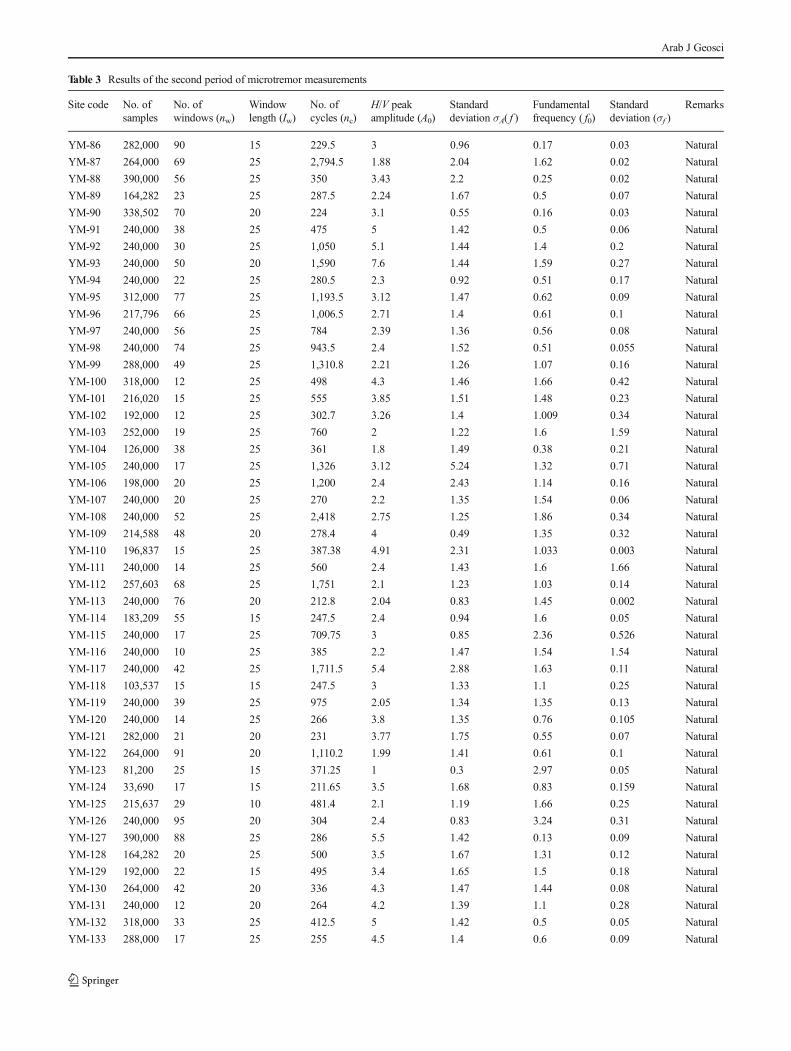
Table 3 Results of the second period of microtremor measurements
Site code No. ofsamples
No. ofwindows (nw)
Windowlength (Iw)
No. ofcycles (nc)
H/V peakamplitude (A0)
Standarddeviation σA( f )
Fundamentalfrequency ( f0)
Standarddeviation (σf )
Remarks
YM-86 282,000 90 15 229.5 3 0.96 0.17 0.03 Natural
YM-87 264,000 69 25 2,794.5 1.88 2.04 1.62 0.02 Natural
YM-88 390,000 56 25 350 3.43 2.2 0.25 0.02 Natural
YM-89 164,282 23 25 287.5 2.24 1.67 0.5 0.07 Natural
YM-90 338,502 70 20 224 3.1 0.55 0.16 0.03 Natural
YM-91 240,000 38 25 475 5 1.42 0.5 0.06 Natural
YM-92 240,000 30 25 1,050 5.1 1.44 1.4 0.2 Natural
YM-93 240,000 50 20 1,590 7.6 1.44 1.59 0.27 Natural
YM-94 240,000 22 25 280.5 2.3 0.92 0.51 0.17 Natural
YM-95 312,000 77 25 1,193.5 3.12 1.47 0.62 0.09 Natural
YM-96 217,796 66 25 1,006.5 2.71 1.4 0.61 0.1 Natural
YM-97 240,000 56 25 784 2.39 1.36 0.56 0.08 Natural
YM-98 240,000 74 25 943.5 2.4 1.52 0.51 0.055 Natural
YM-99 288,000 49 25 1,310.8 2.21 1.26 1.07 0.16 Natural
YM-100 318,000 12 25 498 4.3 1.46 1.66 0.42 Natural
YM-101 216,020 15 25 555 3.85 1.51 1.48 0.23 Natural
YM-102 192,000 12 25 302.7 3.26 1.4 1.009 0.34 Natural
YM-103 252,000 19 25 760 2 1.22 1.6 1.59 Natural
YM-104 126,000 38 25 361 1.8 1.49 0.38 0.21 Natural
YM-105 240,000 17 25 1,326 3.12 5.24 1.32 0.71 Natural
YM-106 198,000 20 25 1,200 2.4 2.43 1.14 0.16 Natural
YM-107 240,000 20 25 270 2.2 1.35 1.54 0.06 Natural
YM-108 240,000 52 25 2,418 2.75 1.25 1.86 0.34 Natural
YM-109 214,588 48 20 278.4 4 0.49 1.35 0.32 Natural
YM-110 196,837 15 25 387.38 4.91 2.31 1.033 0.003 Natural
YM-111 240,000 14 25 560 2.4 1.43 1.6 1.66 Natural
YM-112 257,603 68 25 1,751 2.1 1.23 1.03 0.14 Natural
YM-113 240,000 76 20 212.8 2.04 0.83 1.45 0.002 Natural
YM-114 183,209 55 15 247.5 2.4 0.94 1.6 0.05 Natural
YM-115 240,000 17 25 709.75 3 0.85 2.36 0.526 Natural
YM-116 240,000 10 25 385 2.2 1.47 1.54 1.54 Natural
YM-117 240,000 42 25 1,711.5 5.4 2.88 1.63 0.11 Natural
YM-118 103,537 15 15 247.5 3 1.33 1.1 0.25 Natural
YM-119 240,000 39 25 975 2.05 1.34 1.35 0.13 Natural
YM-120 240,000 14 25 266 3.8 1.35 0.76 0.105 Natural
YM-121 282,000 21 20 231 3.77 1.75 0.55 0.07 Natural
YM-122 264,000 91 20 1,110.2 1.99 1.41 0.61 0.1 Natural
YM-123 81,200 25 15 371.25 1 0.3 2.97 0.05 Natural
YM-124 33,690 17 15 211.65 3.5 1.68 0.83 0.159 Natural
YM-125 215,637 29 10 481.4 2.1 1.19 1.66 0.25 Natural
YM-126 240,000 95 20 304 2.4 0.83 3.24 0.31 Natural
YM-127 390,000 88 25 286 5.5 1.42 0.13 0.09 Natural
YM-128 164,282 20 25 500 3.5 1.67 1.31 0.12 Natural
YM-129 192,000 22 15 495 3.4 1.65 1.5 0.18 Natural
YM-130 264,000 42 20 336 4.3 1.47 1.44 0.08 Natural
YM-131 240,000 12 20 264 4.2 1.39 1.1 0.28 Natural
YM-132 318,000 33 25 412.5 5 1.42 0.5 0.05 Natural
YM-133 288,000 17 25 255 4.5 1.4 0.6 0.09 Natural
Arab J Geosci
& Reprocessing with less and less smoothing: in the case ofindustrial origin, theH/V peak should become sharper andsharper, which is not the case for a site effect peak linkedto soil characteristics.
& If other measurements have been performed in the samearea, determine whether a peak exists at the same frequen-cies with comparable sharpness (the amplitude of the
associated peak, even for fixed smoothing parameters,may vary significantly from site to site, being transformedsometimes into a trough).
& Another very effective check is to apply the randomdecrement to the ambient vibration recordings in order toderive the “impulse response” around the frequency ofinterest: if the corresponding damping (z) is very low
Table 3 (continued)
Site code No. ofsamples
No. ofwindows (nw)
Windowlength (Iw)
No. ofcycles (nc)
H/V peakamplitude (A0)
Standarddeviation σA( f )
Fundamentalfrequency ( f0)
Standarddeviation (σf )
Remarks
YM-134 264,000 85 15 637.5 5.2 1.61 0.5 0.16 Natural
YM-135 390,000 90 15 540 5.5 1.53 0.4 0.05 Natural
YM-136 164,282 21 25 735 3.5 1.7 1.4 1.38 Natural
YM-137 318,000 10 20 300 3.5 1.69 1.5 1.03 Natural
YM-138 81,200 20 15 510 2.1 1.2 1.7 0.3 Natural
YM-139 288,000 19 25 950 1.6 0.89 2 0.2 Natural
YM-140 240,000 20 15 630 2 0.99 2.1 0.06 Natural
YM-141 280,000 20 15 260 4.2 1.41 1.41 0.09 Natural
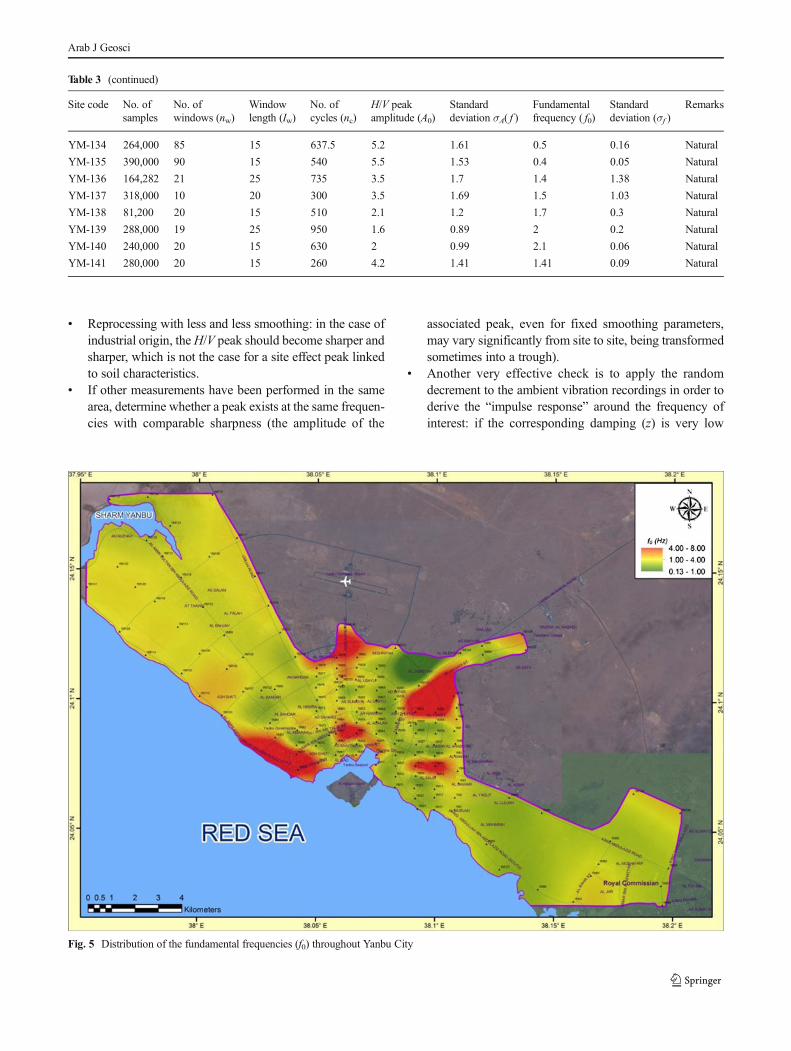
Fig. 5 Distribution of the fundamental frequencies (f0) throughout Yanbu City
Arab J Geosci
(below 1 %), an anthropogenic origin may be assumedalmost certainly, and the frequency should not be consid-ered for interpretation purposes (Fig. 4).
At each site, the microtremor data file was divided intoseveral time windows of 15–25 s for spectral calculations(Fig. 4). This time window is proven sufficiently long to providestable results. The selected time windows were Fourier trans-formed using cosine tapering before transformation. Then, thespectra were smoothed with a Konno and Ohmachi algorithm(Konno and Ohmachi 1998). After data smoothing, the spectraof EWand NS channels at a site were divided by the spectra ofthe vertical channel (Nakamura estimate) in order to obtainspectral ratios. The geometrical average of the two componentratios is the site amplification function. However, in most cases,due to the influence of sources like dense population, hightraffic, and industrial activities, the resonance frequency cannotbe directly identified from microtremor spectra.
Figure 4 presents the result of microtremor measurementsfor YM-112. As shown, the dominant peak is near 1.03 Hz,while the observed amplification factor is about 2.1. The solidline represents the average value. Dominant frequencies and
amplifications from all measurement sites across Yanbu Cityare summarized in Table 3 for the second period ofmicrotremor measurements.
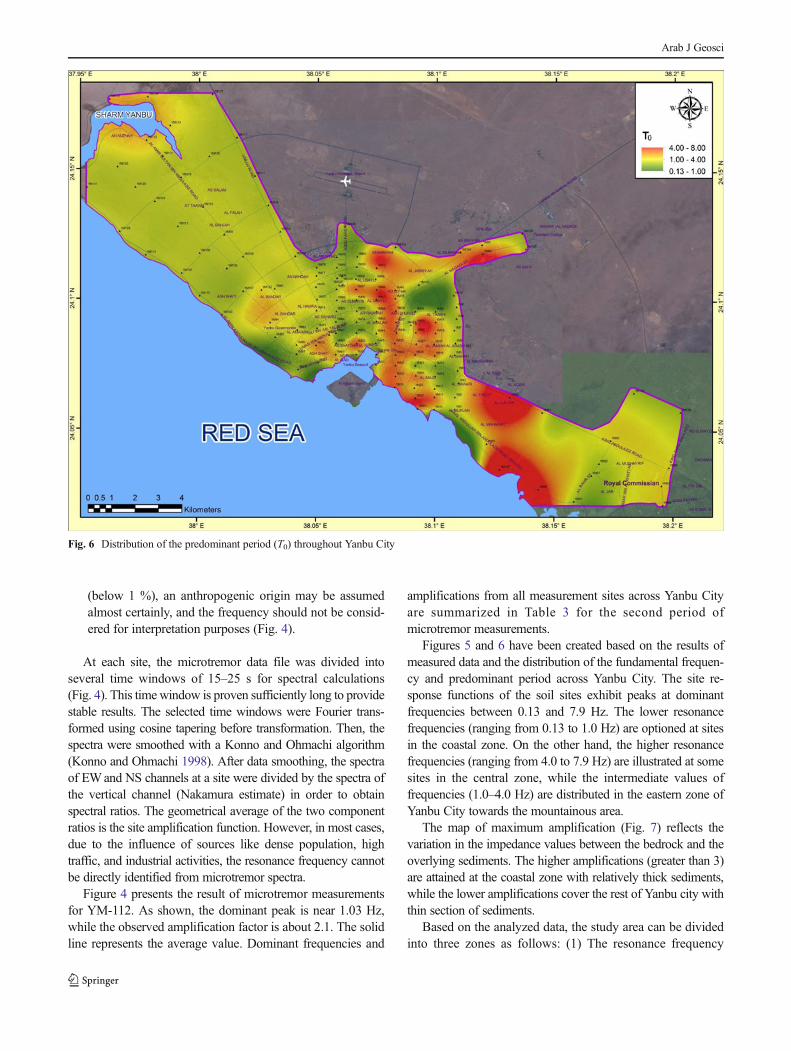
Figures 5 and 6 have been created based on the results ofmeasured data and the distribution of the fundamental frequen-cy and predominant period across Yanbu City. The site re-sponse functions of the soil sites exhibit peaks at dominantfrequencies between 0.13 and 7.9 Hz. The lower resonancefrequencies (ranging from 0.13 to 1.0 Hz) are optioned at sitesin the coastal zone. On the other hand, the higher resonancefrequencies (ranging from 4.0 to 7.9 Hz) are illustrated at somesites in the central zone, while the intermediate values offrequencies (1.0–4.0 Hz) are distributed in the eastern zone ofYanbu City towards the mountainous area.
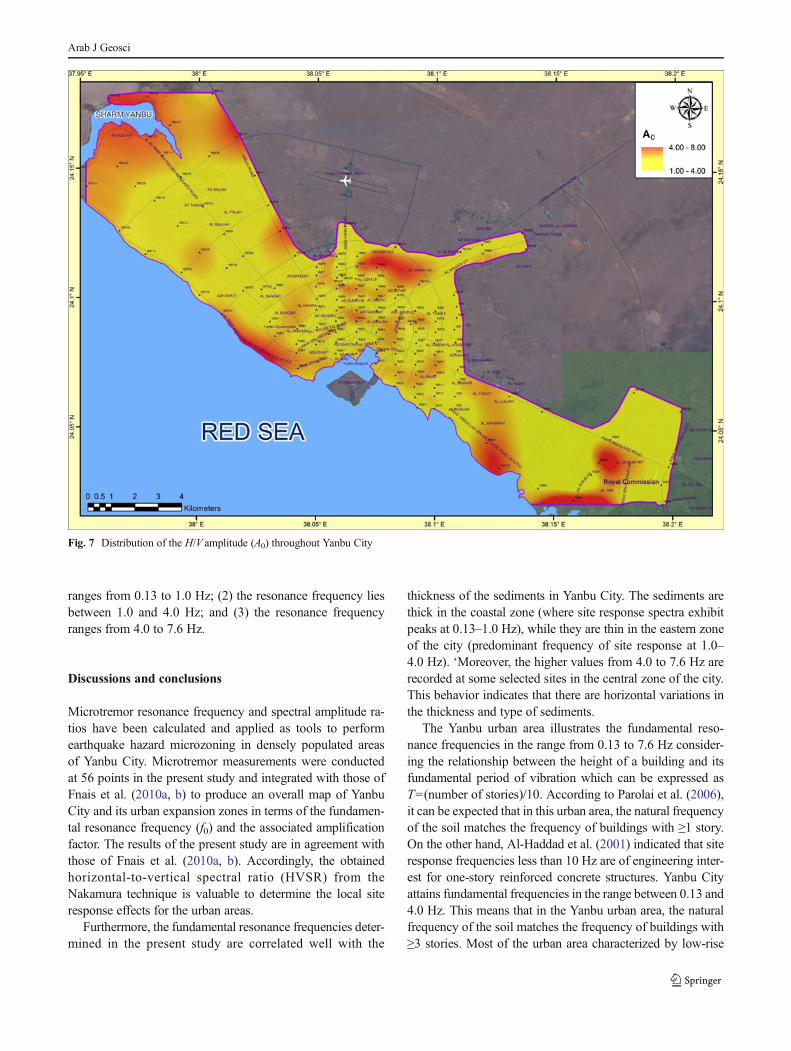
The map of maximum amplification (Fig. 7) reflects thevariation in the impedance values between the bedrock and theoverlying sediments. The higher amplifications (greater than 3)are attained at the coastal zone with relatively thick sediments,while the lower amplifications cover the rest of Yanbu city withthin section of sediments.
Based on the analyzed data, the study area can be dividedinto three zones as follows: (1) The resonance frequency
Fig. 6 Distribution of the predominant period (T0) throughout Yanbu City
Arab J Geosci
ranges from 0.13 to 1.0 Hz; (2) the resonance frequency liesbetween 1.0 and 4.0 Hz; and (3) the resonance frequencyranges from 4.0 to 7.6 Hz.
Discussions and conclusions
Microtremor resonance frequency and spectral amplitude ra-tios have been calculated and applied as tools to performearthquake hazard microzoning in densely populated areasof Yanbu City. Microtremor measurements were conductedat 56 points in the present study and integrated with those ofFnais et al. (2010a, b) to produce an overall map of YanbuCity and its urban expansion zones in terms of the fundamen-tal resonance frequency (f0) and the associated amplificationfactor. The results of the present study are in agreement withthose of Fnais et al. (2010a, b). Accordingly, the obtainedhorizontal-to-vertical spectral ratio (HVSR) from theNakamura technique is valuable to determine the local siteresponse effects for the urban areas.
Furthermore, the fundamental resonance frequencies deter-mined in the present study are correlated well with the
thickness of the sediments in Yanbu City. The sediments arethick in the coastal zone (where site response spectra exhibitpeaks at 0.13–1.0 Hz), while they are thin in the eastern zoneof the city (predominant frequency of site response at 1.0–4.0 Hz). ‘Moreover, the higher values from 4.0 to 7.6 Hz arerecorded at some selected sites in the central zone of the city.This behavior indicates that there are horizontal variations inthe thickness and type of sediments.
The Yanbu urban area illustrates the fundamental reso-nance frequencies in the range from 0.13 to 7.6 Hz consider-ing the relationship between the height of a building and itsfundamental period of vibration which can be expressed asT=(number of stories)/10. According to Parolai et al. (2006),it can be expected that in this urban area, the natural frequencyof the soil matches the frequency of buildings with ≥1 story.On the other hand, Al-Haddad et al. (2001) indicated that siteresponse frequencies less than 10 Hz are of engineering inter-est for one-story reinforced concrete structures. Yanbu Cityattains fundamental frequencies in the range between 0.13 and4.0 Hz. This means that in the Yanbu urban area, the naturalfrequency of the soil matches the frequency of buildings with≥3 stories. Most of the urban area characterized by low-rise
Fig. 7 Distribution of the H/V amplitude (A0) throughout Yanbu City
Arab J Geosci
buildings and the frequency of the soil cover can be close totheir fundamental frequency of vibration. When the funda-mental frequency of vibration of a building is higher than thefundamental frequency of soil f0, it may, however, be close tothe frequency of higher modes. Higher modes are expected atfrequencies fn=(2n+1)f0 where n=1, 2, 3…, and f0 is thefundamental frequency. The H/V spectral ratio provides thelower frequency threshold from which ground motion ampli-fication due to soft soil can be expected. Therefore, it cannotbe excluded that in the Yanbu urban area, such soil amplifi-cation of ground motions may also occur at higher modefrequencies close to the fundamental frequency of vibrationof low-rise buildings, even if it is smaller than that at thefundamental frequency of the sedimentary cover.
Site amplification for Yanbu City indicates that soils canamplify ground motion by as much as 3.0 times its bedrocklevel. This is applied for different soil classes, where all siteshave resonance frequencies of engineering interest. The rela-tion between resonance frequency and amplification repre-sents the alarming condition that soil having resonance fre-quencies of interest can amplify earthquake ground motion asmuch as 3.0 times. It is indicated that the amplification isgenerally decreasing with increasing frequency. The obtainedvalues of amplification are in agreement with the surfacegeology of the study area. Higher H/V values occupy thecoastal zone of Yanbu City due to the presence of coastaldeposits and sabkhah sediments. The lower values are en-countered in the eastern zone of the city. This variation inthe H/V values also reflects variation in sediment thickness.
The eastern zone of Yanbu City has a frequency range from1.0 to 4.0, which means that these values correlated well withbuildings that have three to ten stories. Accordingly, thesebuildings suffer the greatest damage from earthquake groundmotion at a frequency close or equal to its natural frequency,and this is what already happened in Yanbu City wherebuildings with three and four stories were damaged in theeastern zone of Yanbu due to the Al-Ays earthquake swarm ofMay 2009
In the coastal zone, the frequency values (0.13–1.0 Hz)correlate with the high-rise buildings that suffer damage fromearthquake ground motion of distant earthquakes. The highervalues of frequency (4.0–7.6 Hz) that were distributed sparse-ly in the central zone of Yanbu City are correlated withbuildings with one and two stories. This means that thesebuildings could suffer greater damage from local or nearbyearthquakes.
Fnais et al. (2010a, b) simulated the ground motions of theAl-Ays earthquake (19 May 2009), in terms of PGA, PGV,and PGD at different sites in Yanbu City. They notice that thefundamental period of ground motions ranges from 0.1 to0.3 s. This corresponds to buildings with one to three floors.Consequently, some of the buildings with one to three floorsin Yanbu showed slight damage due to the Al-Ays earthquake.
The fundamental frequencies for Yanbu City are a prerequisiteto get knowledge about future earthquake scenarios in thearea. These results can greatly support the government insetting priorities in managing land use, enforcing buildingcodes, conducting programs for reducing the vulnerability ofexisting structures, and planning for emergency response andlong-term recovery.
Acknowledgement This project was supported by King Saud Univer-sity, Deanship of Scientific Research, College of Science research center.
References
Al-Haddad M, Al-Rrefeai T, Al-Amri A (2001) Geotechnical investiga-tion for earthquake resistance design in the Kingdom (phase 1)western coast. Res Proj No. AR-14–77 (part 1), funded by KingAbdulaziz City for Science and Technology (KACST)
Ambraseys NN,Melville CP, Adams RD (1994) The seismicity of Egypt,Arabia and the Red Sea: a historical review. Cambridge UniversityPress, Cambridge, 181 pp
Bard PY (2000) International training course on: seismology, seismic dataanalysis, hazard assessment and risk mitigation. Potsdam, Germany,1 October to 5 November 2000
Bard PY, SESAME Team (2004) Guidelines for the implementation ofthe H/V spectral ratio technique on ambient vibrations: measure-ments, processing and interpretations. SESAME European researchproject EVG1-CT-2000-00026 D23.12. http://sesame-fp5.obs.ujf-grenoble.fr
Borcherdt RD (1970) Effects of local geology on groundmotion near SanFrancisco Bay. Bull Seism Soc Am 60:29–61
El-Isa Z, Al-Shanti A (1989) Seismicity and tectonics of the Red Sea andWestern Arabia. Geophys J Royal Astron Soc 97:449–457
Field EH, Jacob KH (1993) The theoretical response of sedimentarylayers to ambient seismic noise. Geophys Res Lett 20(24):2925–2928
Field EH, Jacob KH (1995) A comparison and test of various site-response estimation techniques, including three that are notreference-site dependent. Bull Seism Soc Am 85:1127–1143
Fnais MS, Abdel-Rahman K, Al-Amri A (2010a) Ground motion simu-lation and response spectra at Yanbu city, western Saudi Arabia,using stochastic technique. Appl Geophys 5:23–46
Fnais MS, Kamal A-R, Al-Amri AM (2010b) Microtremor measure-ments in Yanbu City of western Saudi Arabia: a tool of seismicmicrozonation. J King Saude Univ Sci (ElSEVIER). doi:10.1016/j.jksus.2010.02.006
Gosar A (2007) Microtremor HVSR study for assessing site effects in theBovec basin (NW Slovenia) related to 1998 Mw5.6 and 2004Mw5.2 earthquakes. Eng Geol 91:178–193
Kagami H, Duke CM, Liang GC, Ohta Y (1986) Observation of 1- to 5-second microtremors and their application to earthquake engineer-ing. Part II. Evaluation of site effect upon seismic wave amplifica-tion deep soil deposits. Bull Seism Soc Am 72:987–998
Katz LJ (1976) Microtremor analysis of local geological conditions. BullSeism Soc Am 66:45–60
Katz LJ, Bellon RS (1978) Microtremor site analysis study at Beatty.Nevada Bull Seism Soc Am 68:757–765
Konno K, Ohmachi T (1998) Ground-motion characteristics estimatedfrom spectral ratio between horizontal and vertical components ofmicrotremors. Bull Seism Soc Am 88:228–241
Arab J Geosci
Lachet C, Bard PY (1994) Numerical and theoretical investigations on thepossibilities and limitations of Nakamura’s technique. J Phys Earth42:377–397
Lermo J, Chavez-Garcia FJ (1993) Site effect evaluation using spectralratios with only one station. Bull Seism Soc Am 83:1574–1594
Lermo J, Chavez-Garcia FJ (1994) Are microtremors useful in siteresponse evaluation? Bull Seism Soc Am 84:1350–1364
Malagnini L, Tricarico P, Rovelli A, Herrmann RB, Opice S, Biella G,Franco R (1996) Explosion, earthquake, and ambient noise record-ing in a Pliocene sediment-filled valley: inferences on seismicresponse properties by reference- and non-reference-site techniques.Bull Seism Soc Am 86:670–682
Mucciarelli M (1998) Reliability and applicability of Nakamura’s tech-nique using microtremors: an experimental approach. J EarthquakeEng 4:625–638
Mucciarelli M, Contri P, Monachesi G, Calvano G (1998) Towards anempirical method to instrumentally assess the seismic vulnerabilityof existing buildings. Proceedings of Conference on DisasterMitigation and Information Technology, London
Nakamura Y (1989) A method for dynamic characteristics estimation ofsubsurface using microtremor on the ground surface. Q Rep RailwTech Res Inst Tokyo 30(1):25–33
Nakamura Y (1996) Real-time information systems for hazards mitiga-tion. Proceedings of the 11th World Conference on EarthquakeEngineering. Acapulco, Mexico
Ohta Y, Kagami H, GotoN,KudoK (1978) Observation of 1- to 5-secondmicrotremors and their application to earthquake engineering. Part I:Comparison with long period accelerations at the Tokachi-Okiearthquake of 1968. Bull Seism Soc Am 68:767–779
Parolai S, Richwalski SM, Milkereit C, Fah D (2006) S-wave velocityprofiles for earthquake engineering purposes for the Cologne area(Germany). Bull Earthquake Eng 4:65–94
Pellaton C (1975) Geology and mineral exploration of the Jabal Salajahquadrangle. 24/37 B: Bureau de Recherches Géologiques etMiniéres Technical Record 75 JED 26: 31 p
Seekins LC, Wennerberg L, Margheriti L, Liu HP (1996) Site amplifica-tion at five locations in San Francisco, California: a comparison of Swaves, codas and microtremors. Bull Seism Soc Am 86:627–635
Teves-Costa Matias P, Bard PY (1996) Seismic behavior estimation ofthin alluvium layers using microtremor recordings. J Soil DynEarthquake Eng 15:201–209
Theodulidis N, Bard PY, Archuleta R, Bouchon M (1996) Horizontal-to-vertical spectral ratio and geological conditions: the case of Garnervalley downhole in Southern California. Bull Seism Soc Am 68:767–779
Wakamatsu K, Yasui Y (1996) Possibility of estimation for amplificationcharacteristics of soil deposits based on ratio of horizontal to verticalspectra of microtremors. Proceedings of the 11th World Conferenceon Earthquake Engineering Acapulco, Mexico. Geophys Prospect30:55–70
Arab J Geosci