Embed Size (px)
Citation preview
11/19/2014
1
Copyright © 2014 Timmons Group
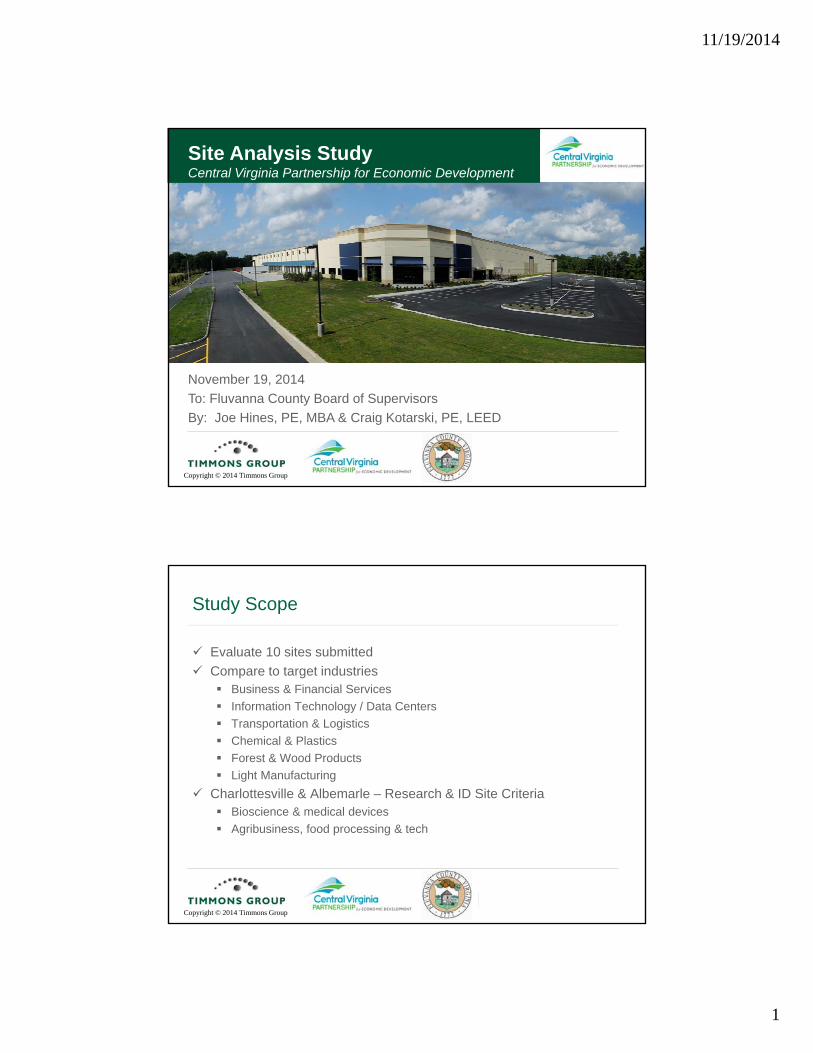
November 19, 2014 To: Fluvanna County Board of SupervisorsBy: Joe Hines, PE, MBA & Craig Kotarski, PE, LEED
Site Analysis StudyCentral Virginia Partnership for Economic Development
Copyright © 2014 Timmons Group
2
Study Scope
Evaluate 10 sites submittedCompare to target industries
Business & Financial ServicesInformation Technology / Data CentersTransportation & LogisticsChemical & PlasticsForest & Wood ProductsLight Manufacturing
Charlottesville & Albemarle – Research & ID Site CriteriaBioscience & medical devicesAgribusiness, food processing & tech
11/19/2014
2
Copyright © 2014 Timmons Group
3
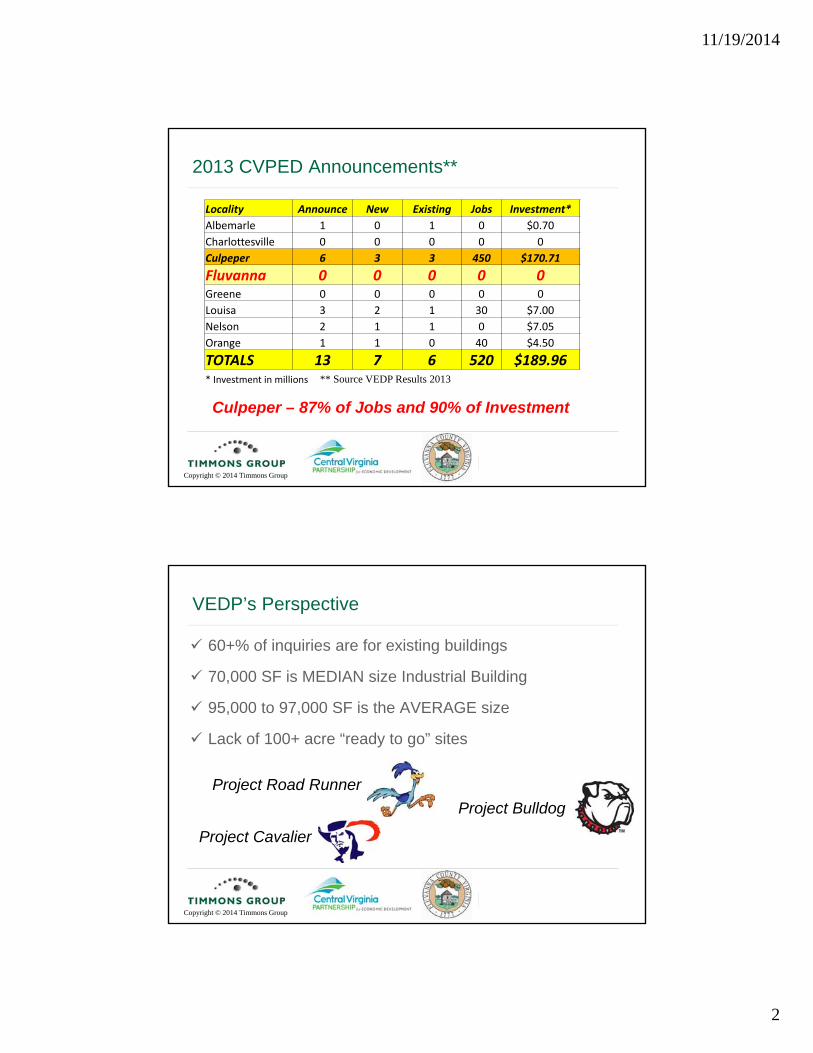
2013 CVPED Announcements**
Locality Announce New Existing Jobs Investment*Albemarle 1 0 1 0 $0.70Charlottesville 0 0 0 0 0Culpeper 6 3 3 450 $170.71 Fluvanna 0 0 0 0 0Greene 0 0 0 0 0Louisa 3 2 1 30 $7.00 Nelson 2 1 1 0 $7.05 Orange 1 1 0 40 $4.50 TOTALS 13 7 6 520 $189.96* Investment in millions ** Source VEDP Results 2013
Culpeper – 87% of Jobs and 90% of Investment
Copyright © 2014 Timmons Group
4
VEDP’s Perspective
60+% of inquiries are for existing buildings
70,000 SF is MEDIAN size Industrial Building
95,000 to 97,000 SF is the AVERAGE size
Lack of 100+ acre “ready to go” sites
Project Road RunnerProject Bulldog
Project Cavalier
11/19/2014
3
Copyright © 2014 Timmons Group
5
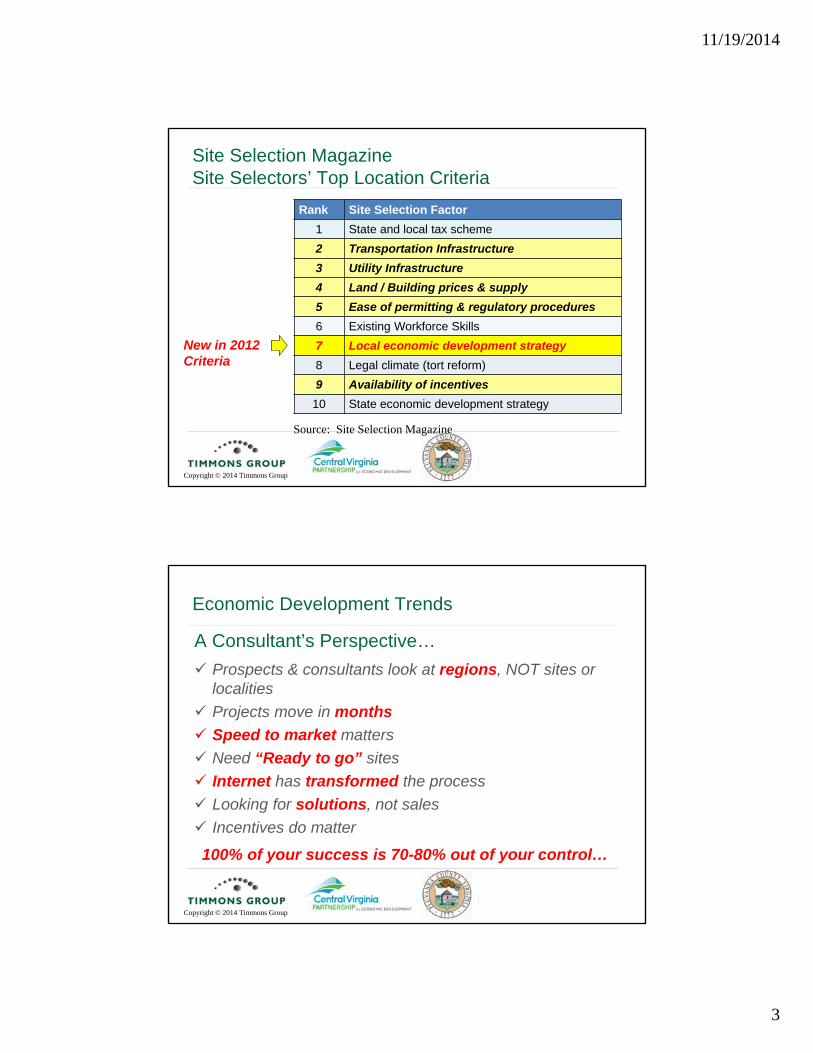
Site Selection MagazineSite Selectors’ Top Location Criteria
Rank Site Selection Factor1 State and local tax scheme2 Transportation Infrastructure3 Utility Infrastructure4 Land / Building prices & supply5 Ease of permitting & regulatory procedures6 Existing Workforce Skills7 Local economic development strategy8 Legal climate (tort reform)9 Availability of incentives10 State economic development strategy
Source: Site Selection Magazine
New in 2012Criteria
Copyright © 2014 Timmons Group
6
Economic Development Trends
A Consultant’s Perspective…Prospects & consultants look at regions, NOT sites or localitiesProjects move in monthsSpeed to market mattersNeed “Ready to go” sitesInternet has transformed the processLooking for solutions, not salesIncentives do matter
100% of your success is 70-80% out of your control…
11/19/2014
4
Copyright © 2014 Timmons Group
7
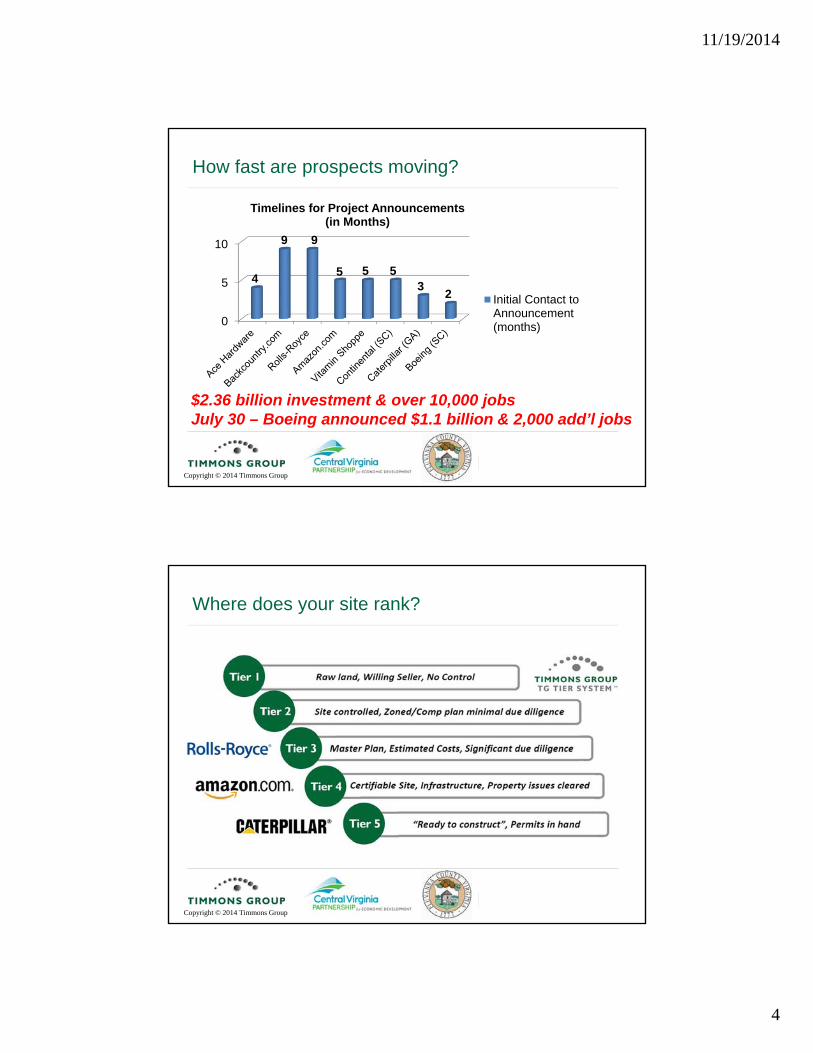
How fast are prospects moving?
0
5
10
4
9 9
5 5 53 2
Timelines for Project Announcements(in Months)
Initial Contact toAnnouncement(months)
$2.36 billion investment & over 10,000 jobsJuly 30 – Boeing announced $1.1 billion & 2,000 add’l jobs
Copyright © 2014 Timmons Group
8
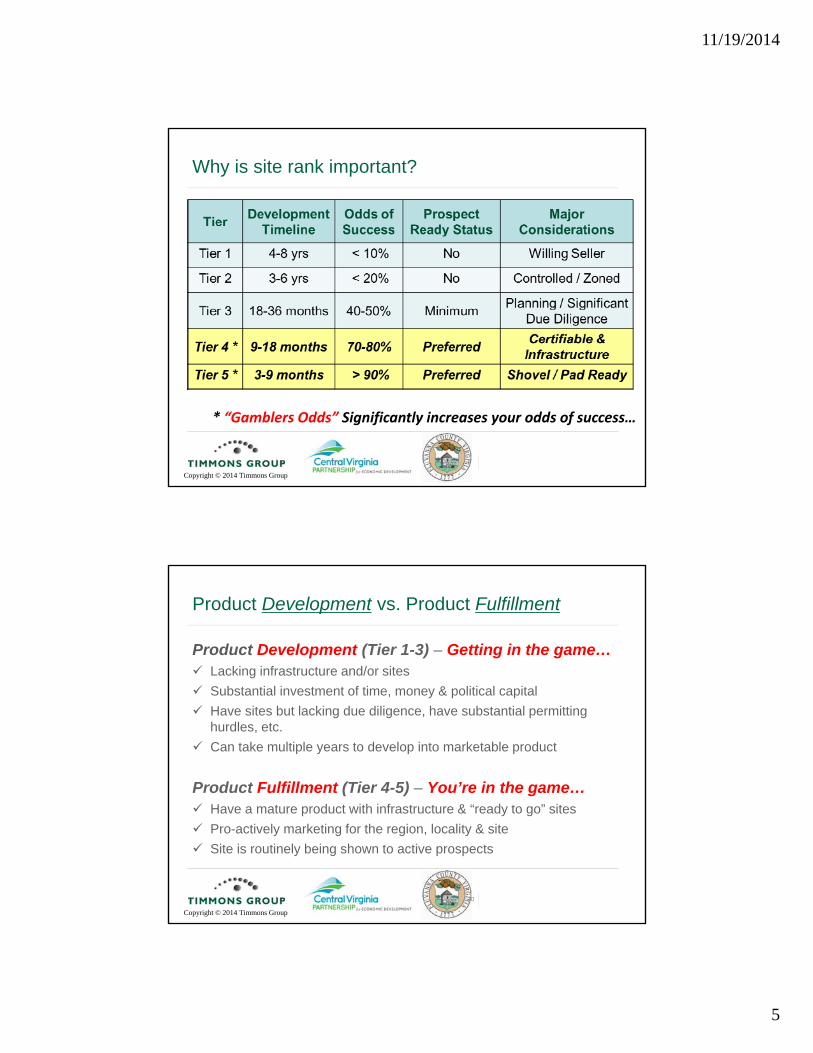
Where does your site rank?
11/19/2014
5
Copyright © 2014 Timmons Group
9
Why is site rank important?
* “Gamblers Odds” Significantly increases your odds of success…
Copyright © 2014 Timmons Group
10
Product Development vs. Product Fulfillment
Product Development (Tier 1-3) – Getting in the game…Lacking infrastructure and/or sitesSubstantial investment of time, money & political capitalHave sites but lacking due diligence, have substantial permitting hurdles, etc.Can take multiple years to develop into marketable product
Product Fulfillment (Tier 4-5) – You’re in the game…Have a mature product with infrastructure & “ready to go” sitesPro-actively marketing for the region, locality & siteSite is routinely being shown to active prospects
11/19/2014
6
Copyright © 2014 Timmons Group
11
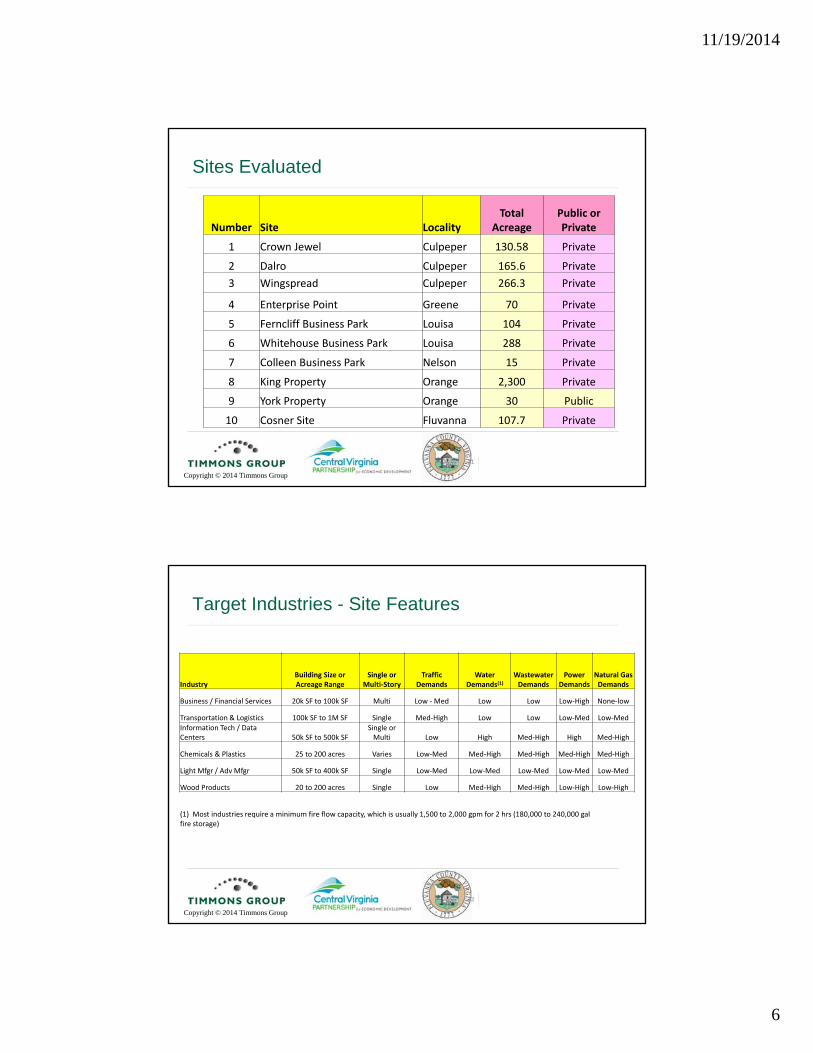
Sites Evaluated
Number Site LocalityTotal
AcreagePublic or Private
1 Crown Jewel Culpeper 130.58 Private
2 Dalro Culpeper 165.6 Private3 Wingspread Culpeper 266.3 Private
4 Enterprise Point Greene 70 Private
5 Ferncliff Business Park Louisa 104 Private
6 Whitehouse Business Park Louisa 288 Private
7 Colleen Business Park Nelson 15 Private
8 King Property Orange 2,300 Private
9 York Property Orange 30 Public
10 Cosner Site Fluvanna 107.7 Private
Copyright © 2014 Timmons Group
12
Target Industries - Site Features
IndustryBuilding Size or Acreage Range
Single or Multi‐Story
Traffic Demands
Water Demands(1)
Wastewater Demands
Power Demands
Natural Gas Demands
Business / Financial Services 20k SF to 100k SF Multi Low ‐Med Low Low Low‐High None‐low
Transportation & Logistics 100k SF to 1M SF Single Med‐High Low Low Low‐Med Low‐MedInformation Tech / Data Centers 50k SF to 500k SF
Single or Multi Low High Med‐High High Med‐High
Chemicals & Plastics 25 to 200 acres Varies Low‐Med Med‐High Med‐High Med‐High Med‐High
Light Mfgr / Adv Mfgr 50k SF to 400k SF Single Low‐Med Low‐Med Low‐Med Low‐Med Low‐Med
Wood Products 20 to 200 acres Single Low Med‐High Med‐High Low‐High Low‐High
(1) Most industries require a minimum fire flow capacity, which is usually 1,500 to 2,000 gpm for 2 hrs (180,000 to 240,000 gal fire storage)
11/19/2014
7
Copyright © 2014 Timmons Group
13
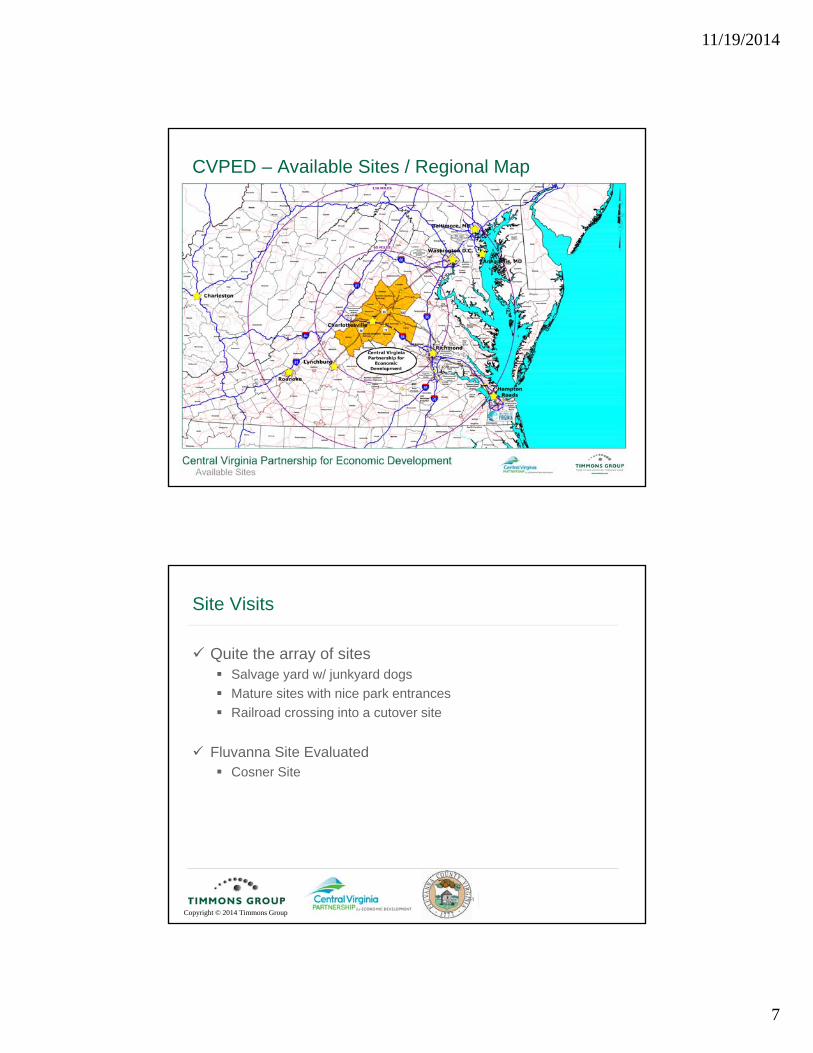
CVPED – Available Sites / Regional Map
Copyright © 2014 Timmons Group
14
Site Visits
Quite the array of sitesSalvage yard w/ junkyard dogsMature sites with nice park entrancesRailroad crossing into a cutover site
Fluvanna Site EvaluatedCosner Site
11/19/2014
8
Copyright © 2014 Timmons Group
15
CVPED Site Basics
9 privately owned and 1 publicly owned sites4 rail served sites6 sites with Natural Gas availability3 potential Rail & NG Electric Service Providers
3 served by Dominion Power4 served by Central Virginia Elec Coop3 served by Rappahannock Elec Coop
2 sites zoned RA or A1 (agricultural)2 sites not served by public water & sewer
Copyright © 2014 Timmons Group
16
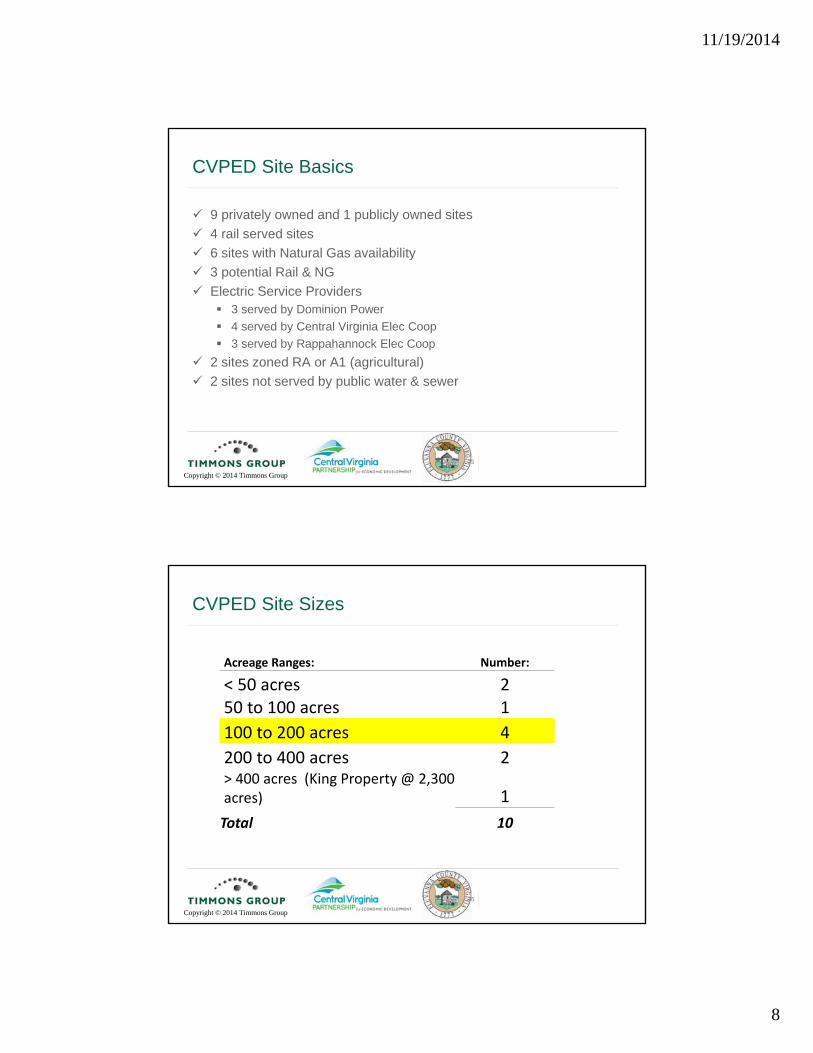
CVPED Site Sizes
Acreage Ranges: Number:
< 50 acres 250 to 100 acres 1100 to 200 acres 4200 to 400 acres 2> 400 acres (King Property @ 2,300 acres) 1Total 10
11/19/2014
9
Copyright © 2014 Timmons Group
17
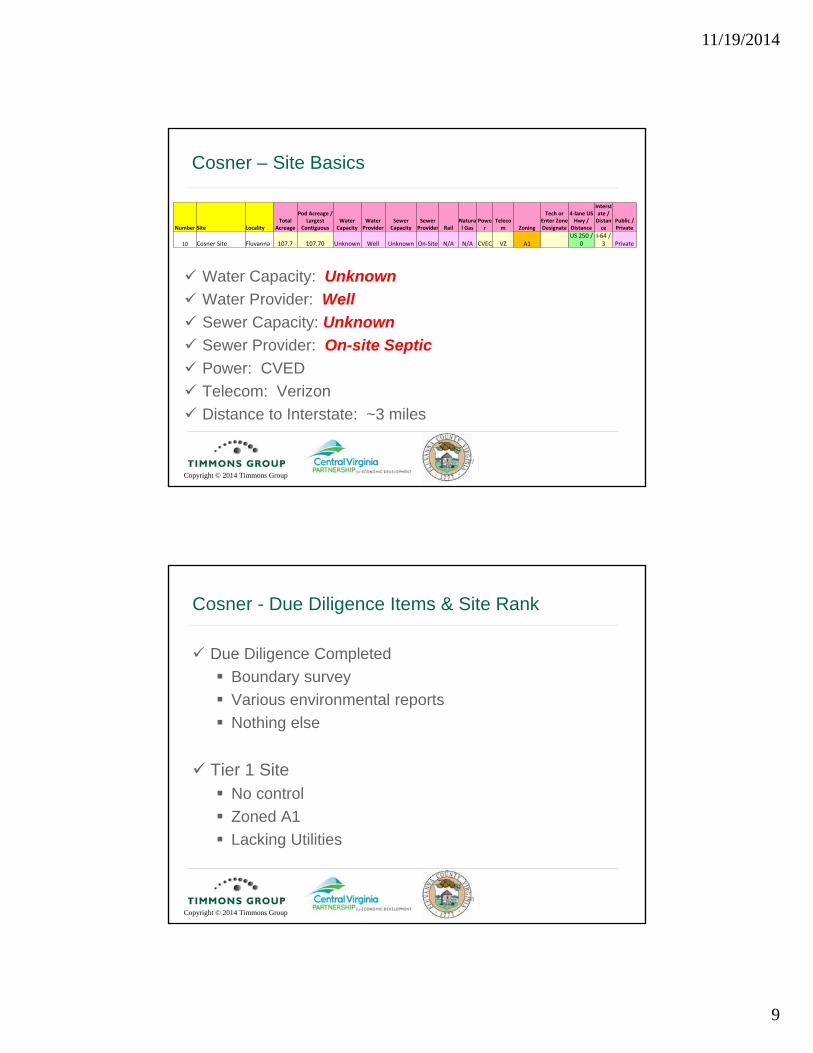
Cosner – Site Basics
Number Site LocalityTotal
Acreage
Pod Acreage / Largest
ContiguousWater Capacity
Water Provider
Sewer Capacity
Sewer Provider Rail
Natural Gas
Power
Telecom Zoning
Tech or Enter Zone Designate
4‐lane US Hwy /
Distance
Interstate / Distance
Public / Private
10 Cosner Site Fluvanna 107.7 107.70 Unknown Well Unknown On‐Site N/A N/A CVEC VZ A1US 250 /
0I‐64 / 3 Private
Water Capacity: UnknownWater Provider: WellSewer Capacity: UnknownSewer Provider: On-site SepticPower: CVEDTelecom: VerizonDistance to Interstate: ~3 miles
Copyright © 2014 Timmons Group
18
Cosner - Due Diligence Items & Site Rank
Due Diligence CompletedBoundary surveyVarious environmental reportsNothing else
Tier 1 SiteNo controlZoned A1Lacking Utilities
11/19/2014
10
Copyright © 2014 Timmons Group
19
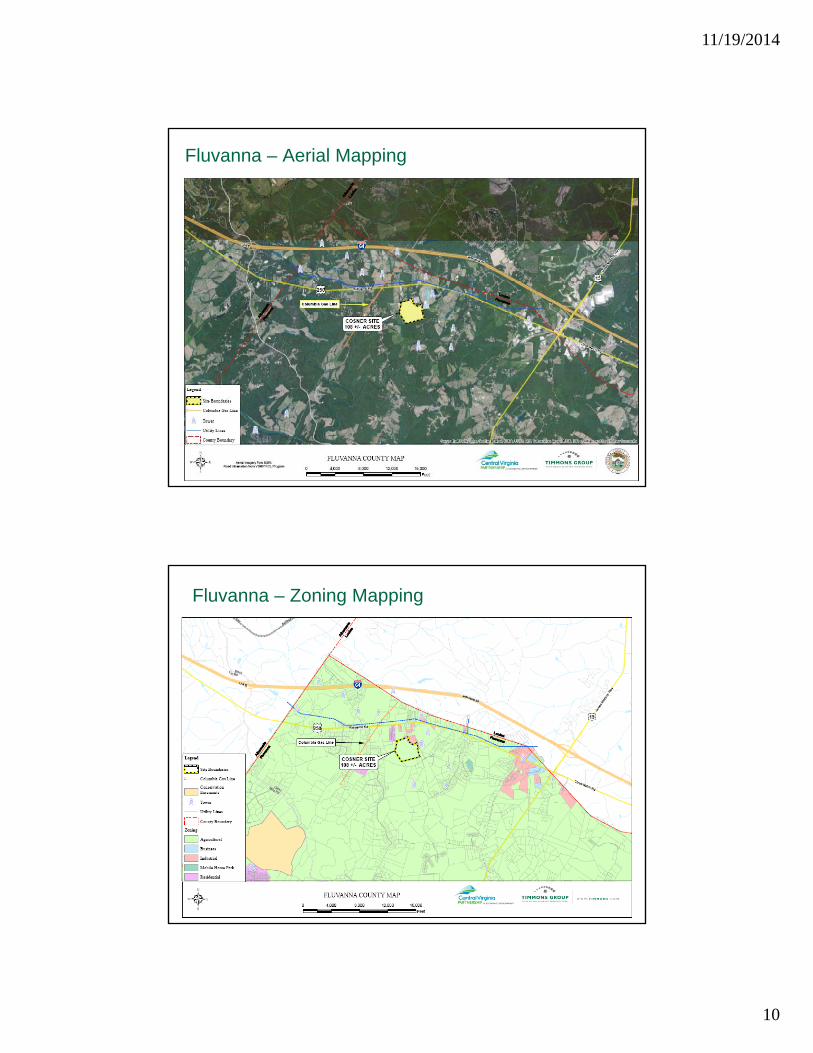
Fluvanna – Aerial Mapping
Copyright © 2014 Timmons Group
20
Fluvanna – Zoning Mapping
11/19/2014
11
Copyright © 2014 Timmons Group
21
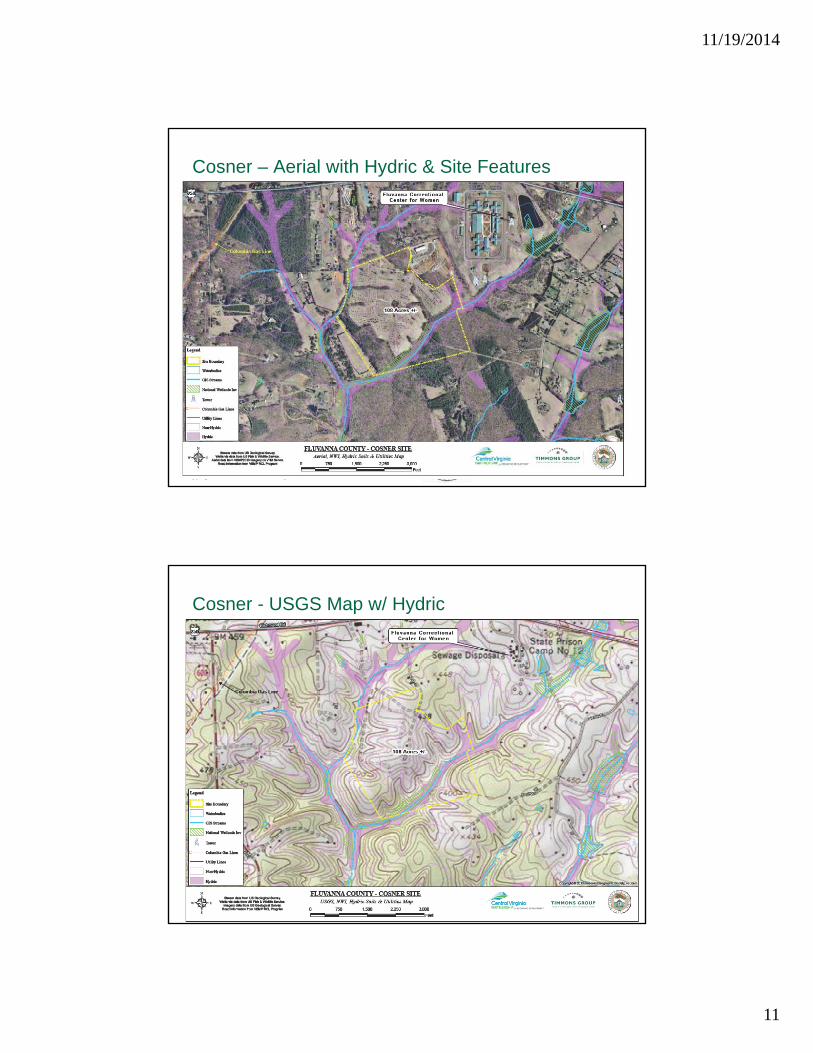
Cosner – Aerial with Hydric & Site Features
Copyright © 2014 Timmons Group
22
Cosner - USGS Map w/ Hydric
11/19/2014
12
Copyright © 2014 Timmons Group
23
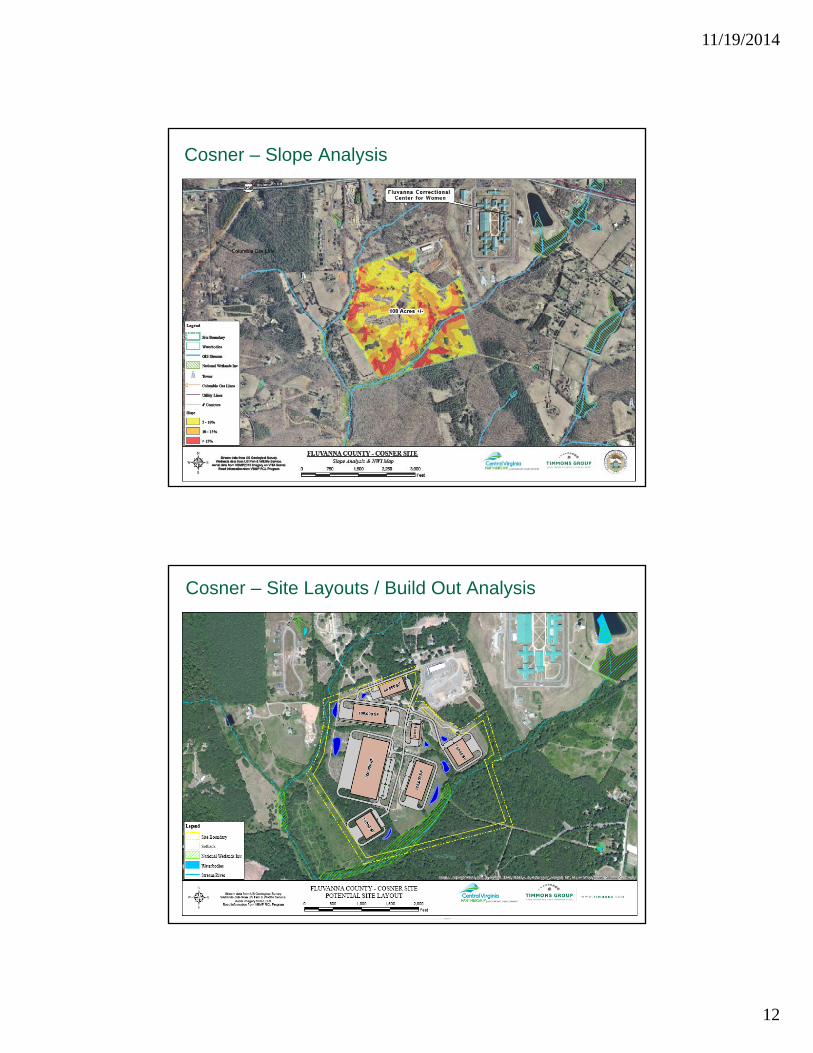
Cosner – Slope Analysis
Copyright © 2014 Timmons Group
24
Cosner – Site Layouts / Build Out Analysis
11/19/2014
13
Copyright © 2014 Timmons Group
25
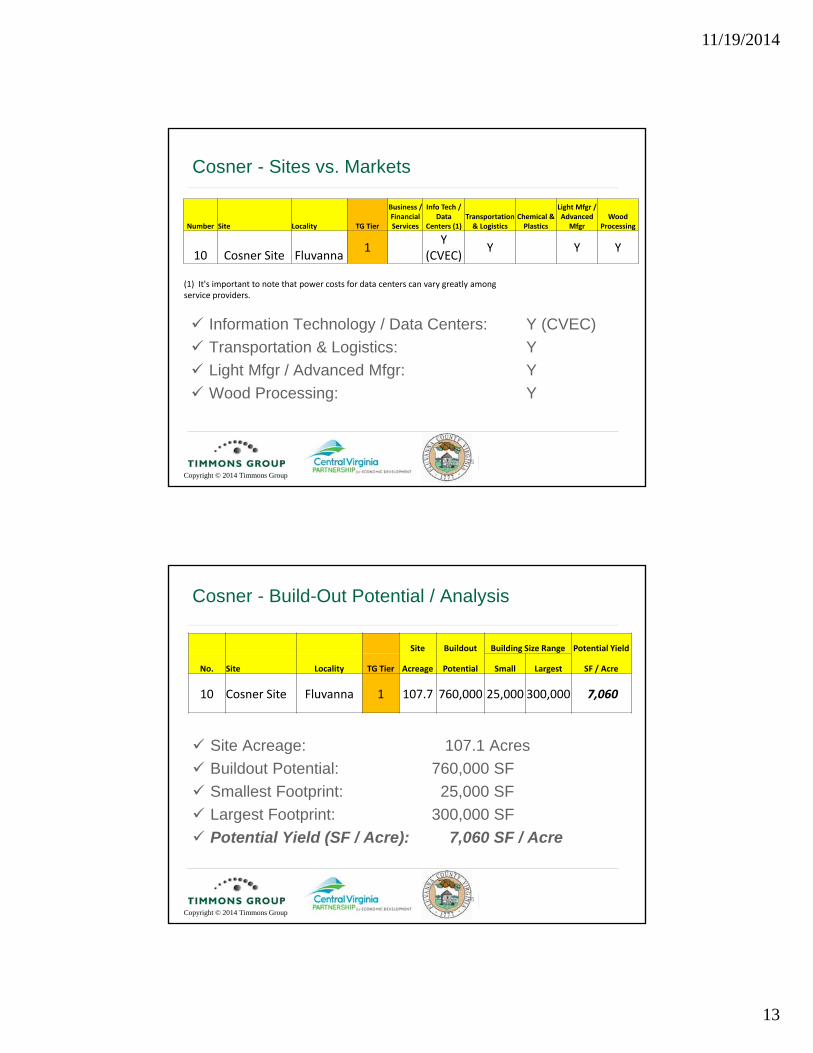
Cosner - Sites vs. Markets
Number Site Locality TG Tier
Business / Financial Services
Info Tech / Data
Centers (1)Transportation & Logistics
Chemical & Plastics
Light Mfgr / Advanced
MfgrWood
Processing
10 Cosner Site Fluvanna 1 Y (CVEC) Y Y Y
(1) It's important to note that power costs for data centers can vary greatly among service providers.
Information Technology / Data Centers: Y (CVEC)Transportation & Logistics: YLight Mfgr / Advanced Mfgr: YWood Processing: Y
Copyright © 2014 Timmons Group
26
Cosner - Build-Out Potential / Analysis
Site Buildout Building Size Range Potential Yield
No. Site Locality TG Tier Acreage Potential Small Largest SF / Acre
10 Cosner Site Fluvanna 1 107.7 760,000 25,000 300,000 7,060
Site Acreage: 107.1 AcresBuildout Potential: 760,000 SFSmallest Footprint: 25,000 SFLargest Footprint: 300,000 SFPotential Yield (SF / Acre): 7,060 SF / Acre
11/19/2014
14
Copyright © 2014 Timmons Group
27
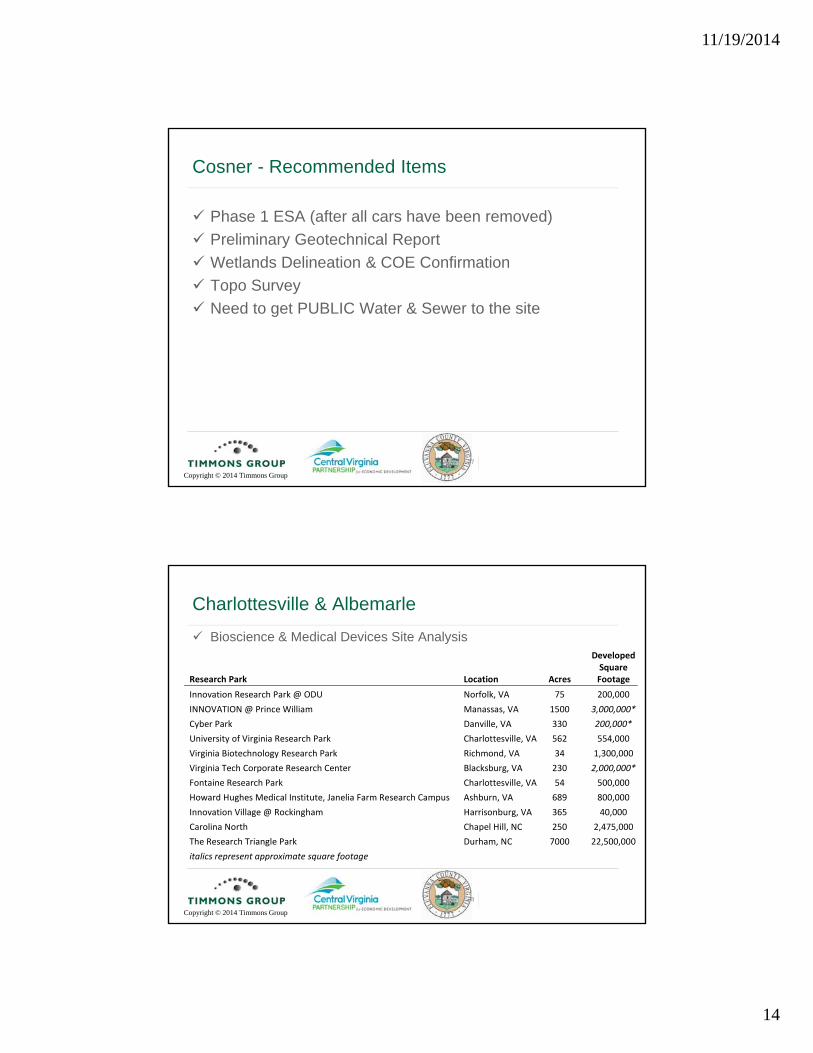
Cosner - Recommended Items
Phase 1 ESA (after all cars have been removed)Preliminary Geotechnical ReportWetlands Delineation & COE ConfirmationTopo SurveyNeed to get PUBLIC Water & Sewer to the site
Copyright © 2014 Timmons Group
28
Charlottesville & Albemarle
Bioscience & Medical Devices Site Analysis
Research Park Location Acres
Developed Square Footage
Innovation Research Park @ ODU Norfolk, VA 75 200,000 INNOVATION @ Prince William Manassas, VA 1500 3,000,000* Cyber Park Danville, VA 330 200,000* University of Virginia Research Park Charlottesville, VA 562 554,000 Virginia Biotechnology Research Park Richmond, VA 34 1,300,000 Virginia Tech Corporate Research Center Blacksburg, VA 230 2,000,000* Fontaine Research Park Charlottesville, VA 54 500,000 Howard Hughes Medical Institute, Janelia Farm Research Campus Ashburn, VA 689 800,000 Innovation Village @ Rockingham Harrisonburg, VA 365 40,000 Carolina North Chapel Hill, NC 250 2,475,000 The Research Triangle Park Durham, NC 7000 22,500,000 italics represent approximate square footage
11/19/2014
15
Copyright © 2014 Timmons Group
29
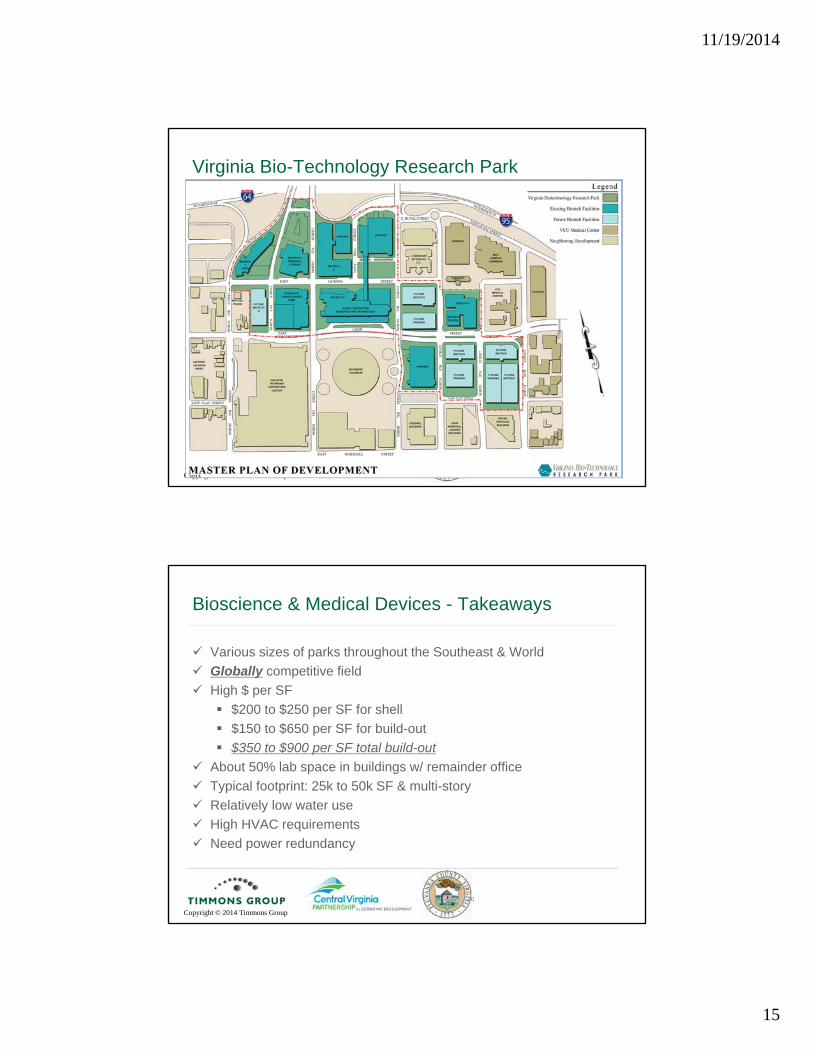
Virginia Bio-Technology Research Park
Copyright © 2014 Timmons Group
30
Bioscience & Medical Devices - Takeaways
Various sizes of parks throughout the Southeast & WorldGlobally competitive fieldHigh $ per SF
$200 to $250 per SF for shell$150 to $650 per SF for build-out$350 to $900 per SF total build-out
About 50% lab space in buildings w/ remainder officeTypical footprint: 25k to 50k SF & multi-storyRelatively low water useHigh HVAC requirementsNeed power redundancy
11/19/2014
16
Copyright © 2014 Timmons Group
31
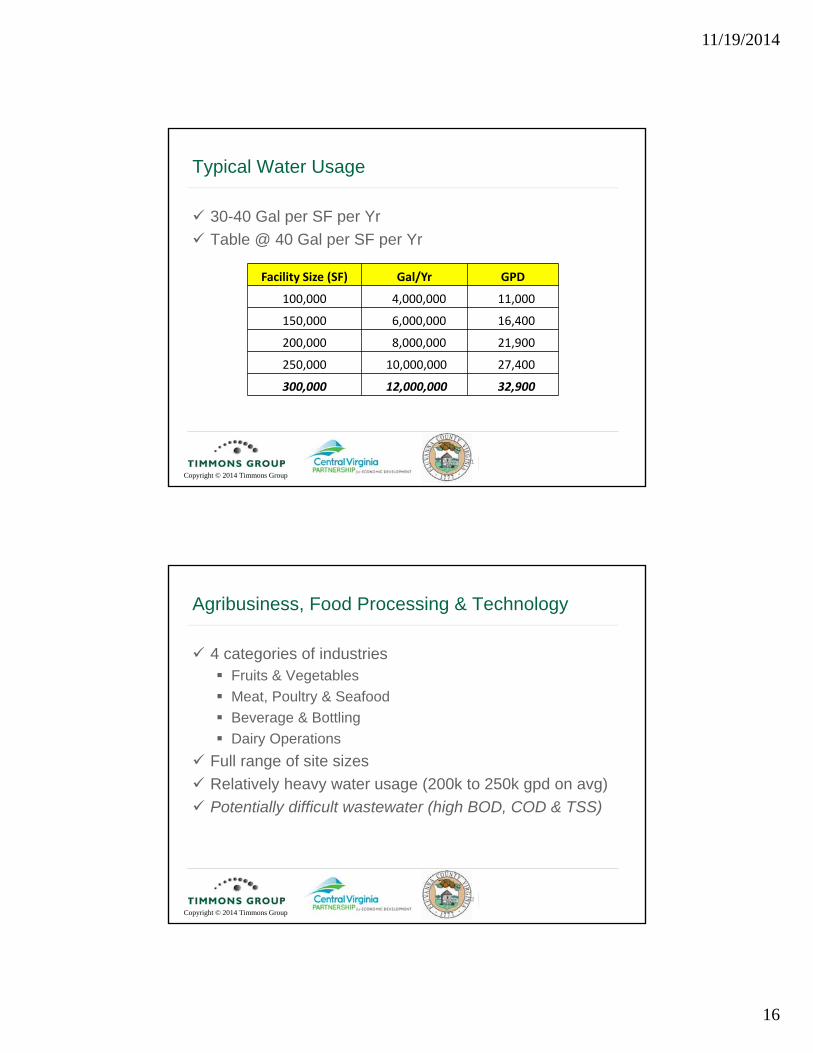
Typical Water Usage
30-40 Gal per SF per YrTable @ 40 Gal per SF per Yr
Facility Size (SF) Gal/Yr GPD
100,000 4,000,000 11,000
150,000 6,000,000 16,400
200,000 8,000,000 21,900
250,000 10,000,000 27,400
300,000 12,000,000 32,900
Copyright © 2014 Timmons Group
32
Agribusiness, Food Processing & Technology
4 categories of industriesFruits & VegetablesMeat, Poultry & SeafoodBeverage & BottlingDairy Operations
Full range of site sizesRelatively heavy water usage (200k to 250k gpd on avg)Potentially difficult wastewater (high BOD, COD & TSS)
11/19/2014
17
Copyright © 2014 Timmons Group
33
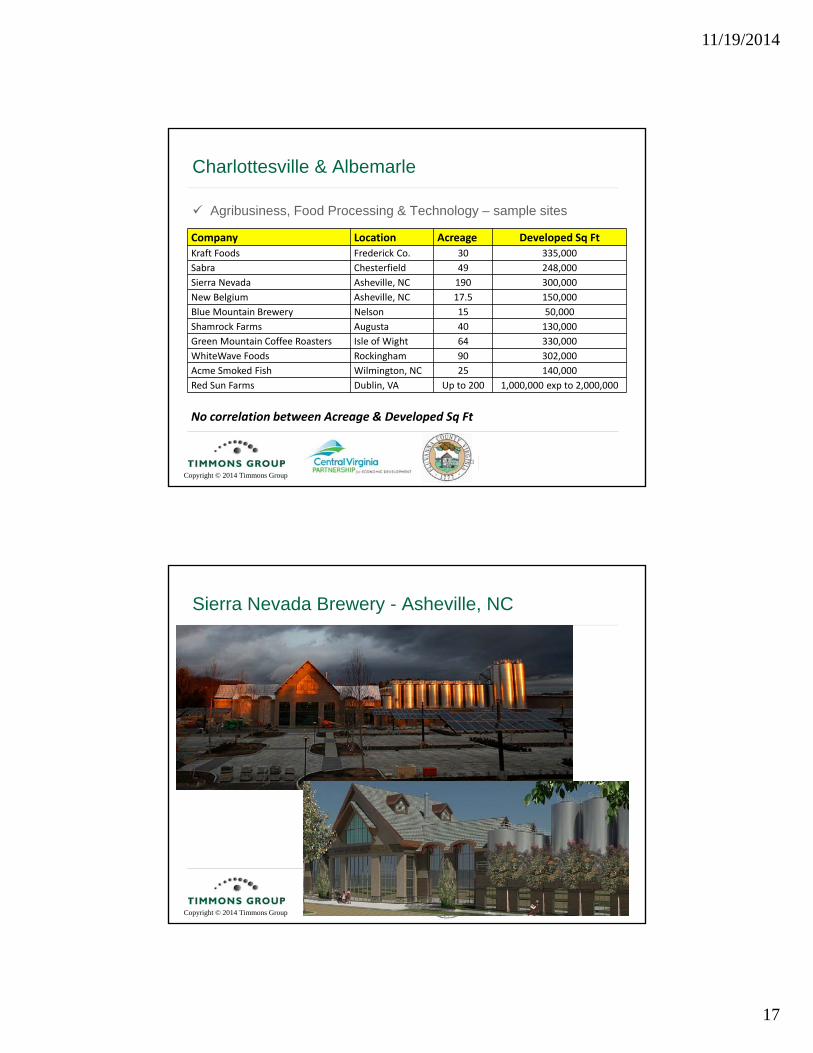
Charlottesville & Albemarle
Agribusiness, Food Processing & Technology – sample sites
Company Location Acreage Developed Sq FtKraft Foods Frederick Co. 30 335,000Sabra Chesterfield 49 248,000Sierra Nevada Asheville, NC 190 300,000New Belgium Asheville, NC 17.5 150,000Blue Mountain Brewery Nelson 15 50,000Shamrock Farms Augusta 40 130,000Green Mountain Coffee Roasters Isle of Wight 64 330,000WhiteWave Foods Rockingham 90 302,000Acme Smoked Fish Wilmington, NC 25 140,000Red Sun Farms Dublin, VA Up to 200 1,000,000 exp to 2,000,000
No correlation between Acreage & Developed Sq Ft
Copyright © 2014 Timmons Group
34
Sierra Nevada Brewery - Asheville, NC
11/19/2014
18
Copyright © 2014 Timmons Group
35
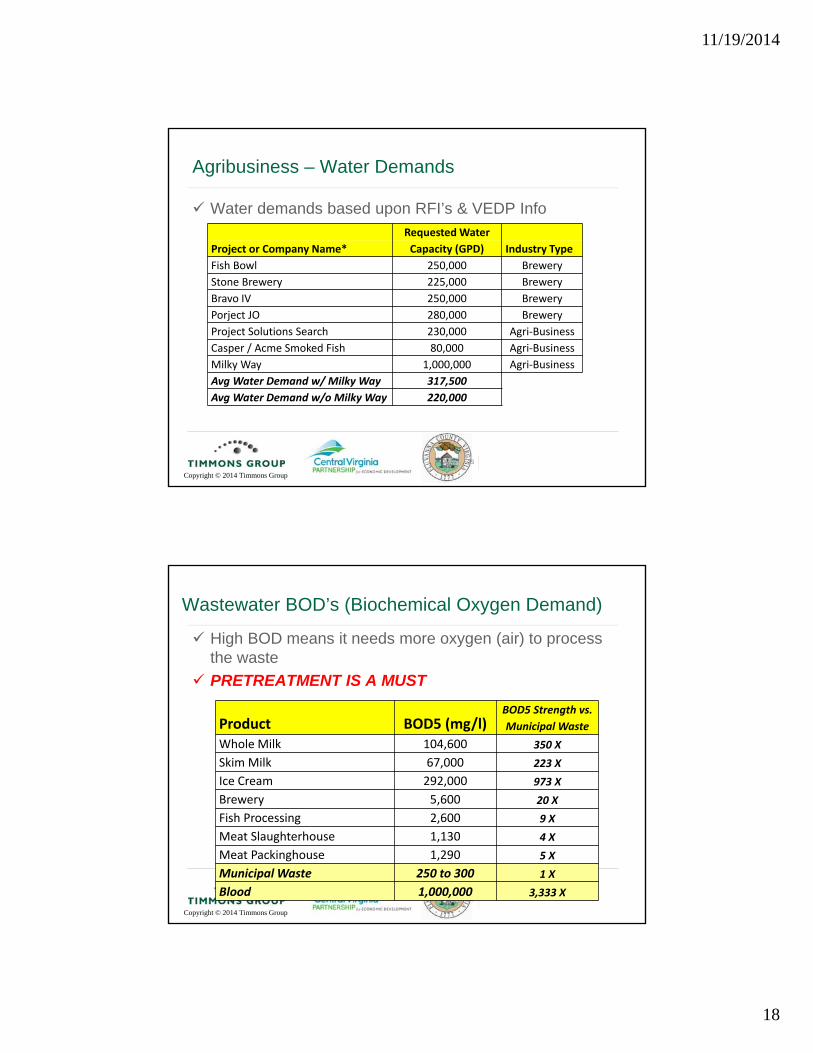
Agribusiness – Water Demands
Requested WaterProject or Company Name* Capacity (GPD) Industry TypeFish Bowl 250,000 BreweryStone Brewery 225,000 BreweryBravo IV 250,000 BreweryPorject JO 280,000 BreweryProject Solutions Search 230,000 Agri‐BusinessCasper / Acme Smoked Fish 80,000 Agri‐BusinessMilky Way 1,000,000 Agri‐BusinessAvg Water Demand w/ Milky Way 317,500Avg Water Demand w/o Milky Way 220,000
Water demands based upon RFI’s & VEDP Info
Copyright © 2014 Timmons Group
36
Wastewater BOD’s (Biochemical Oxygen Demand)
High BOD means it needs more oxygen (air) to process the waste PRETREATMENT IS A MUST
Product BOD5 (mg/l)BOD5 Strength vs. Municipal Waste
Whole Milk 104,600 350 XSkim Milk 67,000 223 XIce Cream 292,000 973 XBrewery 5,600 20 XFish Processing 2,600 9 XMeat Slaughterhouse 1,130 4 XMeat Packinghouse 1,290 5 XMunicipal Waste 250 to 300 1 XBlood 1,000,000 3,333 X
11/19/2014
19
Copyright © 2014 Timmons Group
37
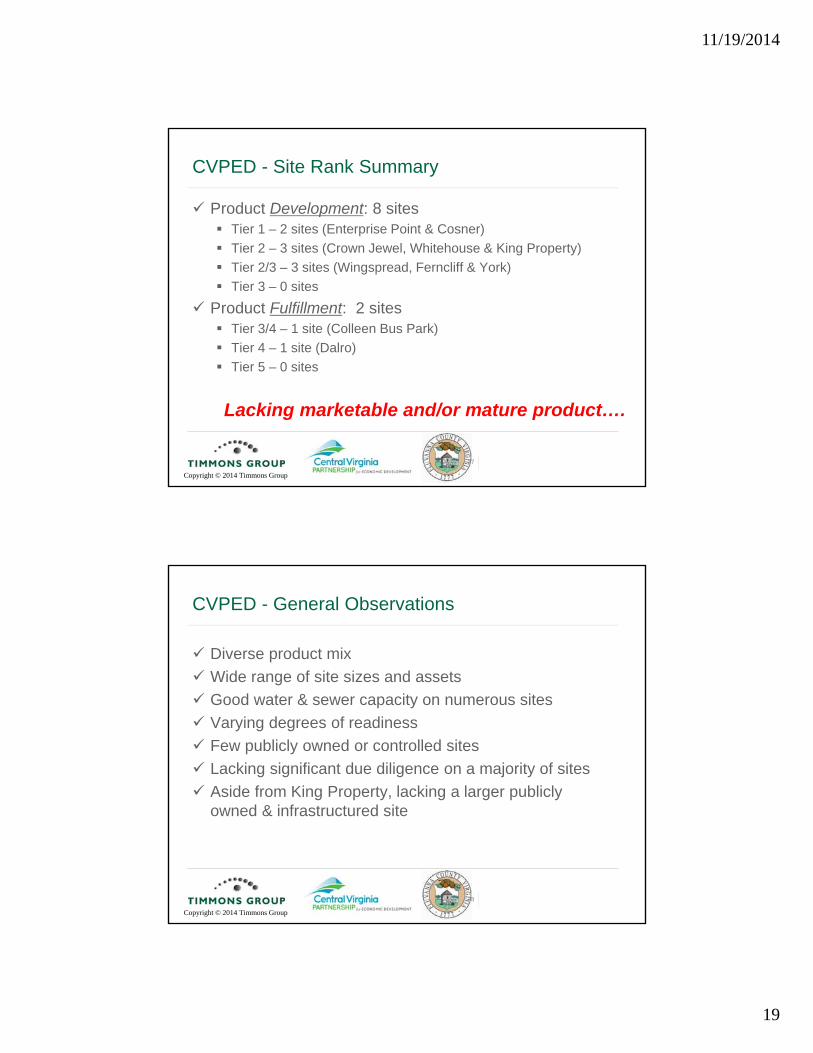
CVPED - Site Rank Summary
Product Development: 8 sitesTier 1 – 2 sites (Enterprise Point & Cosner)Tier 2 – 3 sites (Crown Jewel, Whitehouse & King Property)Tier 2/3 – 3 sites (Wingspread, Ferncliff & York)Tier 3 – 0 sites
Product Fulfillment: 2 sitesTier 3/4 – 1 site (Colleen Bus Park)Tier 4 – 1 site (Dalro)Tier 5 – 0 sites
Lacking marketable and/or mature product….
Copyright © 2014 Timmons Group
38
CVPED - General Observations
Diverse product mixWide range of site sizes and assetsGood water & sewer capacity on numerous sitesVarying degrees of readinessFew publicly owned or controlled sitesLacking significant due diligence on a majority of sitesAside from King Property, lacking a larger publicly owned & infrastructured site
11/19/2014
20
Copyright © 2014 Timmons Group
39
CVPED - Recommendations
Complete as much due diligence as feasible on each siteWetlands expire every 5-yrs, but fundamental to site preparednessAll other due diligence items last forever
Try and gain public control of desired sites (option agreements?)Search for new sites to be publicly ownedGive serious consideration to the Regional Park Concept even if it’s just among a smaller subset of localities
Copyright © 2014 Timmons Group
40
Thanks for your time !
11/19/2014
21
Copyright © 2014 Timmons Group
41
About Timmons Group
Economic DevelopmentProspect RecruitmentSite Certification ProgramsSite Selection & AnalysisSite AssessmentsMaster Planning & Site DevelopmentInfrastructure DevelopmentGIS & Geospatial ServicesSite LoGIStics®
Copyright © 2014 Timmons Group
42
Contact Info
Joe Hines, PE, MBAPrincipal in Charge
Economic [email protected]
804.615.2162 (c)804.200.6380 (o)
Craig Kotarski, PE, LEED APProject Manager
[email protected] (o)434-964-7148 (c)