Embed Size (px)
Citation preview
SISSEL JOHANNESSEN, E T AL.
Miksicek, C. H., R McK. Bird, B. PickersgiU, S. Donaghey. J. Cammight, and N. Hammood 198 1 PreClartic Lowland Maize from CueUo, Belize. Nature 289: 56-59.
Nickerson, Norton H. 1953 Variation in Cob Morphology among Certain Archaeological and Ethnographic Races of Maize. Annals of the Missouri Botanical Garden 40: 79- - . 111.
Pears4 Deborah M. 1980 Analysis of an Archaeological Maize Kernel Cache from Manabi Province, Ecuador. Economic Botany 34(4): 3 14-35 1.
SAS Institute Inc. 1985 SAS User's Guide: Statistics, Version 5 Edition SAS Institute Inc., Cary, North Carolina.
. . Information Flow in Social Networks
I GENE ANN SHELLEY,' H. RUSSELL BERNARD' AND PETER D. KILLWORTH2
' Uniwrsiry of Floridq Gainc(v~'IIe, Florida Robert Hooke Institute, Department of Aunospheric,
Oceanic and Planetary Physics, Oqbrd, England
ABSTRACT: We attempted to operationalize the strength of social tie by measuring the amount of time it took for informants to send and d v e personal information from theiu social network members. We reasoned that "stronger" ties (i.e. those people rated *dose" by an informant) would be told about certain life events sooner than "weaker" ties would be told. We hop& to deve4op a measure which could be used to predict strength of social tie. We were unsuccessful in producing such a measure, but the experiment yidded useful information about how news nows a&ng social nemork members.~eopIe rated cdc106e" by informants transmiaed news four times faster than did those rated ' w t close." Relatives transmitted news sigpEcantly faster than did friends or mere acquaintances. Women transmitted news at least hvice as fast as men did. We investigated how the typc of news transmitted, the importance of a news item and whether news was good, bad or neutral affected news tcansmission time.
KEY WORDS: social networks, tie strength, information flow, gender differences, close- ness, g&ad news, kinship
A person's social network is described in terms of the linkages between individuals. A network connection does not exist between two people until some interaction occurs between them. This interaction often involves the passing of information, either important or unimportant The majority of 1 interpersonal relationships are maintained by the frequent and regular
I exchange of information (although some relationships can also be main- tained for years with no contact at all). Sufficient negative information can also act to terminate a relationship. Thus, the type and timing of informa- I tion flow can have an effect on the intensity of the relationship (often
1 called "tie strength") and even on its continued existence. Researchers have attempted to describe and measure the intensity of
connections between network members. Early investigators, such as I Kapferer (1969) and Wheeldon (1969), reasoned that individuals who are linked to each other with more than one social tie (multiplex relations) are i in some way "c10ser" than those who are tied with just one tie (uniplex
I relations). Epstein (1969) theorized that the intensity of a relationship
I Journal ofQua~uitariw AmluopoIogy 2: 201-225,1990. 0 1990 K h w Academic Publishers. F'rinfed in the Neth-.
GENE ANN SHELLEY, ET AL.
could be determined by frequency of interaction and by the presence or absence of intimate conversations.
Friedkin (1980) measured tie strength among faculty at a university as a function of whether or not they discussed each other's research. Hornstein (1985) hypothesized that intimacy in telephone conversational style could be an indicator of tie strength. She analyzed recorded tele- phone conversations and found that friends do have a unique conversa- tional style, while acquaintances and strangers do not.
Granovetter (1973, 1982) cut through a lot of the difticulty in measur- ing tie strength. He looked at just two levels of social tie, strong and weak. Strong ties, characterized by high frequency contact, emotional intensity, intimacy and reciprocity of services, are important for social and emo- tional support. Granovetter showed that weak ties are vital for getting services and information through indirect links to others, and Hammer (1983) found that people with "multiple sources of feedback" (the extended network of weaker ties) have better health and greater longevity.
Following Granovetter, Marsden and Campbell (1984) found that "closeness," as reflected by emotional intensity, was the best indicator of a strong tie between actors. They recommended, however, that effort be demted to obtaining better measures of intensity.
Unfortunately, Granovetter's landmark conceptualization of strong and weak ties has not resulted in a large body of empirical research on the measurement of tie strength. We still do not have agreement, for example, on how to measure the interpersonal distance between any ego and his or her alters in a network. Little is known about the exact content of informa- tion passed between people and what effect that information has on relationship intensity.
Difficulties in data collection have also contributed to the problem. Informant recall is fraught with error (Bernard and Killworth 1977; Bernard et al. 1979/80, 1984; Killworth and Bernard 1976, 1979/80). Much information about one's friends may be of a personal nature which will be unlikely to appear on questionnaires. The task of recalling what information has passed between individuals can be exhausting, both for informants and researchers. Additionally, data about infonnation flow are partly quantitative (e.g. an informant either did or did not hear about a recent pregnancy) and partly qualitative. This awkward combination has slowed research in the area.
It was clear to us that, lacking any theory, we might begin by examining the following issues experimentally: What kinds of information travel betwe+ people? How long does this information take to pass between people? What characteristics of the individual passing the information, the individual receiving the information, and the type of information con- cerned, help to determine the rate or likelihood of propagation?
We theorized that news transmitted between "strong" ties might be
INFORMATION FLOW IN SOCIAL NETWORKS
different in content and transmission characteristics than news transmitted between "weak" ties. In this paper, we present the results of our attempt to measure the strength of ties between persons in a social network, based on characteristics of news transmission. We began with the idea that social closeness might be measured by the elapsed time between the occurrence of an event in someone's life and when the members of their social network find out about it. In other words, the sooner a network member (or alter) finds out about an event in the life of a particular person, the closer that alter is to that person.
In the next section we describe the experiment. Sections 3 and 4 describe the informants and their social networks and the attributes surrounding the news transmission. Section 5 discusses news transmission time and how it is affected by a variety of things, including whether or not one is a friend, relative or acquaintance, the "goodness" or "badness" of the news transmitted, and the sex of the news transmittor. Section 6 lists the various types of news transmitted and who transmitted what kind of news. We discuss our results in Section 7 and offer some conclusions in Section 8.
We shall occasionally cite significance levels of 0.10 in this paper. We choose to do this because our sample size, of 21 informants, is too small for statistical reliability. If we ignored suggestive findings that were not supported by 0.05 significance levels, simply because our sample size was too small to reach singificance, we might overlook an important feature in the data.
2. THE EXPERIMENT
Twenty-one informants (10 women, 11 men) were recruited from the senior author's social network. The task we envisioned would be difficult for informants to complete and we wanted to ensure cooperation. Shelley either knew the informants or knew someone who knew them. We tried to find informants who would not be traveling during the research period, but this was almost impossible, especially for men. No one who was asked to do the experiment refused, and there were no dropouts.
Each informant was interviewed by telephone every other day for a month, or 15 times each. During each interview, informants were asked "What have you learned in the past 48 hours about your friends, relatives and acquaintances that you didn't know before?" Phoning every other day was a compromise. We wanted to call informants every day, to increase their recall of events, but we felt this would have been too invasive for informants and would lead to dropouts. Responses were recorded, along with the time that had elapsed from when something occurred to when the informant heard about it.
Over two months, we collected infonnation on 1,135 news items. For
GENE ANN SHELLEY, ET AL. INFORMATION FLOW IN SOCIAL NETWORKS
each news item we asked whether it had been delivered in person or by another method, and how many people participated in its transmission. We asked informants about their age, sex, religion, education, income, etc., and these same questions were asked about those who reported informa- tion to informants. Occupational categories of informants and the people with whom they had communicated (their alters) were coded using the NORC occupational scale (Reiss 1961).
Using a four-point scale, (very important, important, slightly important, not important), informants evaluated the importance of each news item to themselves and to the person who reported it. Informants were also asked whether they would be likely to pass on each item to others.
During the final interview, informants rated their conversation partners on a five-point scale, according to how close the informants felt to each. The scale was: Very close - 4; Close - 3; Just Friends = 2; Acquaintance - 1; and Don't Know the Person - 0. Many informants tried to rank others a 3.5, (a category between "closen and "very close")but were forced to choose between 3 and 4. A few informants asked for negative value choices, for those they did not like. One informant ranked his father a "3" meaning "close," but then after some thought, downgraded him to a "2." Hebemed to feel guilty about saying that his father was not close.
News items were classified as: (1) desirable, (2) neutral, or (3) undesir- able. The desirability or undesirability of events was determined mostly from comments made by informants during interviews. For example, one informant was happy that her impending move had been cancelled. Not moving to a new location after anticipating it for a while might be undesirable, but her comments made it clear that she was relieved. Of course, people can have mixed feelings about some events. One informant, told that he was going to be laid off, said it was "good news and bad news," because he would be free to pursue other interests. For this informant, being laid off was coded as neutral. In the few cases where it was impossible to determine the desirability of a news item from infor- mants' comments, we used Lin, Dean and Ensel's (1986) list of desirable/ undesirable life events.
The entire survey took two months to complete. During the middle of the research, it took about 6.5 hours a day on the phone to interview all the informants. Informants were all conscientious in participating in this experiment. Some of them even took extensive notes that they might provide better reports. These were, in fact, the people who reported the most news items.
We did not intend to use informants who were going to be out of their regulaf routine. However, one informant went to a 25th year class reunion during the data collection period and contacted people whom he hadn't seen since graduation. It is tempting to discard this informant's data since they create a nightmarish outlier problem. We reanalyzed the data to see if
removing that informant's reunion news might make the transmission time a more normally distributed variable. It didn't.
In fact, removing half the data does not do that. Most news travels between network contacts in less than three days, but people do exchange antique infonnation about common network members. Finding things out about people one has %st track of," then, is a common enough occur- rence. In these data, it represents about 5% of informants' contacts over a 30day period. Sometimes this phenomenon has a major impact on the entire dataset, sometimes not. We will note where it does.
3. INFORMANTS AND THEIR SOCIAL NETWORKS
We did not have suficent funds to get a statistically representative sample. However, it is important to know the attributes of the informants and their networks so we can discover any clues to the connection (if any) between news transmission and strength of social tie. We wanted to know if any informant or alter characteristics would help predict strength of social tie using news transmission time.
All the informants were white Americans, but they represented a variety of income and education levels, occupations, religions, and marital statuses. Their average age was around 39 years old, with a range of 22 to 77 years. As expected, in many cases there is a great deal of similarity between informants and their network alters. For example, the majority of both informants and alters were married (approximately 85% and 70°/0, respectively).
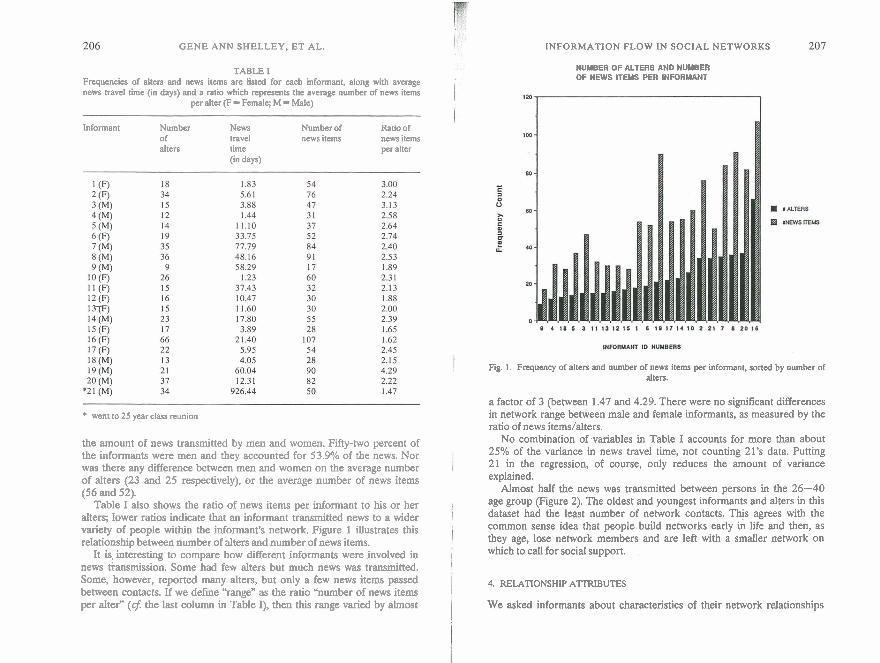
Table I shows basic data for each informant. Note the extremely large mean transmission time for Informant 21 (due to the class reunion data). Informants reported an average of 24 alters during the survey, but it was clear from Table I that this number varies greatlyu among individuals, as does the number of news items (average 54). (A single asterisk is used throughout this paper to signify an 0.05 level of significance. A double asterisk signifies 0.01 or greater.) Informant 16, a hairdresser who hears a lot of news on a regular basis, reported the greatest number of news items. The average transmission time for the entire data set was 60 days; without Informant 21, the average was only 25 days.
Several male informants said that they "don't really talk to people much" and expressed doubt that they could contribute much to the research. Infonnant 9 was correct in his self-assessment; he only reported news contacts with 9 people, resulting in only 17 news items over the 30-day period. At the same time, however, there were several women (none of whom expressed doubt about their participation in the study) who had very few contacts.
For these 21 informants at least, there was no significant difference in
GENE A N N SHELLEY, ET AL.
TABLE I Frequencies of alters and news items are listed for each informant, along with average news travel time (in days) and a ratio which represents the average number of news items
per alter (F - Female; M - Male)
Informant Number News of travel alters time
(in days)
Number of news items
Ratio of news items per alter
* went to 25 year class reunion
the amount of news transmitted by men and women. Fifty-two percent of the informants were men and they accounted for 53.9% of the news. Nor was there any difference between men and women on the average number of alters (23 and 25 respectively), or the average number of news items (56 and 52).
Table I also shows the ratio of news items per informant to his or her alters; lower ratios indicate that an informant transmitted news to a wider variety of people within the informant's network. Figure 1 illustrates this relationship between number of alters and number of news items.
It is, interesting to compare how different informants were involved in news tiansmission. Some had few alters but much news was transmitted. Some, however, reported many alters, but only a few news items passed between contacts. If we define "range" as the ratio "number of news items per alter" (6 the last column in Table I), then this range varied by almost
INFORMATION FLOW IN SOCIAL NETWORKS
NUMBEROFALTERSANDNUMBER OF NEWS ITWS PER INFORMANT
Fig. 1 . Frequency of alters and number of news items per informant, soned by number of alters.
a factor of 3 (between 1.47 and 4.29. There were no significant differences in network range between male and female informants, as measured by the ratio of news items/alters.
No combination of variables in Table I accounts for more than about 25% of the variance in news travel time, not counting 21's data. Putting 21 in the regression, of course, only reduces the amount of variance explained.
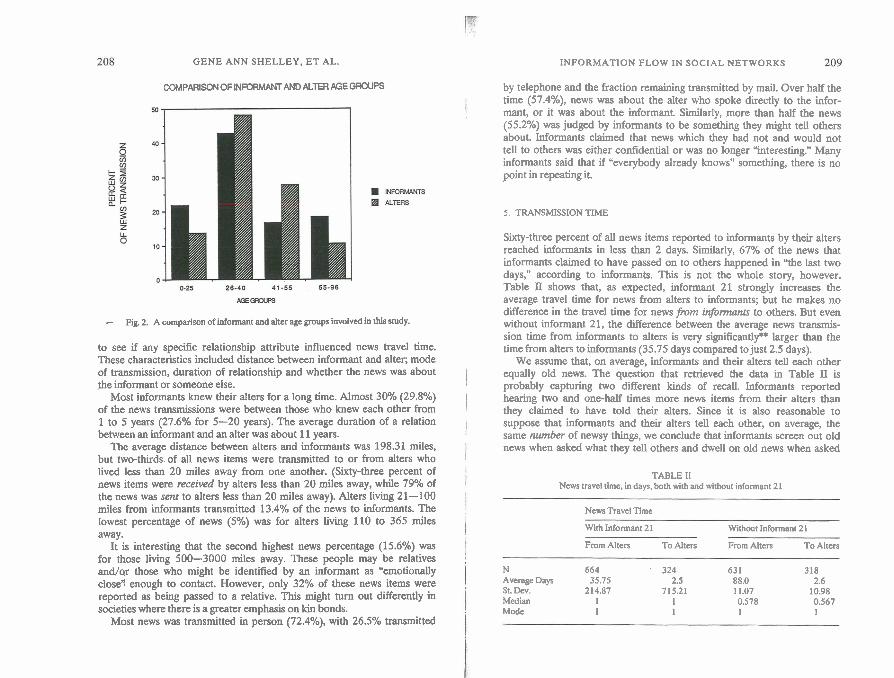
Almost half the news was transmitted between persons in the 26-40 age group (Figure 2). The oldest and youngest informants and alters in this dataset had the least number of network contacts. This agrees with the common sense idea that people build networks early in life and then, as they age, lose network members and are left with a smaller network on which to call for social support.
4. RELATIONSHIP ATTRIBUTES
We asked informants about characteristics of their network relationships
GENE ANN SHELLEY, ET AL. INFORMATION FLOW IN SOCIAL NETWORKS
COMPARISON OF lbWMhWT AND ALTER AGE GROUPS
- Fig. 2. A comparison of informant and alter age groups involved in this study.
to see if any specific relationship attribute influenced news travel time. These characteristics included distance between informant and alter, mode of transmission, duration of relationship and whether the news was about the informant or someone else.
Most informants knew their alters for a long time. Almost 30% (29.8%) of the news transmissions were between those who knew each other from 1 to 5 years (27.6% for 5-20 years). The average duration of a relation between an informant and an alter was about 11 years.
The average distance between alters and informants was 198.31 miles, but two-thuds of all news items were transmitted to or from alters who lived less than 20 miles away from one another. (Sixty-three percent of news items were received by alters less than 20 miles away, while 79% of the news was sent to alters less than 20 miles away). Alters living 21-100 miles from informants transmitted 13.4% of the news to informants. The lowest percentage of news (5%) was for alters living 110 to 365 miles away.
It is interesting that the second highest news percentage (15.6%) was for those living 500-3000 miles away. These people may be relatives and/qr those who might be identified by an informant as "emotionally close? enough to contact. However, only 32% of these news items were reported as being passed to a relative. This might turn out differently in societies where there is a greater emphasis on kin bonds.
Most news was transmitted in person (72.4%), with 26.5% transmitted
by telephone and the fraction remaining transmitted by mail. Over half the time (57.4%), news was about the alter who spoke directly to the infor- mant, or it was about the informant. Similarly, more than half the news (55.2%) was judged by informants to be something they might tell others about. Informants claimed that news which they had not and would not tell to others was either confidential or was no longer "interesting." Many informants said that if "everybody already knows" something, there is no point in repeating it.
5. TRANSMISSION TIME
Sixty-three percent of all news items reported to informants by their alters reached informants in less than 2 days. Similarly, 67% of the news that informants claimed to have passed on to others happened in "the last two days," according to informants. This is not the whole story, however. Table 11 shows that, as expected, informant 21 strongly increases the average travel time for news from alters to informants; but he makes no difference in the travel time for news from infomnts to others. But even without informant 21, the difference between the average news transmis- sion time from informants to alters is very significantly*. larger than the time from alters to informants (35.75 days compared to just 2.5 days).
We assume that, on average, informants and their alters tell each other equally old news. The question that retrieved the data in Table II is probably capturing two different kinds of recall. Informants reported hearing two and one-half times more news items from their alters than they claimed to have told their alters. Since it is also reasonable to suppose that informants and their alters tell each other, on average, the same number of newsy things, we conclude that informants screen out old news when asked what they tell others and dwell on old news when asked
TABLE I1 News travel time, in days, both with and without informant 2 1
News Travel Time
With Informant 21 Without Informant 2lPp
From Alters To Alters From Alters To Alters
N 664 ' 324 631 318 Average Days 35.75 2.5 88.0 2.6 St. Dev. 214.87 715.21 11.07 10.98 Median 1 I 0.578 0567 Mode 1 1 1 1
GENE ANN SHELLEY, ET AL.
what they've heard from others. Indeed, informants reported that 88% of what they told people was "important" and that 90% of what people told them was important. In other words: old news isn'l news if if's your news; old news is news if it's someone else's.
In the following subsections, we describe and attempt to explain, where possible, the different factors affecting news travel time in our data:
Socio-Demographic Variables
There were no significant differences in the mean news travel time by such variables as alter or informant age, income, occupation, race, where the informant grew up, or father's occupation. This fact is true with or without 21's data. Single people, for both alters and informants, on average, received news slightly faster than did married persons, but the difference was not significant. Both alters and informants who grew up in a big city tended to receive/send news more slowly than did those from a rural background, but again, the difference was not significant.
Among informants and alters, those with more education were much slower"* at sending or receiving news. Pwple with a high school education t&mitted news in a little over 12 days, while those who completed graduate or professional school took around 200 days (40.65 days with- out informant 21, which is still significantly*. longer than 12 days). In general, there is a tendency for those with more education, better occupa- tion, big city background, greater income and higher earning levels to have slower news transmission times. This remains true even without informant 21's data. Could this be because of the higher socio-economic status of these informants and their alters? Would this finding prevail with infor- mants of lower status?
Closeness
Recall that informants were asked to rate each alter on a scale reflecting how "close" the informant felt to the alter. Male and female informants had almost identical percentages of "close" (59% for women, 60% for men) and "not closen alters. There was no difference in travel time between news items from alters categorized as "close" and "very close." Nor was there any difference in travel time in items going between people who were labelled "just friendsn of informants, and that going between people labelled "close" or "very closen to informants This remains true even Nthout 21's data.
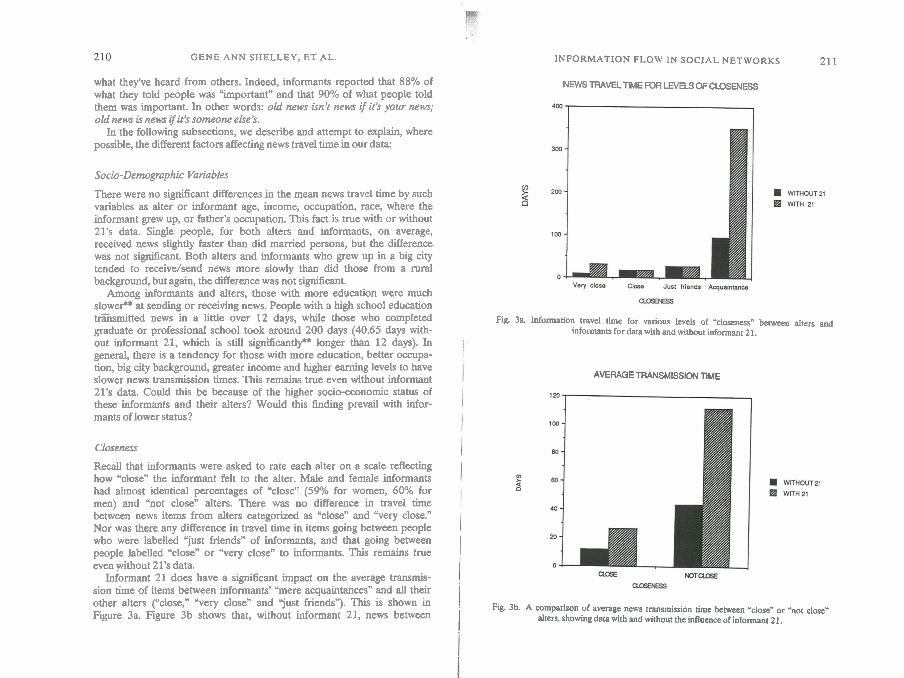
Informant 21 does have a significant impact on the average transrnis- sion time of items between informants' "mere acauaintances" and all their other alters ("close," "very close" and "just friLnds") .s is shown in Figure 3a. Figure 3b shows that, without informant 21, news between
INFORMATION FLOW IN SOCIAL NETWORKS 21 1
NEWS TRAVEL TlME FOR LEVaS OF CLOSENESS
Fig. 3a. Information travel time for various levels of -closeness" benveen alters and informants for data with and without informant 21.
AVERAGE TRANSMISSION TlME
I Fig. 3)b. A mmpa"son of average n m transmission time between "close" or W close"
I alters, showing data with and without the influence of informant 21.
GENE A N N SHELLEY, ET AL.
people who were rated "close" took about 12 days while news between people who are "not closen took about 43 days.
There was some difference4 in how people categorize others as "close." One of the informants listed someone as "very close," although she had not heard from the person in a year; when she did hear from her, the informant found that her friend had moved 8 months earlier and had gotten a job one month earlier. The friend only lived 10 miles away! Could these two people still be called "very close?"
Desirability of News
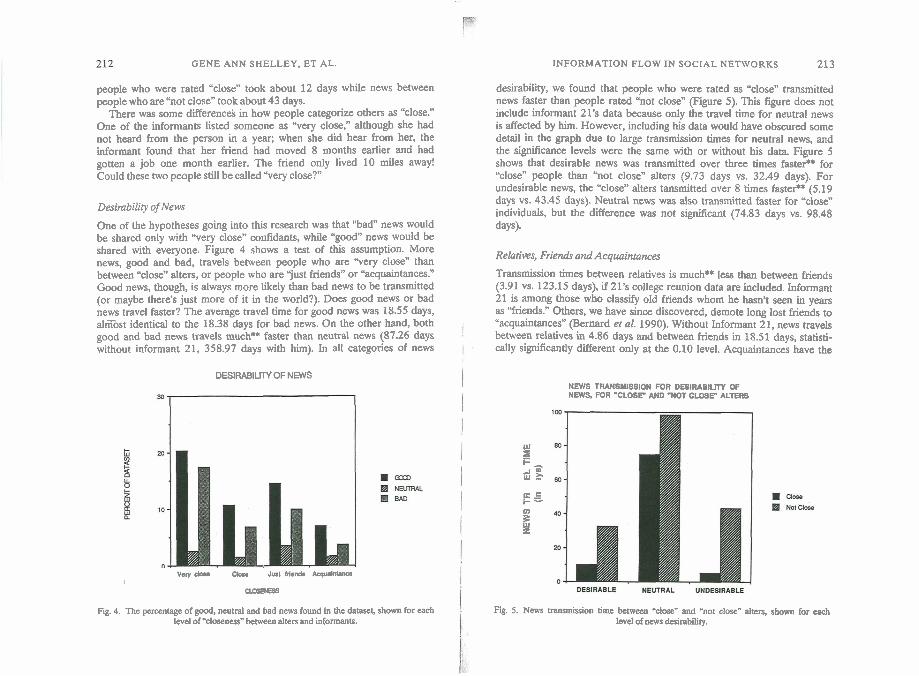
One of the hypotheses going into this research was that "badn news would be shared only with "very close" confidants, while "good" news would be shared with everyone. Figure 4 shows a test of this assumption. More news, good and bad, travels between people who are "very close" than between "close" alters, or people who are "just friends" or "acquaintances." Good news, though, is always more likely than bad news to be transmitted (or maybe there's just more of it in the world?). Does good news or bad news travel faster? The average travel time for good news was 18.55 days, alsost identical to the 18.38 days for bad news. On the other hand, both good and bad news travels muchn faster than neutral news (87.26 days without informant 21, 358.97 days with him). In all categories of news
DESIRABIlJlY OF NEWS
vary dou Clou Jlmt hiand. AoqudnUnrr I -
Fig. 4. Thc percentage of good, neutral and bad news found in the datascl shown for each level of "cloaenus" benuem alters and informants.
INFORMATION FLOW IN SOCIAL NETWORKS 213
desirability, we found that people who were rated as "close" transmitted news faster tban people rated "not close" (Figure 5). This figure does not include informant 21's data because only the travel time for neutral news is affected by him. However, including his data would have o b m e d some detail in the graph due to large transmission times for neutral news, and the significance levels were the same with or without his data. Figure 5 shows that desirable news was transmitted over three times faster++ for "close" people than h o t close" alters (9.73 days vs. 32.49 days). For undesirable news, the "close" alters tansmitted over 8 times fasteic* (5.19 days vs. 43.45 days). Neutral news was also transmitted faster for "close" individuals, but the difference was not significant (74.83 days vs. 98.48 days).
Relatives, Friends and Acquaintances
Transmission times between relatives is much** less than between friends (3.91 vs. 123.15 days), if 21's college reunion data are included. Informant 21 is among those who classify old friends whom he hasn't seen in years as "friends." Others, we have since discovered, demote long lost friends to "acquaintances" (Bernard et al. 1990). Without Informant 21, news travels between relatives in 4.86 days and between friends in 18.51 days, statisti- cally significantly different only at the 0.10 level. Acquaintances have the
NEWS TRANSMISSION FOR DESIRABILITY OF NEWS, FOR "CLOSk AND "NOT CLOSF ALTERS
w B '-- A"' w a
K = i-= rn z Z
Fig. 5. News traasmission time betwan "dose" and hot close" alters, shown for each level of news desirability.
GENE ANN SHELLEY, ET A t .
longest news transmission time, with and without 21 (an average of 268.78 days including him, 47.15 excluding him).
Relatives transmit news over 31 times faster (4 times faster without 21) than friends and over 68 times faster than mere acquaintances (10 times faster even without informant 21). Acquaintance news transmission time is much slower** than either relatives or friends, with or without 21's data.
Attempts to regress travel time against other variables were not suc- cessful. However, 'closeness" was well predicted from the other data we collected. Simply finding out whether the alter is a friend, relative or acquaintance accounts for 52% of the variance in predicting closeness. Adding news travel time, years known, and importance (to informant) of news to that simple model only adds 1% more variance explained. Perhaps knowing the method of classification that people use for old friends one hasn't seen in a while (either remaining as friends, or being demoted to acquaintances) might have improved the prediction of closeness.
Relations between relatives are almost always classified as strong ties. Of 1084 news items (not counting informant 21), 347 were from relatives, who were labeled as "close" or "very close" 96% of the time. Friends transmitted 327 news items, and were labelled "close" or "very close" 66% of%e time. Acquaintances were labelled klose" or "very close" 23% of the time. This does not mean that 96% of relatives are "closen alters; merely that those relatives from whom one gets news are half again as likely as friends to be close alters, and four times as likely as acquain- tances to be close alters. This agrees with Fischer's (1982) finding, and with Mitchell's (1969) prediction that "the intensity of a person's rela- tionship with a close kinsman is likely to be greater than that with a neighbor."
The Difference Between Men and Women
When both informant and alter are women, news travels in about 14 days, compared to 180 days between men. The large value for men is mainly due to Informant 21; excluding him, news between men travels in just 35 days - longer than the transmission time between women, but significant only at the 0.10 level. Recall that informants reported a much lower transmission time for news they told others than for news they received from others.
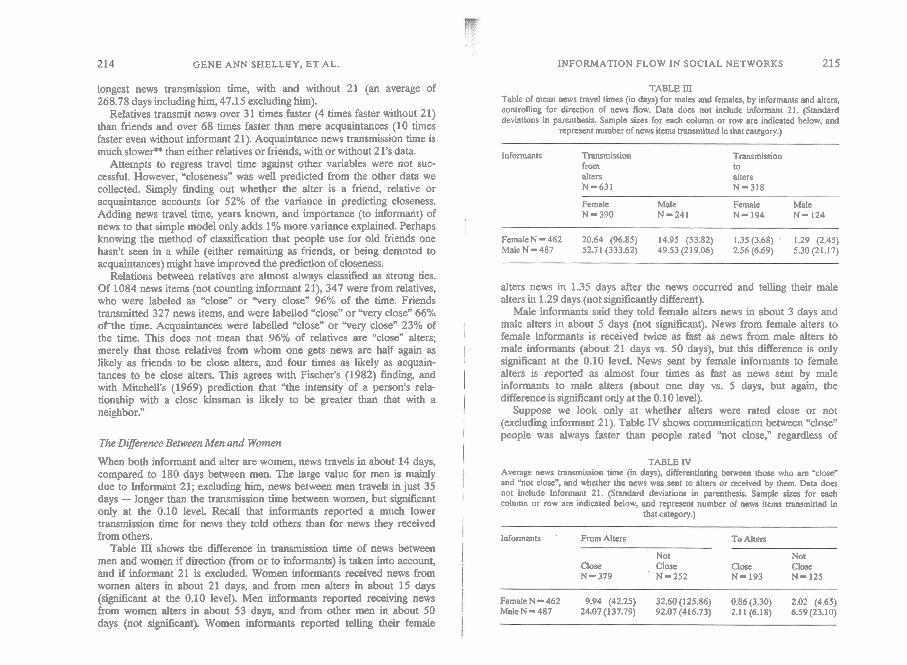
Table 111 shows the difference in transmission time of news between men and women if direction (from or to informants) is taken into account, and if informant 21 is excluded. Women informants received news from women alters in about 21 days, and from men alters in about 15 days (significant at the 0.10 level). Men informants reported receiving news from women alters in about 53 days, and from other men in about 50 days (not signiscant). Women informants reported telling their female
INFORMATION FLOW IN SOCIAL NETWORKS 215
TABLE III Table of mean news travel times (in days) for males and females, by informants and alters, controlling for direction of news flow. Data does not include informant 21. (Standard deviations in parenthesis. Sample sizes for each column or mw are indicated below, and
represent number of news items transmitted in that category.)
Informants T m i s s i o n Transmission from to alters alters N-631 N-318
Female Male Female Male N - 390 N-241 N-194 N- 124
Female N - 462 20.64 (96.85) 14.95 (53.82) 1.35 (3.68) ' 1.29 (2.45) Male N - 487 52.7 1 (333.62) 49.53 (219.06) 2.56 (6.69) 5.30 (21.17)
alters news in 1.35 days after the news occurred and telling their male alters in 1.29 days (not significantly different).
Male informants said they told female alters news in about 3 days and male alters in about 5 days (not significant). News from female alters to female informants is received twice as fast as news from male alters to male informants (about 21 days vs. 50 days), but this diierence is only significant at the 0.10 level. News sent by female informants to female alters is reported as almost four times as fast as news sent by male informants to male alters (about one day vs. 5 days, but again, the difference is signi6cant only at the 0.10 level).
Suppose we look only at whether alters were rated close or not (excluding informant 21). Table IV shows communication between 'close" people was always faster than people rated "not close," regardless of
TABLE IV Average news transmission time (in days). differentiating between those who are "close" and hot close", and whether the news was sent to alters or received by them. Data does not include Informant 21. (Standard deviations in parenthesis. Sample sizes for each column or mw are indicated below, and represent number of news items transmitted in
that category.)
Informants ' Fmm Alters To Alters
Not Nor Close Close Close Close N - 379 N - 252 N-193 N-125
Female N - 462 9.94 (42.25) 32.60 (125.86) 0.86 (3.30) 2.02 (4.65) MaleN - 487 24.07(137.79) 92.07 (416.73) 2.11 (6.18) 6.59 (23.10)
GENE ANN SHELLEY, ET AL.
direction of news flow. In general, women received news faster than men, regardless of closeness level. Although news from "close" alters to female infonnants is almost 3 times faster than news from "dose" alters to male informants (even excluding informant 21's data), this is not a significant difference. However, for both male and female informants, the difference between news transmitted from "closen and "not close" alters is signifi- cant* (9.94) days vs. 32.60 for females and 24.07 vs. 92.07 for males). This difference between "close" and "not close" alters is over three times faster for both sexes.
Conversely, news transmission form informants to "close" alters is not significantly diierent, although "close" alters do get news faster than those alters rated "not close." Thus, although news transmission between females ; is faster than news between males, the significant differences are between I people rated as "close" and those rated "not close," for news received by , informants.
6. NEWS CONTENT
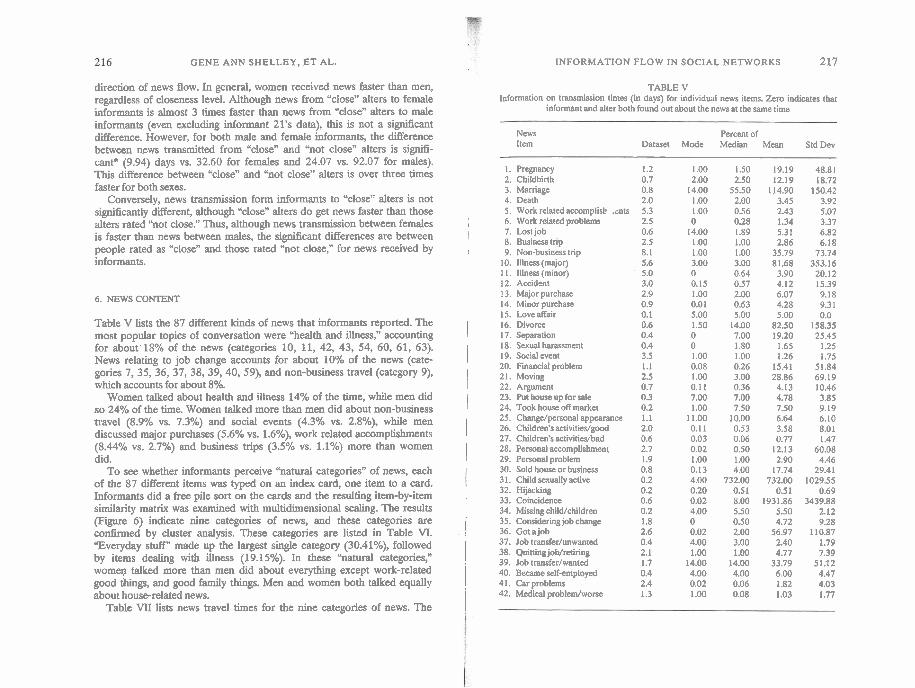
Table V lists the 87 different kinds of news that infonnants reported. The most popular topics of conversation were "health and illness," accounting for about 18% of the news (categories 10, 11, 42, 43, 54, 60, 61, 63).
I News relating to job change accounts for about 10% of the news (cate- gories 7,35,36,37, 38,39,40, 59), and non-business travel (category 9),
I which accounts for about 8%.
Women talked about health and illness 14% of the time, while men did I
so 24% of the time. Women talked more than men did about non-business travel (8.9% vs. 7.3Oh) and social events (4.3% vs. 2.8%), while men
I discussed major purchases (5.6% vs. 1.6%), work related accomplishments I (8.44% vs. 2.7%) and business trips (3.5% vs. 1.10/0) more than women did.
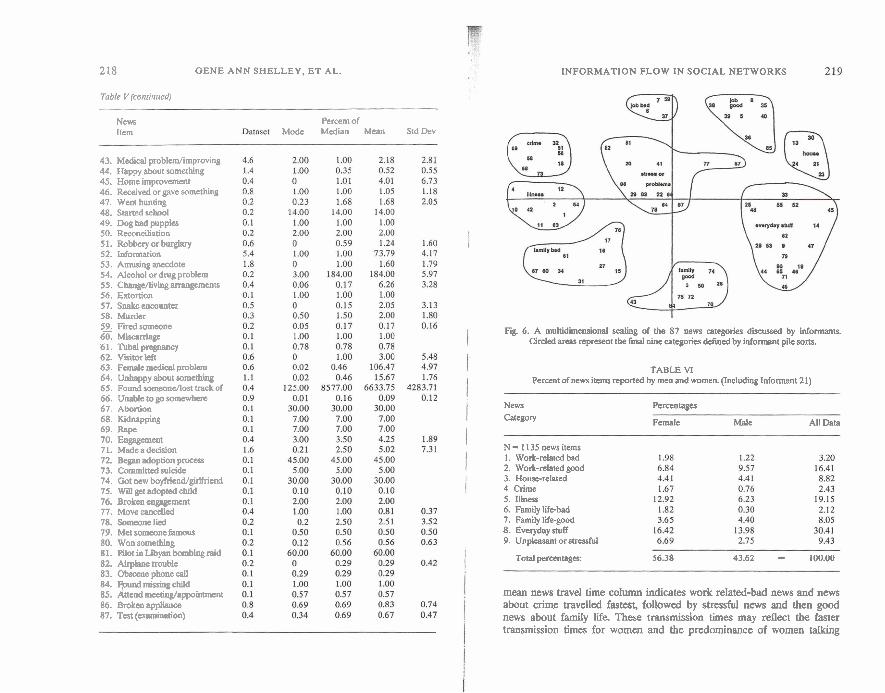
To see whether informants perceive 'hatural categories" of news, each I
of the 87 different items was typed on an index card, one item to a card. Informants did a free pile sort on the cards and the resulting item-by-item similarity matrix was examined with multidimensional scaling. The results (Figure 6) indicate nine categories of news, and these categories are
I confirmed by cluster analysis. These categories are IS^ in Table m. . i "Everyday stuff" made up the largest single category (30.410/), followed by items dealing with illness (19.15%). In these "natural categories," womep talked more than men did about everything except work-related
I good things, and good family things. Men and women both talked equally about house-related news.
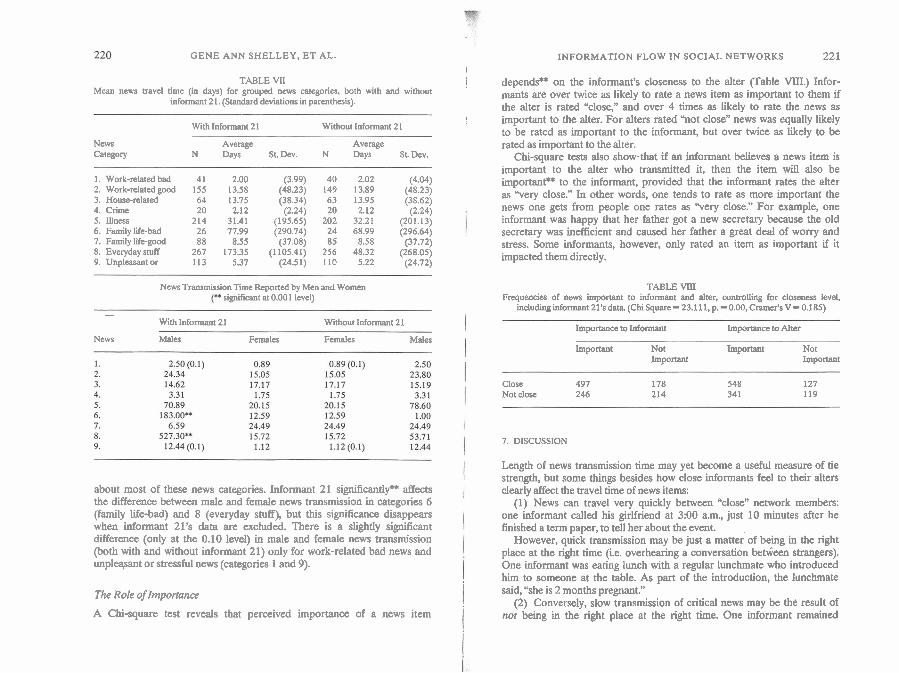
i Table W lists news travel times for the nine categories of news. The i
INFORMATION FLOW IN SOCIAL NETWORKS 217
TABLE V Information on transmission times (in days) for individual news items. Zem indicates that
informant and alter both found out about the news at the same time
News Percent of Item Dataset Mode Median Mean Std Dev
1. Pregnancy I .2 1.00 1.50 19.19 48.81 2. Childbirth 0.7 2.00 2.50 12.19 18.72 3. Marriage 0.8 14.00 55.50 114.90 150.42 4. Death 2.0 1.00 2.00 3.45 3.92 5. Work related accornplisb . a t s 5.3 1 .OO 0.56 2.43 5.07 6. Work related problems 2.5 0 0.28 1.34 3.37 7. Lostjob 0.6 14.00 1.89 5.31 6.82 8. Business trip 2.5 1.00 1.00 2.86 6.18 9. Non-business trip 8.1 1.00 1.00 35.79 73.74
10. Illness (major) 5.6 3.00 3.00 81.68 353.16 I I . Illness (minor) 5.0 0 0.64 3.90 20.12 12. Accident 3.0 0.15 0.57 4.12 15.39 13. Major purchase 2.9 1.00 2.00 6.07 9.18 14. Minor purchase 0.9 0.01 0.63 4.28 9.31 15. Love affair 0.1 5.00 5.00 5.00 0.0 16. Divorce 0.6 1.50 14.00 82.50 158.35 17. Separation 0.4 0 7.00 19.20 25.45 18. Sexual harassment 0.4 0 1.80 1.65 1.25 19. Social event 3.5 1.00 1.00 1.26 1.75 20. Financial problem 1.1 0.08 0.26 15.41 51.84 21. Moving 2.5 1.00 3.00 28.86 69.19 22. Argument 0.7 0.11 0.36 4.13 10.46 23. Put house up for sale 0.3 7.00 7.00 4.78 3.85 24. Took house off market 0.2 1.00 7.50 7.50 9.19 25. Change/pcrsonal appearance 1 .I 11.00 10.00 6.64 6.10 26. Children's activities/good 2.0 0.1 1 0.53 3.58 8.01 27. Children's activitidad 0.6 0.03 0.06 0.77 1.47 28. Personal accomplishment 2.7 0.02 0.50 12.13 60.08 29. Personal problem 1.9 1.00 1.00 2.90 4.46 30. Sold house or business 0.8 0.13 4.00 17.74 29.41 3 1. Child sexually active 0.2 4.00 732.00 732.00 1029.55 32. Hijacking 0.2 0.20 0.51 0.51 0.69 33. Coincidence 0.6 0.02 8.00 1931.86 3439.88 34. Missing chiid/children 0.2 4.00 5.50 5.50 2.12 35. Considering job change 1.8 0 0.50 4.72 9.28 36. Gotajob 2.6 0.02 200 56.97 110.87 37. Job transfedunwanted 0.4 4.00 3.00 2.40 1.79 38. Quitting job/reriring 2.1 1.00 1.00 4.77 7.39 39. Job transfer/wanted 1.7 14.00 14.00 33.79 51.12 40. Became self-employed 0.4 4.00 4.00 6.00 4.47 41. Car problems 2.4 0.02 0.06 1.82 4.03 42. Medical problem/worse 1.3 1.00 0.08 1.03 1.77
218
Tabk V (conrhlred)
GENE ANN SHELLEY, ET AL.
News Item
Percent of Mode Median Mean Std Dev
43. Medical probledimproving 44. Happy about something 45. Home improvement 46. Received or gave something 47. Went hunting 48. Startedrhool 49. Doghad puppies 50. Reconciliation 5 1. Robbery or burglary 52. Information 53. Amusing anecdote 54. Alcohol or drug problem 55. Changefliving arrangements 56. Extortion 57. Snake encounter 58. Murder 5% Findsomeone 60. Mixarriagc 61. Tubalpregnancy 6 2 Viaitorleft 63. Female medical problem 64. Unhappy about something 65. Found somconJlost track of 66. Unable to go somewhere 67. Abonion 68. Kidnapping 69. Rape 70. Engsganent 71. Made a decision 72. Began adoption process 73. Committed suicide 74. Got new bayfriendfgklfriend 75. Waget adopMchild 76. BroLmengegancat 77. Move cancelled 78. Someonelied 79. Ma someone famous 80. Won something 81. Pilot in Libyan bombing raid 82. Airplaoctrouble 83. ObscenephonecaU 84. l+mdmissingchild 85. Aftend mceting/appoinanent 86. Broken appliance 87. Test(examiaation)
INFORMATION FLOW IN SOCIAL NETWORKS
Fig. 6. A multidimensional scaling of the 87 news categories d i i by informants. Circled areas represent the final nine categories detined by informant pile soas.
TABLE VI Percent of news items reported by men and women. (Including Informant 2 1)
News Category
Percentages
Female Male All Data
N - 1 135 news items I. Work-related bad 2. Work-related good 3. House-related 4 Crime 5. Illness 6. Family life-bad 7. Family life-good 8. Everyday stuff 9. Unpleasant or stressful
Total percentages: 56.38 43.62 - 100.00
mean news travel time column indicates work related-bad news and news about crime travelled fastest, followed by stressful news and then good news about family life. These transmission times may reflect the faster transmission times for women and the predominance of women talking
GENE ANN SHELLEY. ET AL.
TABLE VII Mean news travel time (in days) for grouped news categories, both with and without
informant 2 1. (Standard deviations in parenthesis).
News Category
I. Work-relatedbad 2. Work-related good 3. House-related 4. Crime 5. Illness 6. Family S i b a d 7. Family lifcgood 8. Everyday stuff 9. Unplessantor
With Informant 21
Average N Days St. Dev.
41 2.00 (3.99) I55 13.58 (48.23) 64 13.75 (38.34) 20 2.12 (2.24)
214 31.41 (195.65) 26 77.99 (290.74) 88 8.55 (37.08)
267 173.35 (1 105.41) 113 5.37 (24.51)
Without Informant 21
Average N Days St. Dev.
40 2.02 (4.04) 149 13.89 (48.23) 63 13.95 (38.62) 20 2.12 (2.24)
202 32.21 (201.13) 24 68.99 (296.64) 85 8.58 (37.72)
256 48.32 (268.05) I10 5.22 (24.72)
News Transmission T~me Reported by Men and Women significant at 0.00 1 level)
- With Informant 21 Without Informant 21
News Males Females Females Males
about most of these news categories. Informant 21 significantly" affects the difference between male and female news transmission in categories 6 (family life-bad) and 8 (everyday stuff), but this significance disappears when informant 21's data are excluded. There is a slightly significant difference (only at the 0.10 level) in male and female news transmission (both with and without informant 21) only for work-related bad news and unpleqant or stressful news (categories 1 and 9).
The Role of Importance
A Chi-square test reveals that perceived importance of a news item
INFORMATION FLOW IN SOCIAL NETWORKS 221 I j depends*' on the informant's closeness to the alter pable VIII.) Infor-
mants are over twice as likely to rate a news item as important to them if the alter is rated uclose," and over 4 times as likely to rate the news as
: important to the alter. For alters rated "not closen news was equally likely to be rated as important to the informant, but over twice as likely to be rated as important to the alter.
Chi-square tests also show-that if an informant believes a news item is important to the alter who transmitted it, then the item will also be importanP* to the informant, provided that the informant rates the alter as "very close." In other words, one tends to rate as more important the news one gets from people one rates as "very close." For example, one informant was happy that her father got a new secretary because the old secretary was inefficient and caused her father a great deal of worry and stress. Some informants, however, only rated an item as important if it impacted them directly.
TABLE W U Frequencies of news important to informant and alter, controlling for closeness level,
includiug informant 21's data. (Chi Square - 23.1 11, p. - 0.00, Cramer's V - 0.185)
hportana to ~ a f b n i n t Importance to Alter
Important Not Important Not Important Important
Close 497 178 548 127 Not close 246 214 341 119
7. DISCUSSION
Length of news transmission time may yet become a useful measure of tie strength, but some things besides how close informants feel to their alters clearly affect the travel time of news items:
(1) News can travel very quickly between "close" network members: one informant called his girlfriend at 3:00 a.m, just 10 minutes after he finished a term paper, to tell her about the event.
However, quick transmission may be just a matter of being in the right place at the right time (ie. overhearing a conversation bedeen strangers). One informant was eating lunch with a regular lunchmate who introduced him to someone at the table. As part of the introduction, the lunchmate said, "she is 2 months pregnant."
(2) Conversely, slow transmission of critical news may be the result of not being in the right place at the right time. One informant remained
GENE ANN SHELLEY, ET AL.
uninformed of her niece's fall from a tree until 8 hours after medical treatment, even though an attempt was made to call the informant just 3 hours after the accident. Children must wait until school is over before they can tell important things to their parents. Sometimes husbands and wives work different shifts.
On occasion, third parties, who may not be aware of all close ties, must ascertain tie strength between someone who is dead or incapacitated to know who to contact in an emergency. One informant was out of state, reading the newspaper, and discovered that a close friend in that state had died 3 days before. No one knew of this informant's clase tie to the deceased, so none of the relatives called the informant. Another informant did find out about a serious accident to his friend out of state within 2 hours because a brother was aware of their friendship and telephoned the informant.
(3) Unless it is urgent, people who expect to be in touch with certain other people fairly soon, will wait until they would normally see them to transmit news. Many informants were on a regular contact schedule with some of their alters. Precisely for this reason, one informant found out about her niece's fiance's death 3 days after his death, even though her mother found out 2 days after the death. Even people who see each other every day sometimes have a regular "information spreading timen (coffee before work, at lunchtime, breaks, etc.) where everyone gets updated on the activities of everyone else.
(4) Sometimes a person may not wish to wony another and will wait before giving stressful news. One informant was not notified of his father's heart attack for 4 days for this reason.
(5) Some things are perceived as too sensitive to tell over the phone. One informant learned about a kidnapping, a rape and an abortion among his family members when he had to travel to their town for his father's surgery.
(6) News may be reported on a "need to know" basis. One informant had known her friend for 13 years but did not find out he had false teeth until the friend was hospitalized. The friend knew his secret would be discovered when the informant saw him without his teeth, so he finally told her.
(7) One infonnant was a "designated callern for a member of his family who had a chronic illness and who could not afford long-distance phone calls. It was the informant's job to disseminate news about the relative's condition. How often the informant did this varied by circumstances.
8. CONCLUSIONS
From these data, we conclude that closeness of tie between two people is
- \
INFORMATION FLOW IN SOCIAL NETWORKS 223
not a simple matter of how long it takes for any individual items of news to travel between them. Examination of the pattern of interactions between / two people may yet be useful in judging strength of social tie, and several
I findings from this research clearly warrant further exploration: (1) People with more education and more prestigious occupations tend
to receive news more slowly than others. (2) If a news item is classified by an informant as important to the
alter, then the informant is likely to consider the item important only if the informant classified the alter as "very close."
(3) Contrary to folk belief, bad news and good news travel at about the same rate, but both travel faster than neutral news.
(4) There appears to be a significant difference in the information one I gets from relatives, friends and acquaintances. There are many more acquaintances than friends and many fewer relatives than friends, but most I news is reportedly transmitted by friends.
Relatives receive news much faster than friends and significantly faster than acquaintances, and most relatives are labeled "close." In fact, for these data, kinship is a very good predictor of closeness, although infor- mants only named relatives they talked to recently. Relatives with whom
I people do not talk regularly might not be labeled close. Relatives are not the only close network members. One informant was
informed about a friend's spleenectomy two days before the friend told his 1' own (adult) children. In addition, the hiend preferred to spend time before surgery with the informant, rather than his own children. Interest- I ingly, one of these children had gone to Georgia for medical te-sts five months earlier and didn't tell his mother about it until he was sitting with 1 her in the surgery waiting room during the father's illness.
(5) No particular type of news is transmitted significantly faster than I any other in these data. Men and women talked about both similar and different things. Men seemed to emphasize good news, while women I talked more about bad news. The most talked about news categories were
I illness, work related items, or just "everyday stuff." (6) Although there is no difference between males and females in some
news transmission variables (amount of news transmitted, network range, I and number of close alters) men and women differ greatly in transmission 1 times. In these data, women handled news faster (twice as fast) than men, 1 even without the influence of informant 21's college reunion data. This
could have something to do with the folklore that women are more open i than men in discussing personal matters. (7) Both relatives and nonrelatives who were rated "close" got news, I on average, Ulree to four times faster lban those rated %ot cclose: For
both men and women, news transmission from "close" alters to informants i is faster than between "not close" alters. However, this is not a significant
1 difference for news S C n f l o s e " alters.
GENE ANN SHELLEY, ET AL.
I Finally, these data were rich with the sort of stories from which small- , world folklore is built. These informants were in networks with foreign 8
ambassadors, the president of Chemical Bank, a pilot who flew a bombing , run against Iraq, another pilot who narrowly escaped a hijacking in i Pakistan and ended up flying the survivors back home, the captain of the ! guard for Czar Nicholas of Russia, and people who had been in a recent movie with Brooke Shields. These events and network contacts may seem rather amazing, but these informants were plain, ordinary, middle class residents of Gainesville, Jacksonville and Orange Park, Florida. Why are we still surprised when we hear of similar events and contacts among people in our own networks?
i ACKNOWLEGMENTS
This work was supported by the National Science Foundation Social Structure Grant #SES 880-35-77. The authors wish to thank Steve Borgatti for providing the software program "ALP which was used for our work with multidimensional scaling. The authors are also indebted to Dr. Eugene C. Johnsen for his insightful discussions concerning this paper.
BIBLIOGRAPHY
Bernard, H. Russell and Peter D. Killworth 1977 Informant Accuracy in Social Network I Data IL Human Communication Research 4(1): 3-1 8.
Bernard. H. Russell, Paer D. Killworth, David Kronenfeid, and Lee Sailer I984 The I Pmblem of Infonnant Accuracy: The Validity of Retmspective Data Ann. Rev. Anth. 13: 495-5 17.
Bernard, H. Russell, Peter D. Killworth, and Lee Sailer 1979/80 Informant Accuracy in I Social Network data IV: A Comparison of Clique-level Structure in Behavioral and Cognitive Network Data. Social Networks 2: 191 -21 8.
Bernard, H. Russd, Peter D. .Killworth, Eugene C. Johuscn, Gene A. Shelley, Chris I
McCaq and Scott Robinson 1990 Conrparlng Four Different Metbods for McssUring I Personal Networks. Accepted by Social Networks.
Epstein, A. L. 1969 Gossip, Norms and Social Netwok In Social Science and Urban 1 SiIuations. Ed. Uyde Mitchell, Mancheter University Prcss, p. 117-127.
Fischer, Claude S. 1982 What Do We Meau by 'Friend'? An Inductive Study. Social Networks 3: 287-306.
Friedkin, Noah E. 1980 A Test of Structural Featurn of Granovetter's Strength of Weak Ties Theory. Social Networks 2: 4 11--422.
Graaoveaer, Mark S. 1973 The Strength of Weak Ties. American Journal of Sociology 78: 136el380.
Granovetter, Mark S. 1982 The Strength of Weak Ti: A Network Theory Revisited. In Social Structure and Network Analysis. Beverly Hills: Sage.
Illness. Soc. Sci. Med. 1 7 0 : 405-411. i
INFORMATION FLOW IN SOCIAL NETWORKS
Hornstein, Gail A. 1985 Intimacy in Conversational Style as a Function of the Degree of Closeness Between Members of a Dyad. Personality and Social Psychology 49(3): 671-681.
Kapferer, B. 1969 Norms and tbe Manipulation of Relationships in a Work Context. In Social Networks in Urban Situations: Analyses of Personal Relationships in Central African Toms, Ed. Clyde Mitchell, Manchtster: Manchester University Press, p. 181- 244.
Killworth, Peter D. and H. R u s d Bernard 1976 Infonnant Accuracy in Social Network Data. H u m Organization 35(3): 269-286.
Killworth, Peter D. and H. Russell Brmard 1979180 Informant Accuracy in Social Network Data I l l A Comparison of Triadic Structure in Behavioral and Cognitive Data. Social Networks 2: 10-46.
Li, Nan, Alfred Dean and Walter M. Ensel, 1986 Social Support Life Events and Depression. Academic Press, Inc.
Marsden, Peter V. and K a m E. Campbell 1984 Measuring Tie Strength. Social Forces 63(2): 482-501.
Mitchell, J. ed. 1969 Social Networks in Urban Situations: Analyses of Personal Relation- ships in Central African Towns. Mancher: Manchester University Rss for Institute of Social RcPearch, Zambia
Reiss, Albert I., Jr. 1961 Occupations and Social Slatus. New Yo& The F h e Press of Glencoe, Inc.
Wheeldon, P. D. 1969 The Operation of Voluntary Associations and P m o d Networks in the Political Process of an Inter-Ethnic Community. In Sodel Networks in Urban Situations: Analyses of Personal Relationship in Central African Towns, Ed. Clyde Mitchell, Manchwer University Pnss, p. 128-180.