Embed Size (px)
Citation preview
SISHEN SITE VISIT 23 NOVEMBER 2017

1
− Welcome Bothwell Mazarura
− Safety induction Mapi Mobwano
− Introduction Themba Mkhwanazi
− Marketing Timo Smit
− Kolomela Masala Mutangwa
− Sishen Mapi Mobwano
− Technology Glen McGavigan
− Conclusion Themba Mkhwanazi
− Details of Site Tour Mapi Mobwano
AGENDA

INTRODUCTION
THEMBA MKHWANAZI
3
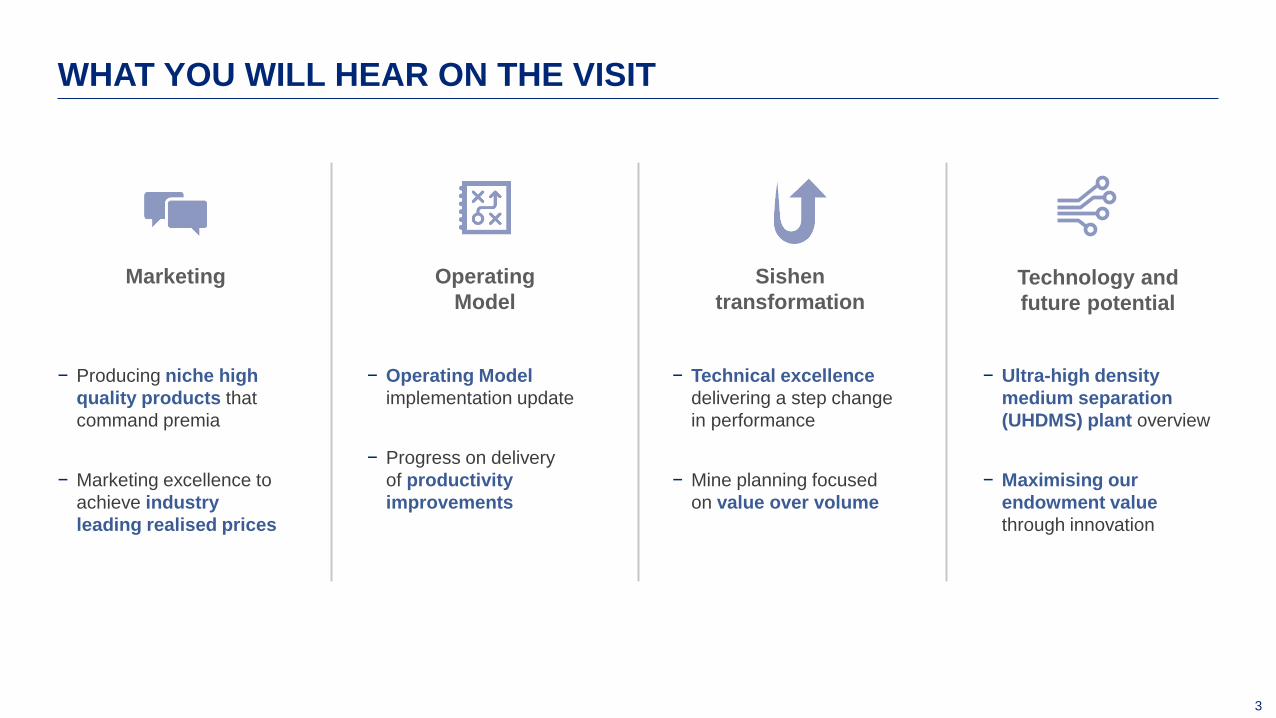
− Technical excellence
delivering a step change
in performance
− Mine planning focused
on value over volume
Sishen
transformation
− Producing niche high
quality products that
command premia
− Marketing excellence to
achieve industry
leading realised prices
Marketing
WHAT YOU WILL HEAR ON THE VISIT
− Operating Model
implementation update
− Progress on delivery
of productivity
improvements
Operating
Model Technology and
future potential
− Ultra-high density
medium separation
(UHDMS) plant overview
− Maximising our
endowment value
through innovation
4
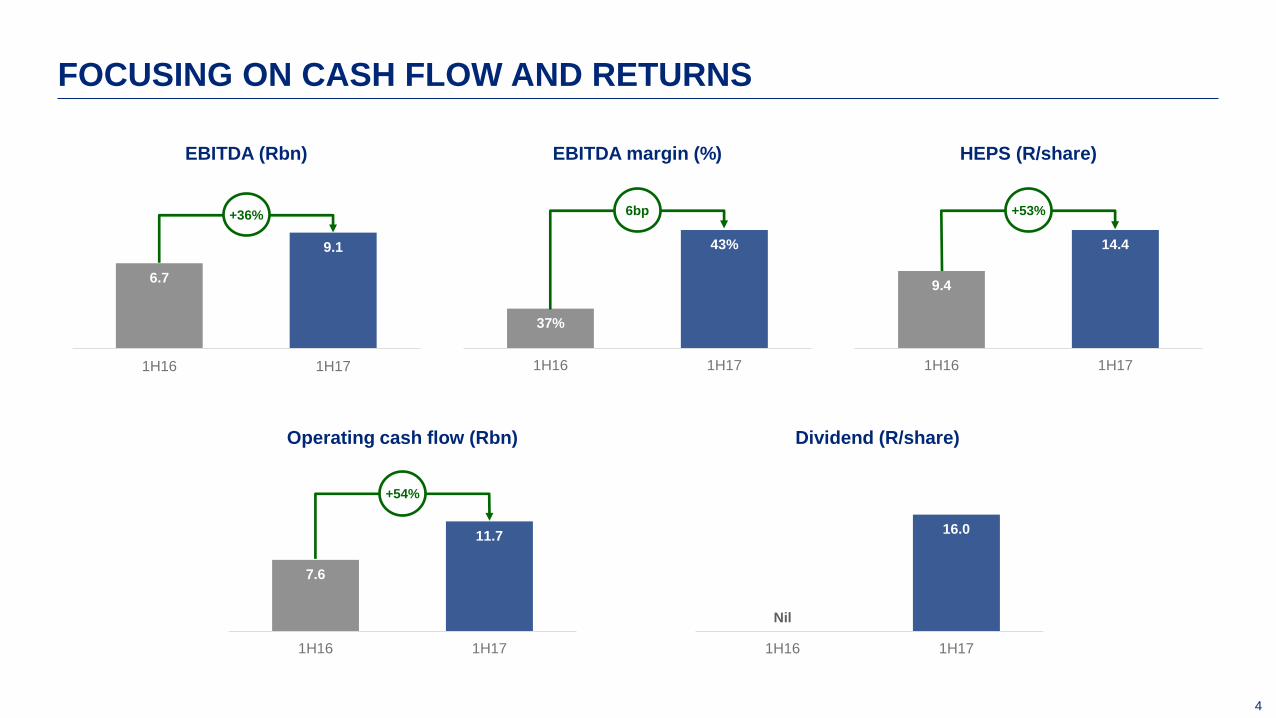
FOCUSING ON CASH FLOW AND RETURNS
6.7
9.1
1H16 1H17
+36%
EBITDA (Rbn) EBITDA margin (%) HEPS (R/share)
37%
43%
1H16 1H17
6bp
9.4
14.4
1H16 1H17
+53%
7.6
11.7
1H16 1H17
+54%
Operating cash flow (Rbn) Dividend (R/share)
Nil
16.0
1H16 1H17
5
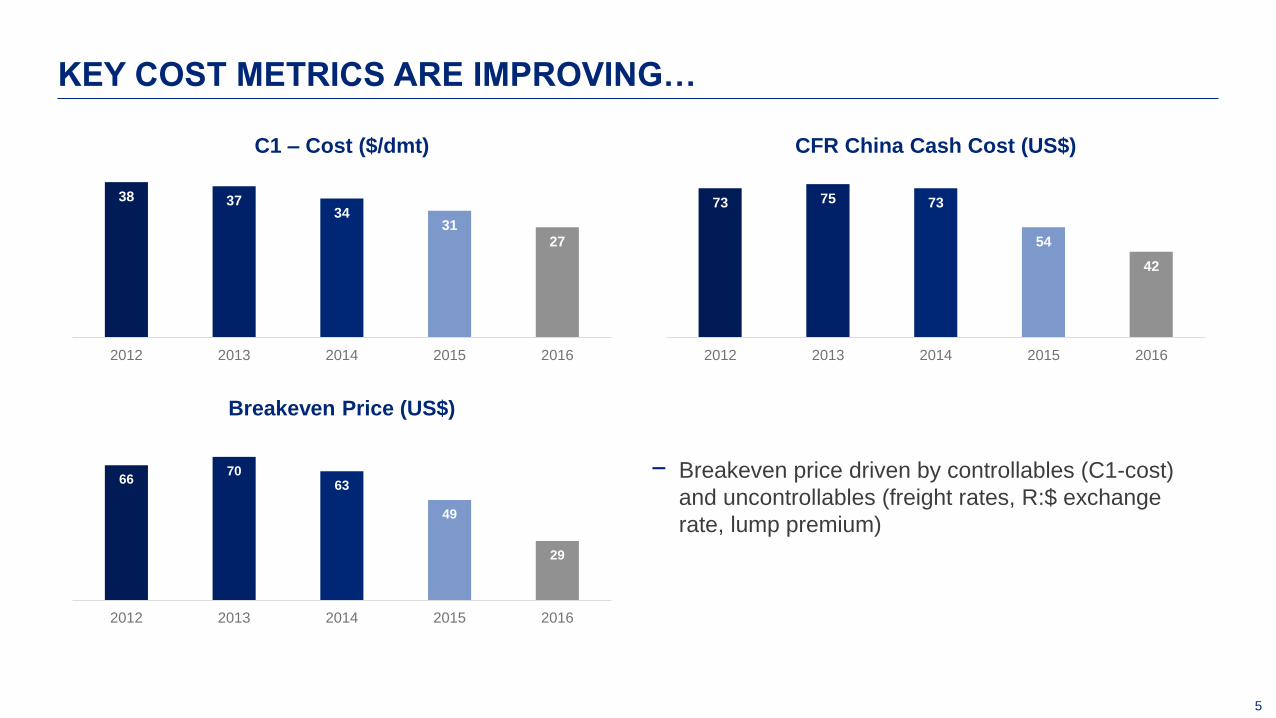
38 37 34
31 27
2012 2013 2014 2015 2016
C1 – Cost ($/dmt)
− Breakeven price driven by controllables (C1-cost)
and uncontrollables (freight rates, R:$ exchange
rate, lump premium)
KEY COST METRICS ARE IMPROVING…
73 75 73
54
42
2012 2013 2014 2015 2016
CFR China Cash Cost (US$)
66 70
63
49
29
2012 2013 2014 2015 2016
Breakeven Price (US$)
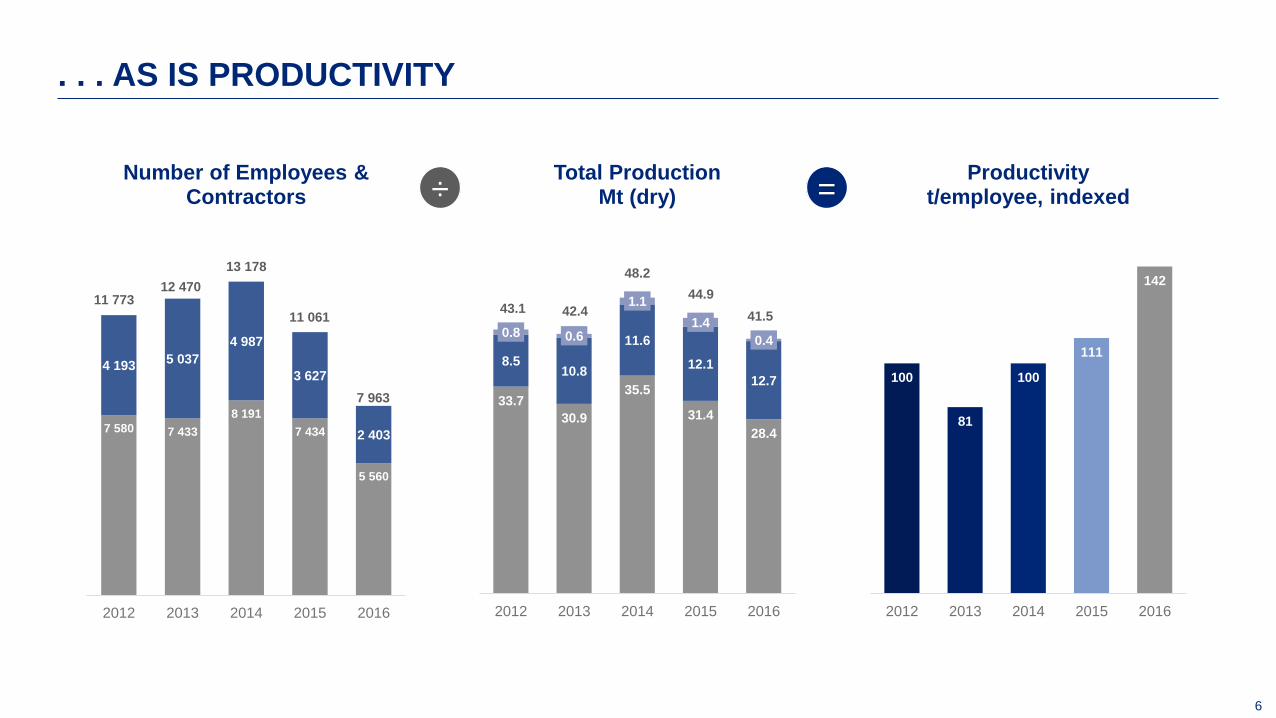
6
. . . AS IS PRODUCTIVITY
7 580 7 433
8 191
7 434
5 560
4 193 5 037
4 987
3 627
2 403
2012 2013 2014 2015 2016
Number of Employees & Contractors
13 178
11 061
7 963
11 773 12 470
33.7
30.9
35.5
31.4
28.4
8.5 10.8
11.6
12.1
12.7
0.8 0.6
1.1
1.4
0.4
2012 2013 2014 2015 2016
Total Production Mt (dry)
43.1 42.4
48.2
44.9
41.5
100
81
100
111
142
2012 2013 2014 2015 2016
Productivity t/employee, indexed ÷ =
7
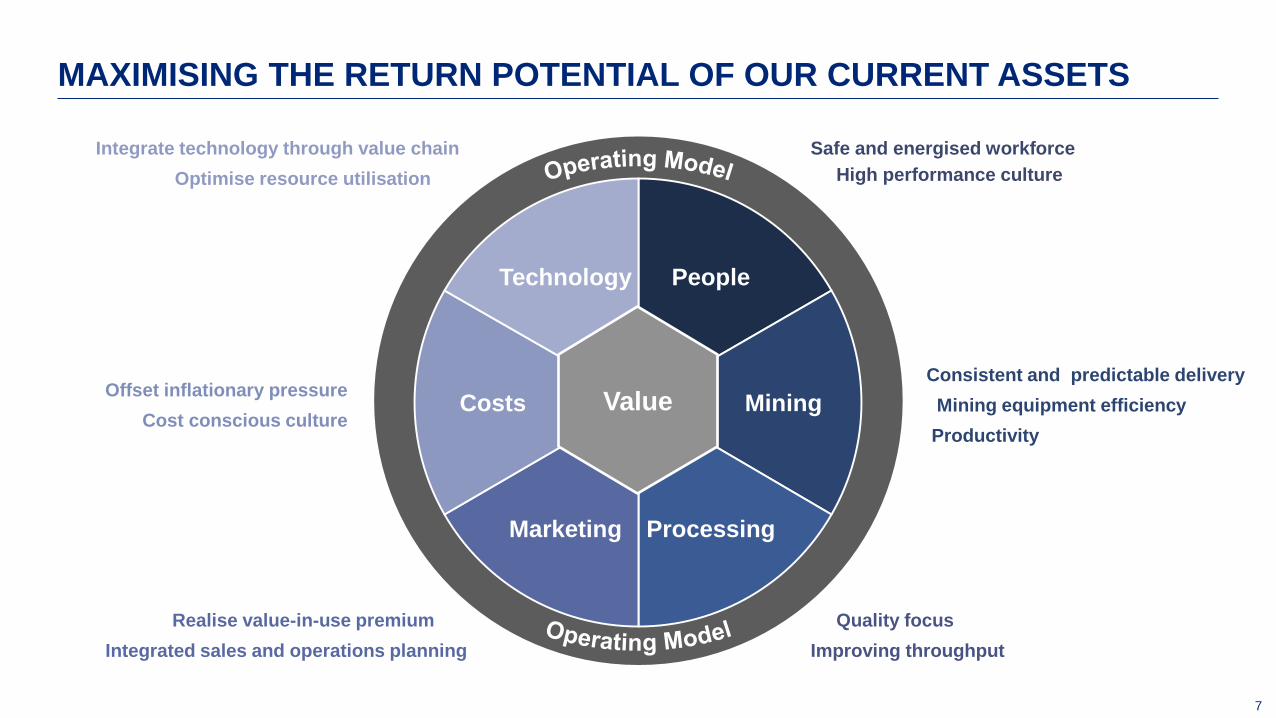
People
Mining
Processing Marketing
Costs
Technology
Value
Safe and energised workforce
High performance culture
Consistent and predictable delivery
Mining equipment efficiency
Productivity
Quality focus
Improving throughput
Realise value-in-use premium
Integrated sales and operations planning
Offset inflationary pressure
Cost conscious culture
Integrate technology through value chain
Optimise resource utilisation
MAXIMISING THE RETURN POTENTIAL OF OUR CURRENT ASSETS
8
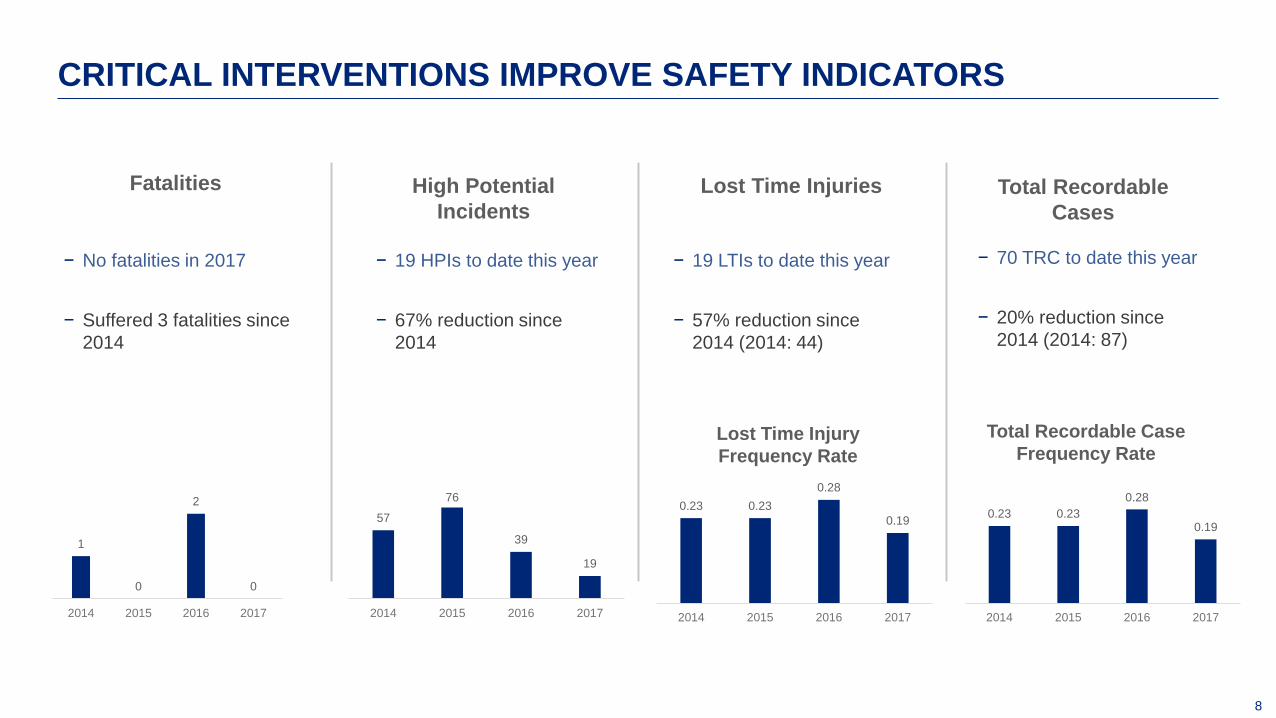
CRITICAL INTERVENTIONS IMPROVE SAFETY INDICATORS
− No fatalities in 2017
− Suffered 3 fatalities since
2014
− 70 TRC to date this year
− 20% reduction since
2014 (2014: 87)
Fatalities High Potential
Incidents Total Recordable
Cases
Lost Time Injuries
1
0
2
0
2014 2015 2016 2017
− 19 LTIs to date this year
− 57% reduction since
2014 (2014: 44)
− 19 HPIs to date this year
− 67% reduction since
2014
Lost Time Injury
Frequency Rate
Total Recordable Case
Frequency Rate
57
76
39
19
2014 2015 2016 2017
0.23 0.23
0.28
0.19
2014 2015 2016 2017
0.23 0.23
0.28
0.19
2014 2015 2016 2017
IRON ORE MARKETS OVERVIEW
TIMO SMIT
10
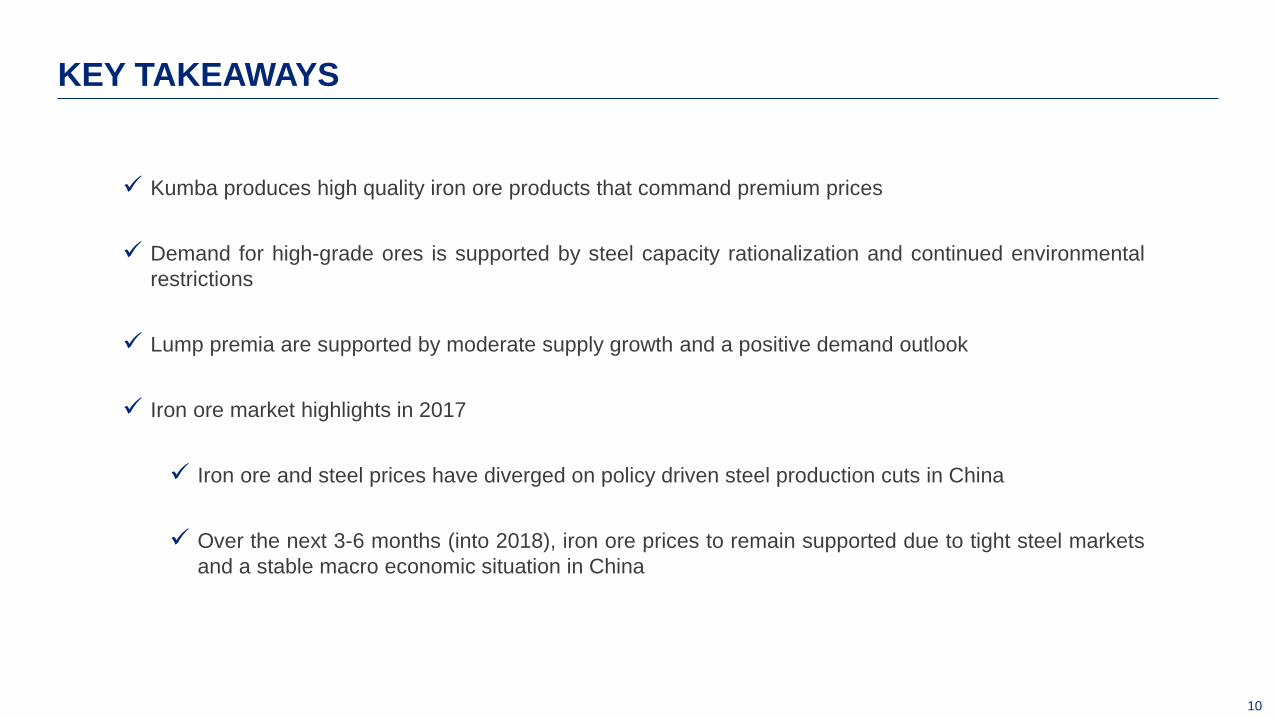
Kumba produces high quality iron ore products that command premium prices
Demand for high-grade ores is supported by steel capacity rationalization and continued environmental
restrictions
Lump premia are supported by moderate supply growth and a positive demand outlook
Iron ore market highlights in 2017
Iron ore and steel prices have diverged on policy driven steel production cuts in China
Over the next 3-6 months (into 2018), iron ore prices to remain supported due to tight steel markets
and a stable macro economic situation in China
KEY TAKEAWAYS
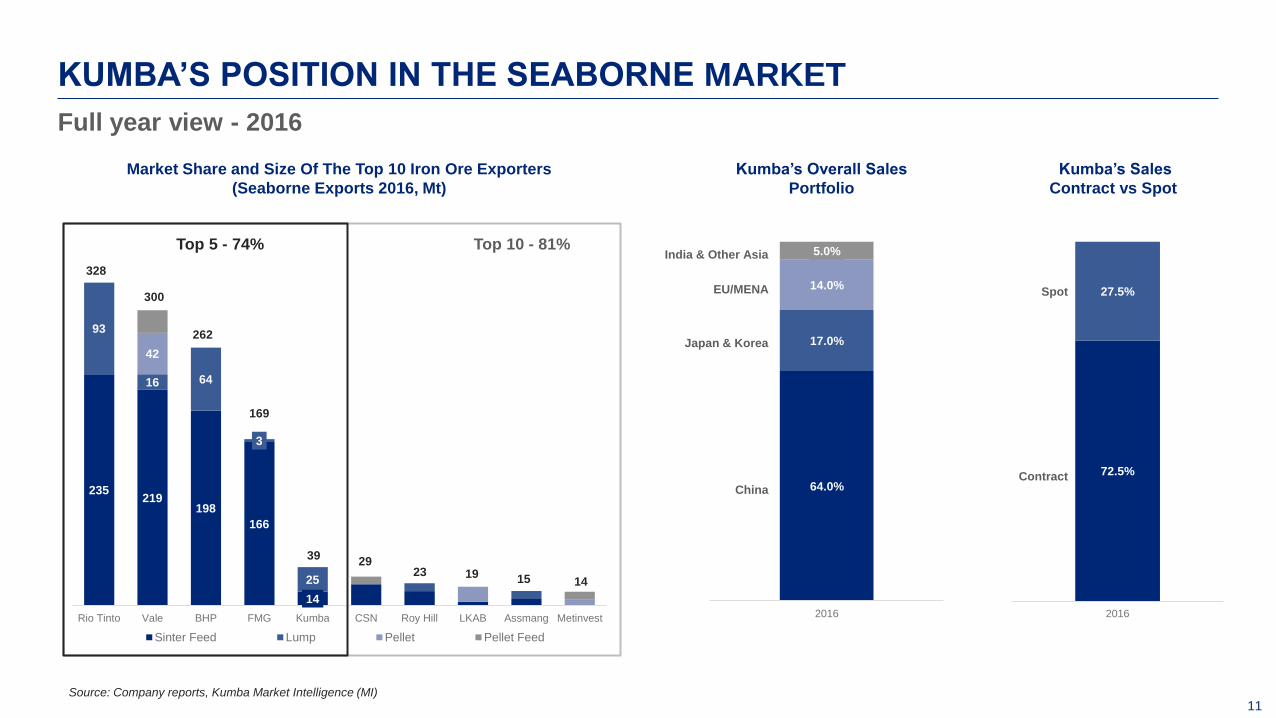
11 Source: Company reports, Kumba Market Intelligence (MI)
KUMBA’S POSITION IN THE SEABORNE MARKET
235 219
198
166
14
93
16 64
3
25
42
Rio Tinto Vale BHP FMG Kumba CSN Roy Hill LKAB Assmang Metinvest
Sinter Feed Lump Pellet Pellet Feed
300
169
328
262
14 15 23
29 19
39
64.0%
17.0%
14.0%
5.0%
2016
India & Other Asia
EU/MENA
Japan & Korea
China
Market Share and Size Of The Top 10 Iron Ore Exporters
(Seaborne Exports 2016, Mt)
Top 5 - 74% Top 10 - 81%
Full year view - 2016
72.5%
27.5%
2016
Spot
Contract
Kumba’s Overall Sales
Portfolio
Kumba’s Sales
Contract vs Spot
12
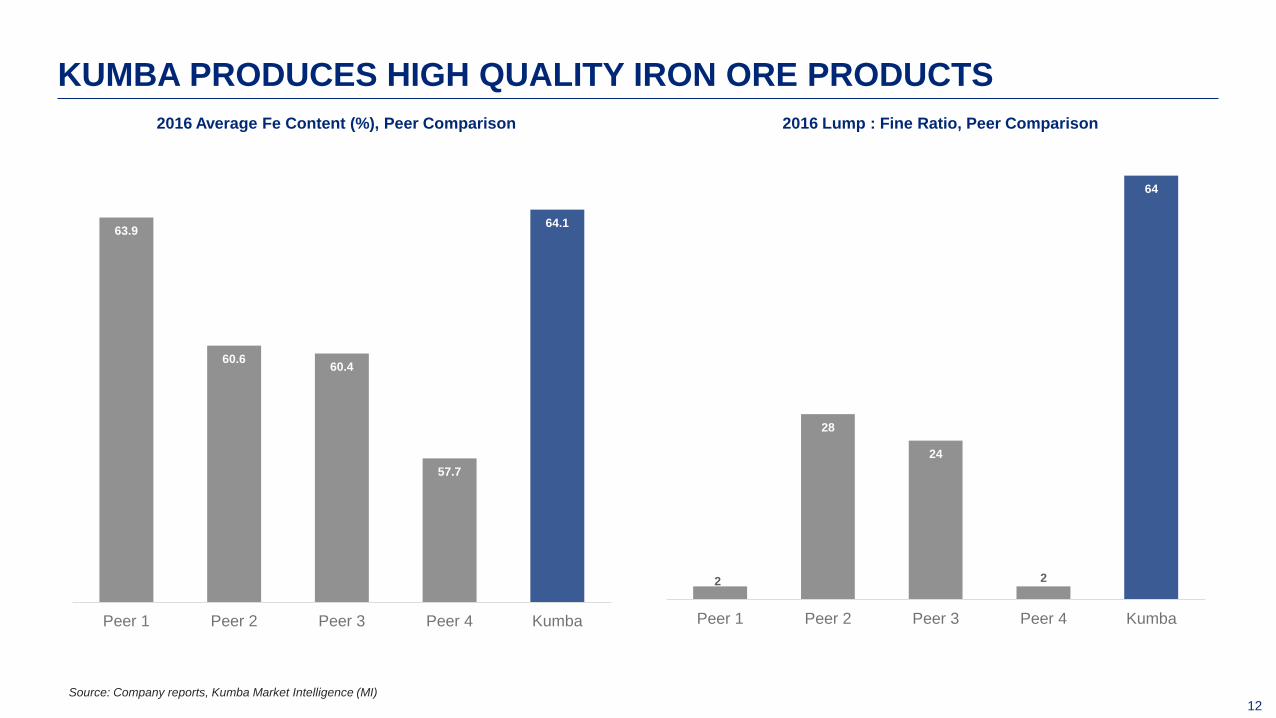
63.9
60.6 60.4
57.7
64.1
Peer 1 Peer 2 Peer 3 Peer 4 Kumba
2
28
24
2
64
Peer 1 Peer 2 Peer 3 Peer 4 Kumba
Source: Company reports, Kumba Market Intelligence (MI)
KUMBA PRODUCES HIGH QUALITY IRON ORE PRODUCTS
2016 Average Fe Content (%), Peer Comparison 2016 Lump : Fine Ratio, Peer Comparison
13
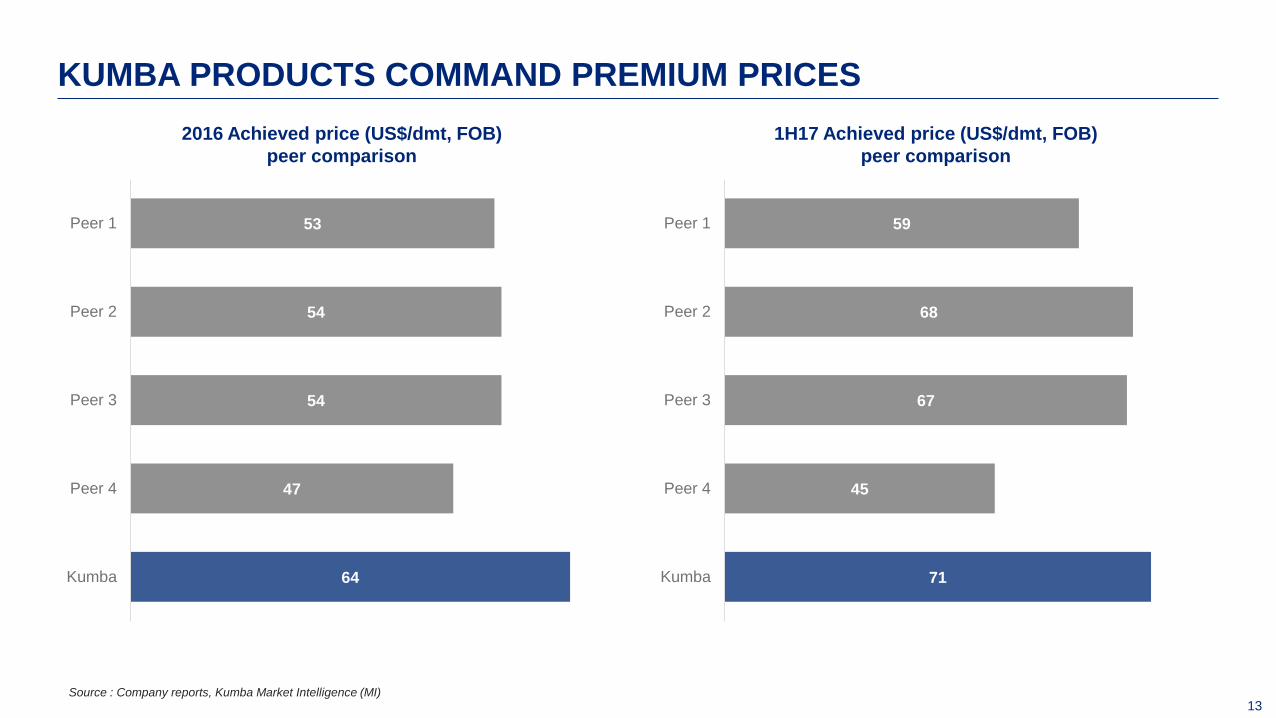
64
47
54
54
53
Kumba
Peer 4
Peer 3
Peer 2
Peer 1
KUMBA PRODUCTS COMMAND PREMIUM PRICES
2016 Achieved price (US$/dmt, FOB)
peer comparison
1H17 Achieved price (US$/dmt, FOB)
peer comparison
Source : Company reports, Kumba Market Intelligence (MI)
71
45
67
68
59
Kumba
Peer 4
Peer 3
Peer 2
Peer 1
14
-30
-20
-10
0
10
20
30
40
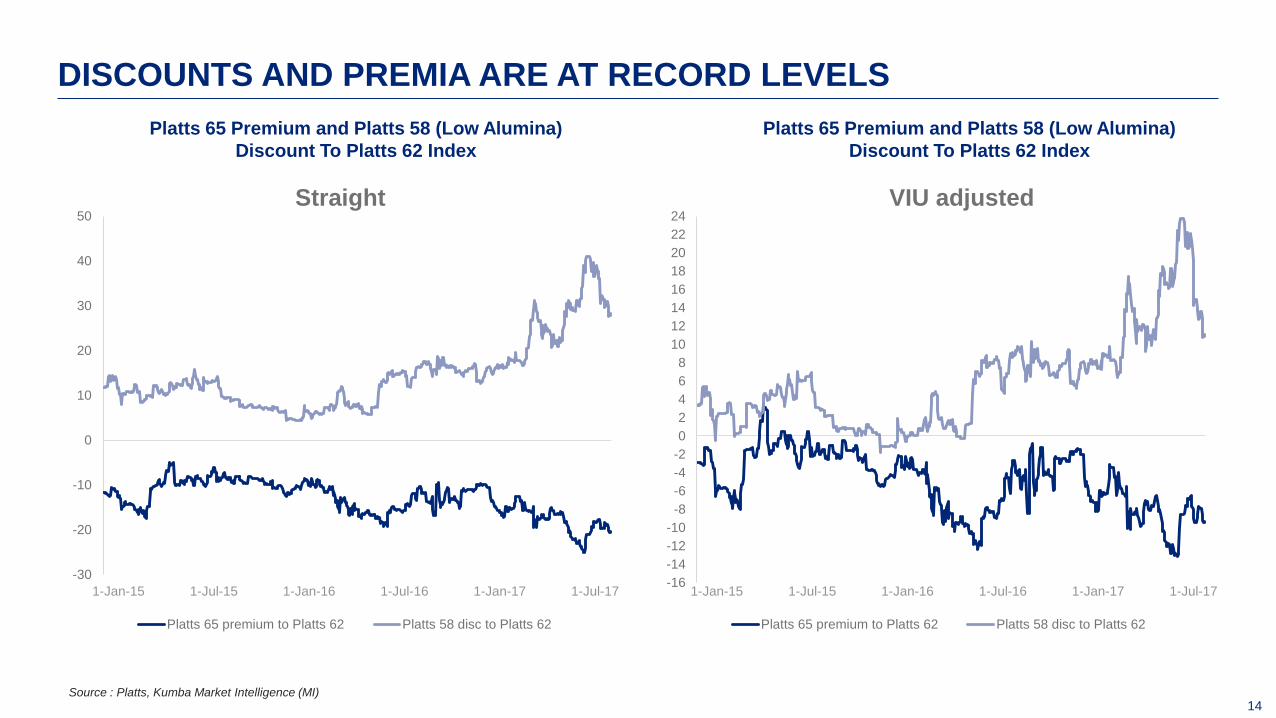
50Straight
Platts 65 premium to Platts 62 Platts 58 disc to Platts 62
DISCOUNTS AND PREMIA ARE AT RECORD LEVELS
Platts 65 Premium and Platts 58 (Low Alumina)
Discount To Platts 62 Index
Platts 65 Premium and Platts 58 (Low Alumina)
Discount To Platts 62 Index
1-Jul-17 1-Jan-15 1-Jan-17 1-Jul-16 1-Jan-16 1-Jul-15
Source : Platts, Kumba Market Intelligence (MI)
-16
-14
-12
-10
-8
-6
-4
-2
0
2
4
6
8
10
12
14
16
18
20
22
24VIU adjusted
Platts 65 premium to Platts 62 Platts 58 disc to Platts 62
1-Jul-17 1-Jan-15 1-Jan-17 1-Jul-16 1-Jan-16 1-Jul-15
15 Source: Kumba Market Intelligence (MI)
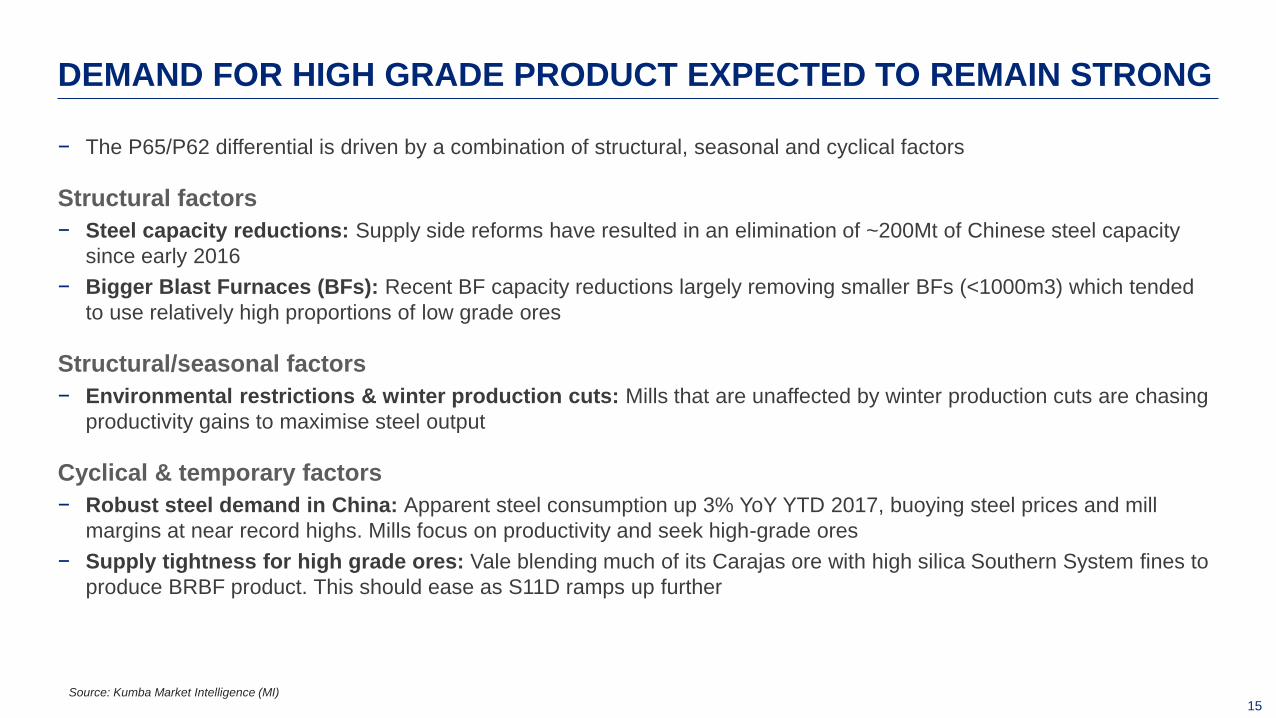
DEMAND FOR HIGH GRADE PRODUCT EXPECTED TO REMAIN STRONG
− The P65/P62 differential is driven by a combination of structural, seasonal and cyclical factors
Structural factors
− Steel capacity reductions: Supply side reforms have resulted in an elimination of ~200Mt of Chinese steel capacity
since early 2016
− Bigger Blast Furnaces (BFs): Recent BF capacity reductions largely removing smaller BFs (<1000m3) which tended
to use relatively high proportions of low grade ores
Structural/seasonal factors
− Environmental restrictions & winter production cuts: Mills that are unaffected by winter production cuts are chasing
productivity gains to maximise steel output
Cyclical & temporary factors
− Robust steel demand in China: Apparent steel consumption up 3% YoY YTD 2017, buoying steel prices and mill
margins at near record highs. Mills focus on productivity and seek high-grade ores
− Supply tightness for high grade ores: Vale blending much of its Carajas ore with high silica Southern System fines to
produce BRBF product. This should ease as S11D ramps up further
16
0
0.04
0.08
0.12
0.16
0.2
0.24
0.28
0.32
0.36
0.4
0.44
0.48
30
40
50
60
70
80
90
100
110
120
130
140
150
Platts 62 (Lhs, $/dmt) Platts Weekly Lump premium ($/dmtu, Rhs)
Source : Platts, Kumba Market Intelligence (MI)
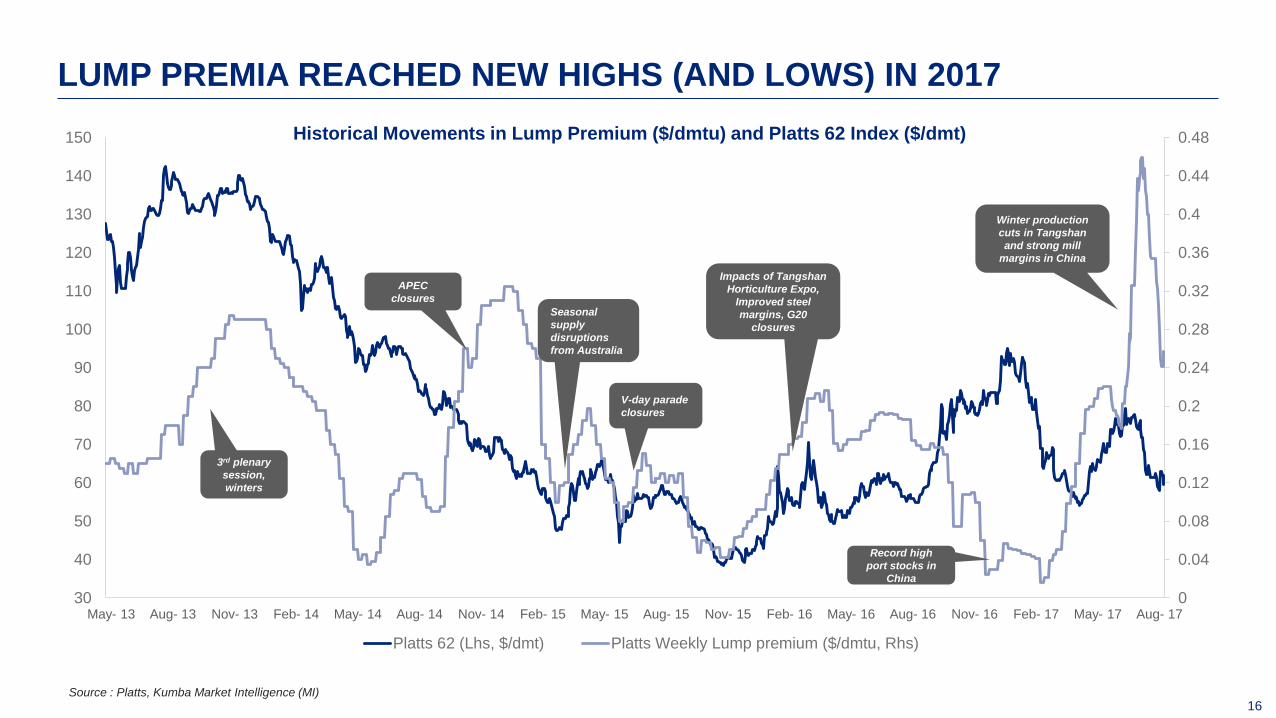
LUMP PREMIA REACHED NEW HIGHS (AND LOWS) IN 2017
Nov- 16 May- 16 Aug- 16 Feb- 15 May- 15 May- 14 Nov- 15 Nov- 13 Nov- 14 Feb- 14 Aug- 14 Feb- 16 Aug- 15 May- 17 Feb- 17 Aug- 17 Aug- 13 May- 13
APEC
closures
Impacts of Tangshan
Horticulture Expo,
Improved steel
margins, G20
closures
Seasonal
supply
disruptions
from Australia
V-day parade
closures
3rd plenary
session,
winters
Historical Movements in Lump Premium ($/dmtu) and Platts 62 Index ($/dmt)
Winter production
cuts in Tangshan
and strong mill
margins in China
Record high
port stocks in
China
17 Source : Kumba Market Intelligence (MI)
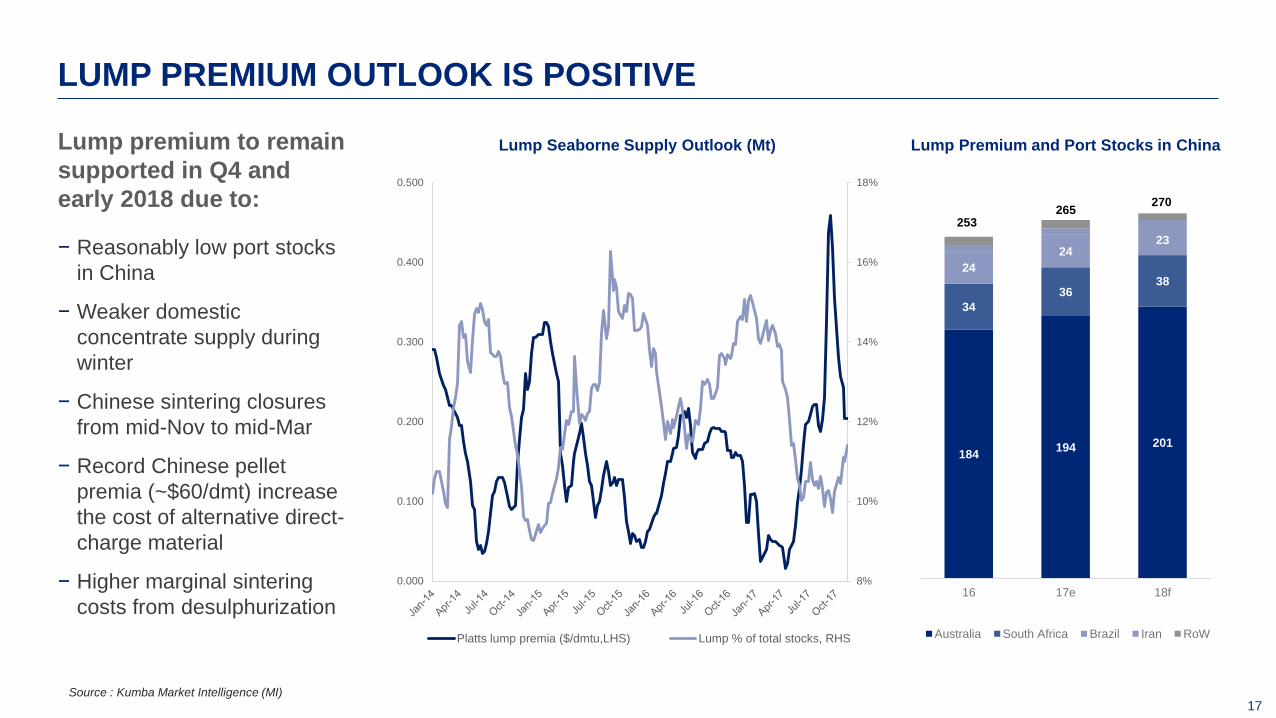
LUMP PREMIUM OUTLOOK IS POSITIVE
Lump premium to remain
supported in Q4 and
early 2018 due to:
− Reasonably low port stocks
in China
− Weaker domestic
concentrate supply during
winter
− Chinese sintering closures
from mid-Nov to mid-Mar
− Record Chinese pellet
premia (~$60/dmt) increase
the cost of alternative direct-
charge material
− Higher marginal sintering
costs from desulphurization
8%
10%
12%
14%
16%
18%
0.000
0.100
0.200
0.300
0.400
0.500
Platts lump premia ($/dmtu,LHS) Lump % of total stocks, RHS
184 194 201
34
36 38
24
24 23
16 17e 18f
Australia South Africa Brazil Iran RoW
270 265
253
Lump Premium and Port Stocks in China Lump Seaborne Supply Outlook (Mt)

IRON ORE MARKET
HIGHLIGHTS IN 2017
19
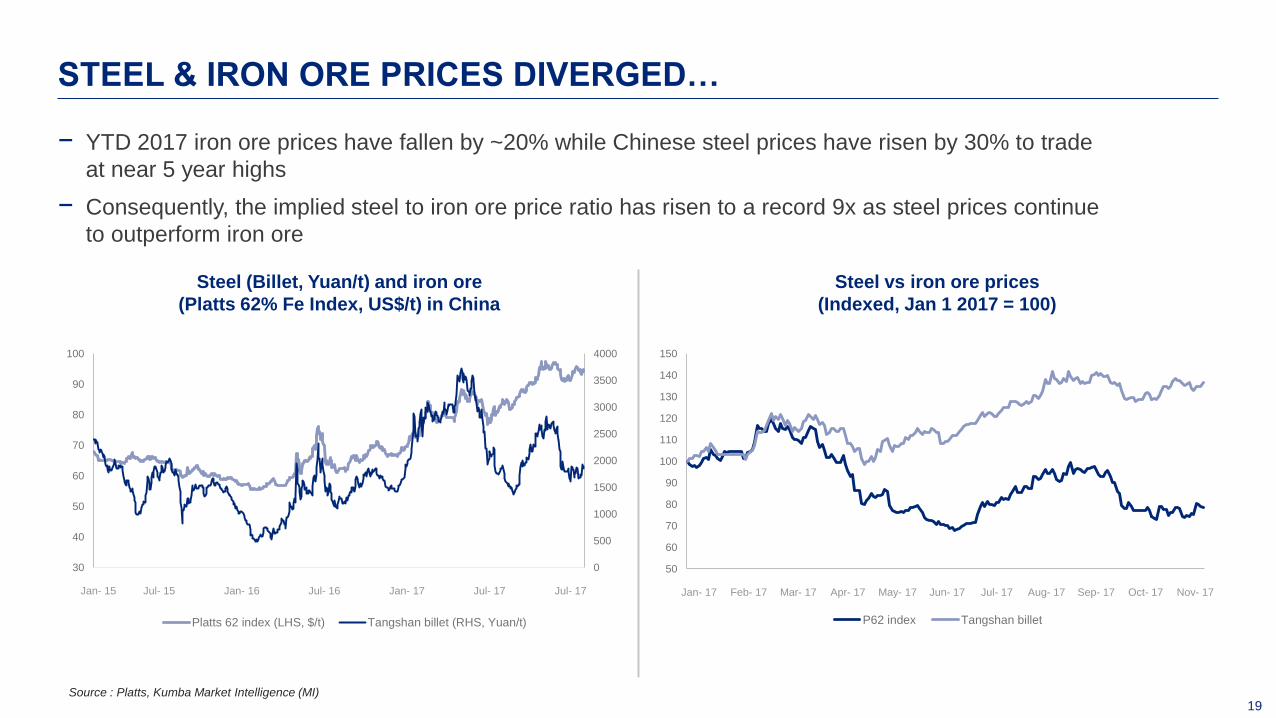
− YTD 2017 iron ore prices have fallen by ~20% while Chinese steel prices have risen by 30% to trade
at near 5 year highs
− Consequently, the implied steel to iron ore price ratio has risen to a record 9x as steel prices continue
to outperform iron ore
30
40
50
60
70
80
90
100
0
500
1000
1500
2000
2500
3000
3500
4000
Platts 62 index (LHS, $/t) Tangshan billet (RHS, Yuan/t)
50
60
70
80
90
100
110
120
130
140
150
P62 index Tangshan billet
STEEL & IRON ORE PRICES DIVERGED…
Steel (Billet, Yuan/t) and iron ore
(Platts 62% Fe Index, US$/t) in China
Steel vs iron ore prices
(Indexed, Jan 1 2017 = 100)
Jul- 16 Jul- 15 Jan- 16 Jan- 15 Jul- 17 Jan- 17 Sep- 17 Mar- 17 Feb- 17 Oct- 17 Jan- 17 Apr- 17 Nov- 17 May- 17 Jun- 17 Jul- 17 Aug- 17 Jul- 17
Source : Platts, Kumba Market Intelligence (MI)
20
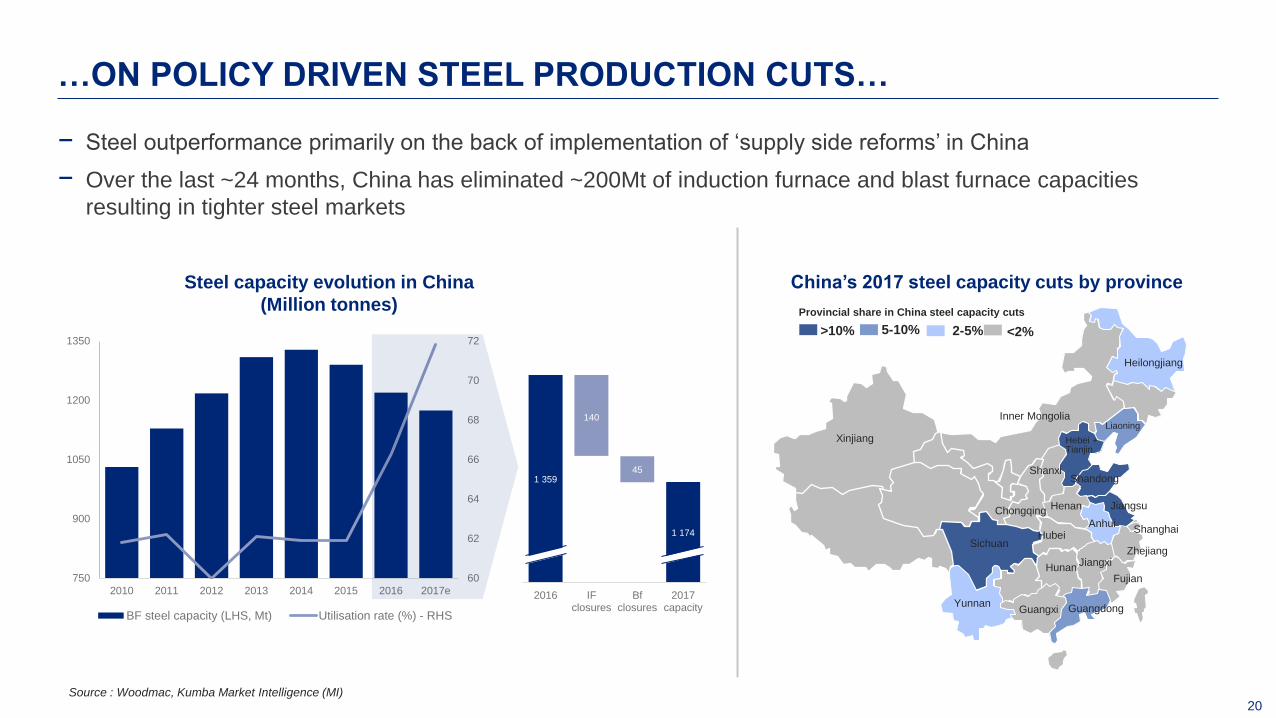
− Steel outperformance primarily on the back of implementation of ‘supply side reforms’ in China
− Over the last ~24 months, China has eliminated ~200Mt of induction furnace and blast furnace capacities
resulting in tighter steel markets
60
62
64
66
68
70
72
2010 2011 2012 2013 2014 2015 2016 2017e
750
900
1050
1200
1350
BF steel capacity (LHS, Mt) Utilisation rate (%) - RHS
1 359
140
45
1 174
2016 IFclosures
Bfclosures
2017capacity
…ON POLICY DRIVEN STEEL PRODUCTION CUTS…
Steel capacity evolution in China
(Million tonnes)
China’s 2017 steel capacity cuts by province
Shanxi Shandong
Jiangsu
Liaoning
Hebei + Tianjin
Yunnan
Zhejiang
Xinjiang
Sichuan
Shanghai
Jiangxi
Inner Mongolia
Hunan
Hubei
Henan
Guangxi Guangdong
Fujian
Anhui
>10%
Provincial share in China steel capacity cuts
5-10%
2-5%
Heilongjiang
Chongqing
<2%
Source : Woodmac, Kumba Market Intelligence (MI)
21
Jun- 13 Jan- 13 May- 17 Jul- 16 Dec- 16 Sep- 14 Aug- 15 Mar- 15 Apr- 14 Nov- 13 Feb- 16
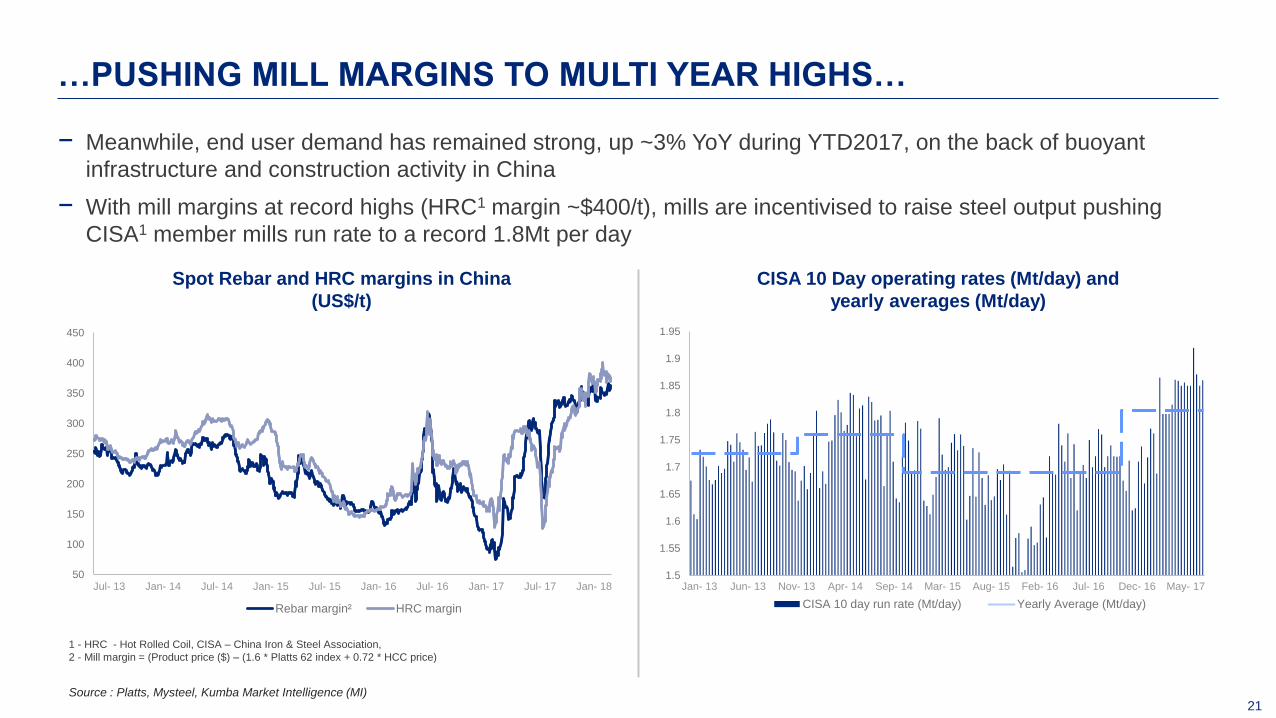
− Meanwhile, end user demand has remained strong, up ~3% YoY during YTD2017, on the back of buoyant
infrastructure and construction activity in China
− With mill margins at record highs (HRC1 margin ~$400/t), mills are incentivised to raise steel output pushing
CISA1 member mills run rate to a record 1.8Mt per day
50
100
150
200
250
300
350
400
450
Rebar margin² HRC margin
1.5
1.55
1.6
1.65
1.7
1.75
1.8
1.85
1.9
1.95
CISA 10 day run rate (Mt/day) Yearly Average (Mt/day)
…PUSHING MILL MARGINS TO MULTI YEAR HIGHS…
Spot Rebar and HRC margins in China
(US$/t)
CISA 10 Day operating rates (Mt/day) and
yearly averages (Mt/day)
Jan- 15 Jul- 13 Jul- 16 Jan- 17 Jan- 18 Jan- 14 Jan- 16 Jul- 14 Jul- 17 Jul- 15
Source : Platts, Mysteel, Kumba Market Intelligence (MI)
1 - HRC - Hot Rolled Coil, CISA – China Iron & Steel Association,
2 - Mill margin = (Product price ($) – (1.6 * Platts 62 index + 0.72 * HCC price)
22
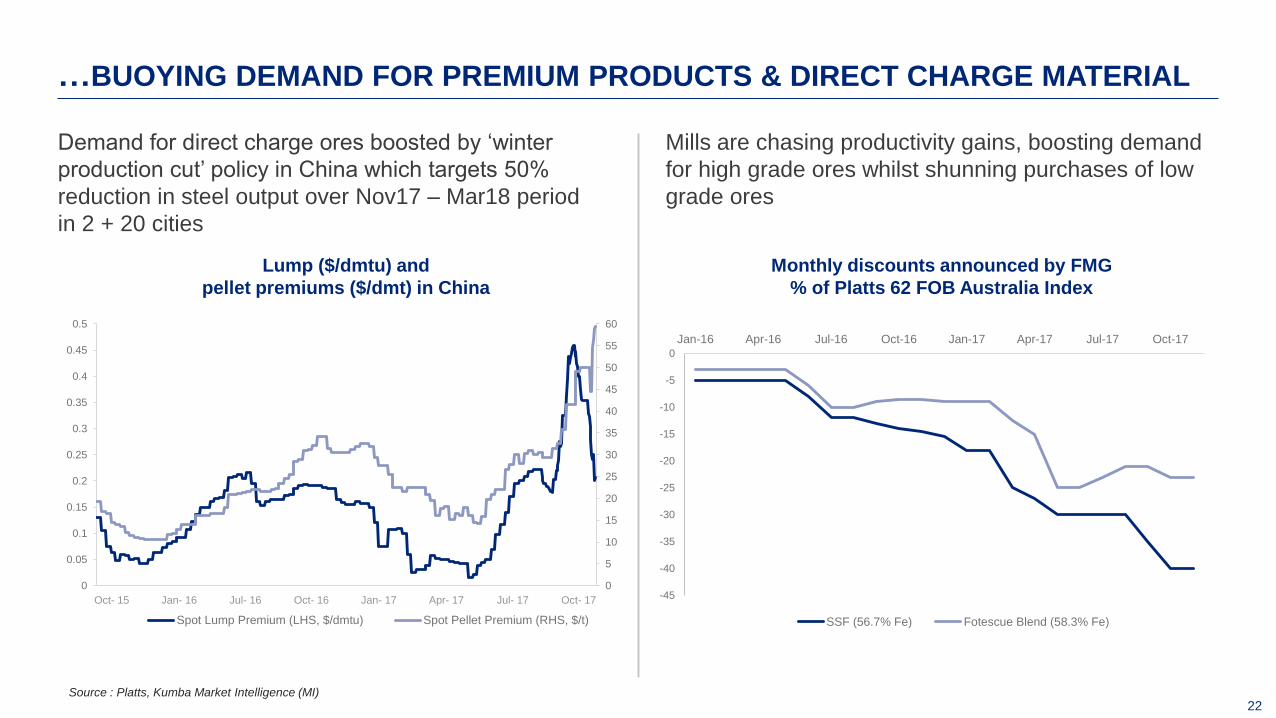
Demand for direct charge ores boosted by ‘winter
production cut’ policy in China which targets 50%
reduction in steel output over Nov17 – Mar18 period
in 2 + 20 cities
-45
-40
-35
-30
-25
-20
-15
-10
-5
0
Jan-16 Apr-16 Jul-16 Oct-16 Jan-17 Apr-17 Jul-17 Oct-17
SSF (56.7% Fe) Fotescue Blend (58.3% Fe)
…BUOYING DEMAND FOR PREMIUM PRODUCTS & DIRECT CHARGE MATERIAL
Lump ($/dmtu) and
pellet premiums ($/dmt) in China
Monthly discounts announced by FMG
% of Platts 62 FOB Australia Index
Source : Platts, Kumba Market Intelligence (MI)
Mills are chasing productivity gains, boosting demand
for high grade ores whilst shunning purchases of low
grade ores
0
5
10
15
20
25
30
35
40
45
50
55
60
0
0.05
0.1
0.15
0.2
0.25
0.3
0.35
0.4
0.45
0.5
Spot Lump Premium (LHS, $/dmtu) Spot Pellet Premium (RHS, $/t)
Oct- 15 Oct- 16 Jul- 16 Jan- 16 Jul- 17 Jan- 17 Oct- 17 Apr- 17

23 Source : Thurslestone, Kumba Market Intelligence (MI)
− Australian shipments from majors (Rio, BHP & FMG) and Roy Hill expected to jump by 5.2% QoQ to add ~40Mt
annualised iron ore supply in 4Q17
− Brazilian YTD shipments have been largely flat YoY and Vale’s 19Mtpa reduction of high silica ores in Q3
suggest it may end 2017 on lower end of its 360-380Mt guidance
317 314 341 360
254 285 251
265
160 180 172
181
0
100
200
300
400
500
600
700
800
900
1Q17 2Q17 3Q17 4Q17e
Rio Tinto BHP FMG Roy Hill
765
35 32
811 858 815
51 52
+5.2%
IRON ORE SUPPLY, HOWEVER, GIVES US A REASON FOR CAUTION…
Expected iron ore shipments from BHP, Rio
Tinto, FMG and Roy Hill in 4Q17 (Mtpa)
Brazilian iron ore shipments, YTD run rates
(Mtpa)
270
300
330
360
390
420
Q1 Q2 Q3 Q4
2014 2015 2016 2017
24
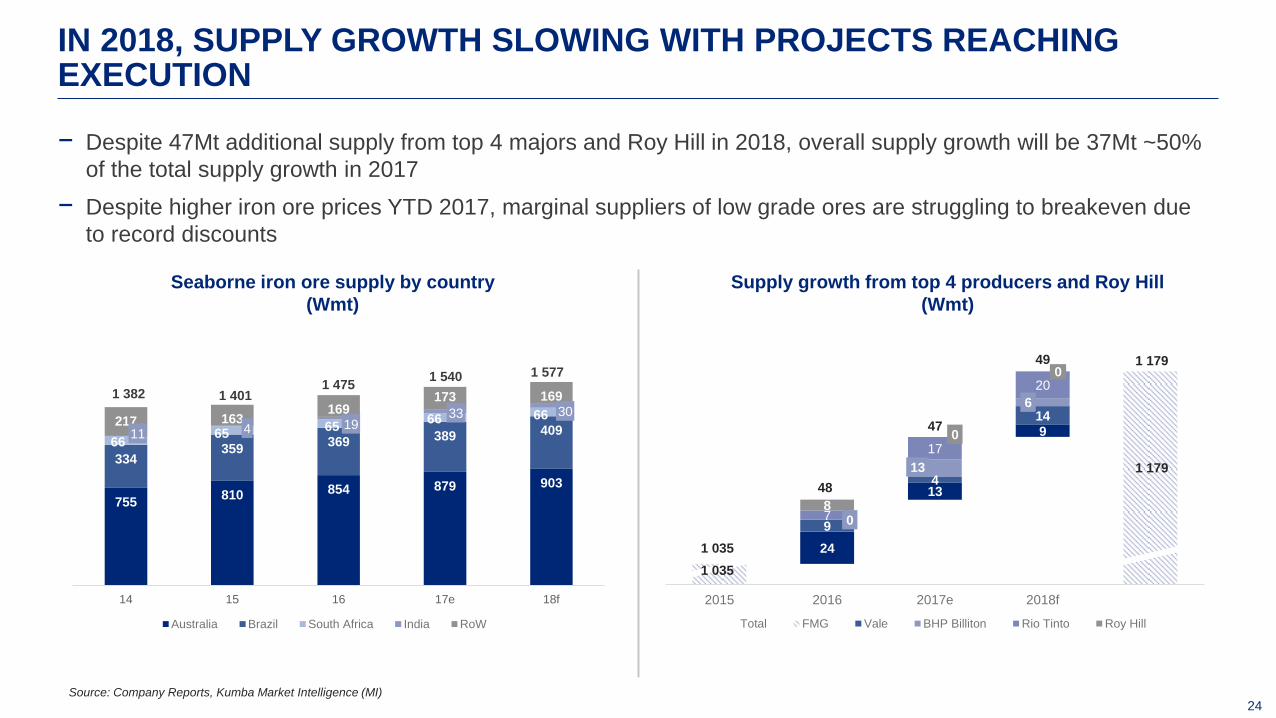
− Despite 47Mt additional supply from top 4 majors and Roy Hill in 2018, overall supply growth will be 37Mt ~50%
of the total supply growth in 2017
− Despite higher iron ore prices YTD 2017, marginal suppliers of low grade ores are struggling to breakeven due
to record discounts
IN 2018, SUPPLY GROWTH SLOWING WITH PROJECTS REACHING EXECUTION
Seaborne iron ore supply by country
(Wmt)
Supply growth from top 4 producers and Roy Hill
(Wmt)
Source: Company Reports, Kumba Market Intelligence (MI)
755 810 854 879 903
334 359
369 389 409 66
65 65
66 66 217 163
169 173 169
14 15 16 17e 18f
Australia Brazil South Africa India RoW
1 382 1 475
1 577 1 540
61 1 401
4
30 33 19
11
24
13
9
9
4
14
0
13
6
7
17
20
8
0
2015 2016 2017e 2018f
Total FMG Vale BHP Billiton Rio Tinto Roy Hill
1 179
48
1 035
49
47
1 179
0
1 035
25
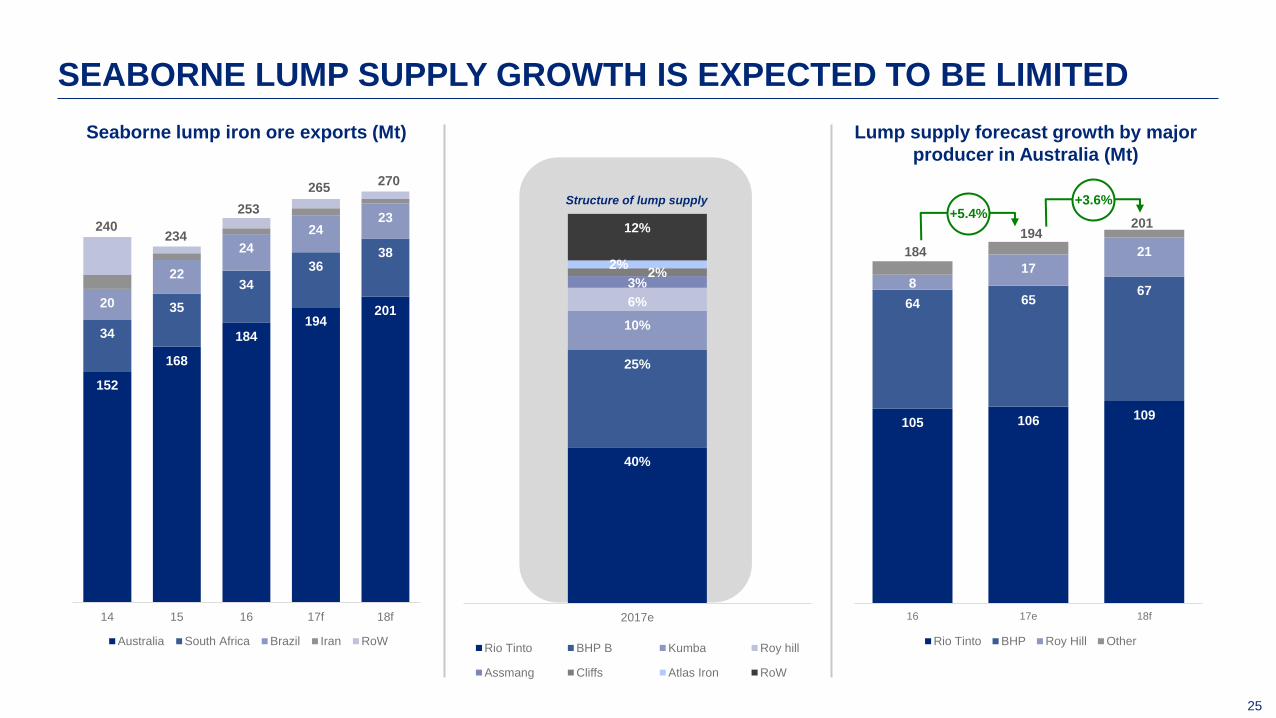
SEABORNE LUMP SUPPLY GROWTH IS EXPECTED TO BE LIMITED
152
168
184 194
201
34
35
34
36 38
20
22
24
24 23
14 15 16 17f 18f
Australia South Africa Brazil Iran RoW
270
253
265
234 240
40%
25%
10%
6%
3% 2%
2%
12%
2017e
Rio Tinto BHP B Kumba Roy hill
Assmang Cliffs Atlas Iron RoW
105 106 109
64 65 67
8 17
21
16 17e 18f
Rio Tinto BHP Roy Hill Other
+3.6% +5.4%
194
184
201
Seaborne lump iron ore exports (Mt) Lump supply forecast growth by major
producer in Australia (Mt)
Structure of lump supply

KOLOMELA
MASALA MUTANGWA
27
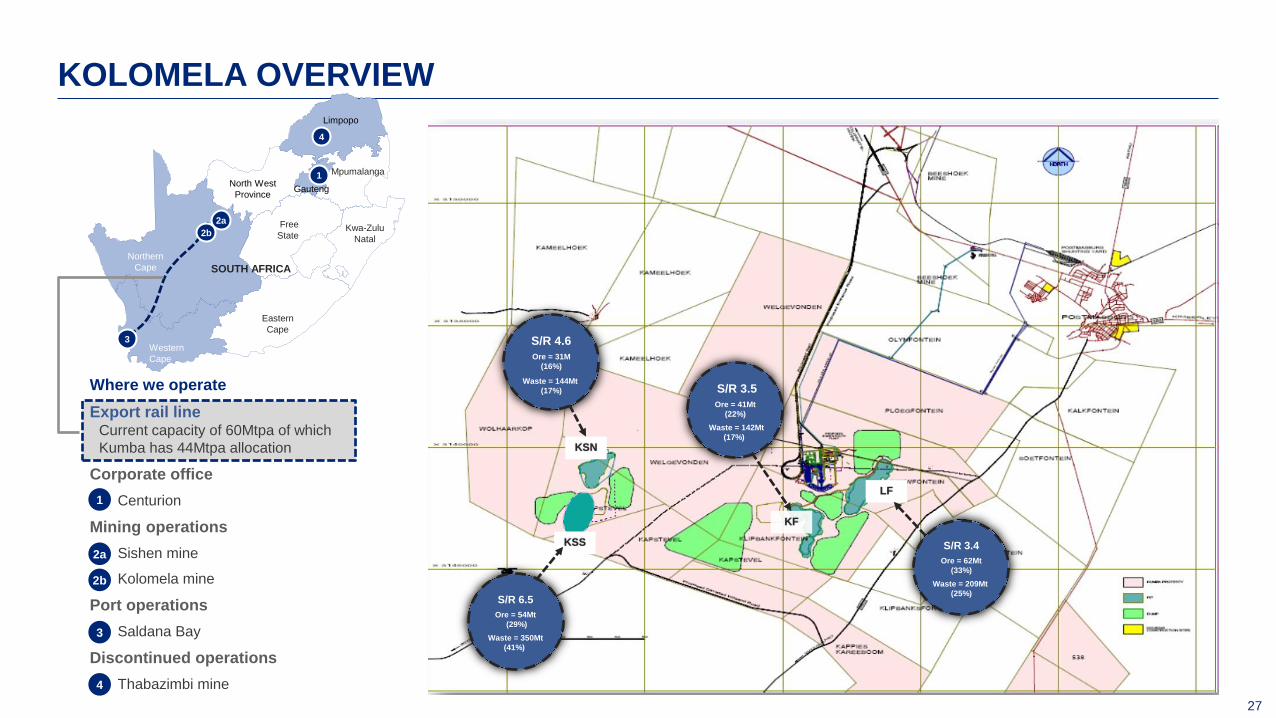
KOLOMELA OVERVIEW
Where we operate
Export rail line Current capacity of 60Mtpa of which
Kumba has 44Mtpa allocation
Corporate office
− Centurion
Mining operations
− Sishen mine
− Kolomela mine
Port operations
− Saldana Bay
Discontinued operations
− Thabazimbi mine
S/R 3.4
Ore = 62Mt
(33%)
Waste = 209Mt
(25%)
S/R 3.5
Ore = 41Mt
(22%)
Waste = 142Mt
(17%)
S/R 4.6
Ore = 31M
(16%)
Waste = 144Mt
(17%)
S/R 6.5
Ore = 54Mt
(29%)
Waste = 350Mt
(41%)
KSS
LF
KF
KSN
North
West
Northern
Cape
Eastern
Cape
Western
Cape
Free
State
Limpopo
Mpumalanga
North West
Province
Free
State Kwa-Zulu
Natal
Gauteng
1
SOUTH AFRICA
Eastern
Cape
4
2a
3
2b
1
2a
2b
3
4
28
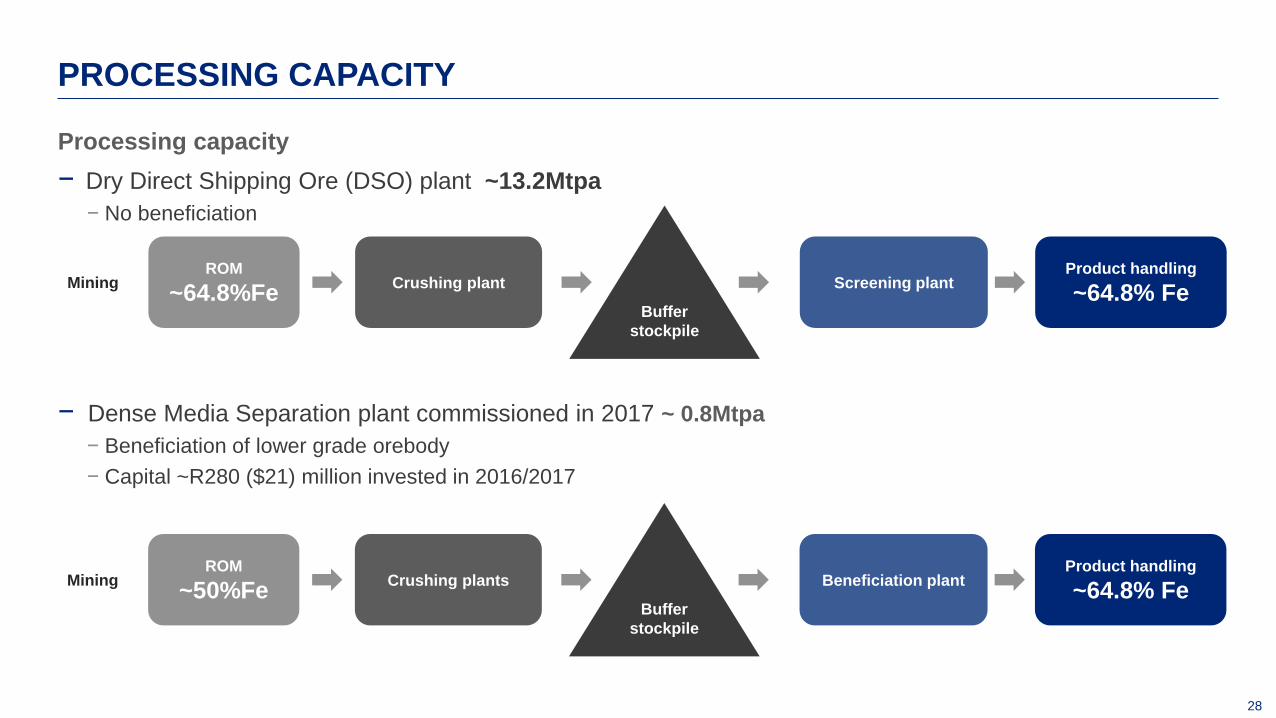
− Dense Media Separation plant commissioned in 2017 ~ 0.8Mtpa
− Beneficiation of lower grade orebody
− Capital ~R280 ($21) million invested in 2016/2017
Processing capacity
− Dry Direct Shipping Ore (DSO) plant ~13.2Mtpa
− No beneficiation
PROCESSING CAPACITY
ROM
~64.8%Fe Crushing plant
Product handling
~64.8% Fe Screening plant
Buffer
stockpile
Mining
ROM
~50%Fe Crushing plants
Product handling
~64.8% Fe Beneficiation plant
Buffer
stockpile
Mining
29
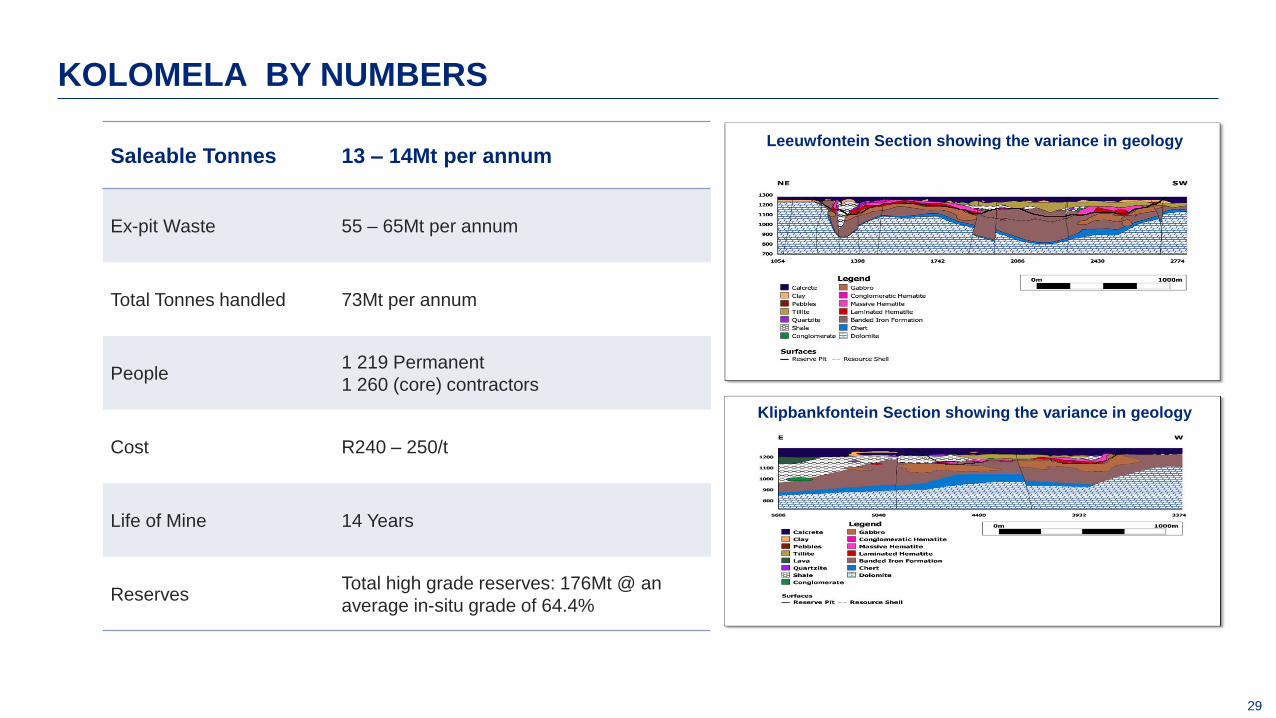
KOLOMELA BY NUMBERS
Saleable Tonnes 13 – 14Mt per annum
Ex-pit Waste 55 – 65Mt per annum
Total Tonnes handled 73Mt per annum
People 1 219 Permanent
1 260 (core) contractors
Cost R240 – 250/t
Life of Mine 14 Years
Reserves Total high grade reserves: 176Mt @ an
average in-situ grade of 64.4%
Leeuwfontein Section showing the variance in geology
Klipbankfontein Section showing the variance in geology
30
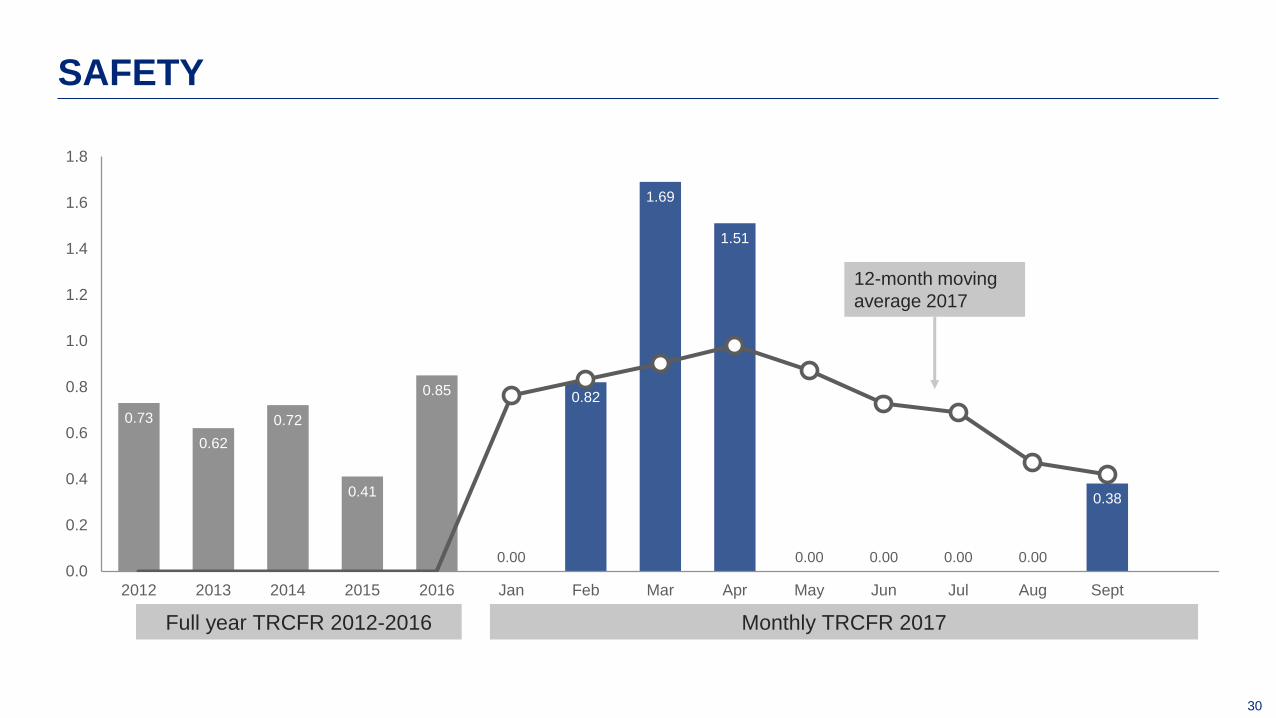
0.73
0.62
0.72
0.41
0.85
0.00
0.82
1.69
1.51
0.00 0.00 0.00 0.00
0.38
0.0
0.2
0.4
0.6
0.8
1.0
1.2
1.4
1.6
1.8
2012 2013 2014 2015 2016 Jan Feb Mar Apr May Jun Jul Aug Sept
12-month moving
average 2017
Full year TRCFR 2012-2016 Monthly TRCFR 2017
SAFETY
31
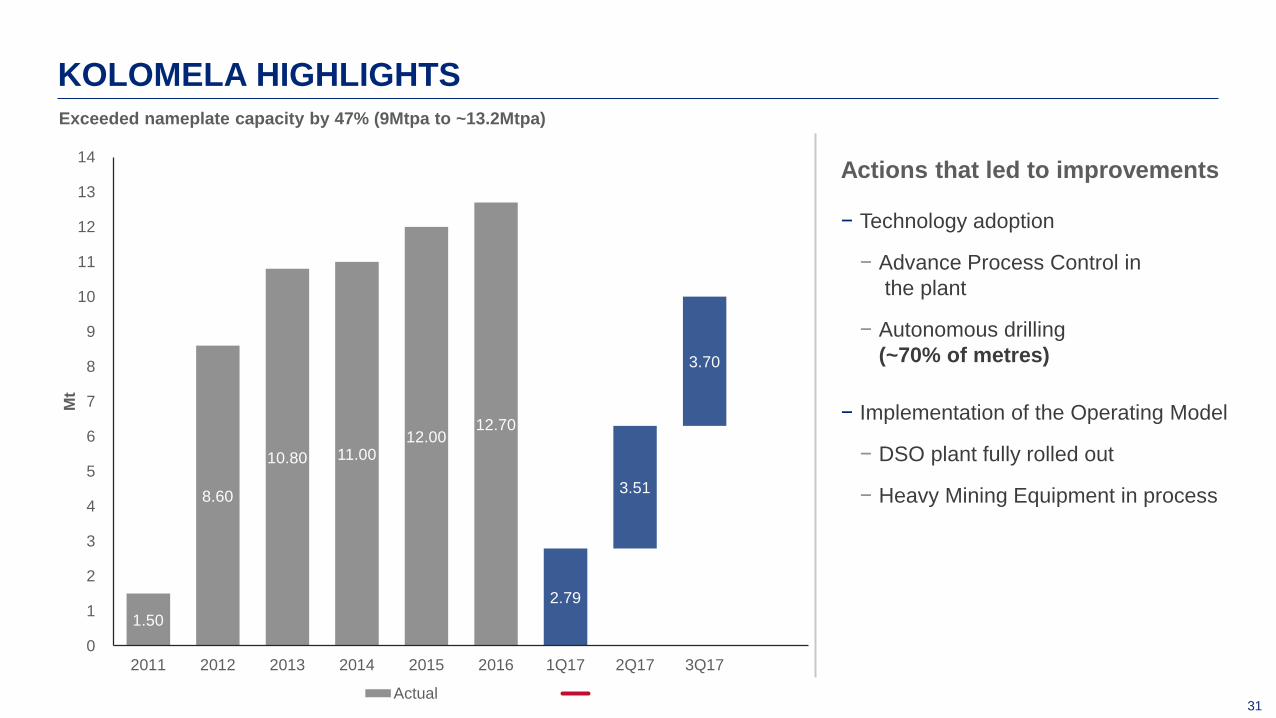
1.50
8.60
10.80 11.00 12.00
12.70
2.79
3.51
3.70
0
1
2
3
4
5
6
7
8
9
10
11
12
13
14
2011 2012 2013 2014 2015 2016 1Q17 2Q17 3Q17
Mt
Actual
KOLOMELA HIGHLIGHTS
Actions that led to improvements
− Technology adoption
− Advance Process Control in
the plant
− Autonomous drilling
(~70% of metres)
− Implementation of the Operating Model
− DSO plant fully rolled out
− Heavy Mining Equipment in process
Exceeded nameplate capacity by 47% (9Mtpa to ~13.2Mtpa)

32
OPTIMISATION TO INCREASE PRODUCTION TO >14Mtpa
19.43 19.60
17.37
21.00 21.92
2015 2016 1Q17 2Q17 3Q17
Hr
/ d
ay
DSO Plant Improvement
+12.8%
Focus area to increase production >14Mpta
− DSO plant improvement
− Ramp up of DMS plant
− Load and haul efficiency improvement
− Implementation of the Operating Model
Actions for DSO plant
− Improved direct operating hours
− Technology efficiency improvements
− Completion of implementation of Operating Model
Actions for DMS plant
− Improved direct operating hours for crushing and
beneficiation plant
− Production rates (t/h) for beneficiation plant
33
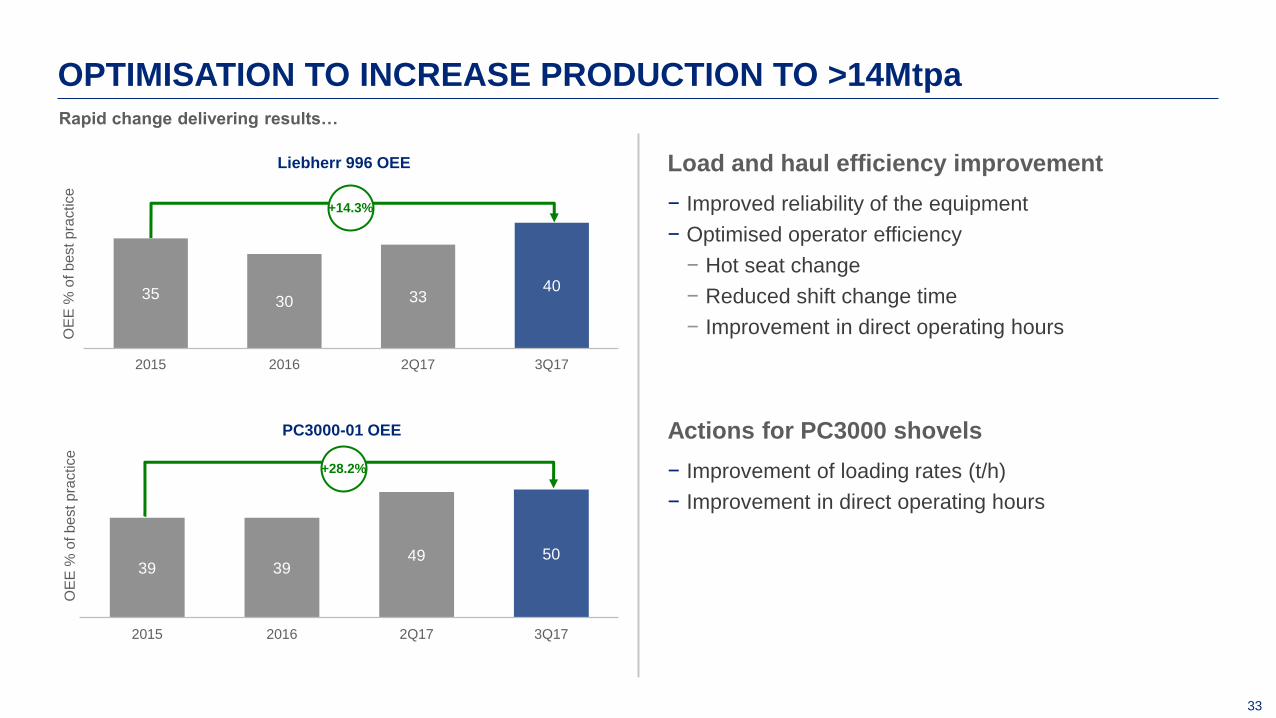
OPTIMISATION TO INCREASE PRODUCTION TO >14Mtpa
35 30 33
40
2015 2016 2Q17 3Q17
OE
E %
of b
est p
ractice
Liebherr 996 OEE
+14.3%
Load and haul efficiency improvement
− Improved reliability of the equipment
− Optimised operator efficiency
− Hot seat change
− Reduced shift change time
− Improvement in direct operating hours
39 39 49 50
2015 2016 2Q17 3Q17
OE
E %
of b
est p
ractice
PC3000-01 OEE
+28.2%
Rapid change delivering results…
Actions for PC3000 shovels
− Improvement of loading rates (t/h)
− Improvement in direct operating hours

34
Production/Services Strategy
Kolomela 2016 2017 2018 2019
J A S O N D J F M A M J J A S O N D J F M A M J J A S O N D J F M A M J J A S O N D 1Q 2Q 3Q 4Q
1 Plant maintenance & operations
2 Heavy mining equipment
3 Mining
4 Engineering services and Iifrastructure
5 Grade control lab
6 Supply chain OM support
7 Operational planning
8 Support services (SHE,FIN,HR,SC,SD)
OPERATING MODEL IMPLEMENTATION SCHEDULE
SAP OM Go-live Training On boarding Stabilisation WSS Integrated Schedule
SISHEN
MAPI MOBWANO
36
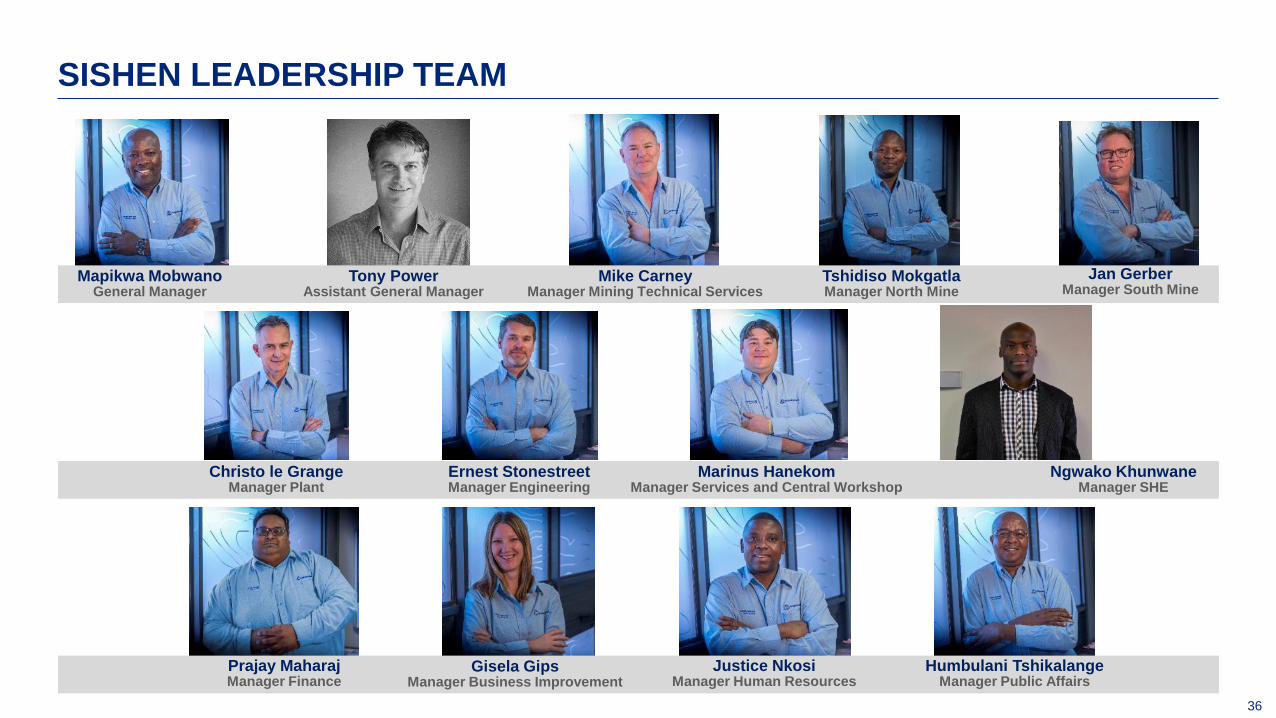
Ernest Stonestreet Manager Engineering
Christo le Grange Manager Plant
Tony Power Assistant General Manager
SISHEN LEADERSHIP TEAM
Mapikwa Mobwano General Manager
Humbulani Tshikalange Manager Public Affairs
Justice Nkosi Manager Human Resources
Prajay Maharaj Manager Finance
Jan Gerber Manager South Mine
Tshidiso Mokgatla Manager North Mine
Gisela Gips Manager Business Improvement
Mike Carney Manager Mining Technical Services
Ngwako Khunwane Manager SHE
Marinus Hanekom Manager Services and Central Workshop

37
− High quality mine
− Premium products
− Competitive on margin basis
− 16 year LoM, options exist to extend
− Focus is on improving operational
productivity and lowering cost position
SISHEN OVERVIEW
Sishen overview
Ore reserves 540Mt
Life of mine 16 years
Annual Waste Stripping 155 – 165Mt
Annual production 2017 29 – 30Mt
Employees & contractors 4 000
1 400
Where we operate
Export rail line Current capacity of 60Mtpa of which
Kumba has 44Mtpa allocation
Corporate office
Centurion
Mining operations
Sishen mine
Kolomela mine
Port operations
Saldana Bay
Discontinued operations
Thabazimbi mine
North
West
Northern
Cape
Eastern
Cape
Western
Cape
Free
State
Limpopo
Mpumalanga
North West
Province
Free
State Kwa-Zulu
Natal
Gauteng
1
SOUTH AFRICA
Eastern
Cape
4
2a
3
2b
1
2a
2b
3
4
38
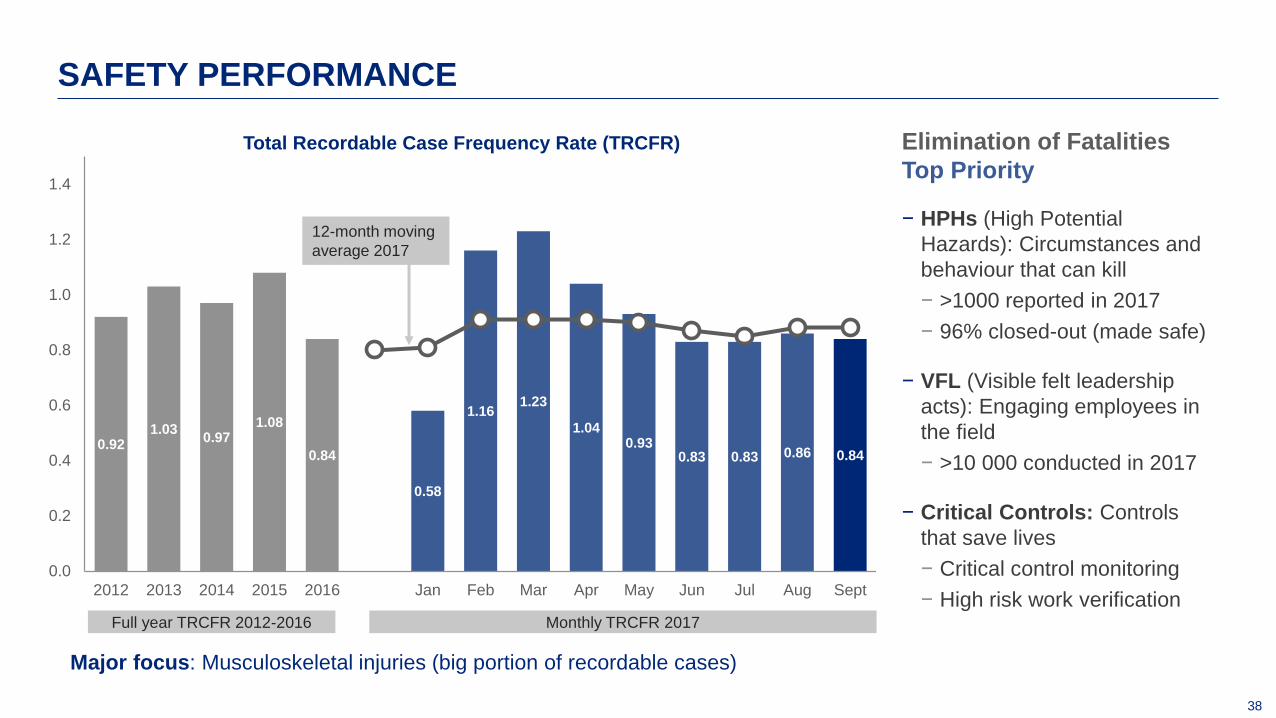
0.92 1.03
0.97 1.08
0.84
0.58
1.16 1.23
1.04 0.93
0.83 0.83 0.86 0.84
0.0
0.2
0.4
0.6
0.8
1.0
1.2
1.4
2012 2013 2014 2015 2016 Jan Feb Mar Apr May Jun Jul Aug Sept
Total Recordable Case Frequency Rate (TRCFR)
12-month moving
average 2017
Full year TRCFR 2012-2016 Monthly TRCFR 2017
SAFETY PERFORMANCE
Elimination of Fatalities
Top Priority
− HPHs (High Potential
Hazards): Circumstances and
behaviour that can kill
− >1000 reported in 2017
− 96% closed-out (made safe)
− VFL (Visible felt leadership
acts): Engaging employees in
the field
− >10 000 conducted in 2017
− Critical Controls: Controls
that save lives
− Critical control monitoring
− High risk work verification
Major focus: Musculoskeletal injuries (big portion of recordable cases)
39
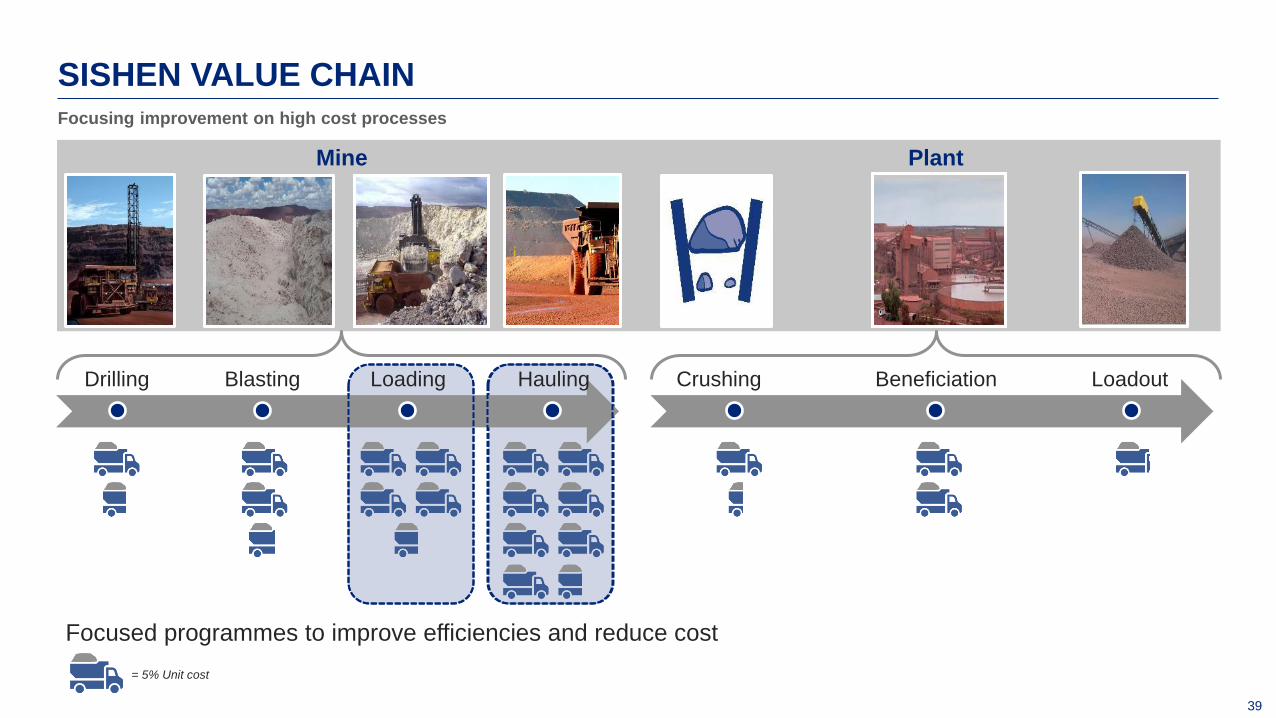
SISHEN VALUE CHAIN
= 5% Unit cost
Plant Mine
Focusing improvement on high cost processes
Drilling Blasting Loading Hauling Crushing Beneficiation Loadout
Focused programmes to improve efficiencies and reduce cost

40
COST CURVE High strip ratio and ore body positions Kumba in the 4th quartile
41
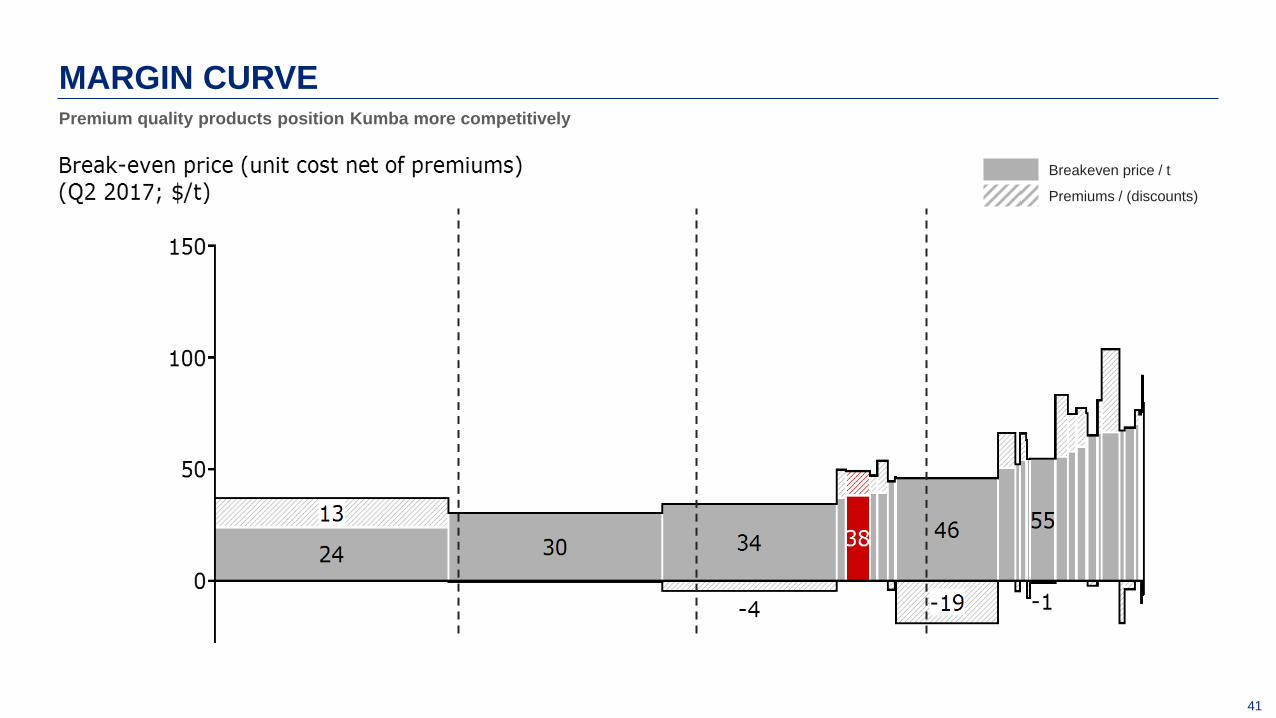
MARGIN CURVE Premium quality products position Kumba more competitively
Breakeven price / t
Premiums / (discounts)
42
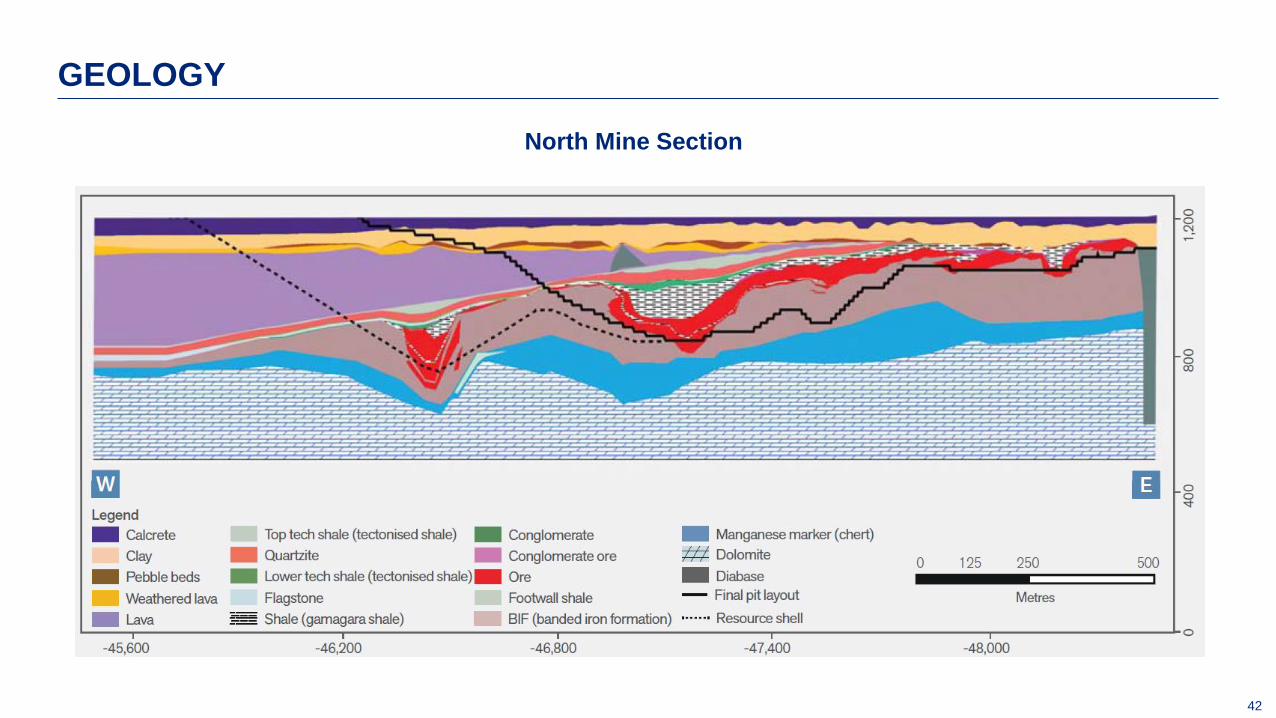
North Mine Section
GEOLOGY
43
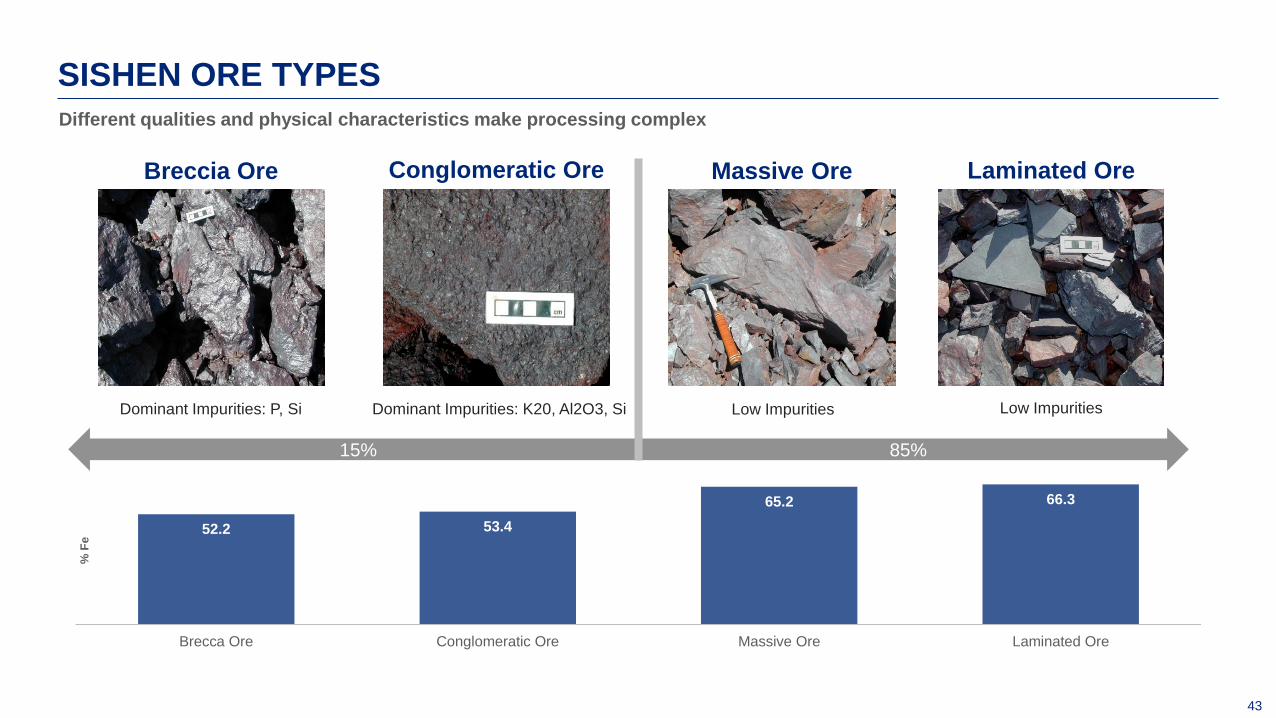
SISHEN ORE TYPES
Different qualities and physical characteristics make processing complex
Breccia Ore Conglomeratic Ore Massive Ore Laminated Ore
52.2 53.4
65.2 66.3
Brecca Ore Conglomeratic Ore Massive Ore Laminated Ore
% F
e
85% 15%
Dominant Impurities: K20, Al2O3, Si Dominant Impurities: P, Si Low Impurities Low Impurities
44
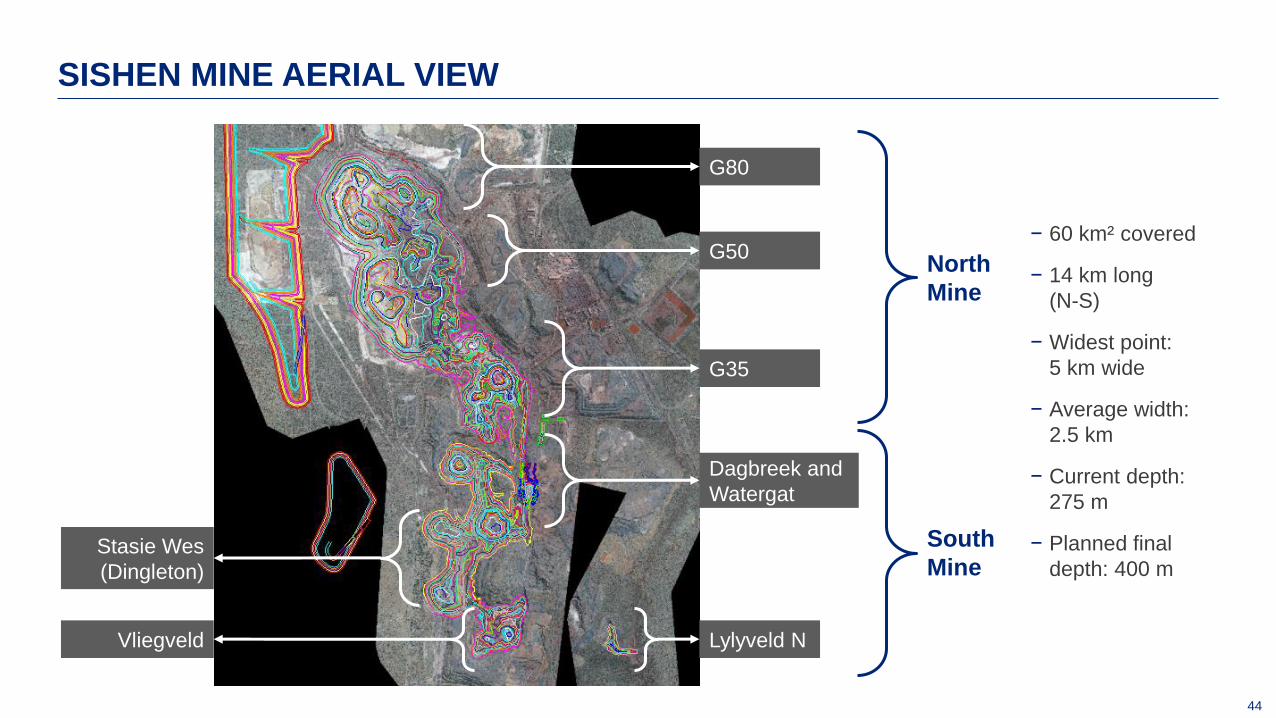
SISHEN MINE AERIAL VIEW
G80
G50
G35
Dagbreek and
Watergat
Vliegveld Lylyveld N
Stasie Wes
(Dingleton)
North
Mine
South
Mine
− 60 km² covered
− 14 km long
(N-S)
− Widest point:
5 km wide
− Average width:
2.5 km
− Current depth:
275 m
− Planned final
depth: 400 m
45
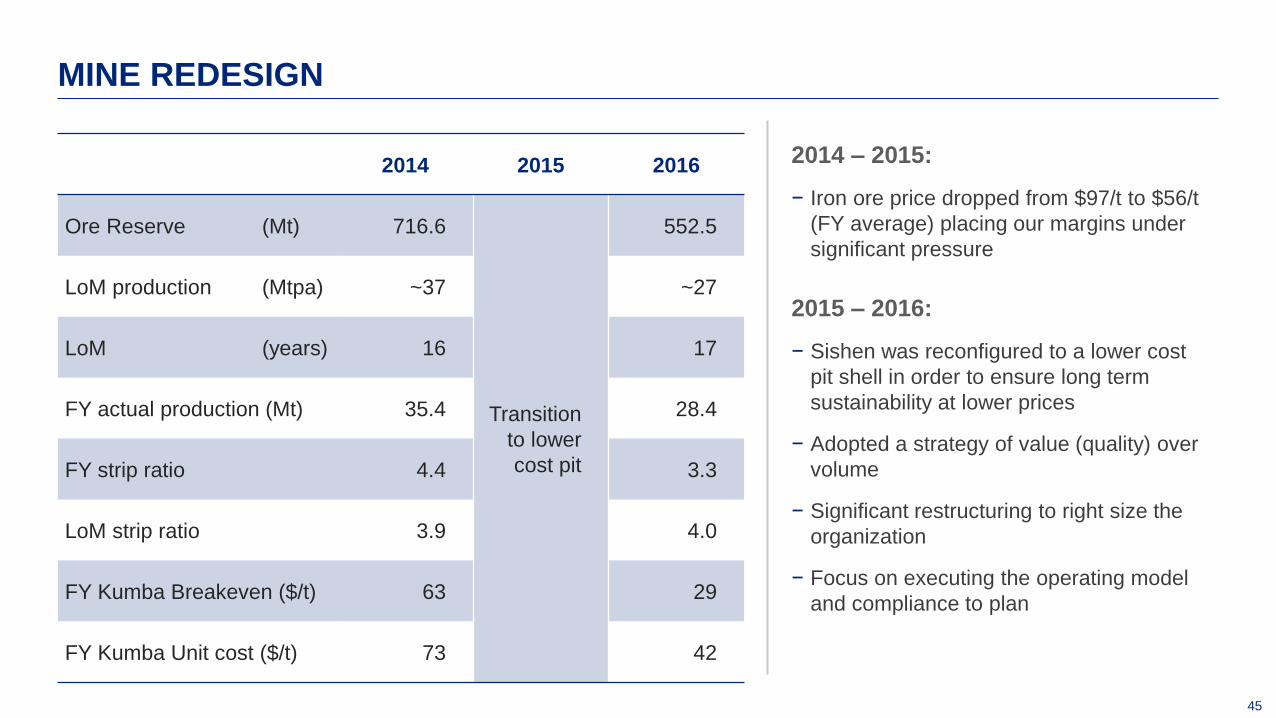
2014 2015 2016
Ore Reserve (Mt) 716.6
Transition
to lower
cost pit
552.5
LoM production (Mtpa) ~37 ~27
LoM (years) 16 17
FY actual production (Mt) 35.4 28.4
FY strip ratio 4.4 3.3
LoM strip ratio 3.9 4.0
FY Kumba Breakeven ($/t) 63 29
FY Kumba Unit cost ($/t) 73 42
MINE REDESIGN
2014 – 2015:
− Iron ore price dropped from $97/t to $56/t
(FY average) placing our margins under
significant pressure
2015 – 2016:
− Sishen was reconfigured to a lower cost
pit shell in order to ensure long term
sustainability at lower prices
− Adopted a strategy of value (quality) over
volume
− Significant restructuring to right size the
organization
− Focus on executing the operating model
and compliance to plan

46
MINE REDESIGN
Current Sishen pit boundary
2016 indicative LoM pit boundary
2015 LoM pit boundary (high
stripping areas to be excluded)
47
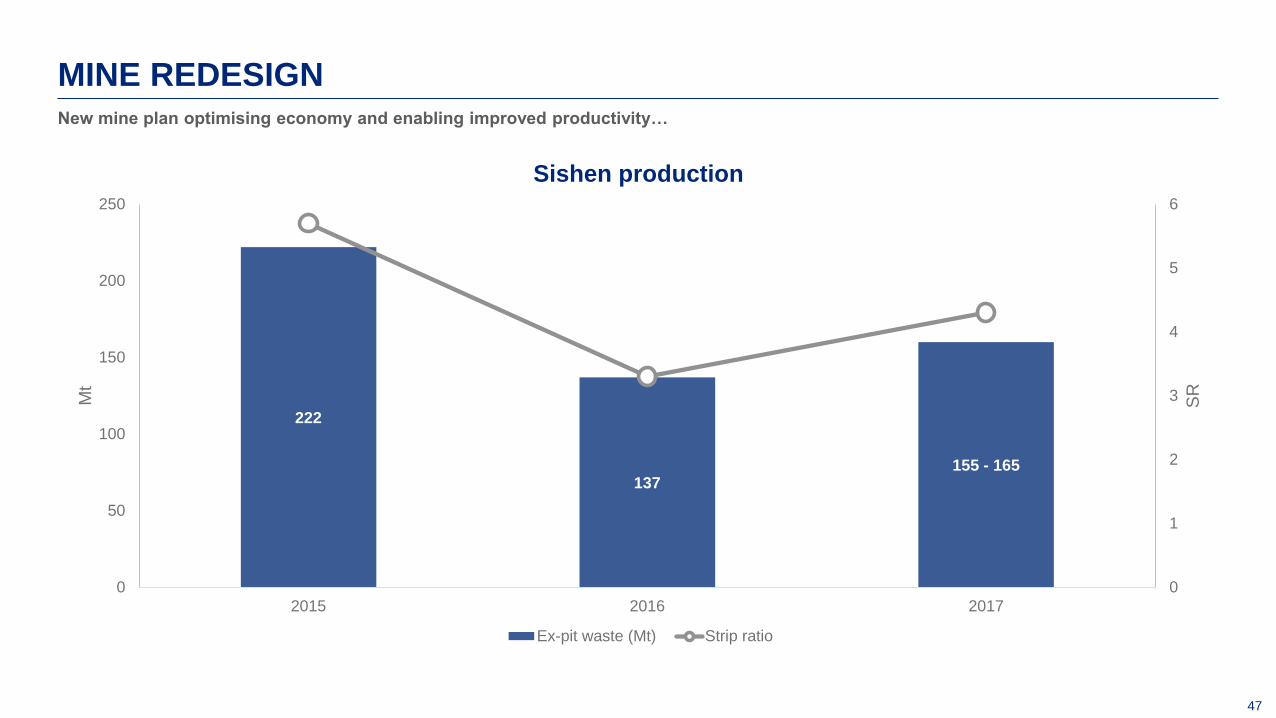
222
137 155 - 165
0
1
2
3
4
5
6
0
50
100
150
200
250
2015 2016 2017
SR
Mt
Sishen production
Ex-pit waste (Mt) Strip ratio
MINE REDESIGN New mine plan optimising economy and enabling improved productivity…
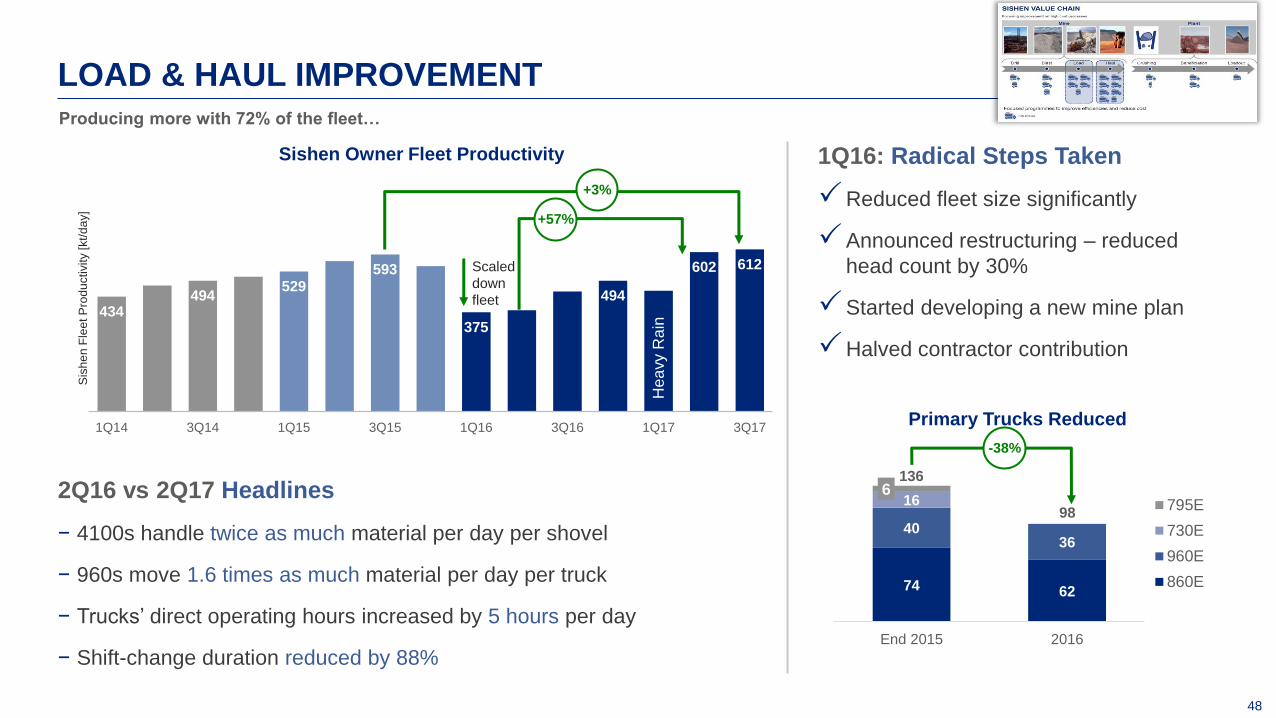
48
434 494
529 593
375
494
602 612
1Q14 3Q14 1Q15 3Q15 1Q16 3Q16 1Q17 3Q17
Sis
he
n F
lee
t P
rod
uctivity [kt/
da
y]
Sishen Owner Fleet Productivity
Hea
vy R
ain
1Q16: Radical Steps Taken
Reduced fleet size significantly
Announced restructuring – reduced
head count by 30%
Started developing a new mine plan
Halved contractor contribution
2Q16 vs 2Q17 Headlines
− 4100s handle twice as much material per day per shovel
− 960s move 1.6 times as much material per day per truck
− Trucks’ direct operating hours increased by 5 hours per day
− Shift-change duration reduced by 88%
+57%
+3%
Scaled
down
fleet
Producing more with 72% of the fleet…
LOAD & HAUL IMPROVEMENT
74 62
40 36
16 6
End 2015 2016
Primary Trucks Reduced
795E
730E
960E
860E
-38%
136
98
49
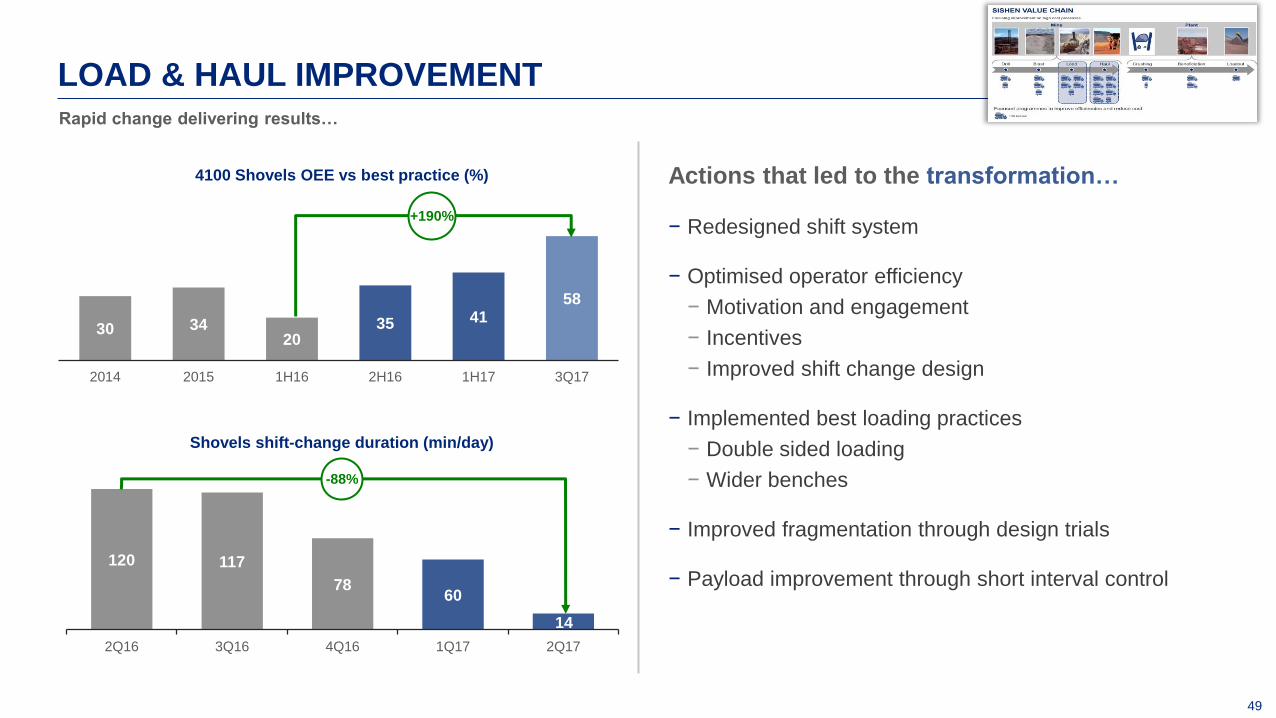
LOAD & HAUL IMPROVEMENT
30 34 20
35 41 58
2014 2015 1H16 2H16 1H17 3Q17
4100 Shovels OEE vs best practice (%)
+190%
Actions that led to the transformation…
− Redesigned shift system
− Optimised operator efficiency
− Motivation and engagement
− Incentives
− Improved shift change design
− Implemented best loading practices
− Double sided loading
− Wider benches
− Improved fragmentation through design trials
− Payload improvement through short interval control 120 117
78 60
14
2Q16 3Q16 4Q16 1Q17 2Q17
Shovels shift-change duration (min/day)
-88%
Rapid change delivering results…
50
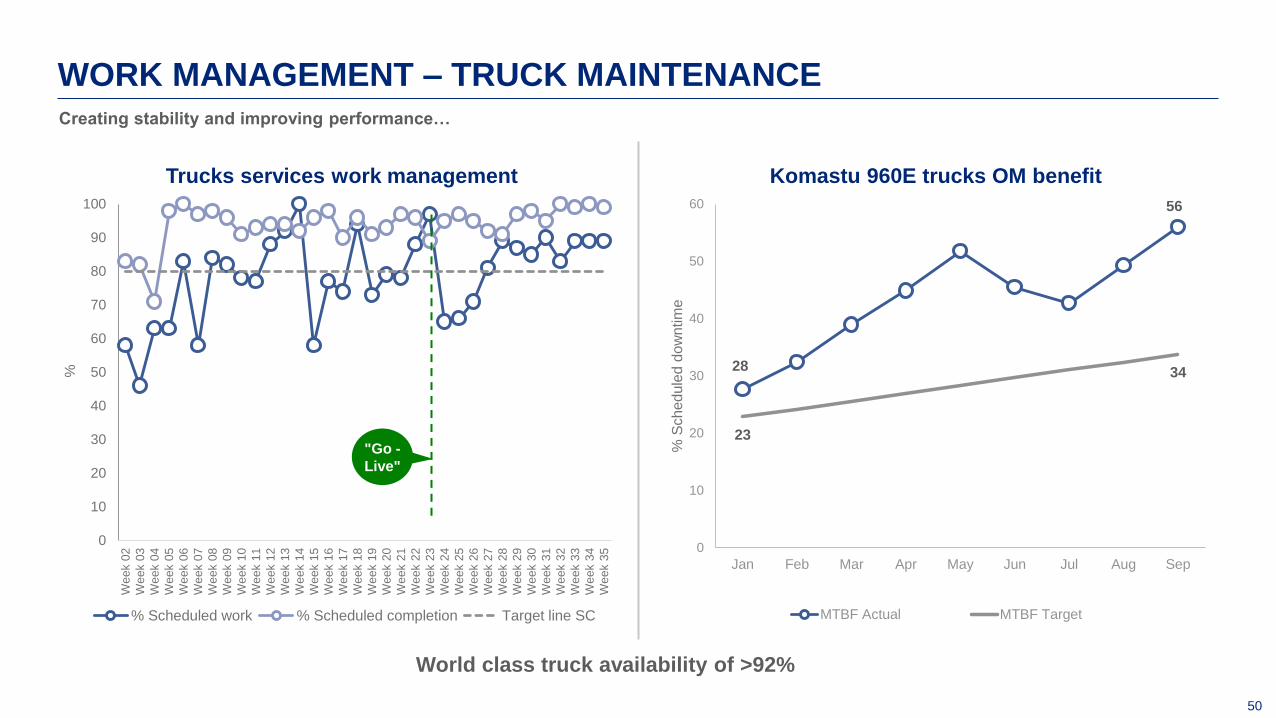
28
56
23
34
0
10
20
30
40
50
60
Jan Feb Mar Apr May Jun Jul Aug Sep
% S
ch
ed
ule
d d
ow
ntim
e
Komastu 960E trucks OM benefit
MTBF Actual MTBF Target
WORK MANAGEMENT – TRUCK MAINTENANCE
World class truck availability of >92%
Creating stability and improving performance…
0
10
20
30
40
50
60
70
80
90
100
We
ek 0
2
We
ek 0
3
We
ek 0
4
We
ek 0
5
We
ek 0
6
We
ek 0
7
We
ek 0
8
We
ek 0
9
We
ek 1
0
We
ek 1
1
We
ek 1
2
We
ek 1
3
We
ek 1
4
We
ek 1
5
We
ek 1
6
We
ek 1
7
We
ek 1
8
We
ek 1
9
We
ek 2
0
We
ek 2
1
We
ek 2
2
We
ek 2
3
We
ek 2
4
We
ek 2
5
We
ek 2
6
We
ek 2
7
We
ek 2
8
We
ek 2
9
We
ek 3
0
We
ek 3
1
We
ek 3
2
We
ek 3
3
We
ek 3
4
We
ek 3
5
%
Trucks services work management
% Scheduled work % Scheduled completion Target line SC
"Go -
Live"
51
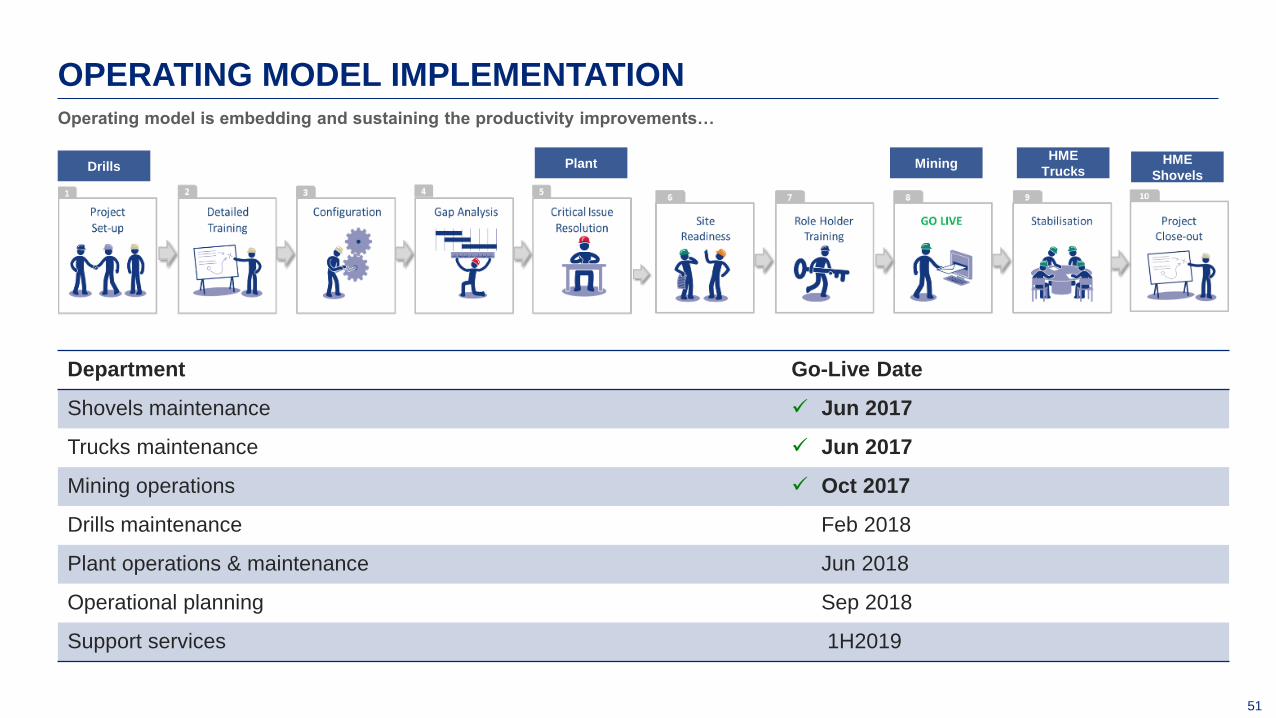
October 2017
Mining:
Go-Live on 31 October 2017
Plant: SAP OM Switched OM Plant
Role-holder training on SAP
OM
Jig Plant Operational Strategy
work captured
OPERATING MODEL IMPLEMENTATION Operating model is embedding and sustaining the productivity improvements…
Department Go-Live Date
Shovels maintenance Jun 2017
Trucks maintenance Jun 2017
Mining operations Oct 2017
Drills maintenance Feb 2018
Plant operations & maintenance Jun 2018
Operational planning Sep 2018
Support services 1H2019
Mining HME
Trucks Plant Drills
HME
Shovels
52
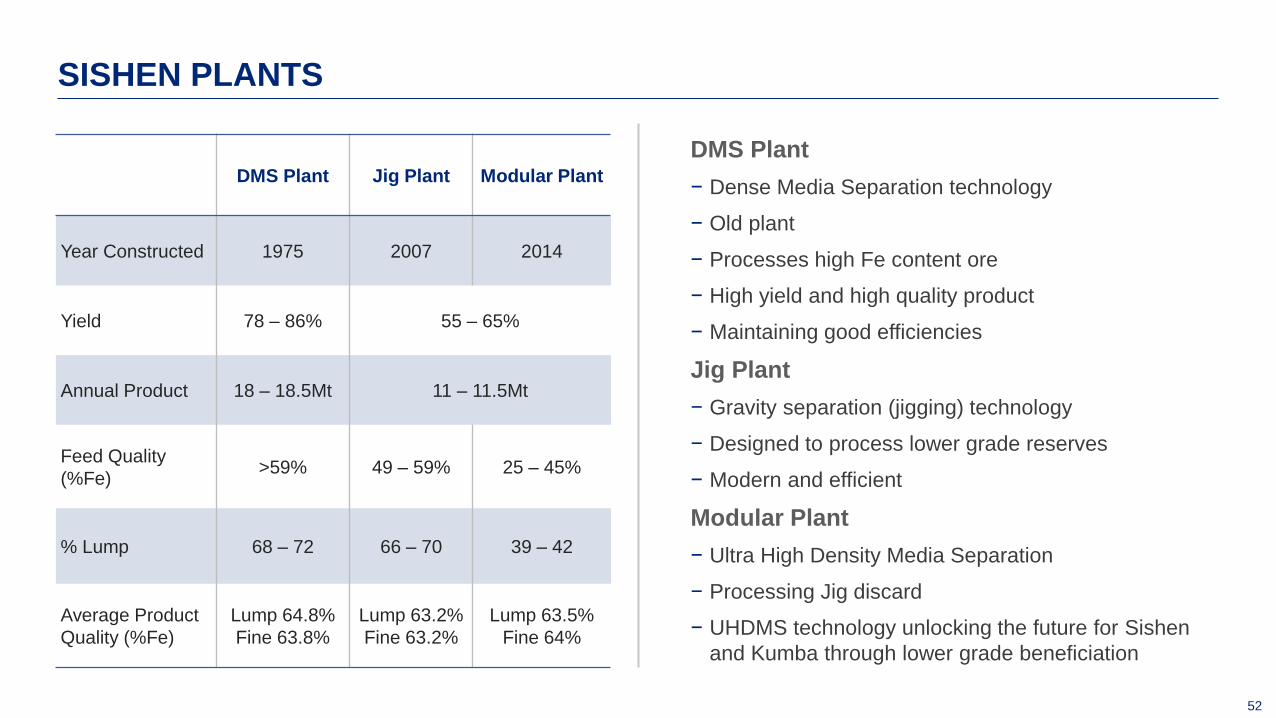
DMS Plant Jig Plant Modular Plant
Year Constructed 1975 2007 2014
Yield 78 – 86% 55 – 65%
Annual Product 18 – 18.5Mt 11 – 11.5Mt
Feed Quality
(%Fe) >59% 49 – 59% 25 – 45%
% Lump 68 – 72 66 – 70 39 – 42
Average Product
Quality (%Fe)
Lump 64.8%
Fine 63.8%
Lump 63.2%
Fine 63.2%
Lump 63.5%
Fine 64%
SISHEN PLANTS
DMS Plant
− Dense Media Separation technology
− Old plant
− Processes high Fe content ore
− High yield and high quality product
− Maintaining good efficiencies
Jig Plant
− Gravity separation (jigging) technology
− Designed to process lower grade reserves
− Modern and efficient
Modular Plant
− Ultra High Density Media Separation
− Processing Jig discard
− UHDMS technology unlocking the future for Sishen
and Kumba through lower grade beneficiation
53
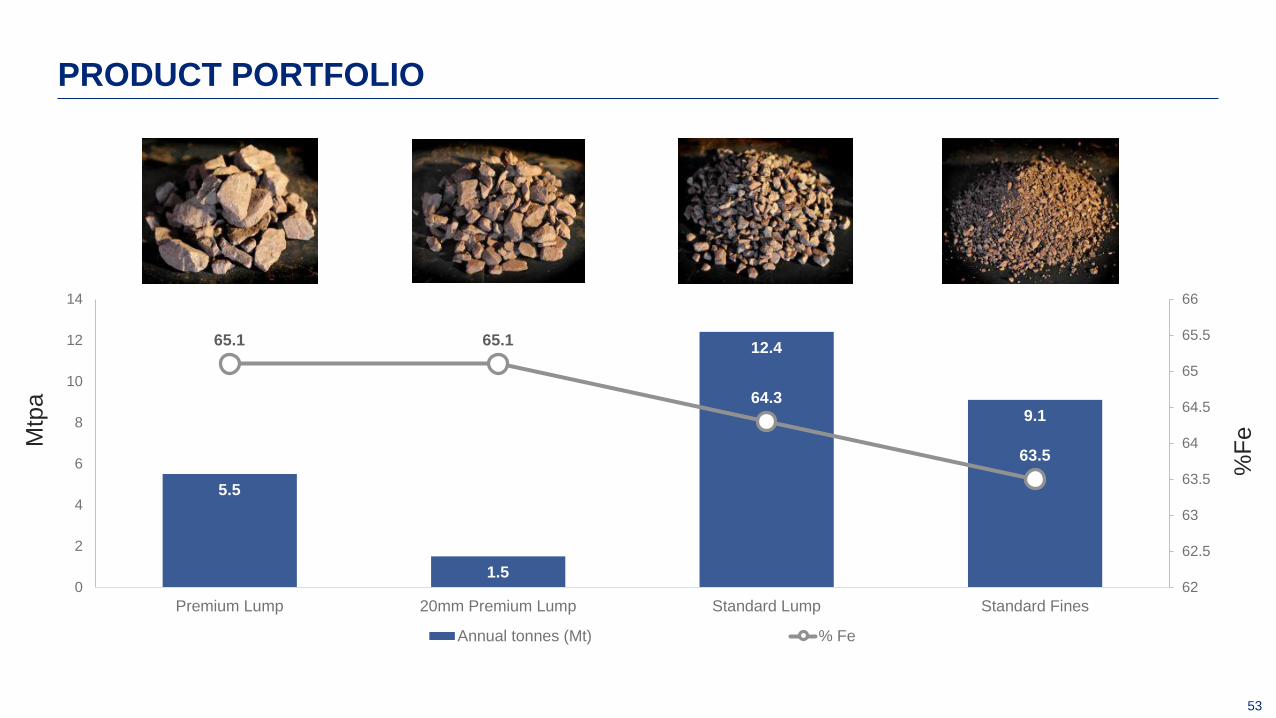
PRODUCT PORTFOLIO
5.5
1.5
12.4
9.1
65.1 65.1
64.3
63.5
62
62.5
63
63.5
64
64.5
65
65.5
66
0
2
4
6
8
10
12
14
Premium Lump 20mm Premium Lump Standard Lump Standard Fines
Annual tonnes (Mt) % Fe
Mtp
a
%F
e

54
Overview
− Provide access to >161Mt of ore as
per LoM plan
− Capex of R2.5bn
Objectives
− Relocate 517 households,
businesses and municipal
infrastructure
− Deproclaim town into mine town
− Decommission and demolish
infrastructure
Status
− 496 homes replaced
− Schools, clinic, Government
and municipal offices relocated
DINGLETON
55
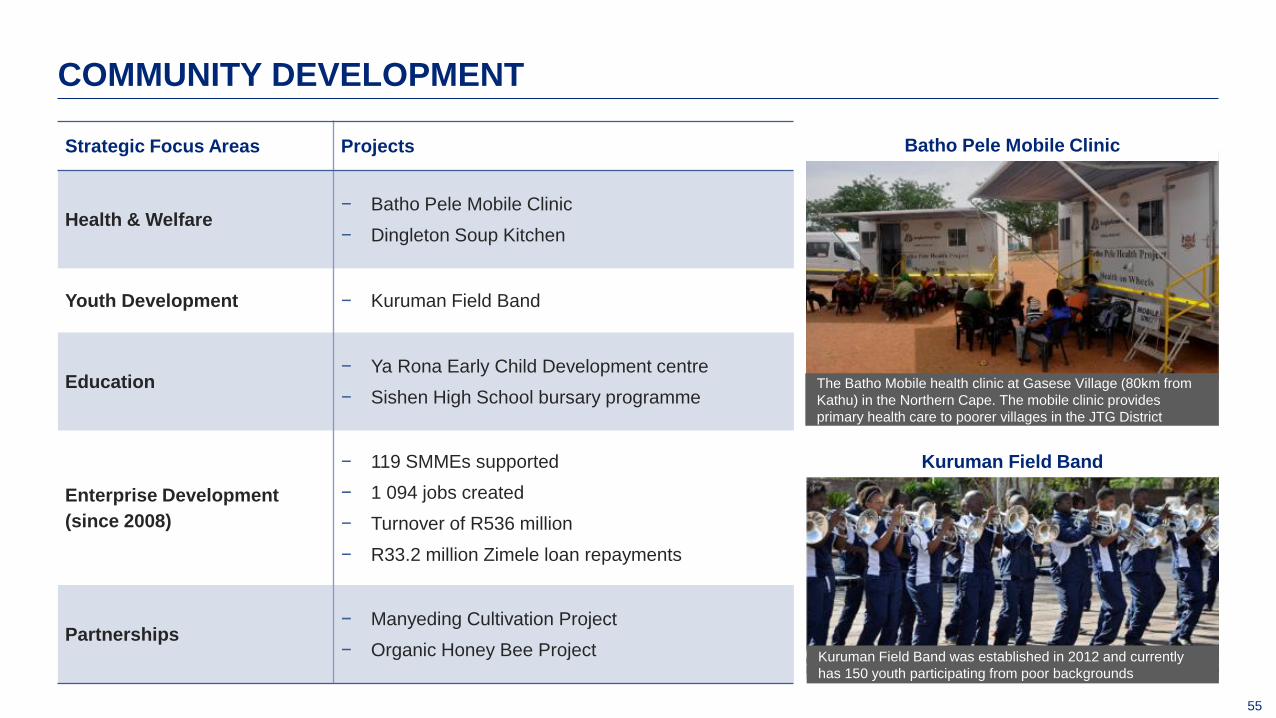
Strategic Focus Areas Projects
Health & Welfare − Batho Pele Mobile Clinic
− Dingleton Soup Kitchen
Youth Development − Kuruman Field Band
Education − Ya Rona Early Child Development centre
− Sishen High School bursary programme
Enterprise Development
(since 2008)
− 119 SMMEs supported
− 1 094 jobs created
− Turnover of R536 million
− R33.2 million Zimele loan repayments
Partnerships − Manyeding Cultivation Project
− Organic Honey Bee Project
COMMUNITY DEVELOPMENT
The Batho Mobile health clinic at Gasese Village (80km from
Kathu) in the Northern Cape. The mobile clinic provides
primary health care to poorer villages in the JTG District
Batho Pele Mobile Clinic
Kuruman Field Band was established in 2012 and currently
has 150 youth participating from poor backgrounds
Kuruman Field Band

56
TODAY’S PIT VISIT
Shovel view
Technology Demo
Pit Experience
Shovels Experience
Shovel view
Technology Demo
Autonomous Drills
Haul Trucks
Pit Experience
Plant View

TECHNOLOGY
GLEN MCGAVIGAN
58
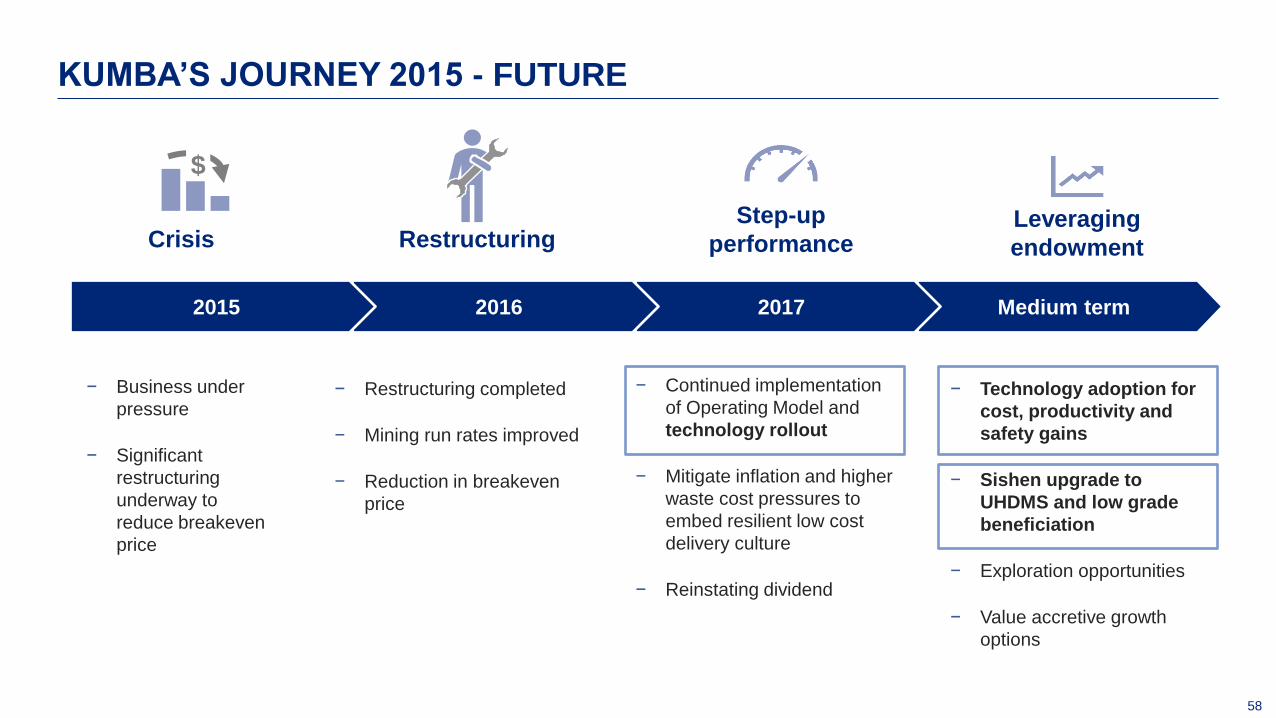
Medium term 2017 2016
Crisis
− Business under
pressure
− Significant
restructuring
underway to
reduce breakeven
price
Restructuring Step-up
performance
$
2015
− Restructuring completed
− Mining run rates improved
− Reduction in breakeven
price
− Continued implementation
of Operating Model and
technology rollout
− Mitigate inflation and higher
waste cost pressures to
embed resilient low cost
delivery culture
− Reinstating dividend
Leveraging
endowment
− Technology adoption for
cost, productivity and
safety gains
− Sishen upgrade to
UHDMS and low grade
beneficiation
− Exploration opportunities
− Value accretive growth
options
KUMBA’S JOURNEY 2015 - FUTURE
59
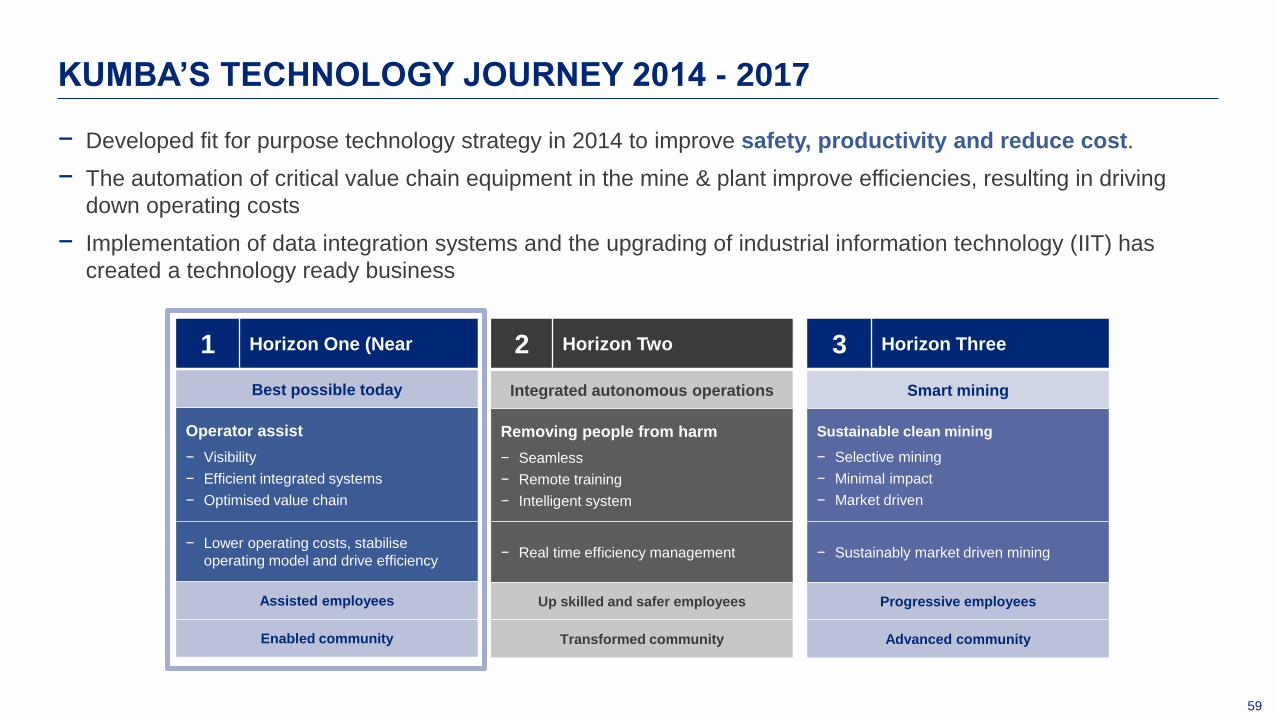
− Developed fit for purpose technology strategy in 2014 to improve safety, productivity and reduce cost.
− The automation of critical value chain equipment in the mine & plant improve efficiencies, resulting in driving
down operating costs
− Implementation of data integration systems and the upgrading of industrial information technology (IIT) has
created a technology ready business
KUMBA’S TECHNOLOGY JOURNEY 2014 - 2017
1 Horizon One (Near
Best possible today
Operator assist
− Visibility
− Efficient integrated systems
− Optimised value chain
− Lower operating costs, stabilise
operating model and drive efficiency
Assisted employees
Enabled community
2 Horizon Two 3 Horizon Three
Integrated autonomous operations
Removing people from harm
− Seamless
− Remote training
− Intelligent system
− Real time efficiency management
Up skilled and safer employees
Transformed community
Smart mining
Sustainable clean mining
− Selective mining
− Minimal impact
− Market driven
− Sustainably market driven mining
Progressive employees
Advanced community
60
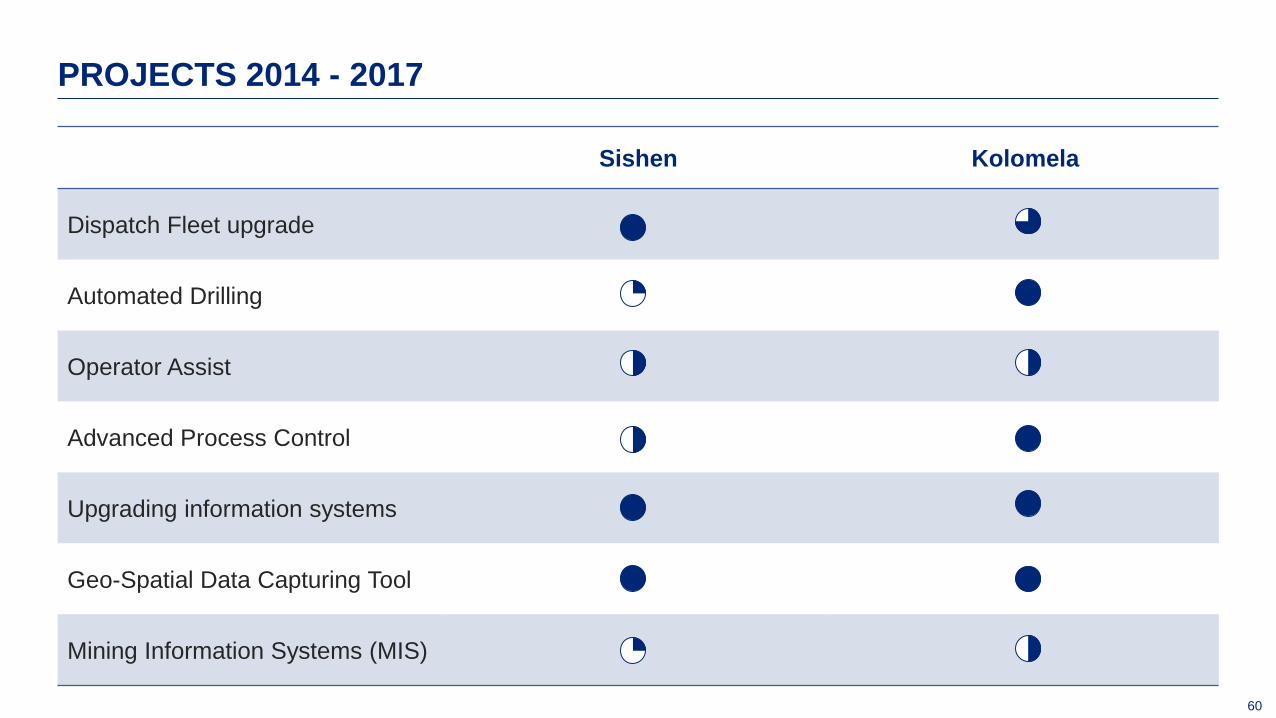
Sishen Kolomela
Dispatch Fleet upgrade
Automated Drilling
Operator Assist
Advanced Process Control
Upgrading information systems
Geo-Spatial Data Capturing Tool
Mining Information Systems (MIS)
PROJECTS 2014 - 2017
61
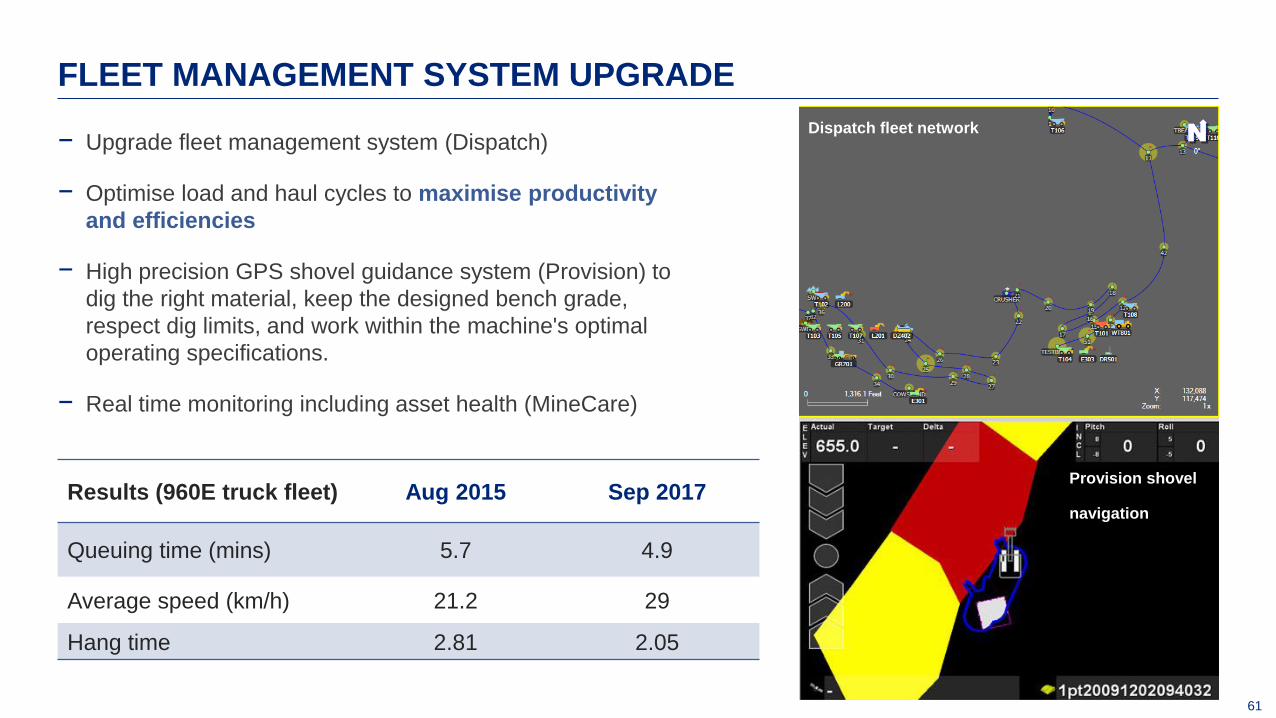
− Upgrade fleet management system (Dispatch)
− Optimise load and haul cycles to maximise productivity
and efficiencies
− High precision GPS shovel guidance system (Provision) to
dig the right material, keep the designed bench grade,
respect dig limits, and work within the machine's optimal
operating specifications.
− Real time monitoring including asset health (MineCare)
FLEET MANAGEMENT SYSTEM UPGRADE
Results (960E truck fleet) Aug 2015 Sep 2017
Queuing time (mins) 5.7 4.9
Average speed (km/h) 21.2 29
Hang time 2.81 2.05
Dispatch fleet network
Provision shovel
navigation

62
− Kolomela blast hole drilling fleet fully autonomous
− Benefits realised (Sep 2015 base to Aug 2017):
− Improved safety
− Drill hole quality
− Increased direct operating hours from 17.3 to 18.6hrs
per day
− Reduction in levelling time from 1.3mins to 0.4mins
− Improvement in tramming time 2.4mins to 0.9mins
− 2 Atlas Copco Pit Vipers converted at Sishen
AUTOMATED DRILLING
Kolomela Drilling Command Centre
Autonomous drill at Kolomela
63
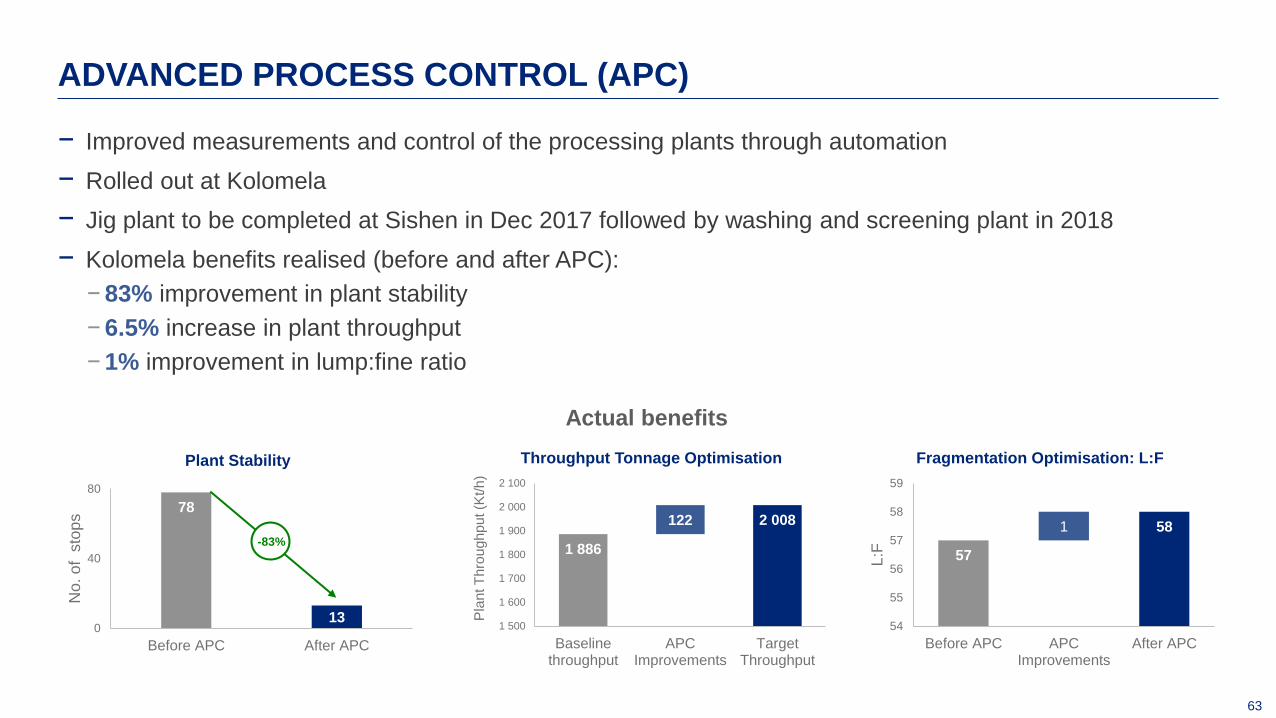
− Improved measurements and control of the processing plants through automation
− Rolled out at Kolomela
− Jig plant to be completed at Sishen in Dec 2017 followed by washing and screening plant in 2018
− Kolomela benefits realised (before and after APC):
− 83% improvement in plant stability
− 6.5% increase in plant throughput
− 1% improvement in lump:fine ratio
ADVANCED PROCESS CONTROL (APC)
APC – particle size analysers
1 886
2 008 122
1 500
1 600
1 700
1 800
1 900
2 000
2 100
Baselinethroughput
APCImprovements
TargetThroughput
Pla
nt T
hro
ug
hp
ut (K
t/h
)
Throughput Tonnage Optimisation
57
58 1
54
55
56
57
58
59
Before APC APCImprovements
After APC
L:F
Fragmentation Optimisation: L:F
78
13 0
40
80
Before APC After APC
No. o
f s
top
s
Plant Stability
-83%
Actual benefits
64
MINE INFORMATION SYSTEM (MIS) AND GEO-SPATIAL TOOLS
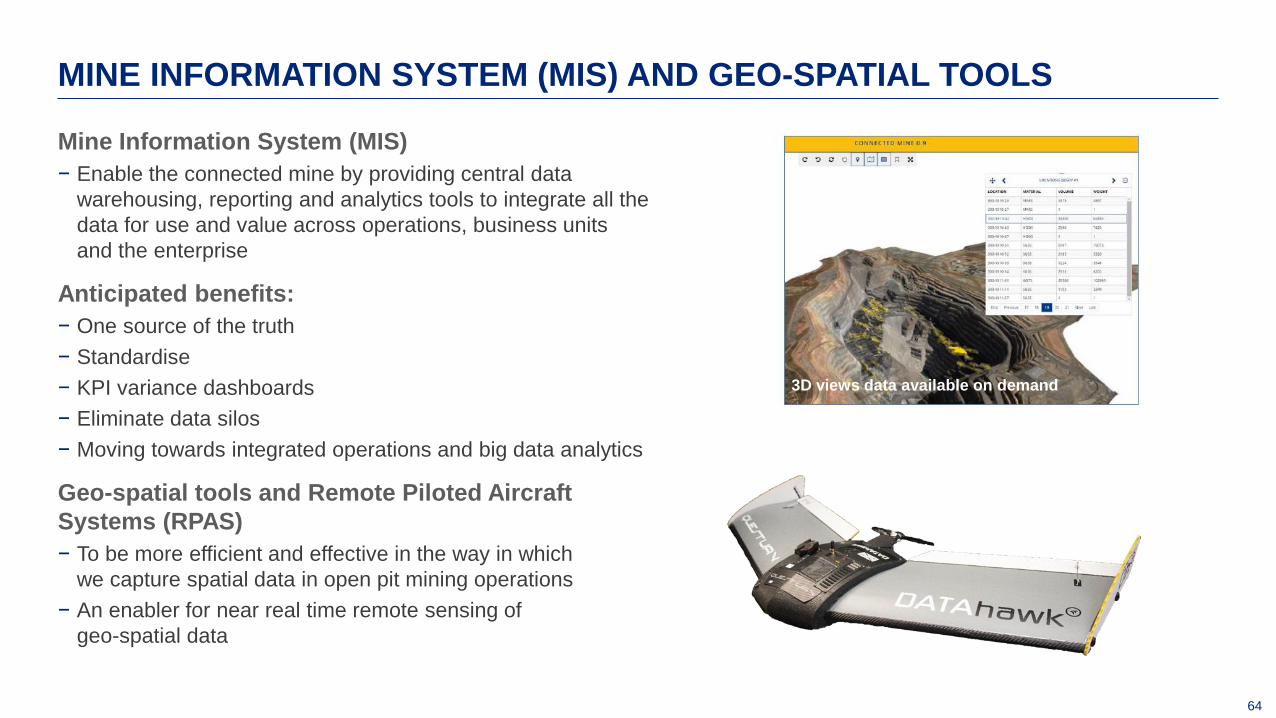
Mine Information System (MIS)
− Enable the connected mine by providing central data
warehousing, reporting and analytics tools to integrate all the
data for use and value across operations, business units
and the enterprise
Anticipated benefits:
− One source of the truth
− Standardise
− KPI variance dashboards
− Eliminate data silos
− Moving towards integrated operations and big data analytics
Geo-spatial tools and Remote Piloted Aircraft
Systems (RPAS)
− To be more efficient and effective in the way in which
we capture spatial data in open pit mining operations
− An enabler for near real time remote sensing of
geo-spatial data
3D views data available on demand
ULTRA HIGH DENSE MEDIA SEPARATION
66
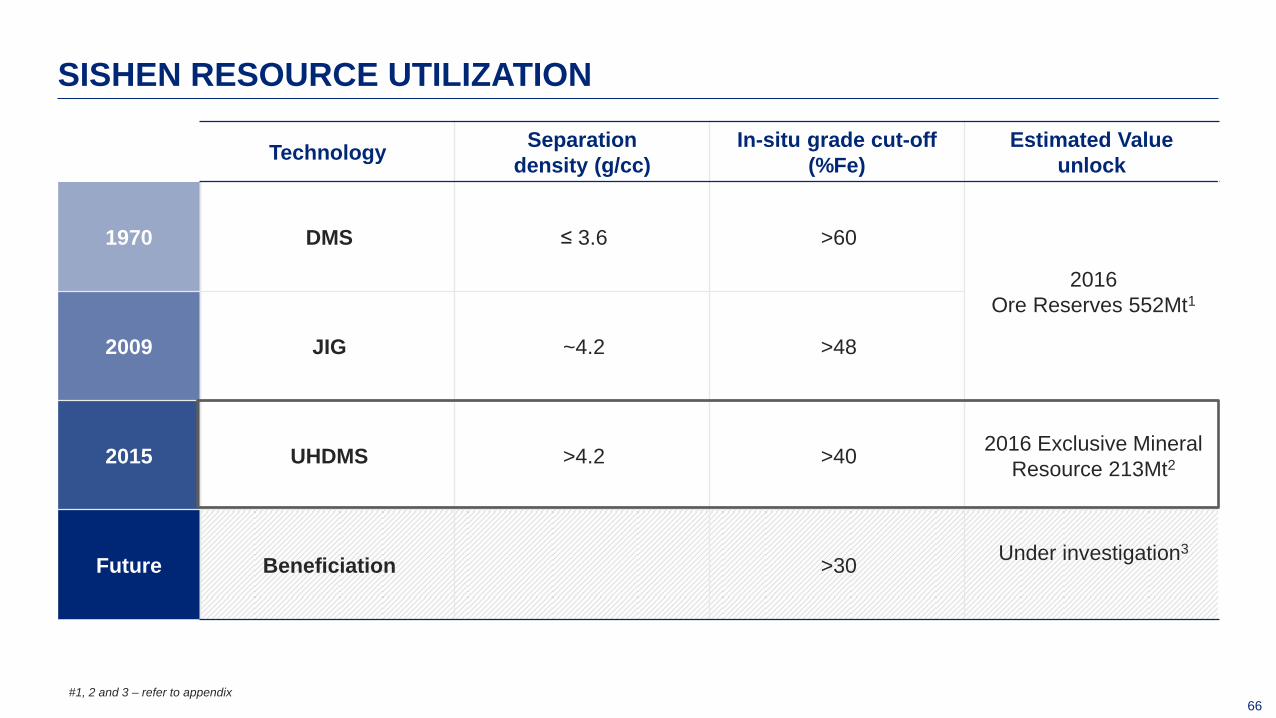
SISHEN RESOURCE UTILIZATION
Technology Separation
density (g/cc)
In-situ grade cut-off
(%Fe)
Estimated Value
unlock
1970 DMS ≤ 3.6 >60
2016
Ore Reserves 552Mt1
2009 JIG ~4.2 >48
2015 UHDMS >4.2 >40 2016 Exclusive Mineral
Resource 213Mt2
Future Beneficiation >30 Under investigation3
#1, 2 and 3 – refer to appendix
67
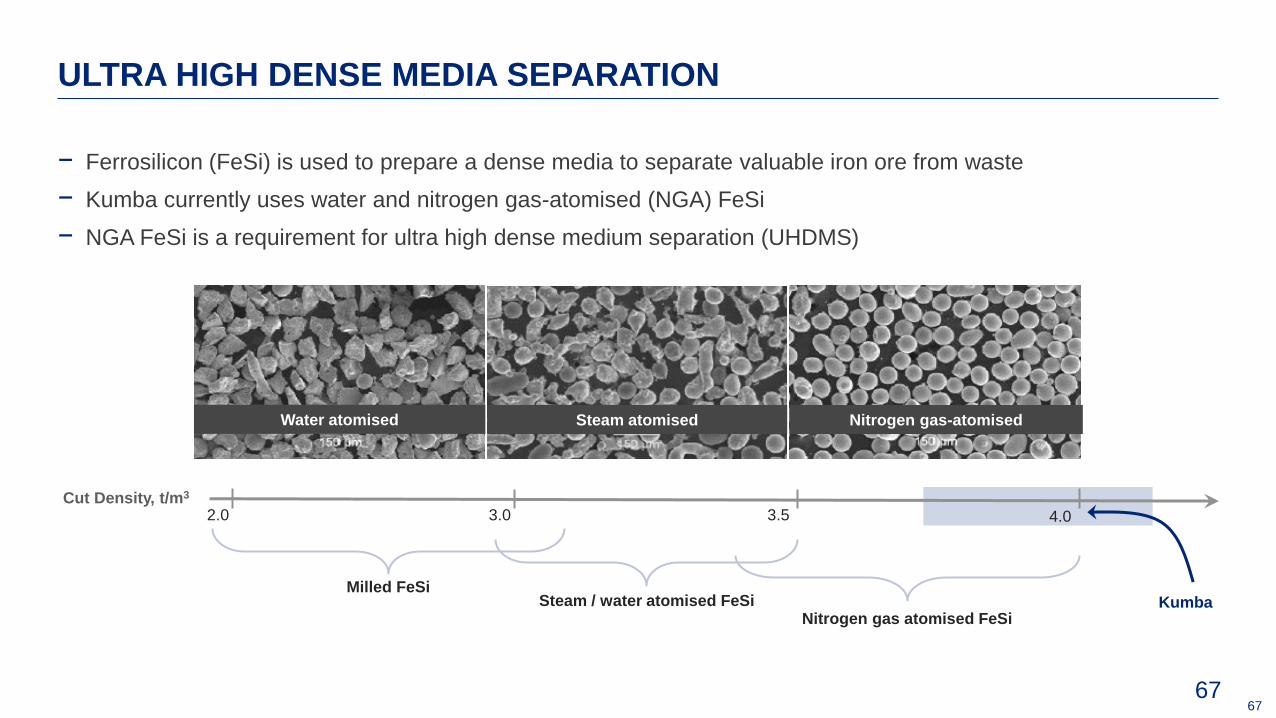
− Ferrosilicon (FeSi) is used to prepare a dense media to separate valuable iron ore from waste
− Kumba currently uses water and nitrogen gas-atomised (NGA) FeSi
− NGA FeSi is a requirement for ultra high dense medium separation (UHDMS)
ULTRA HIGH DENSE MEDIA SEPARATION
67
Water atomised Steam atomised Nitrogen gas-atomised
Cut Density, t/m3
Kumba
3.5 3.0 2.0
Milled FeSi Steam / water atomised FeSi
4.0
Nitrogen gas atomised FeSi
68
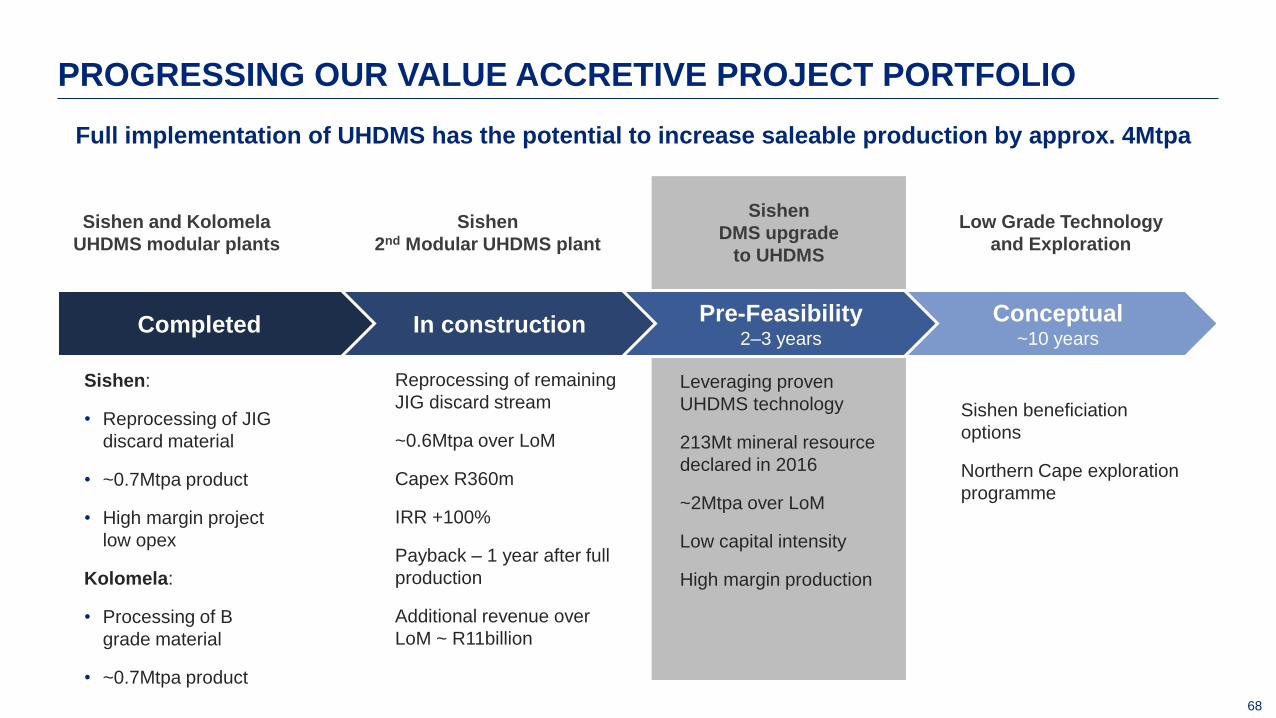
PROGRESSING OUR VALUE ACCRETIVE PROJECT PORTFOLIO
Full implementation of UHDMS has the potential to increase saleable production by approx. 4Mtpa
Conceptual ~10 years
Pre-Feasibility 2–3 years
In construction
Low Grade Technology
and Exploration
Sishen beneficiation
options
Northern Cape exploration
programme
Completed
Sishen
DMS upgrade
to UHDMS
Leveraging proven
UHDMS technology
213Mt mineral resource
declared in 2016
~2Mtpa over LoM
Low capital intensity
High margin production
Sishen
2nd Modular UHDMS plant
Reprocessing of remaining
JIG discard stream
~0.6Mtpa over LoM
Capex R360m
IRR +100%
Payback – 1 year after full
production
Additional revenue over
LoM ~ R11billion
Sishen and Kolomela
UHDMS modular plants
Sishen:
• Reprocessing of JIG
discard material
• ~0.7Mtpa product
• High margin project
low opex
Kolomela:
• Processing of B
grade material
• ~0.7Mtpa product

2018-2022 TECHNOLOGY STRATEGY
70
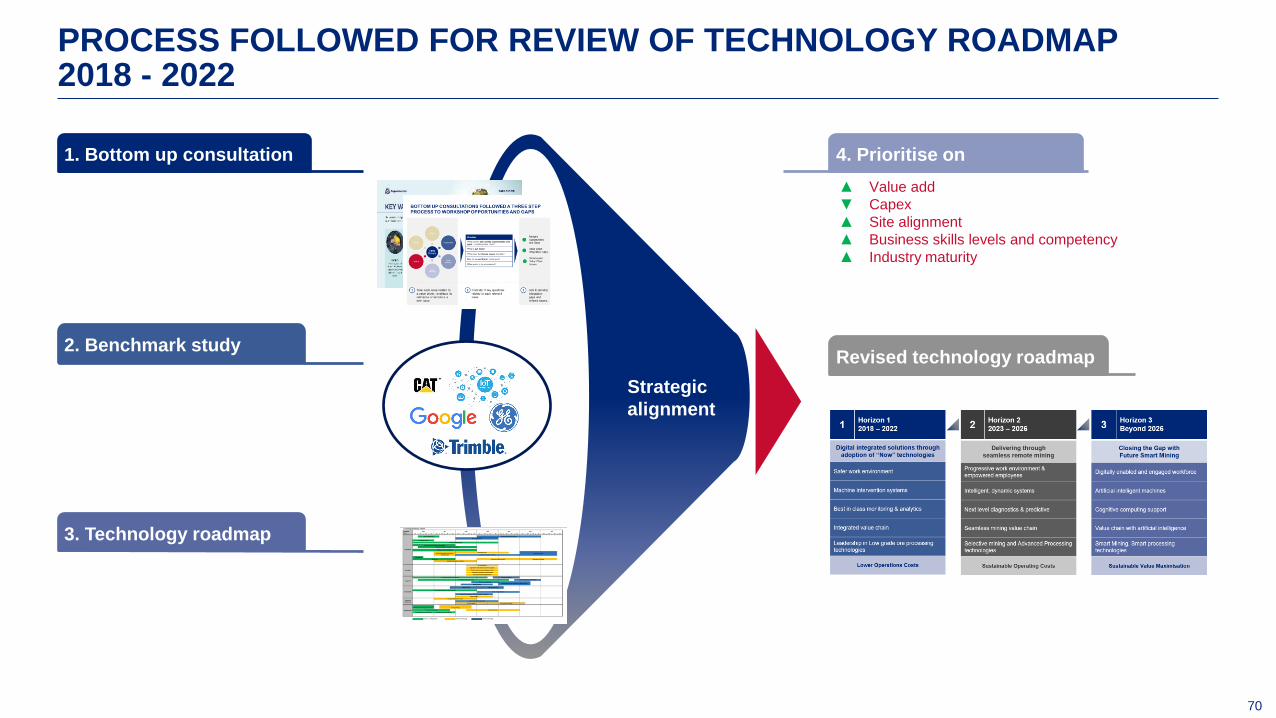
PROCESS FOLLOWED FOR REVIEW OF TECHNOLOGY ROADMAP 2018 - 2022
3. Technology roadmap
1. Bottom up consultation
2. Benchmark study
▲ Value add
▼ Capex
▲ Site alignment
▲ Business skills levels and competency
▲ Industry maturity
3
4. Prioritise on
Revised technology roadmap
Strategic
alignment
71
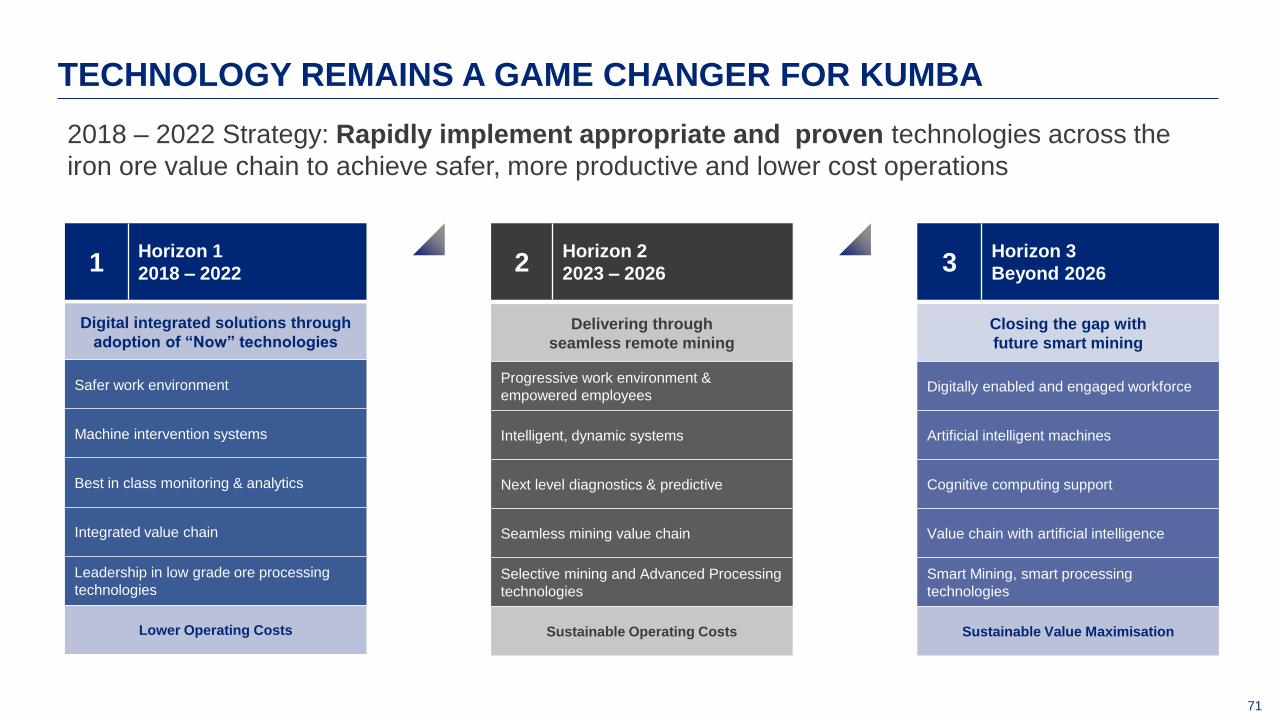
TECHNOLOGY REMAINS A GAME CHANGER FOR KUMBA
1 Horizon 1
2018 – 2022
Digital integrated solutions through
adoption of “Now” technologies
Safer work environment
Machine intervention systems
Best in class monitoring & analytics
Integrated value chain
Leadership in low grade ore processing
technologies
Lower Operating Costs
2 Horizon 2
2023 – 2026 3 Horizon 3
Beyond 2026
Delivering through
seamless remote mining
Progressive work environment &
empowered employees
Intelligent, dynamic systems
Next level diagnostics & predictive
Seamless mining value chain
Selective mining and Advanced Processing
technologies
Sustainable Operating Costs
Closing the gap with
future smart mining
Digitally enabled and engaged workforce
Artificial intelligent machines
Cognitive computing support
Value chain with artificial intelligence
Smart Mining, smart processing
technologies
Sustainable Value Maximisation
2018 – 2022 Strategy: Rapidly implement appropriate and proven technologies across the
iron ore value chain to achieve safer, more productive and lower cost operations
CONCLUSION
THEMBA MKHWANAZI
73
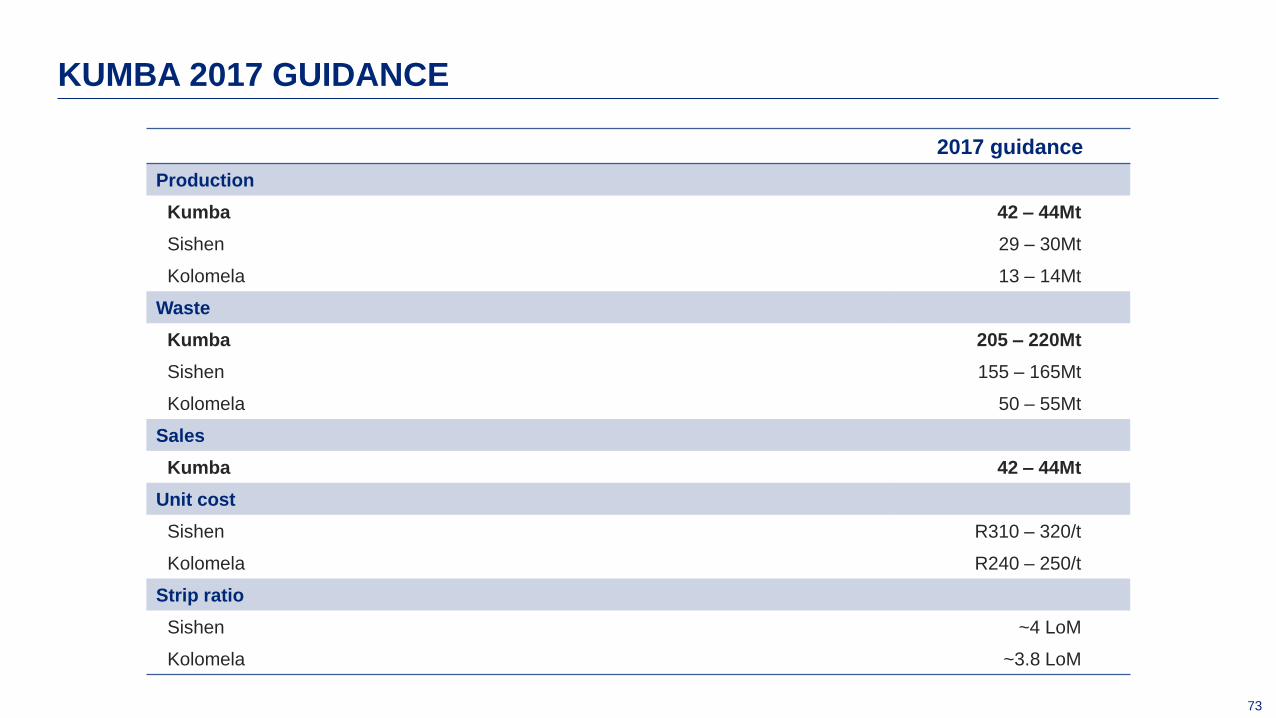
KUMBA 2017 GUIDANCE
2017 guidance
Production
Kumba 42 – 44Mt
Sishen 29 – 30Mt
Kolomela 13 – 14Mt
Waste
Kumba 205 – 220Mt
Sishen 155 – 165Mt
Kolomela 50 – 55Mt
Sales
Kumba 42 – 44Mt
Unit cost
Sishen R310 – 320/t
Kolomela R240 – 250/t
Strip ratio
Sishen ~4 LoM
Kolomela ~3.8 LoM
74
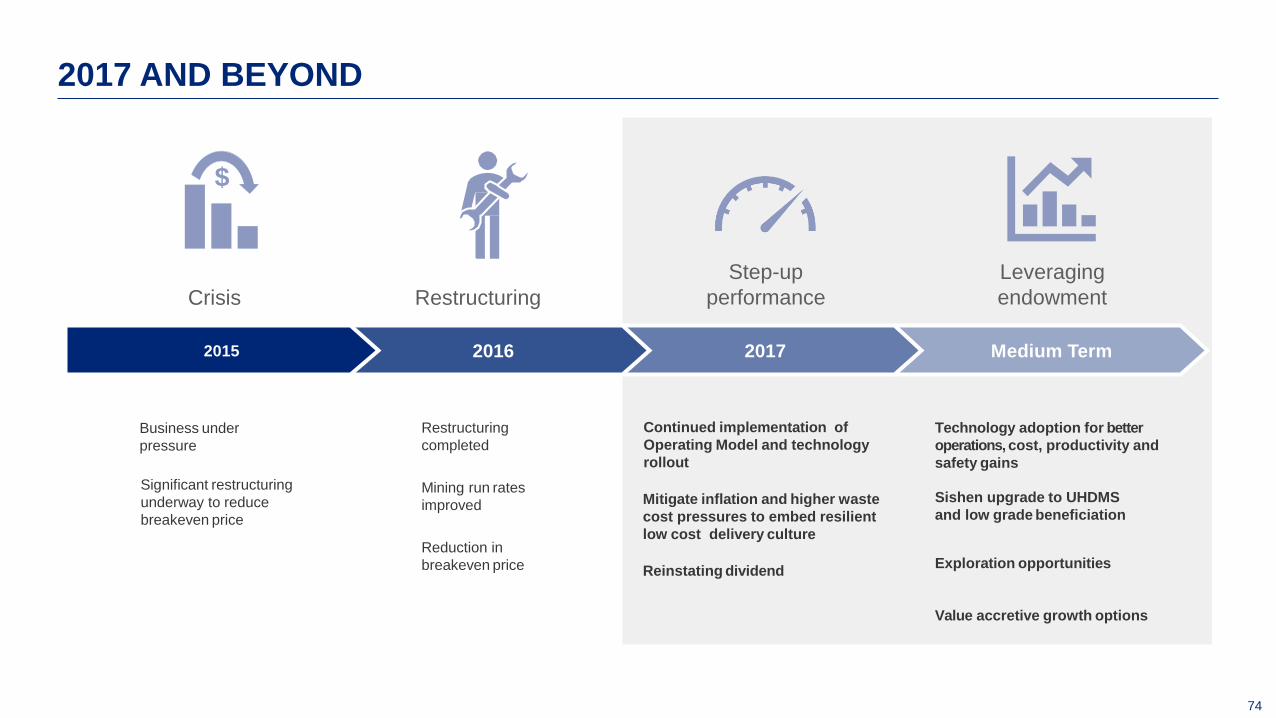
2017 AND BEYOND
Restructuring
Step-up
performance
Leveraging
endowment
Business under
pressure
Significant restructuring
underway to reduce
breakeven price
Restructuring
completed
Mining run rates
improved
Reduction in
breakeven price
Continued implementation of
Operating Model and technology
rollout
Mitigate inflation and higher waste
cost pressures to embed resilient
low cost delivery culture
Reinstating dividend
Technology adoption for better
operations, cost, productivity and
safety gains
Sishen upgrade to UHDMS
and low grade beneficiation
Exploration opportunities
Value accretive growth options
Crisis
$
Medium Term 2017 2016 2015

QUESTIONS
APPENDIX
77
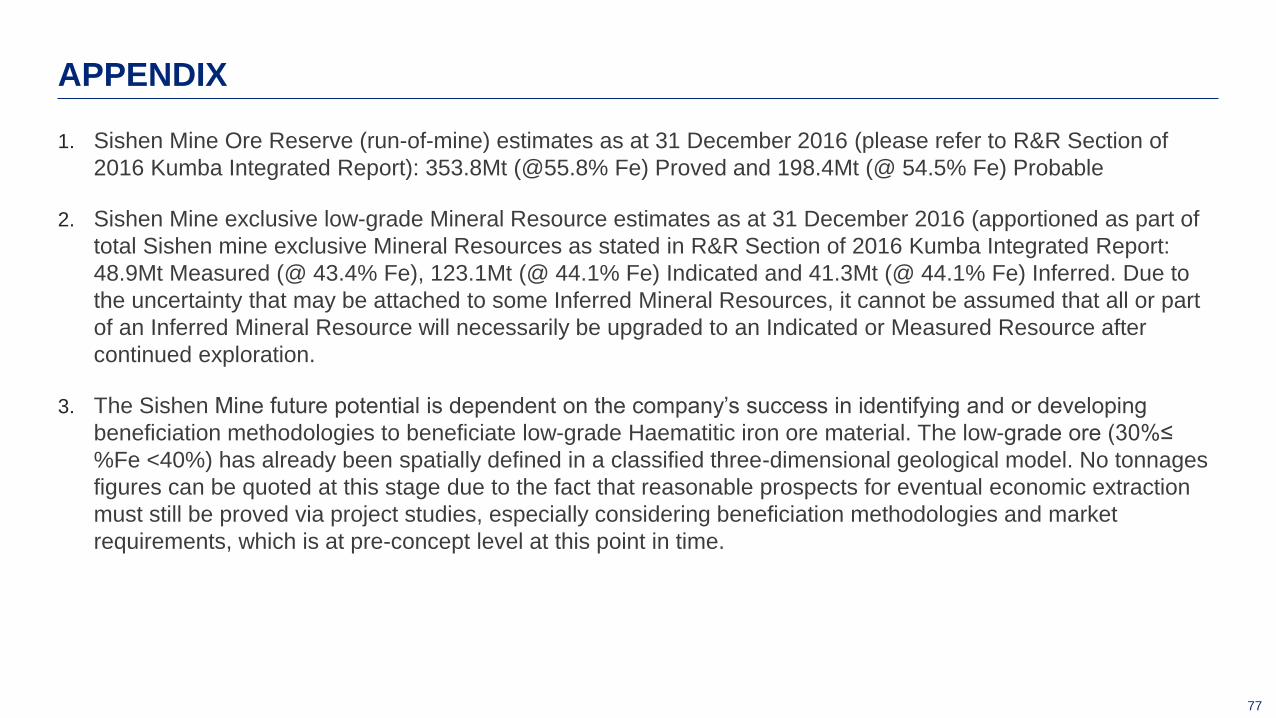
1. Sishen Mine Ore Reserve (run-of-mine) estimates as at 31 December 2016 (please refer to R&R Section of
2016 Kumba Integrated Report): 353.8Mt (@55.8% Fe) Proved and 198.4Mt (@ 54.5% Fe) Probable
2. Sishen Mine exclusive low-grade Mineral Resource estimates as at 31 December 2016 (apportioned as part of
total Sishen mine exclusive Mineral Resources as stated in R&R Section of 2016 Kumba Integrated Report:
48.9Mt Measured (@ 43.4% Fe), 123.1Mt (@ 44.1% Fe) Indicated and 41.3Mt (@ 44.1% Fe) Inferred. Due to
the uncertainty that may be attached to some Inferred Mineral Resources, it cannot be assumed that all or part
of an Inferred Mineral Resource will necessarily be upgraded to an Indicated or Measured Resource after
continued exploration.
3. The Sishen Mine future potential is dependent on the company’s success in identifying and or developing
beneficiation methodologies to beneficiate low-grade Haematitic iron ore material. The low-grade ore (30%≤
%Fe <40%) has already been spatially defined in a classified three-dimensional geological model. No tonnages
figures can be quoted at this stage due to the fact that reasonable prospects for eventual economic extraction
must still be proved via project studies, especially considering beneficiation methodologies and market
requirements, which is at pre-concept level at this point in time.
APPENDIX