Embed Size (px)
Citation preview
TECH NOTE
SiPM Experiment Guide
SensL © 2014 1
SiPM SMA Board Experiment Guide
This document will assist the new user of Silicon Photomultipliers (SiPM) to make observations that will verify that the sensor is set-up and functioning correctly. The demonstrations below may be useful in the set up of the user’s own experiments and illustrate some of the important characteristics of the sensor. This document focuses on the practical issues of setting up and making simple observations of the sensor output. Further documents that cover a wide range of SiPM sensor-related topics are available from the SensL website, some of which are listed at the end of this document.
This document specifically uses an SMA evaluation board with a 3mm, 35mm microcell P-on-N sensor, e.g. MicroFC-SMA-30035.
It is important that the user first consult the datasheet and user manual for the product. Links can be found at the end of this document.
MicroFC-SMA-30035 Set-up Overview
• The MicroFC-SMA is a small test board that houses a sensor and biasing circuitry. The three (female) SMA connectors are for bias (Vbias - Cathode), fast output (Fout) and standard output (Sout - Anode).
• The schematic of the board is shown in Figure 2, with the two outputs, Sout and Fout, labelled.
• The sensor is C-Series (MicroFC-SMA-30035) so the applied bias should be +27V.
• (If an M-Series sensor is used instead (MicroFM-SMA-XXXXX) the bias should be -29V.)
• To make the MicroFC-SMA ready for this demonstration, mount the board securely to a surface using the mounting holes.
• It should be noted that the MicroFC-SMA boards do not contain any on-board amplification and so single photon signals would only be a fraction of a mV in amplitude. Therefore, additional amplifiers are needed to view the single photon or dark count signals, as described in the second section of this guide.
Scope of the Document
This document relates specifically to an SMA board with a 3mm, 35mm microcell, P-on-N sensor (such as the MicroFC-SMA-30035), but to a large extent can also be used for other MicroFX-SMA variants.
Other MicroFX-SMA-XXXXX (different sensor and microcell sizes) are set up in the same manner as described here but will yield different pulse heights and pulse shapes than those shown here in the Figures.
MicroFM-SMA-XXXXX boards (M-Series sensors) use the opposite polarity bias to the C-Series, and as such the pulses will be negative-going.
Figure 1, MicroFC-SMA-30035
Figure 2, The schematic for the MicroFC-SMA-30035 board. The various I/Os are labelled: Vbias (Cathode connection), Sout (Anode connection) and Fout (Fast Output from the balun, which is in turn
connected to the fast terminal of a SensL SiPM).
SensL © 2014 2
TECH NOTE
SiPM Experiment Guide
SensL © 2014 2
Observation of Mains Frequency in Fluorescent Lighting
Here the SiPM will be set up to make a very simple observation - that of the inherent modulation in the photon flux from fluorescent lighting due to the mains frequency. Since most laboratories have fluorescent lighting as standard, the equipment list is very short and simple and should be within the reach of anyone in possession of an SiPM sensor.
Equipment List
• MicroFC-SMA-30035
• Bias supply, capable of supplying 30V and 15mA.
• Two 50W coax cable, with a male SMA-to-BNC, such as this one (one for signal, one for bias).
• A coax-to-double-banana-plug adapter such as this one, for connecting BNC to a bench bias supply.
• Oscilloscope (1GHz)
• Semi-translucent material (such as a sheet of thin paper)
• Some completely opaque material or container to shield the SiPM from ambient light
• A source of overhead fluorescent lighting
Set-up
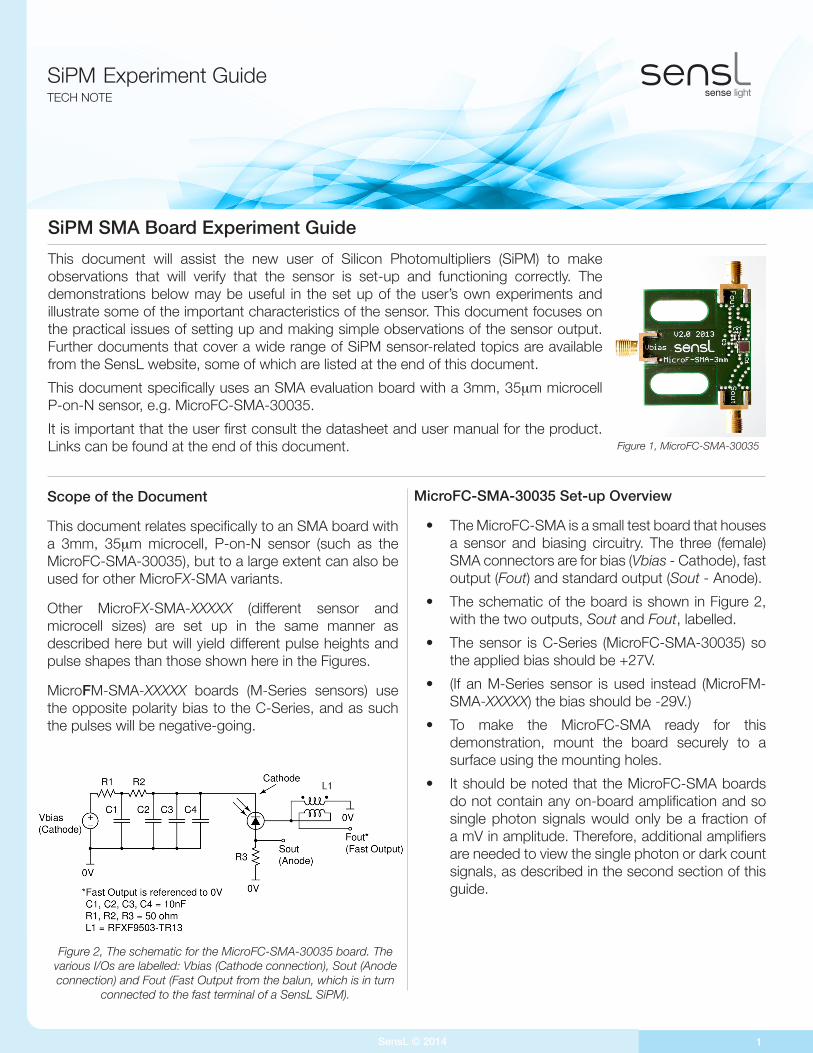
• Using Figure 3 as a reference, connect one of the SMA-to-BNC cables to the Vbias SMA on the MicroFC-SMA-30035 board, and the other end to the bias supply, using the banana plug adapter if needed.
Figure 3, Experimental arrangement for observation of the mains frequency in fluorescent lighting.
• Connect the other SMA-to-BNC cable to the output SMA Sout on the MicroFC-SMA-30035 board, and the other end to the oscilloscope (set to 50Ω input).
• Cover the sensor with the opaque material, so that it is shielded from ambient light
• Set the sensor bias supply current limit to 15mA and then turn it on.
Observations
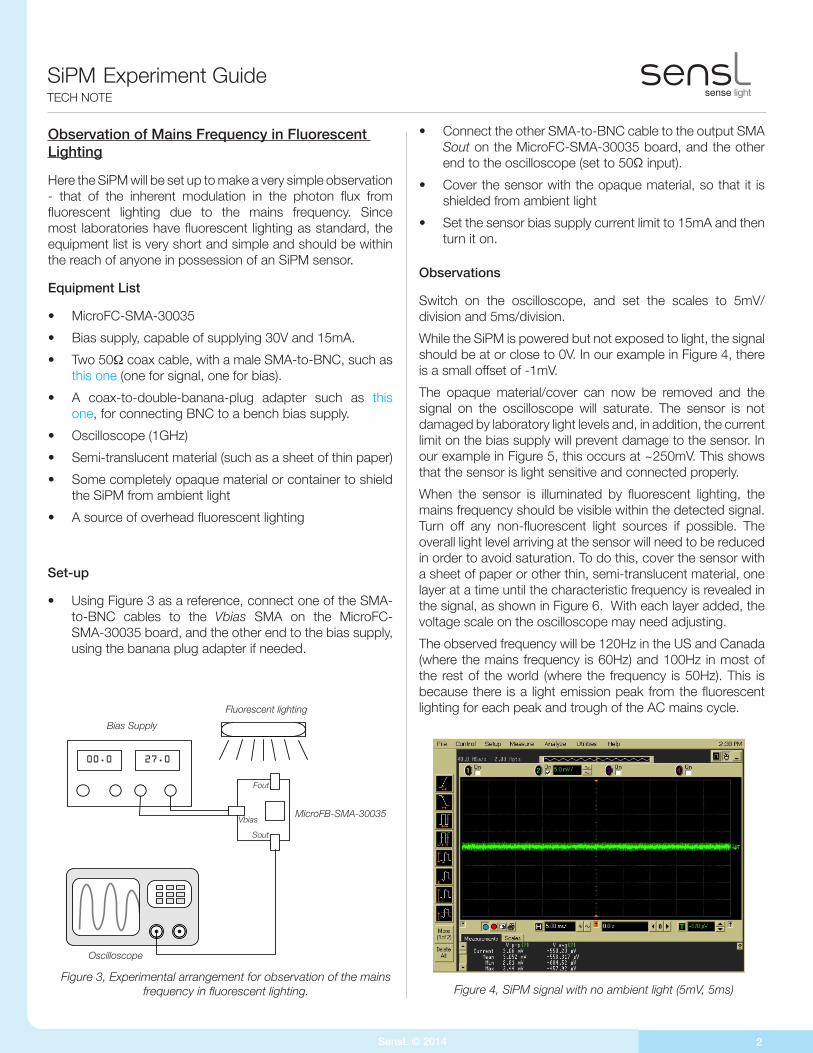
Switch on the oscilloscope, and set the scales to 5mV/division and 5ms/division.
While the SiPM is powered but not exposed to light, the signal should be at or close to 0V. In our example in Figure 4, there is a small offset of -1mV.
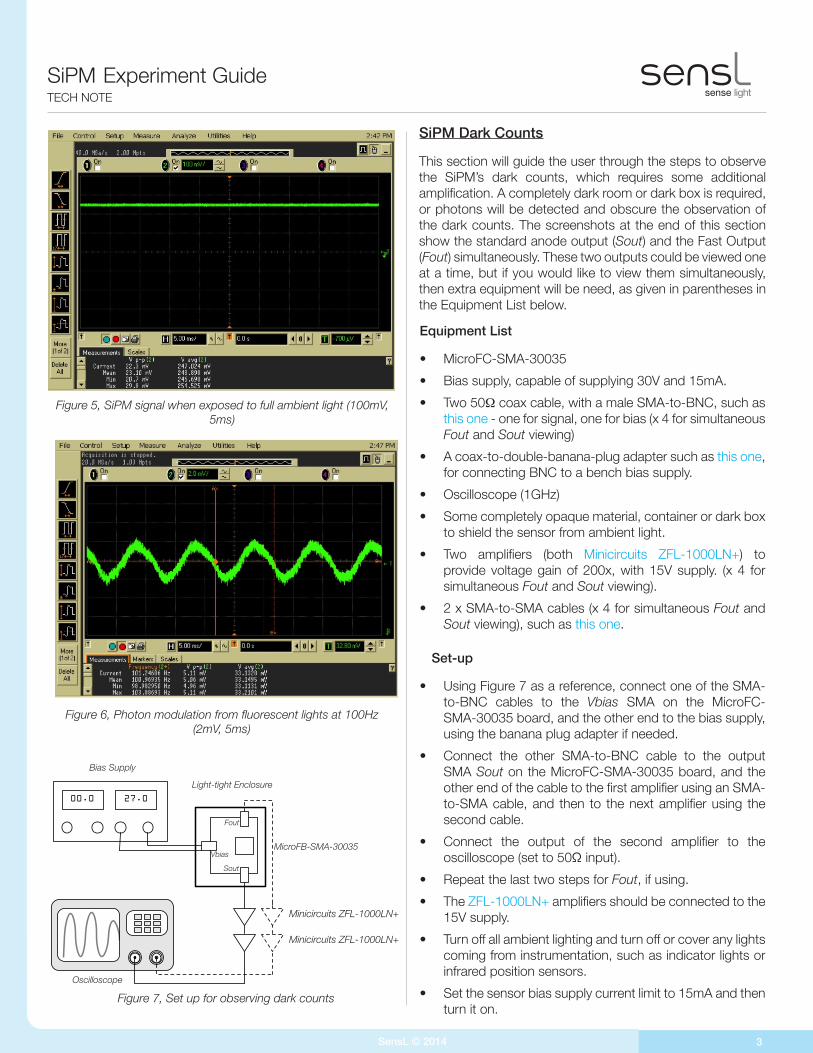
The opaque material/cover can now be removed and the signal on the oscilloscope will saturate. The sensor is not damaged by laboratory light levels and, in addition, the current limit on the bias supply will prevent damage to the sensor. In our example in Figure 5, this occurs at ~250mV. This shows that the sensor is light sensitive and connected properly.
When the sensor is illuminated by fluorescent lighting, the mains frequency should be visible within the detected signal. Turn off any non-fluorescent light sources if possible. The overall light level arriving at the sensor will need to be reduced in order to avoid saturation. To do this, cover the sensor with a sheet of paper or other thin, semi-translucent material, one layer at a time until the characteristic frequency is revealed in the signal, as shown in Figure 6. With each layer added, the voltage scale on the oscilloscope may need adjusting.
The observed frequency will be 120Hz in the US and Canada (where the mains frequency is 60Hz) and 100Hz in most of the rest of the world (where the frequency is 50Hz). This is because there is a light emission peak from the fluorescent lighting for each peak and trough of the AC mains cycle.
00.0 27.0
Fout
Sout
Vbias
Bias Supply
Fluorescent lighting
Oscilloscope
MicroFB-SMA-30035
Figure 4, SiPM signal with no ambient light (5mV, 5ms)
SensL © 2014 3
TECH NOTE
SiPM Experiment Guide
SensL © 2014 3
Figure 6, Photon modulation from fluorescent lights at 100Hz (2mV, 5ms)
Equipment List
• MicroFC-SMA-30035
• Bias supply, capable of supplying 30V and 15mA.
• Two 50W coax cable, with a male SMA-to-BNC, such as this one - one for signal, one for bias (x 4 for simultaneous Fout and Sout viewing)
• A coax-to-double-banana-plug adapter such as this one, for connecting BNC to a bench bias supply.
• Oscilloscope (1GHz)
• Some completely opaque material, container or dark box to shield the sensor from ambient light.
• Two amplifiers (both Minicircuits ZFL-1000LN+) to provide voltage gain of 200x, with 15V supply. (x 4 for simultaneous Fout and Sout viewing).
• 2 x SMA-to-SMA cables (x 4 for simultaneous Fout and Sout viewing), such as this one.
Set-up
• Using Figure 7 as a reference, connect one of the SMA-to-BNC cables to the Vbias SMA on the MicroFC-SMA-30035 board, and the other end to the bias supply, using the banana plug adapter if needed.
• Connect the other SMA-to-BNC cable to the output SMA Sout on the MicroFC-SMA-30035 board, and the other end of the cable to the first amplifier using an SMA-to-SMA cable, and then to the next amplifier using the second cable.
• Connect the output of the second amplifier to the oscilloscope (set to 50Ω input).
• Repeat the last two steps for Fout, if using.
• The ZFL-1000LN+ amplifiers should be connected to the 15V supply.
• Turn off all ambient lighting and turn off or cover any lights coming from instrumentation, such as indicator lights or infrared position sensors.
• Set the sensor bias supply current limit to 15mA and then turn it on.
Figure 5, SiPM signal when exposed to full ambient light (100mV, 5ms)
SiPM Dark Counts
This section will guide the user through the steps to observe the SiPM’s dark counts, which requires some additional amplification. A completely dark room or dark box is required, or photons will be detected and obscure the observation of the dark counts. The screenshots at the end of this section show the standard anode output (Sout) and the Fast Output (Fout) simultaneously. These two outputs could be viewed one at a time, but if you would like to view them simultaneously, then extra equipment will be need, as given in parentheses in the Equipment List below.
Figure 7, Set up for observing dark counts
00.0 27.0
Fout
Sout
Vbias
Bias Supply
Oscilloscope
MicroFB-SMA-30035
Light-tight Enclosure
Minicircuits ZFL-1000LN+
Minicircuits ZFL-1000LN+
SensL © 2014 4SensL © 2014 4
TECH NOTE
SiPM Experiment Guide
Rev. 2.0, July 2015
+353 21 240 7110 (International)+1 650 641 3278 (North America)
SensL © 2014 4
All specifications are subject to change without notice
Further Help
If more help is required in the set-up and operation of SiPM sensors, there are several SensL resources that can help.
The Introduction to SiPM Tech Note provides an overview of the SiPM, how it works and how different parameters are affected by different settings.
The User Manual for the MicroC range of SiPM sensors.
The Datasheet for the MicroC range of SiPM sensors.
The SensL website www.sensl.com has a large number of additional Tech Notes on the subject of SiPM use and applications.
If further help is needed, please contact [email protected]
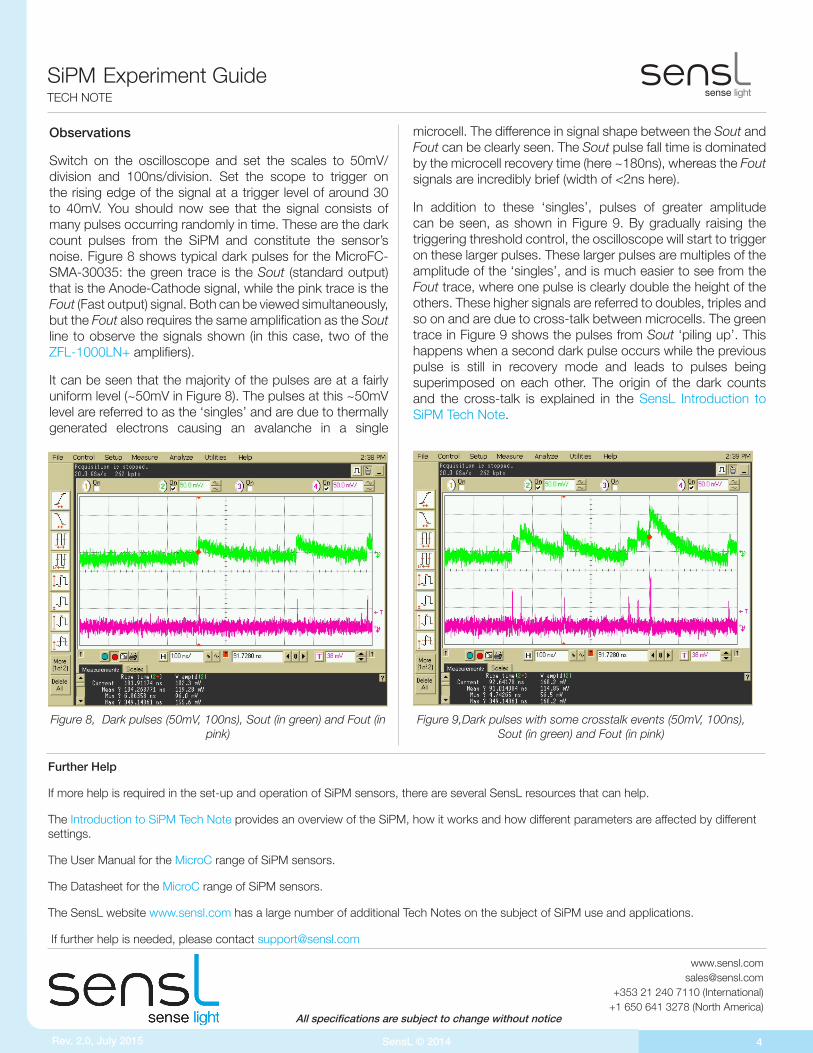
Figure 9,Dark pulses with some crosstalk events (50mV, 100ns), Sout (in green) and Fout (in pink)
Figure 8, Dark pulses (50mV, 100ns), Sout (in green) and Fout (in pink)
microcell. The difference in signal shape between the Sout and Fout can be clearly seen. The Sout pulse fall time is dominated by the microcell recovery time (here ~180ns), whereas the Fout signals are incredibly brief (width of <2ns here).
In addition to these ‘singles’, pulses of greater amplitude can be seen, as shown in Figure 9. By gradually raising the triggering threshold control, the oscilloscope will start to trigger on these larger pulses. These larger pulses are multiples of the amplitude of the ‘singles’, and is much easier to see from the Fout trace, where one pulse is clearly double the height of the others. These higher signals are referred to doubles, triples and so on and are due to cross-talk between microcells. The green trace in Figure 9 shows the pulses from Sout ‘piling up’. This happens when a second dark pulse occurs while the previous pulse is still in recovery mode and leads to pulses being superimposed on each other. The origin of the dark counts and the cross-talk is explained in the SensL Introduction to SiPM Tech Note.
Observations
Switch on the oscilloscope and set the scales to 50mV/division and 100ns/division. Set the scope to trigger on the rising edge of the signal at a trigger level of around 30 to 40mV. You should now see that the signal consists of many pulses occurring randomly in time. These are the dark count pulses from the SiPM and constitute the sensor’s noise. Figure 8 shows typical dark pulses for the MicroFC-SMA-30035: the green trace is the Sout (standard output) that is the Anode-Cathode signal, while the pink trace is the Fout (Fast output) signal. Both can be viewed simultaneously, but the Fout also requires the same amplification as the Sout line to observe the signals shown (in this case, two of the ZFL-1000LN+ amplifiers).
It can be seen that the majority of the pulses are at a fairly uniform level (~50mV in Figure 8). The pulses at this ~50mV level are referred to as the ‘singles’ and are due to thermally generated electrons causing an avalanche in a single