Embed Size (px)
Citation preview
Sinusoidal FunctionsCHAPTER 8
Chapter 8
8.2 – EXPLORING GRAPHS OF PERIODIC
FUNCTIONS
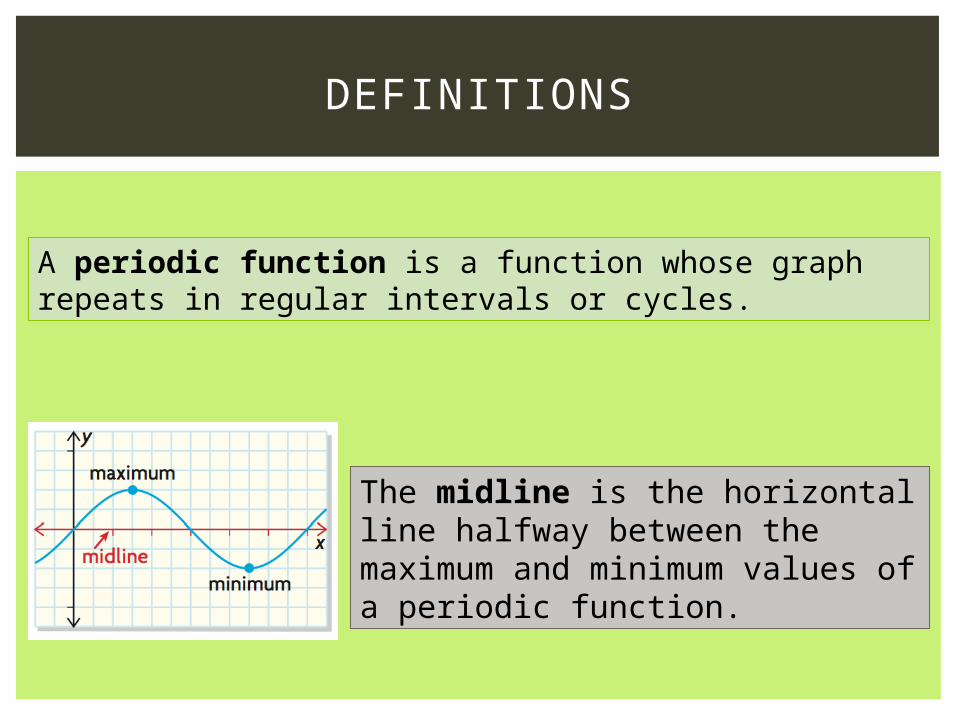
DEFINITIONS
A periodic function is a function whose graph repeats in regular intervals or cycles.
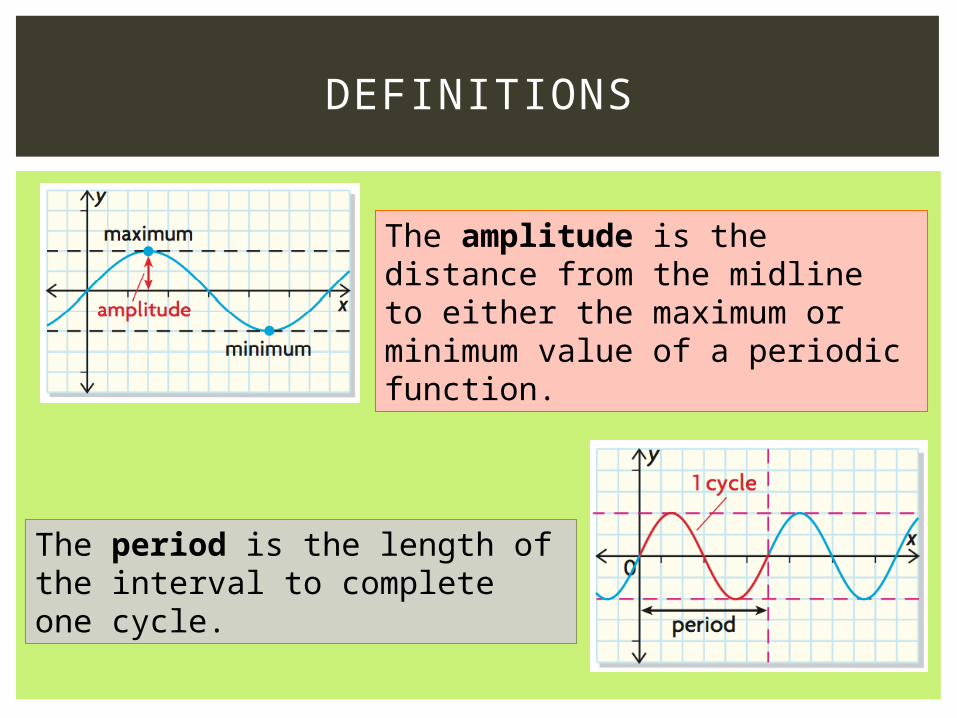
The midline is the horizontal line halfway between the maximum and minimum values of a periodic function.
DEFINITIONS
The period is the length of the interval to complete one cycle.
The amplitude is the distance from the midline to either the maximum or minimum value of a periodic function.
CONSIDER Y = SIN(X)
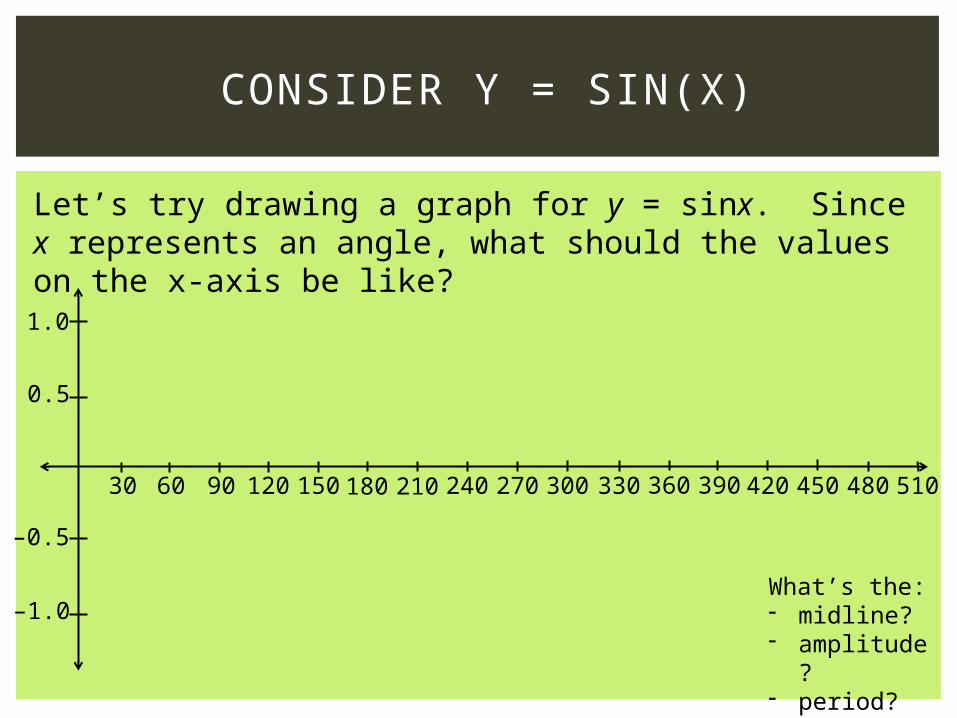
Let’s try drawing a graph for y = sinx. Since x represents an angle, what should the values on the x-axis be like?
30 60 90 120 150180 210 240 270 300 330 360 390420 450 480 510
0.5
1.0
–0.5
–1.0What’s the:- midline?- amplitude
?- period?
CONSIDER Y = COS(X)
30 60 90 120 150180 210 240 270 300 330 360 390420 450 480 510
0.5
1.0
–0.5
–1.0
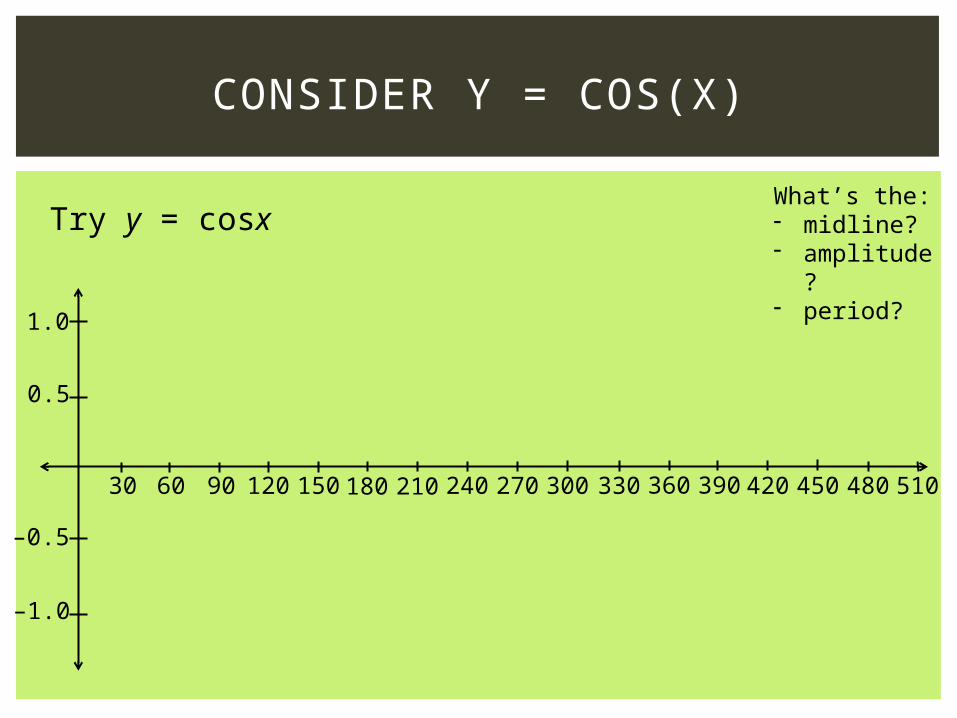
Try y = cosx What’s the:- midline?- amplitude
?- period?

NOW WITH RADIANS
0.5
1.0
𝜋 2𝜋 3𝜋 4𝜋
y = sinx
–0.5
–1.0
NOW WITH RADIANS
0.5
1.0
𝜋 2𝜋 3𝜋 4𝜋
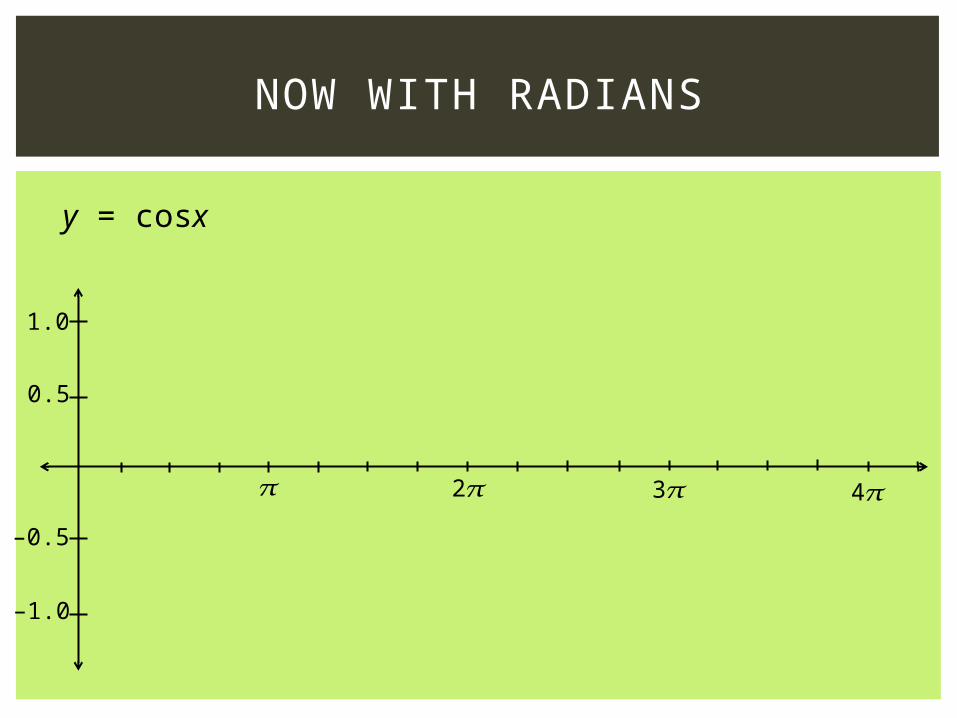
y = cosx
–0.5
–1.0
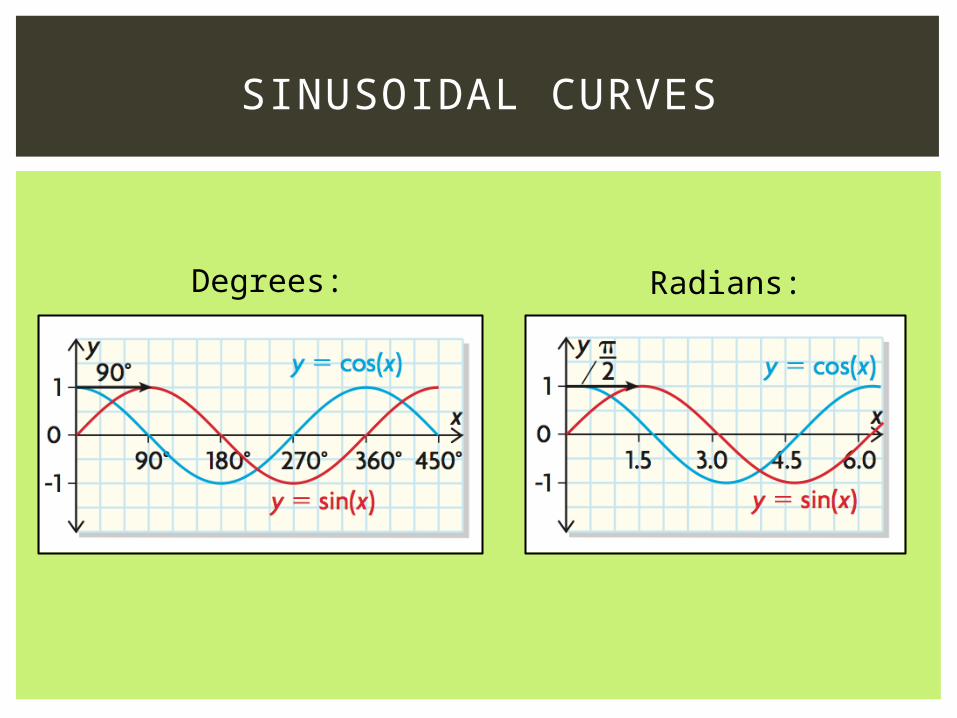
SINUSOIDAL CURVES
Degrees: Radians:
Independent Practice
P. 494-495 #1, 2, 4, 5, 6
Chapter 8
8.3 – THE GRAPHS OF SINUSOIDAL FUNCTIONS
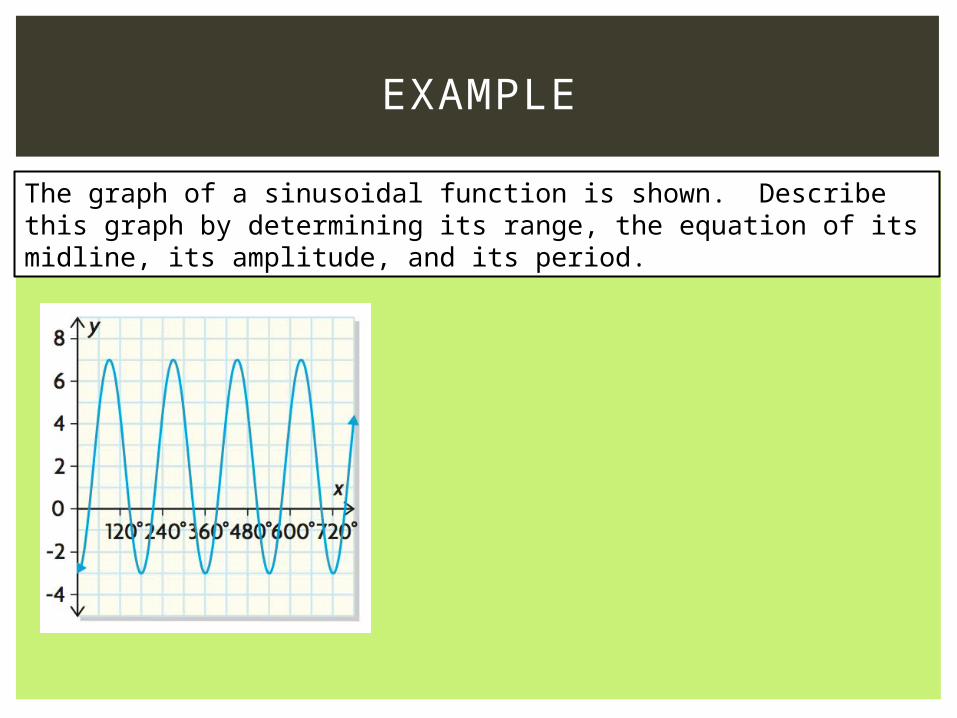
EXAMPLE
The graph of a sinusoidal function is shown. Describe this graph by determining its range, the equation of its midline, its amplitude, and its period.
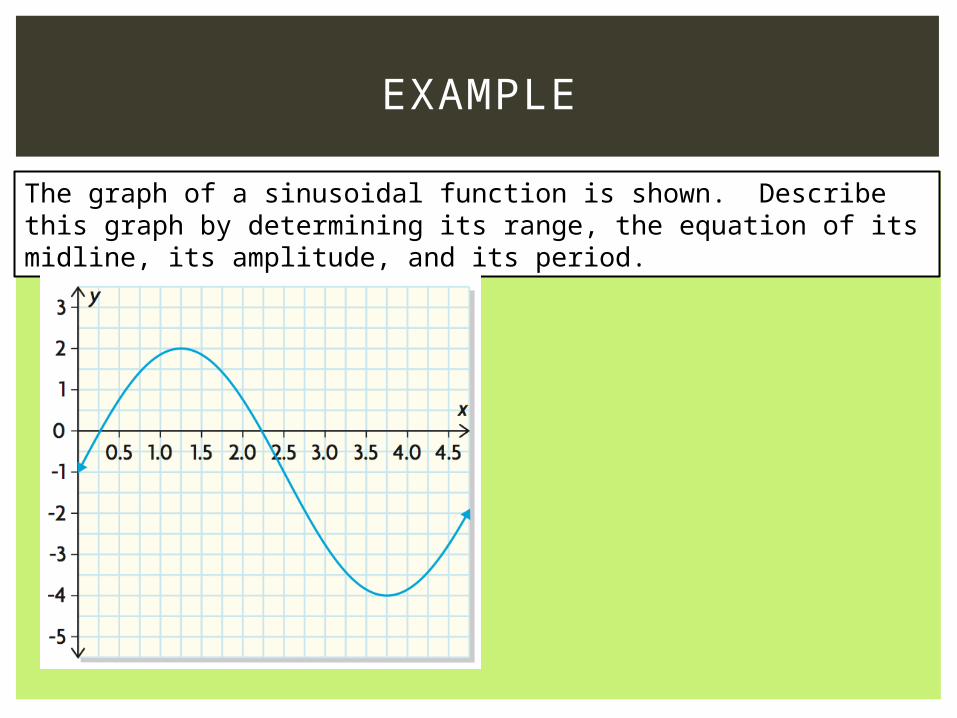
EXAMPLE
The graph of a sinusoidal function is shown. Describe this graph by determining its range, the equation of its midline, its amplitude, and its period.
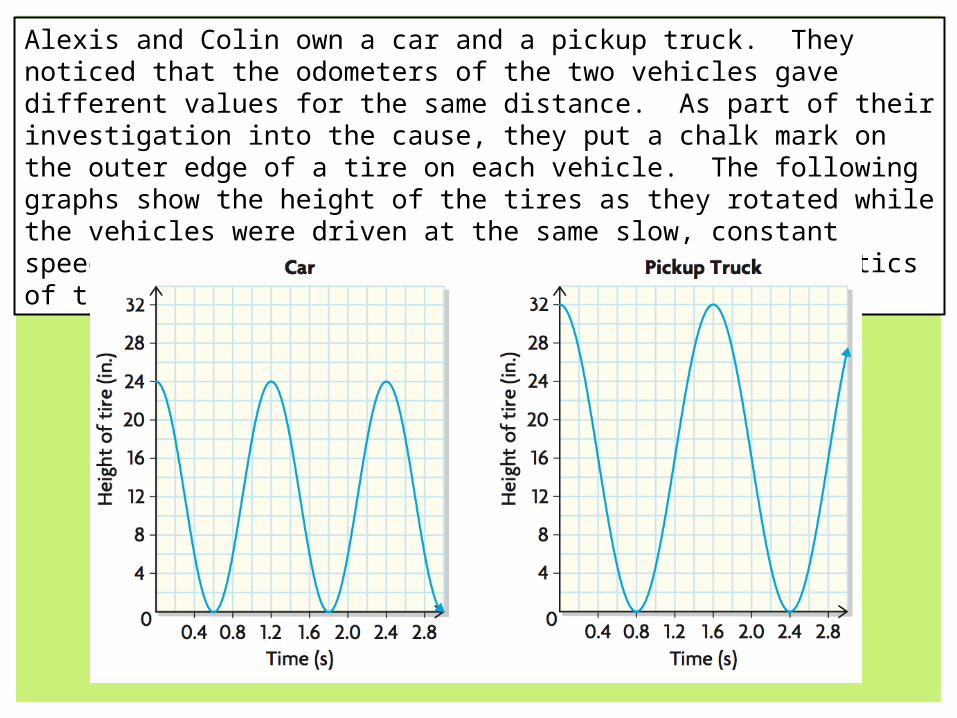
Alexis and Colin own a car and a pickup truck. They noticed that the odometers of the two vehicles gave different values for the same distance. As part of their investigation into the cause, they put a chalk mark on the outer edge of a tire on each vehicle. The following graphs show the height of the tires as they rotated while the vehicles were driven at the same slow, constant speed. What can you determine about the characteristics of the tires from these graphs?
Independent Practice
PG. 508-512, #6, 8, 9, 11, 12, 14
Chapter 8
8.4 – THE EQUATIONS OF
SINUSOIDAL FUNCTIONS
STANDARD FORM
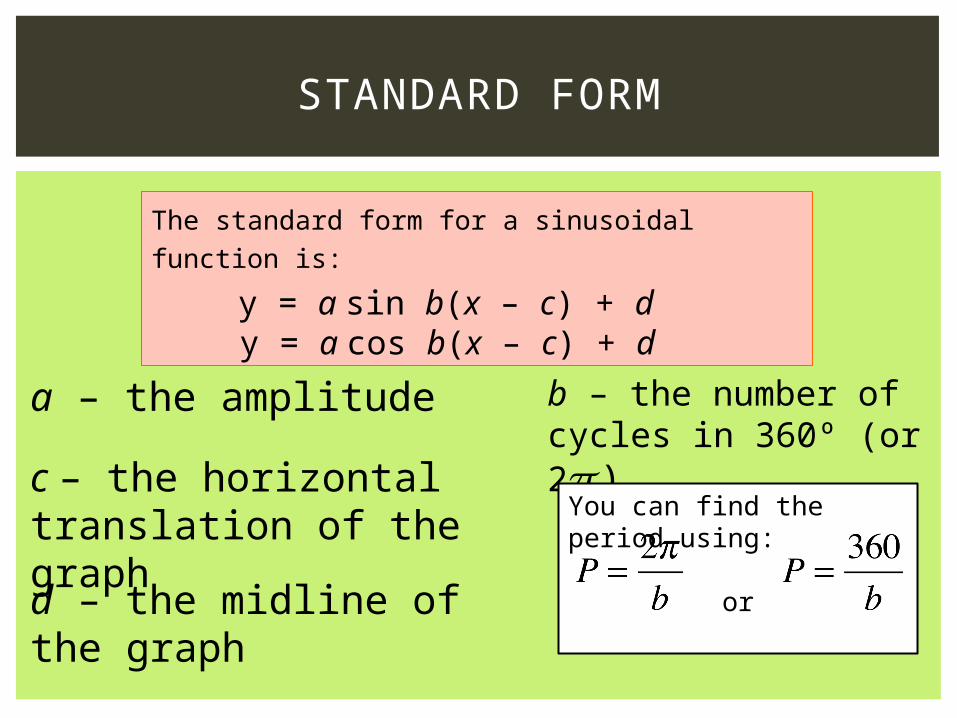
The standard form for a sinusoidal function is:
y = a sin b(x – c) + d y = a cos b(x – c) + d
a – the amplitude b – the number of cycles in 360º (or 2 )𝜋
You can find the period using:
or
c – the horizontal translation of the graphd – the midline of the graph
EXAMPLE
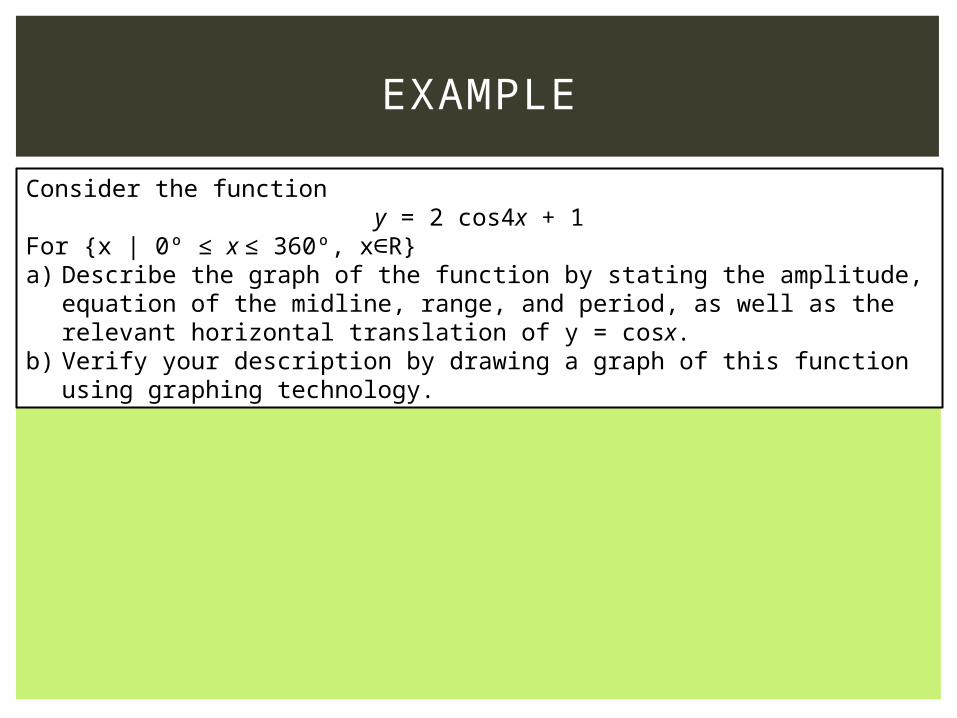
Consider the functiony = 2 cos4x + 1
For {x | 0º ≤ x ≤ 360º, x∈R}a) Describe the graph of the function by stating the amplitude, equation of
the midline, range, and period, as well as the relevant horizontal translation of y = cosx.
b) Verify your description by drawing a graph of this function using graphing technology.
EXAMPLE
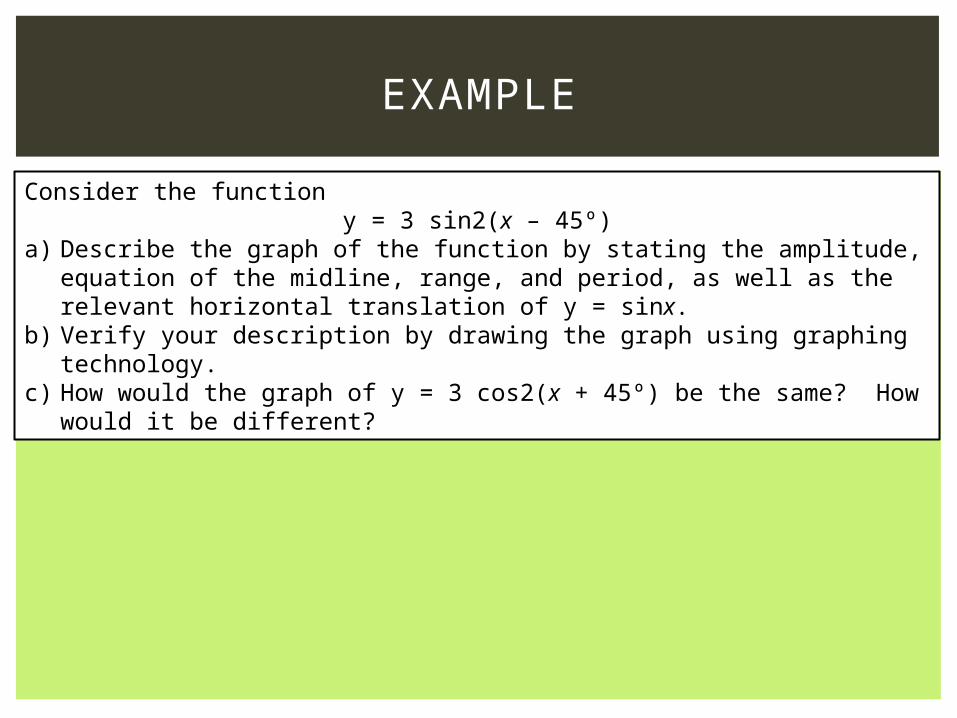
Consider the functiony = 3 sin2(x – 45º)
a) Describe the graph of the function by stating the amplitude, equation of the midline, range, and period, as well as the relevant horizontal translation of y = sinx.
b) Verify your description by drawing the graph using graphing technology.c) How would the graph of y = 3 cos2(x + 45º) be the same? How would
it be different?
EXAMPLE
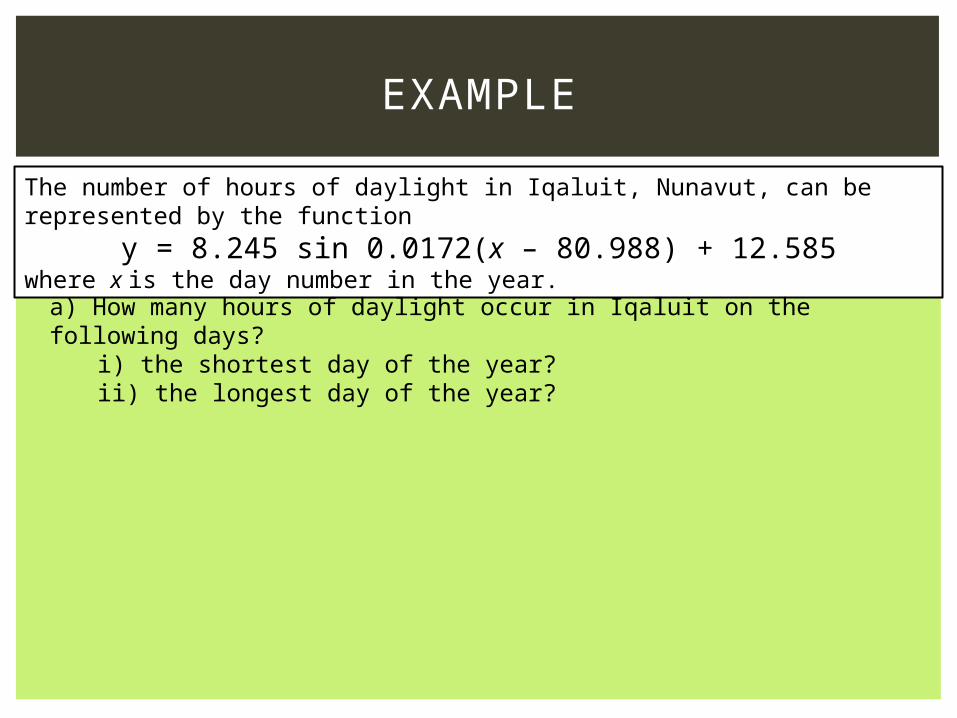
The number of hours of daylight in Iqaluit, Nunavut, can be represented by the function
y = 8.245 sin 0.0172(x – 80.988) + 12.585where x is the day number in the year.
a) How many hours of daylight occur in Iqaluit on the following days?i) the shortest day of the year?ii) the longest day of the year?
EXAMPLE
The number of hours of daylight in Iqaluit, Nunavut, can be represented by the function
y = 8.245 sin 0.0172(x – 80.988) + 12.585where x is the day number in the year.b) In some years, June 21 is the longest day. Suppose that the Sun were to set in Iqaluit at 11:01 pm on June 21. At what time did the sun rise?
EXAMPLE
The number of hours of daylight in Iqaluit, Nunavut, can be represented by the function
y = 8.245 sin 0.0172(x – 80.988) + 12.585where x is the day number in the year.
c) What is the period of this sinusoidal function? Explain how the period relates ot the context of the problem?
EXAMPLE
The number of hours of daylight in Iqaluit, Nunavut, can be represented by the function
y = 8.245 sin 0.0172(x – 80.988) + 12.585where x is the day number in the year.
d) What does the value of c, 80.988, represent in the context of the problem?
Independen Practice
PG. 528–531, #1, 3, 5, 7, 8, 10, 12, 13,
15, 17
Chapter 8
8.5 – MODELLING DATA WITH
SINUSOIDAL FUNCTIONS
EXAMPLE
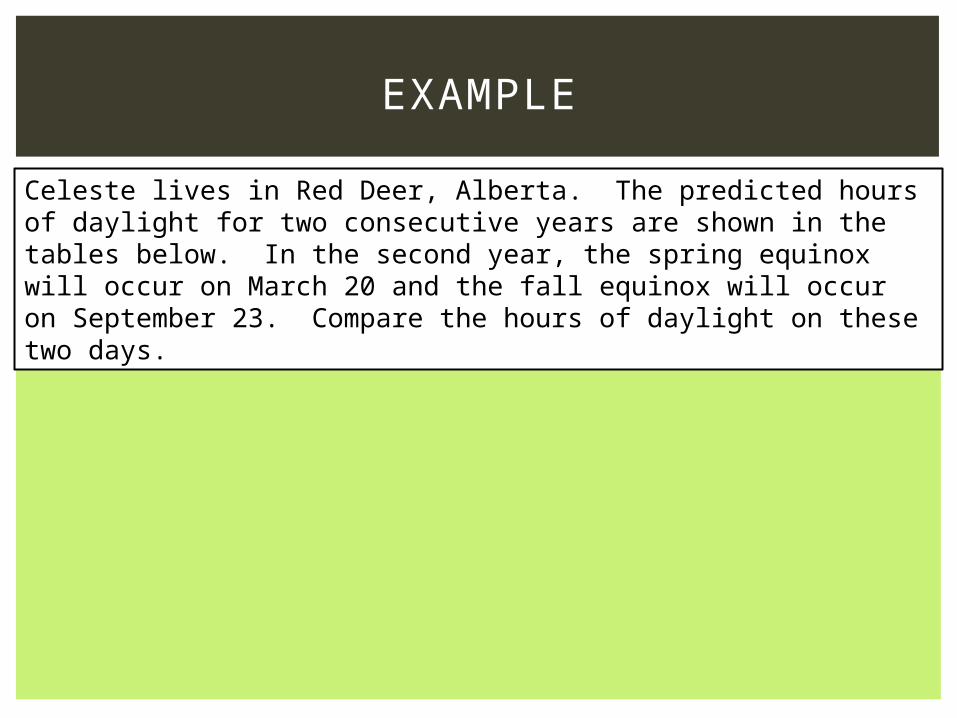
Celeste lives in Red Deer, Alberta. The predicted hours of daylight for two consecutive years are shown in the tables below. In the second year, the spring equinox will occur on March 20 and the fall equinox will occur on September 23. Compare the hours of daylight on these two days.
EXAMPLE
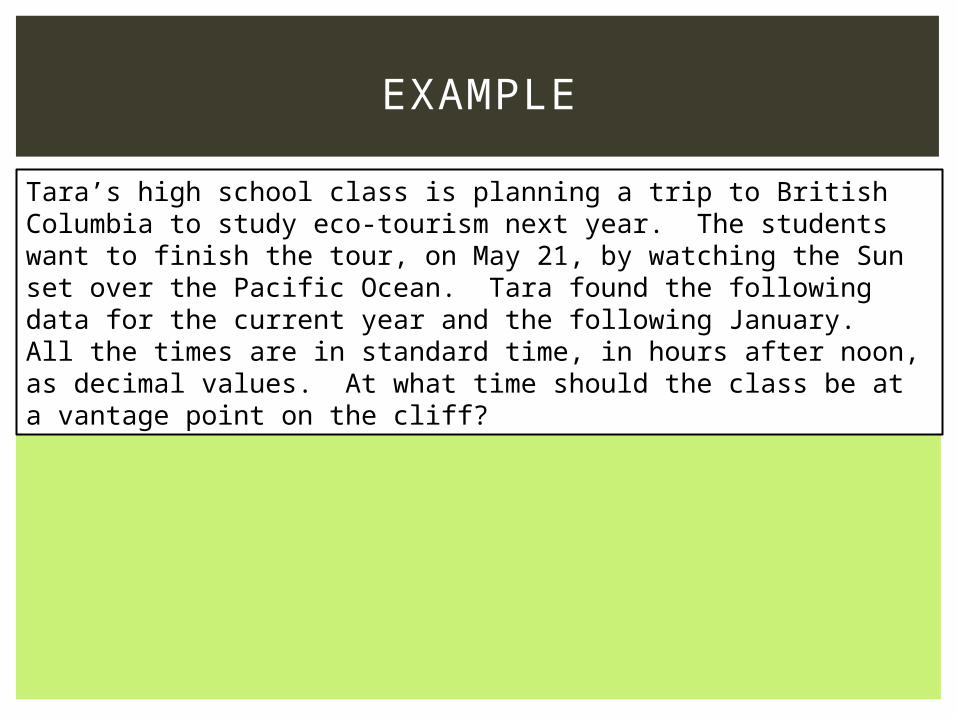
Tara’s high school class is planning a trip to British Columbia to study eco-tourism next year. The students want to finish the tour, on May 21, by watching the Sun set over the Pacific Ocean. Tara found the following data for the current year and the following January. All the times are in standard time, in hours after noon, as decimal values. At what time should the class be at a vantage point on the cliff?
EXAMPLE
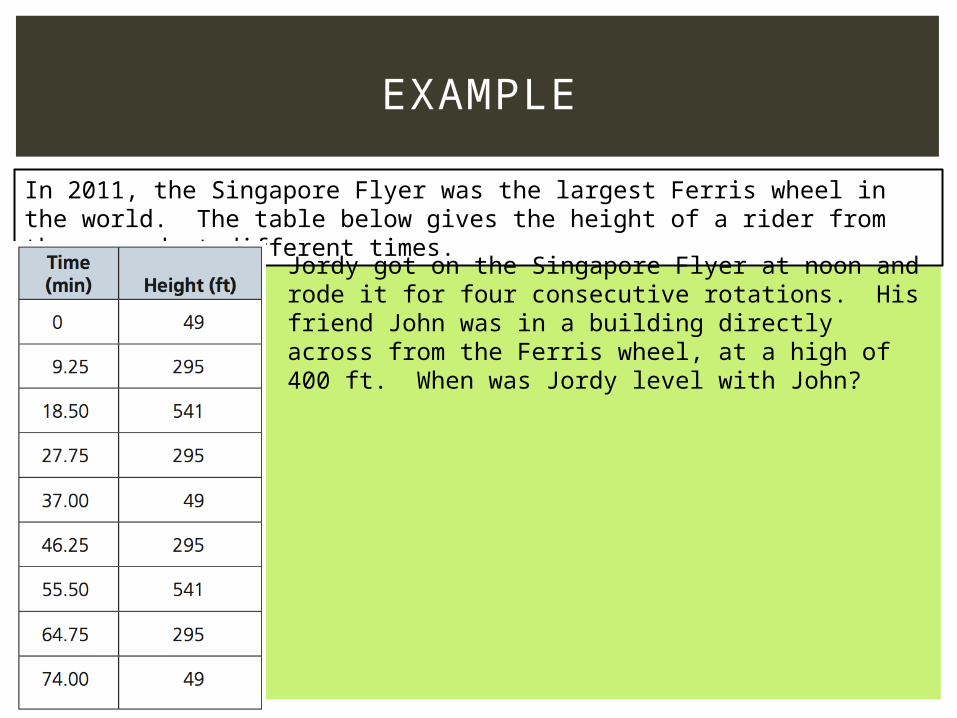
In 2011, the Singapore Flyer was the largest Ferris wheel in the world. The table below gives the height of a rider from the ground at different times.
Jordy got on the Singapore Flyer at noon and rode it for four consecutive rotations. His friend John was in a building directly across from the Ferris wheel, at a high of 400 ft. When was Jordy level with John?