Embed Size (px)
Citation preview
NASA CR-132481
SINTER OF UNIFORM, PREDICTABLE, BLEMISH-FREENICKEL PLAQUE FOR LARGE AEROSPACE
NICKEL CADMIUM CELLS(NASA-CR-132481) SINTER OF UNIFORM, N75-18717PREDICTABLE, BLEMISH-FREE NICKEL PLAQUE FORLARGE AEROSPACE NICKEL CADMIUM CELLS(Heliotek) 75 p HC $4.25 CSCL 10A Unclas
G3/44 11725
by Harvey N. Seiger
HELIOTEK Divison of TEXTRON Inc. SM,9712500 Gladstone Avenue AlSylmar, California 91342
prepared for
NATIONAL AERONAUTICS AND SPACE ADMINISTRATION
under Contract NAS1-10694
NASA Langley Research Center'
Hampton, Virginia
https://ntrs.nasa.gov/search.jsp?R=19750010645 2020-03-16T16:49:31+00:00Z
N 2. Government Accesion No. 3. Recipient's Catalog No.
4. Title and Subtitle 6. Report Date
SINTER OF UNIFORM, PREDICTABLE, BLEMISH-FREE NICKEL February, 1975PLAQUE FOR LARGE AEROSPACE NICKEL CADMIUM CELLS . Performing Organization Code
. Auhor( 8, Performlng Organllation Report No.
Har+ey N. Seiger
9. Performing Organization Name and Address 10. Wok Unit No.
Heliotek Division of Textron12500 Gladstone Ave. 11. Contract or Grant No.Sylmar, California 91342 NAS 1-10694
1 Sponorng 13. Type of Report and Period Covered12. Sponsoring Agency Name and Address Contractor ReportNational Aeronautics and Space AdministrationNASA-Langley Research Center 14. Sponsoring Agency CodeHampton, Virginia 23365
15. Supplementary Notes
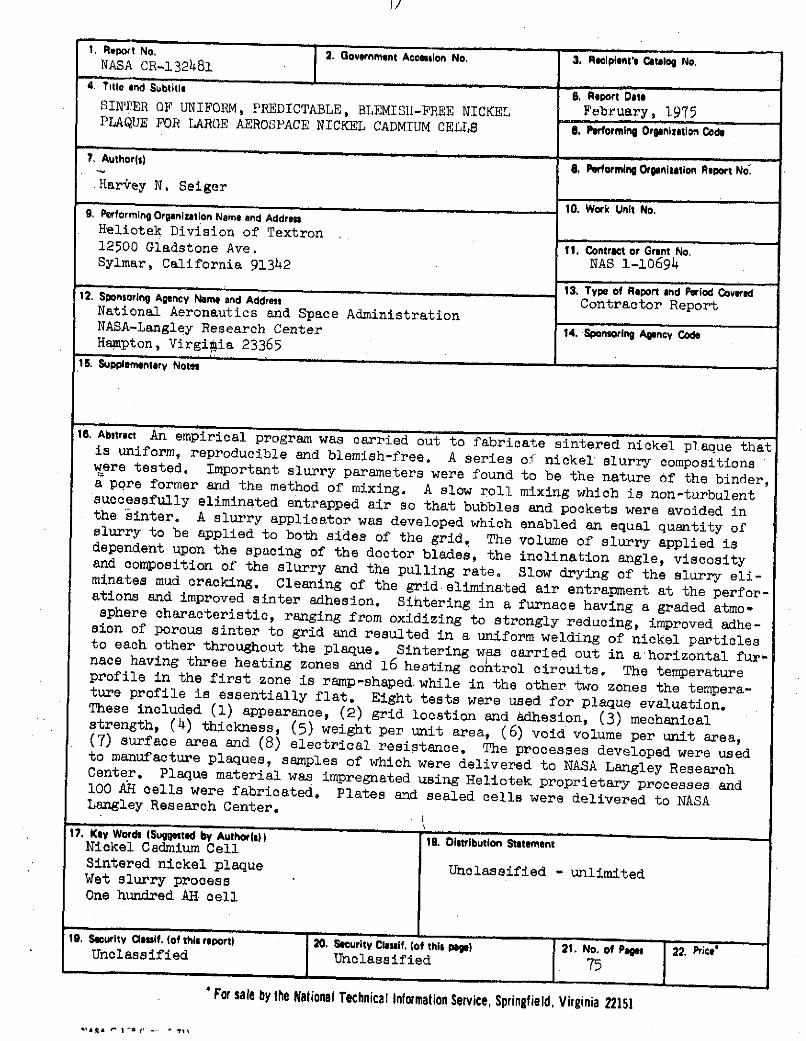
16. Abstract An empirical program was carried out to fabricate sintered nickel plaque thatis uniform, reproducible and blemish-free. A series of nickel slurry compositionswere tested. Important slurry parameters were found to be the nature of the binder,a pore former and the method of mixing. A slow roll mixing which is non-turbulentsuccessfully eliminated entrapped air so that bubbles and pockets were avoided inthe sinter. A slurry applicator was developed which enabled an equal quantity ofslurry to be applied to both sides of the grid. The volume of slurry applied isdependent upon the spacing of the doctor blades, the inclination angle, viscosityand composition of the slurry and the pulling rate. Slow drying of the slurry eli-minates mud cracking. Cleaning of the grid eliminated air entrapment at the perfor-ations and improved sinter adhesion. Sihtering in a furnace having a graded atmo"sphere characteristic, ranging from oxidizing to strongly reducing, improved adhe-sion of porous sinter to grid and resulted in a uniform welding of nickel particlesto each other throughout the plaque. Sintering was carried out in a horizontal fur-nace having three heating zones and 16 heating control circuits. The temperatureprofile in the first zone is ramp-shaped while in the other two zones the tempera-ture profile is essentially flat. Eight tests were used for plaque evaluation.These included (1) appearance, (2) grid location and adhesion, (3) mechanicalstrength, (4) thickness, (5) weight per unit area, (6) void volume per unit area,(7) surface area and (8) electrical resistance. The processes developed were usedto manufacture plaques, samples of which were delivered to NASA Langley ResearchCenter. Plaque material was impregnated using Heliotek proprietary processes and100 AH cells were fabricated. Plates and sealed cells were delivered to NASALangley Research Center.
17. Key Words (Suggested by Author(s)) 18. Distribution StatementNickel Cadmium CellSintered nickel plaque Unclassified - unlimitedWet slurry processOne hundred AH. cell
19. Security rassif, (of this report) 20. Security Clasilf. (of this page) 21. No. of Pages 22. Price'Unclass ified Unc las sified 75
* For sale by the National Technical Information Service, Springfield. Virginia 22151
NASA CR-132481
Sinter of Uniform, Predictable, Blemish-Free
Nickel Plaque for Large Aerospace Nickel Cadmium Cells
by
Harvey N. Seiger, Heliotek/Textron
Prepared under Contract NAS1-10694
Heliotek, Division of Textron Inc.
12500 Gladstone Avenue
Sylmar, California 91342
for
National Aeronautics and Space Administration
TABLE OF CONTENTS
PAGE NO.I SUMMARY 1
II INTRODUCTION 3
III EXPERIMENTAL 5
IV TEST PROCEDURES 25
V TEST RESULTS 41
VI 100 AH CELL DESIGN 51
VII NEW TECHNOLOGY 64
VIII CONCLUDING REMARKS 67
IX RECOMMENDATIONS 69
X ACKNOWLEDGEMENTS 70
XI APPENDIX 71
iii
LIST OF FIGURES
FIGURE PAGE NO.
1 Grid Cleaning Apparatus 7
2 Stainless Steel Drum and Roller Bearing 14
Mill for Slurry Deaeration and
Homogenizing
3 Moyno Pump Modified for Sluriy 16
Transfer
4 Grid coating Apparatus 17
5 Horizontal Sintering Furnace 20
6 Temperature Profile in Sintering 22
Furnace
7 Plaque Cutting Shears 24
8 Plaque Hardness Testing Apparatus 29
9 Test Cell for Double Layer Capacitance 32
Measurements
10 Experimental Set-up For Voltage Step 33
Measurements
11 Current-Time Behavior as a Function 35
of Biased Pulse Base Potential
12 Current-Time Response as a Function 36
of Voltage Pulse Amplitude
13 Peak Current as Function of Voltage 37
Pulse Amplitude
14 Multipoint Resistance Probe 39
15 Discharge Curve 57
16 Discharge Curve 58
17 Effect of Charge Rate on Capacity 60
18 End of Charge Pressure 61
19 Pressure Decay 62
A:.l-a Capacity Dependence on Sinter Porosity 73
iv
LIST OF TABLES
TABLE PAGE NO.
1 Basic Material for Porous Nickel Plaque 4
1A Slurry Compositions for Plaque 11
2 Target Parameter for Sintered Plaque 42
3 Facterial Experiment for Sintering Positive 43
Plaque
4 Summary of Plaque Measurements 44
5 Summary of Data Analysis 46
6A Plaque Processed for 100 AH Cells 48
6B Negative Electrode Impregnation Data 49
6C Positive Electrode Impregnation Data 50
7 HNC 100.3 Cell Design 54
V
Sinter of Uniform, Predictable, Blemish-Free
Nickel Plaque for Large Aerospace Nickel Cadmium Cells
by
Harvey N. Seiger, Heliotek/Textron
SUMMAR Y
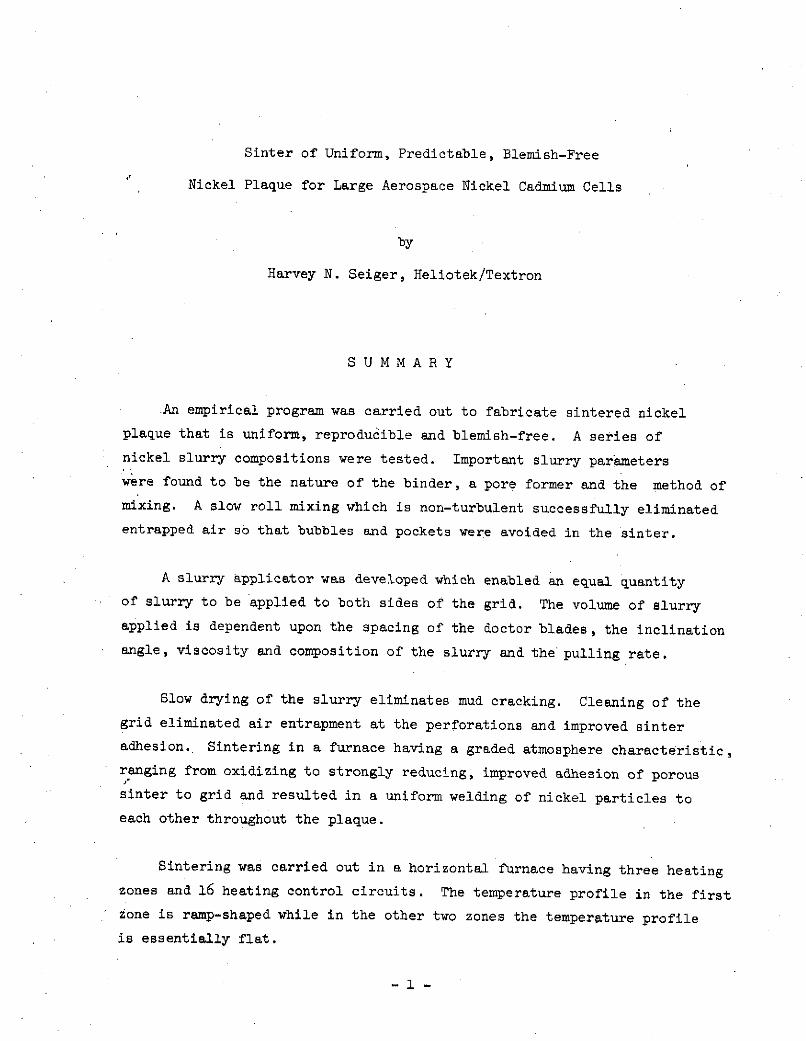
An empirical program was carried out to fabricate sintered nickel
plaque that is uniform, reproducible and blemish-free. A series of
nickel slurry compositions were tested. Important slurry parameters
were found to be the nature of the binder, a pore former and the method of
mixing. A slow roll mixing which is non-turbulent successfully eliminated
entrapped air so that bubbles and pockets were avoided in the sinter.
A slurry applicator was developed which enabled an equal quantity
of slurry to be applied to both sides of the grid. The volume of slurry
applied is dependent upon the spacing of the doctor blades, the inclination
angle, viscosity and composition of the slurry and the pulling rate.
Slow drying of the slurry eliminates mud cracking. Cleaning of the
grid eliminated air entrapment at the perforations and improved sinter
adhesion. Sintering in a furnace having a graded atmosphere characteristic,
ranging from oxidizing to strongly reducing, improved adhesion of porous
sinter to grid and resulted in a uniform welding of nickel particles to
each other throughout the plaque.
Sintering was carried out in a horizontal furnace having three heating
zones and 16 heating control circuits. The temperature profile in the first
zone is ramp-shaped while in the other two zones the temperature profile
is essentially flat.
- -
Eight tests were used for plaque evaluation. These included
(1) appearance, (2) grid location and adhesion, (3) mechanical strength,(4) thickness, (5) weight per unit area, (6) void volume per unit area,
(7) surface area and (8).electrical resistance.
The processes developed were used to imanufacture plaques, samplesof which were delivered to NASA Langley Research Center. Plaque material
was impregnated using Heliotek proprietary processes and 100 AH cells werefabricated. Plates and sealed cells were delivered to NASA Langley
Research Center.
- 2 -
INTR 0 DUCTION
The obtaining of highly reliable secondary nickel cadmium battery
cells capable of a long cyclic life is a difficult problem that appear
to increase as the size of the cell is increased. Although there were
a number of large active efforts to evaluate the problems associated
with the application of large capacity nickel cadmium cells, such as
100 ampere hour, to space stations and communication satellites, there
are only a few.small programs attempting to improve the cell components.
It has been generally agreed however, that in order to achieve the high
performance, high reliability, and long cycle life (5 years or longer)
desired for space stations, a means must be found to produce a much more
uniform, consistent, defect-free, and controlled product than is presently
being made available by the manufacturers.
The primary objective of this program is to develop the procedures,
processes and controls, and select the materials and equipment necessary
to determine the production methods needed to secure uniform, consistent,
and defect-free plaque material.
The bodyv of this report deals with the means by which the objective
was pursued and met. Table 1 identifies the basic materials reauired to
fabricate plaque. Development of methods necessary to produce high quality
plaque was based on characteristics of these basic materials.
- --

Table 1
0sio M .Ltesrials for Porous Nickel Plaque
Nickel powder
Binder
Alcohol
Water
Pore Former
Nickel Grid
EX PERIMENTAL
A. Nickel Grid
A contractual requirement was that the grid be nickel and that the
plates have an integral tab. The grid selected was of 3 mil nickel,
alloy 200, perforated with a square array of holes having diameters
0.045 inch on 0.066 inch centers. The open area calculated is 37%,
but a weight determination indicated that the open area is 40%.
The three mil grid is preferred over 5 mil stock which was also con-
sidered. The thinner stock has sufficient strength for the process as
developed and yields a better ratio of void volume to nonactive mass.
The importance of void volume will be discussed more fully later.
The weight of the 3 mil grid material used is 40.7 mg/cm2 which
may be compared to 36.6 mg/cm2 for nickel wire screen having 7 mil wire
and a 20 x 20 mesh. Wire mesh is difficult to make flat, place into
the center of plaque and also has a propensity for short circuiting by
protruding wires. The last comment precludes its use as being incom-
patible with highly reliable cells unless special steps are taken to
overcome the problem.
As received the unperforated portions of the grid are still soft
annealed, while the perforated portion has been stretched and is work-
hardened by the perforation process. This condition results in plaque
that is not flat. To overcome this problem the material is stretched
to equalize the work hardening.
In order to stretch the grid material the grid is cut into 100 foot
lengths and the ends soldered-around a pipe. One end is secured to a
stanchion and the other end pulled to just beyond the yield point.
Stretching is continued until a permanent elongation of 0.25% (3 inches)is achieved. The grid material is now flat and is rolled up on a drum
after disposing of the two soldered ends. For larger volume needs, an
-5-
automatic work hardening process could be readily substituted for the
manual process just described.
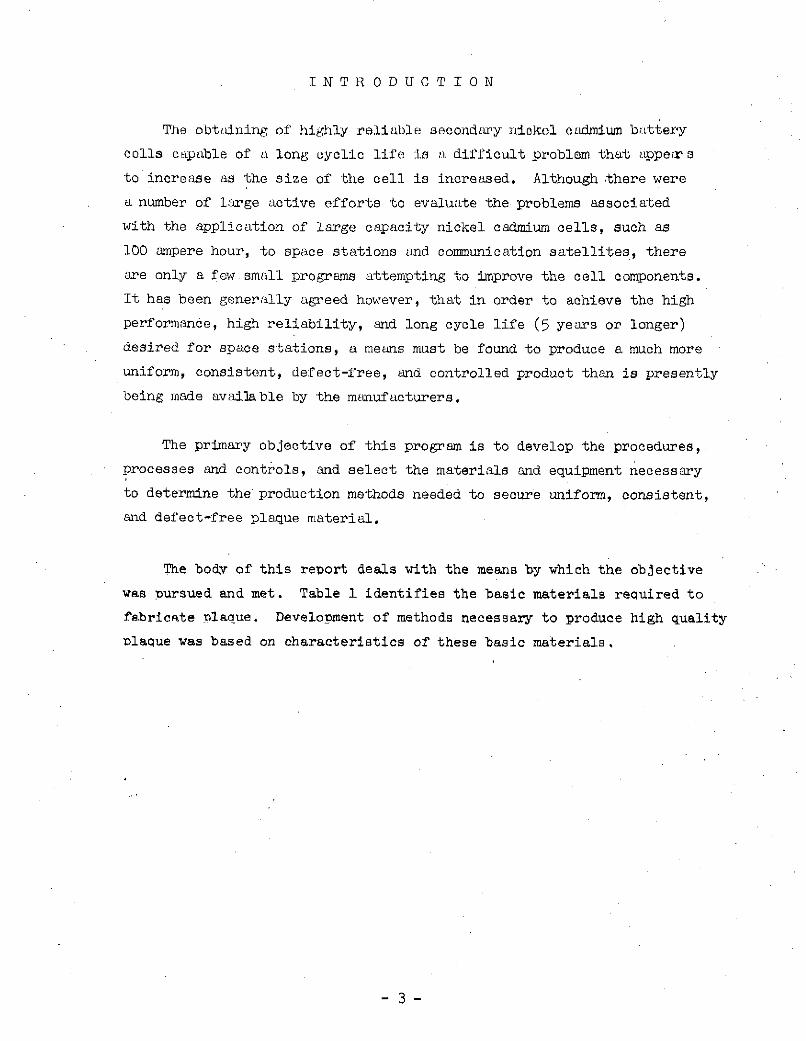
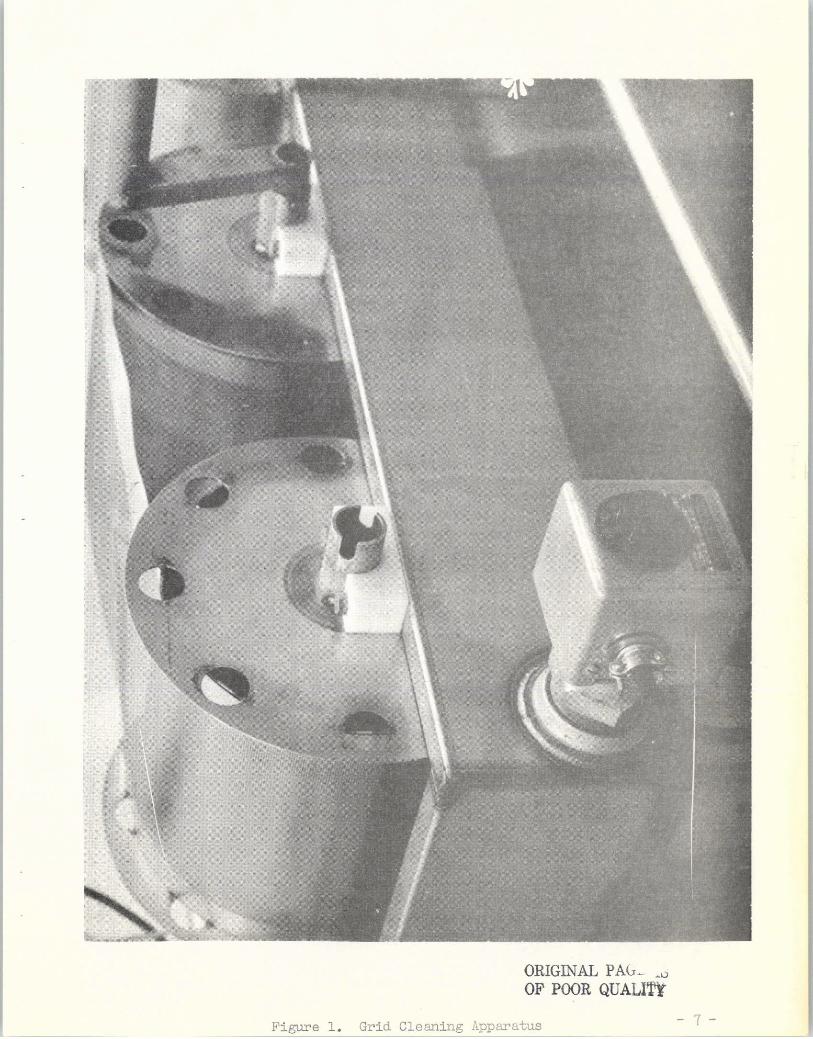
The grid is next cleansed. The apparatus used is shown in Figure 1.
It is a stainless steel tub having two rollers, and is facilitated for
heating. The grid is mounted on one roller. The tub is filled partly
with trichloroethylene and the grid rolled through at 1 foot per minute.
Next an alkaline cleanser, is used (MacDermid Metalex-W-Special). Concen-
tration is 6 ounces of cleaner per gallon of solution which is heated to
600C. The grid is rolled through the solution at 1 foot per minute
and then rinsed with a deionized water spray. Following this procedure
water adherance to the grid is uniform.
The final cleansing step is made with a 3.3% hydrogen peroxide solution
brought to pH 11 or higher with ammonium hydroxide. (1 ) The solution is
heated to 70 C and the grid rolled through at 1 foot per minute. The grid
is then washed and dried using hot air. Once cleaned the grid will hold
a film of water without breaking for at least 15 seconds.
The two processes previously described, that of stretching and work
hardening and cleaning, are responsible for flat plaques that preclude
air entrapment during slurry application and also improve adhesion of
sinter to the nickel grid. At this point the grid.is ready for coating.
B. Pore Former
The active materials present in plates undergo density changes during
charge and discharge. This is especially severe in the case of the positive
electrodes because the active material is aggregated on the walls of the
interstices. Discharging appears to stress the welded particles. To resist
(1) D. 0. Feder and D. E. Koontz, Symposium on Cleaning of ElectronicDevice Components and Materials, ASTM Special Technical Publication 246,p. 40, 1959.
- 6 -
nH
0A
aA
H~
0i
OI &d
~T
oc
0 Ix
J
these stress conditions a strong sinter is required. Strong sinters can
be achieved by using high sintering temperatures, but high sntering
temperatures decrease porosity.
There are two simple approaches to achieving strong sinters without
sacrificing porosity. One is to use a carbonyl powder of smaller needle
size, and the other approach is to use a pore former. There appears to
be more ability to control the process with a pore former.
Pore formers, or fugatives, are not new in sintering processes.
Camphor, sawdust, flour, and ammonium carbonate have been used in the dry
powder plaque production processes, while sawdust and flour have been
employed in wet slurry plaque processes. There is alcohol in some slurriesthat precludes the use of camphor, and ammonium carbonate is water soluble.Sawdust and flour swell in water and are not of controlled size. Flour
and sawdust also yield a large amount of carbon as a residue and becomeunsuitable from that point of view.
It had been decided that the slurry method was preferred over thedry powder method. There are two reasons for this choice. The first isuniformity--nickel powder has poor flow characteristics and as a result auniform surface has just not been obtained over large areas. The secondreason is that the utilization of positive active material had been foundto be 120% in this laboratory on purchased slurry-processed plaque comparedto 105% for purchased loose-powder processed plaque.
None of the pore formers mentioned earlier meet the requirements foruse in slurry process containing both alcohol and water. A literaturesearch revealed only one potential pore former which is oxamide(H2N OC-CO NH2 ). Oxamide is but slightly soluble in water, insolublein alcohol, decomposes into gaseous products at 4190 C, is relativelyinexpensive and is readily sieved to obtain a suitable particle size.The residue from pyrolysis in the reducing atmosphere furnace is 0.2%.
- 8 -
Oxamide is the material selected as a pore former. It is sieved through
a 200 mesh screen prior to adding it to the slurry mix.
C. Binders
A total of 6 binders were investigated in this program. These were
namely:
Pluoronic 127
Klucel
Carboxy methyl cellulose (CMC)
Methocel 400
Methocel 1500
Polyox
Pluoronic makes water thixotropic, but the concentration needed was 20%
to achieve this situation and was ruled out. At a 20% level, costs are high,
handling difficult and residue is excessive. Klucel and CMC allowed the
slurry to settle out too rapidly while Methocel 1500 and Polyox exhibited
good settling characteristics. Polyox however, can be deaerated more
readily and has good mixing properties. The good mixing characteristics
are imparted by the dispersion of the material in alcohol and its subsequent
dissolution in water. The selection of binder was pdlyox, but either
methocel could be readily substituted. 'It is easier to disperse and dissolve
polyox which is done at room temperature, than to cool and later heat the
methocel materials.
_ _ Polyoxmust be mixed with special precautions because it undergoes
shear degradation and precipitates out of hot solutions. The -precipitation--------
results in a loss of its binding ability. When green plaque was dried
above 70 C, the nickel powder fell off the grid. Because of this phenomenon
it was found that drying of the slurry must be carried out below 700C.
-9-
The green plaque once dried at room ambient temperature is fairly supple
and need not be fired immediately. This "handlability" is apparently of
long duration. Instead of drying at a low.temperature, however, one
might consider applying the slurry to only one side of the grid and
drying more rapidly. There are advantages to this latter technique
when considering cell designs other than flat plate.
One might note that the loss of binding ability or recrystallization
would occur in the furnace at some point. At this point the green
plaque must be in a metastable state. Further consideration reveals
analogous situations regardless of the binder because pyrolysis occurs
at lower temperatures than nickel sintering.
D. Slurry Composition
The volume of slurry applied per unit area of grid is a function of
doctor blade spacing, viscosity of the slurry and the density of nickel
powder in the slurry. A literature search and preliminary experiments
indicated that a nickel powder content of about 60% is a workable level.
The viscosity is determined by the content of the binder, the way
it is mixed, the way the slurry is handled, and by the total composition
of the slurry. The water content and nickel content are particularly
sensitive to composition. A 1% change in water content makes a dramatic
change in viscosity.
Based upon early findings on purchased plaque, targets had been
set up for sinter porosities. These were 75% for positive plaque and
78% for plaque used for the negative electrode. To attain these
porosities in well-sintered plaque two different slurry compositions
were developed. These are given in Table 2.
Recent evidence appears to indicate that utilization of active
material is a function of the porosity of plaque. Preliminary calcu-
- 10 -
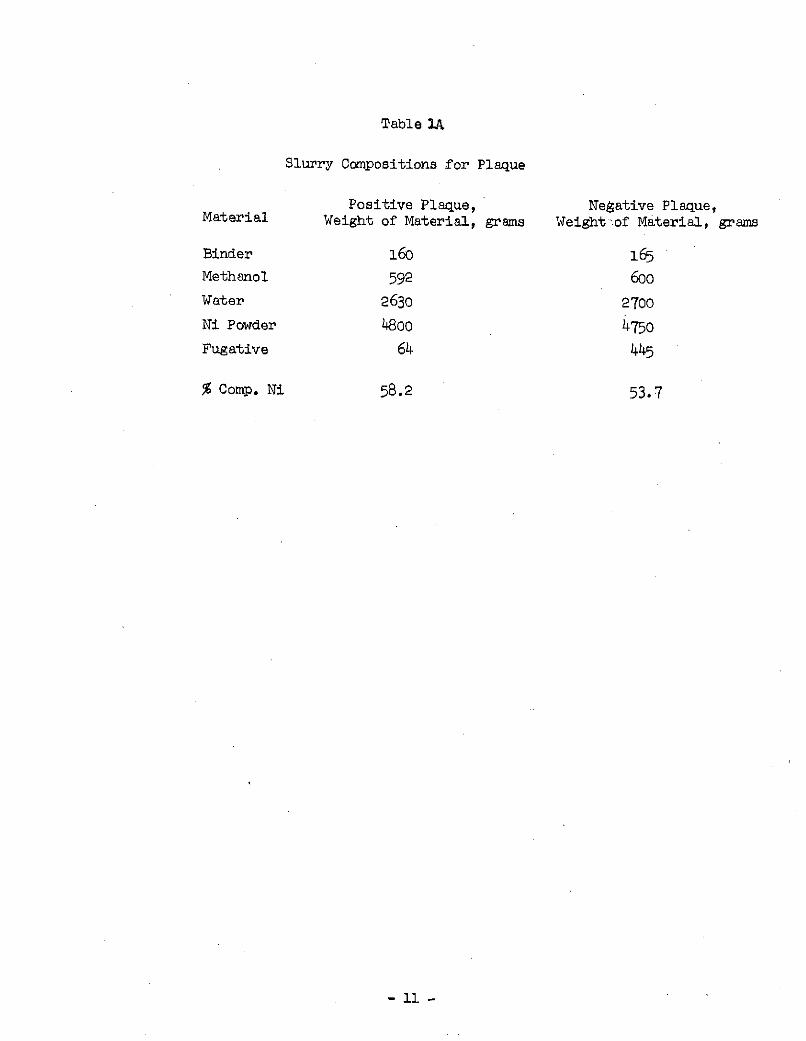
Table IA
Slurry Compositions for Plaque
Positive Plaque, Negative Plaque,Material Weight of Material, grams Weight of Material, grams
Binder 160 165Methanol 592 600
Water 2630 2700
Ni Powder 4800 4750
Fugative 64 445
% Comp. Ni 58.2 53.7
- 11 -

lations suggest that a sinter porosity of 78% will maximize capacity
per unit loading. Thus, the compositions indicated which were used to
fabricate plaque and cells therefrom, can be subject to improvement.
The basis for these statements are given in the Appendix.
- 12 -
E. Mixing
The subject of mixing the slurry is indeed important. Not only are
the materials to be dispersed uniformly without agglomeration, but the
characteristic of the materials must remain unchanged, and the mixture
must be free of air bubbles.
The nickel powder and the binder are both affected by shear forces.
The nickel crystals break and change particle size, while shearing reduces
the molecular weight of the binder used.
The slurry is started by dispersing the binder in methanol. These
are stirred magnetically until the powder is completely wetted and well
dispersed. The alcoholic dispersion is then slowly added to water with
rapid stirring. As the mixture thickens, the stirring speed is diminshed.
The mixture is allowed to rest and thicken for another hour before its
viscosity is measured.
The nickel powder and the pore former are blended into the water-
alcohol-binder solution. These are blended until both powders are
wetted. This mixing step is carried out in a stainless steel roller
drum shown in Figure 2. The drum is then sealed and rolled at 0.2 to
1 RPM for 16 to 24 hours. The viscosity "is then measured and adjusted
to 200,000 + 50,000 cps (Brookfield Helipath TC spindle at 2.5 RPM).
The drum is never filled to more than 2/3 capacity.
The slow rolling is not a uniform rolling. As the viscous material
rises up the wall of the drum, the torque applies a back force which
slows down the rotation. A layer of slurry then rolls over the bulk of
the slurry, and the slurry thus deaerates. The slow rolling appears to
be a setter method for deaeration than using a vacuum or stirring slowly.
The rolling does essentially the same task as slow stirring, but on a
longer time basis which allows a more complete elimination of entrapped
air. The evidence for the successful deaeration lies in the macroscopic
and microscopic uniformity of the plaque which is virtually free of
pock marks ascribed to air bubble entrapment.
- 13 -
PAGE IS_. ~~~~
ORIGNApAEIOF pOOR QUAkLITY
Figure 2. Stainless Steel Drum and Roller Bearing Mill -1
for Slury Deaeration. and omogenizing
The prepared slurry can be stored for months. Prior to use, the
slurry should be rolled for several hours to ensure homogeneity, and
the viscosity rechecked.
The contents of the drum are transferred to a Moyno pump shown in
Figure 3. The pump pushes the slurry into the applicator bucket without
mixing in air bubbles. The pumping rate is controlled by level switches
in the applicator bucket. A fraction of the slurry is recirculated
through the pump to ensure homogeniety of the mix and uniformity between
the beginning and end of a run. In this way the use of the Moyno pump
is minimized. The push type mechanism in a Moyno pump does shear both
the nickel powder and the binder. For this reason the pump is used
only for transfer and not for mixing. When used for mixing it is
observed that the viscosity of the slurry decreases. Hence, the mini-
mization of the use of the pump. It has been integrated into the
process in such a way that its good characteristics are maximized and
its poor characteristics are minimized.
F. Green Plaque
The green plaque is made on a grid coating apparatus shown in
Figures 4 A and B. Among various methods tried during the course of
the work were (1) spatulation, (2) spray coating, (3) electrostatic
spraying and (4) slip casting. The slip casting process was the method
of choice even though it represents no major change from processes in
present use. An analysis however, was made of the objectives of the chosen
process for possible improvements. As a result of the analysis the
coating apparatus shown in Figure 4A was designed and fabricated.
The level of the slurry in the slurry bucket is closely controlled
for it is important to maintain the proper level. To control this level
a float is employed. This float is located just below the grid feed
roll in Figure 4B. It operates microswitches for upper and lower limits,
which in turn control a solenoid that controls slurry feed rate. The
- 15 -
r-I I
~LZ
LO
1%
CO60
*H .r-
.r-0l
:~~~ge' ~~""~"~,'---I
"-'-:";
~ra~E-
'+
~:,*,~~,, ~ ELE:,yI
?~
cz.~ ~
~~or;-. :i:
8~irar-- ."~* *
~ c
V ~
~ ?
V
CF
7
0-
H_;
.~~
;_~
,;.
; I_
:__:
_:;_
;::
:_;
_ L
dY
Figufe 4~B O)F POOR QIJALITy
slurry level must be controlled because it effects the amount of material
placed on the grid.
The grid material, on its roller, is mounted on the machine.
The grid enters the slurry slowly so that air is not entrapped. Further,
the grid circles a 12 inch diameter drum immersed in the slurry. This
effectively pumps slurry through the openings. The slow immersion speed
avoids turbulence and aeration.
The grid material then enters the doctor blade fixture. Part of
this fixture is located in the slurry, and contains teeth set at 1/2 inch
intervals. The purpose of the teeth is to center the grid. The distance
between the plane of the two sets of teeth is 4 mils so that the grid is
centered to within t 0.5 mils. The spacing between the doctor blades is
adjustable by means of two micrometer drives. The doctor blades are
parallel to within 0.5 mils to ensure uniformity of thickness. The rake
angle of the blades is also important in setting plaque thickness, a
rake angle of 100 is used which was determined empirically.
Plaque is pulled in the ascending mode by a chain drive mechanism
having an extremely uniform pulling rate. The uniform pulling rate helps
maintain the blemish-free and uniform characteristics. It is then
allowed to dry in a vertical position below 700 C. The drying parameters
are dictated by the binder characteristics. Once dry, the green plaque
may be stored for months before sintering with only reasonable care
required to avoid damage.
G. Sintering
The sintering furnace is conveyor belt driven in a horizontal plane
as shown in Figure 5. The furnace is 28 feet long, with heating in 3
zones with 16 silicon control rectifier circuits (SCR) and two cooling
zones. The belt speed is adjustable between zero and 20 inches per minute.
- 19 -
0 -
0 C
01O
.c.(H
a)0 -(7c-i
4)"H
~~~~Z%
N0°a)I
The SCR circuits were originally designed to provide temperatureuniformity. However, because of the organic binder and pore former,
and the necessity of an oxidizing atmosphere region, the temperature
profile at the entrance should be ramp-shaped. An actual temperature
profile is shown in Figure 6. A thermocouple was imbedded into a plaquethat was placed on the belt and temperature readings taken during
the passage through the furnace.
The pore former used in the slurry decomposes into gaseous products
at 419 0C. The binder also pyrolyzes below the actual sintering temp-erature of 9250 C. The reducing atmosphere gases are dry. To obtain
a well sintered plaque some oxygen must be introduced to form an oxide
monolayer on the nickel. There is, therefore, an oxidizing condition
set up at the lower temperature region of the furnace. Similar processesutilize moisture and measure dew point. At elevated temperatures nickel
is oxidized by water molecules. When the yet higher temperature regionis reached the nickel is reduced by the dry hydrogen gas present. Ifsintering is carried out without an oxidizing atmosphere, the degree ofsintering from the surface to the grid decreases. This results in anover-sintered surface and an undersintered region next to the grid withpoor adhesion of sinter to the grid. With a proper oxidizing atmospherethe degree of sintering is strong, uniform and adhesion to the grid isstrong. The oxygen flow rates and hydrogen flow rates were determinedempirically. The oxygen flow rate is Judged from the behavior ofthe gases in the furnace which is made apparent by diffraction of light.The hydrogen flow rate is next set on the behavior of the sinter asmeasured by electrical resistance and adhesion.
When running plaque thru the furnace, it was found necessary toplace a carrier between the plaque and the steel moving belt. Wherethe belt links contacted the plaque blemishes occurred. These smallcontact areas on the plaque did not appear to be sintered to the uamedegree as the rest of the plaque.
- 21 -
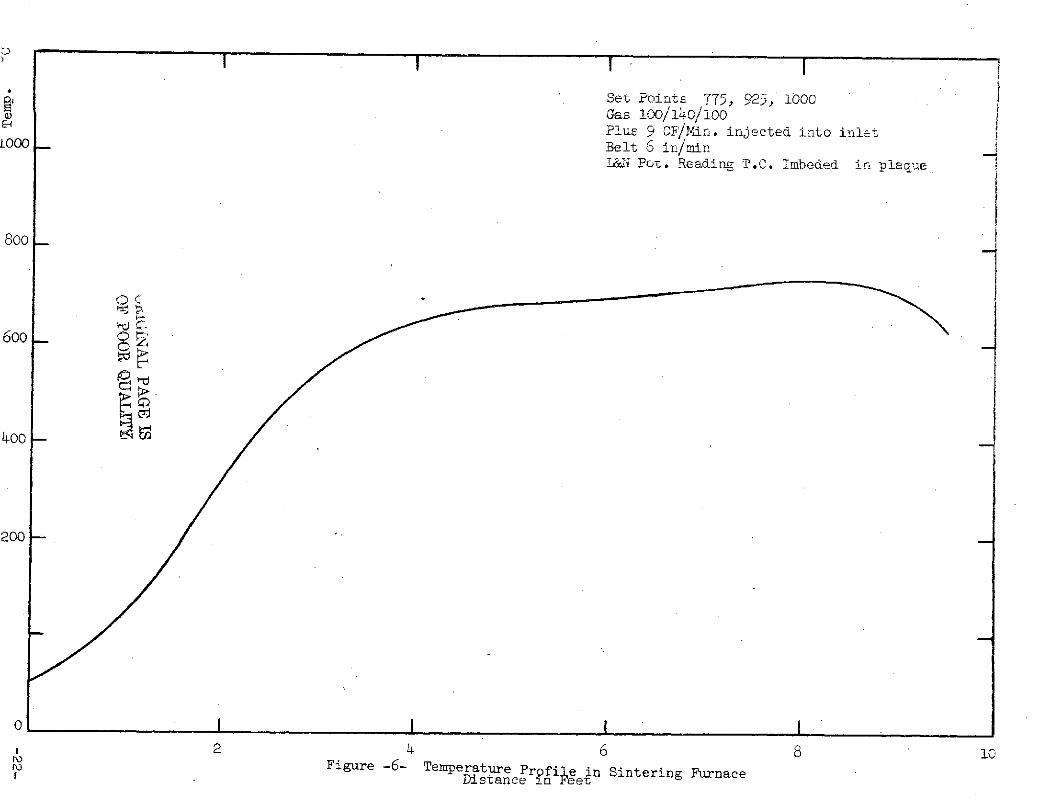
Set Points 775, 925, 1000Gas 100/140/o00Plus 9 CF/in,. injected into inletLOOO -- Belt 6 in/min
~ Pot. Reading T.C. Imbeded in plaque
800
600
400
200
1 2 4 6 8 10Figure -6- Temperature Profile in Sintering FurnaceDistance in Feet
Two carriers used successfully are woven quartz fabric and
inconel sheets. The material of choice is quartz. Since the thermal
expansion coefficient of nickel and inconel differ, there is a "walk"
of nickel with respect to the inconel which leaves surface blemishes
when long sheets are used. Since these blemishes do not look well,
inconel is used only for small plaques where "walk" is minimal and
the cosmetic blemishes do not appear.
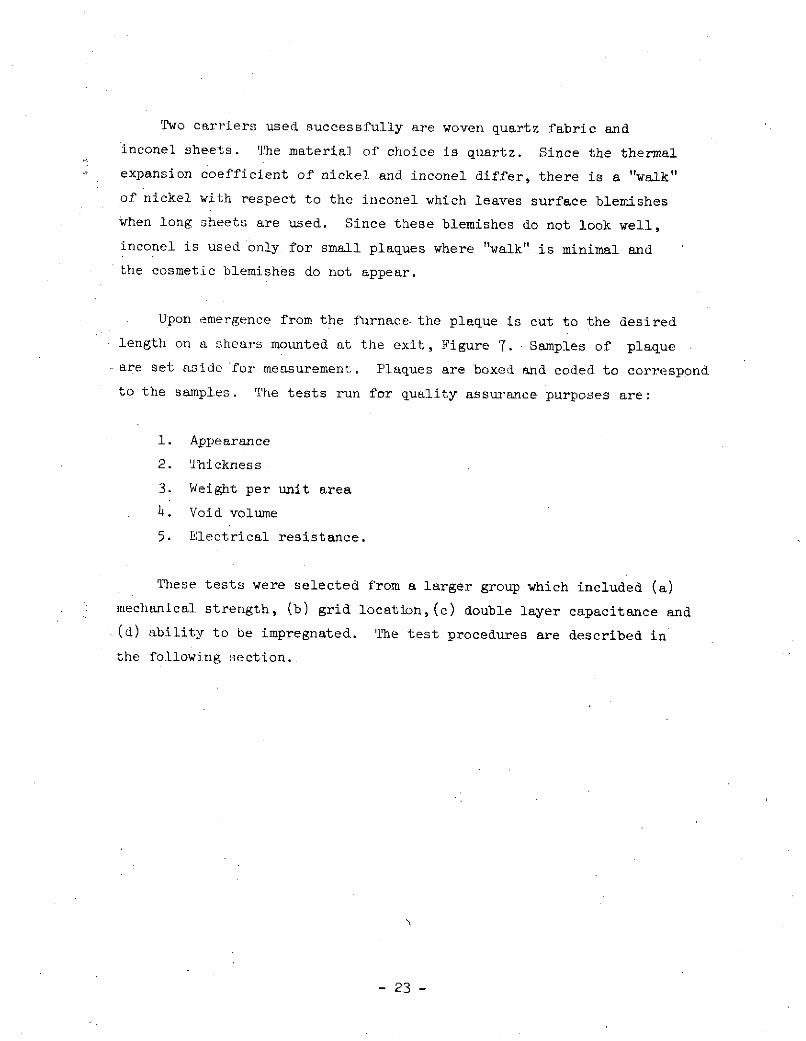
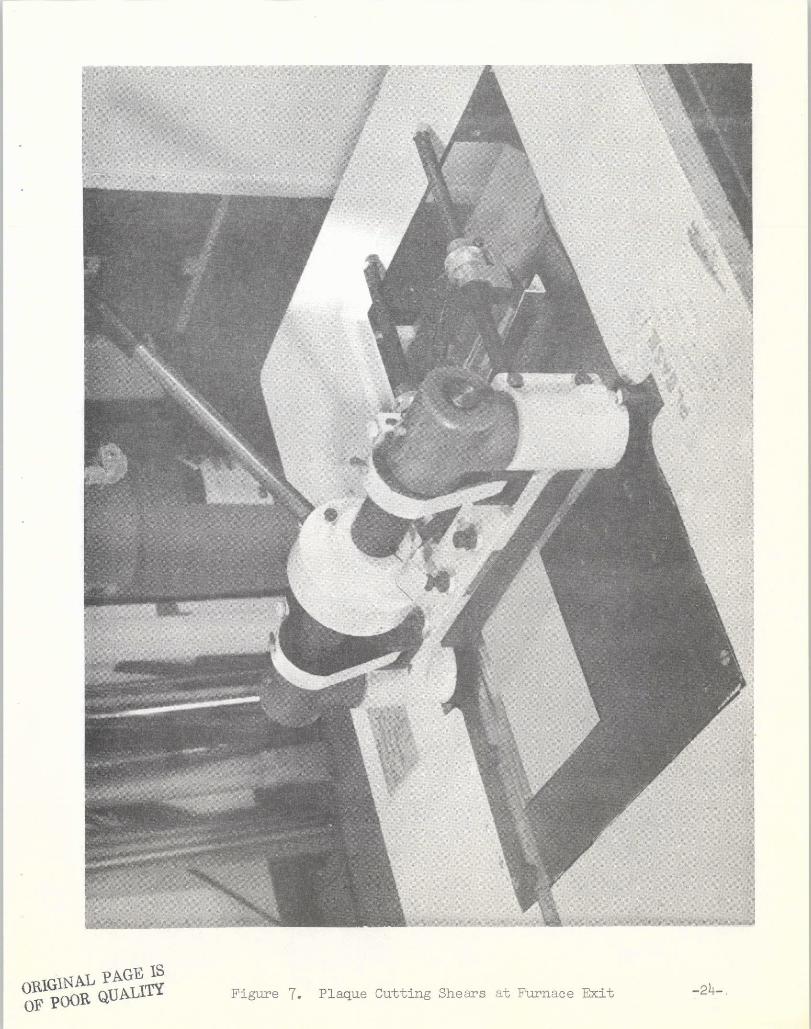
Upon emergence from the furnace-the plaque is cut to the desired
length on a shears mounted at the exit, Figure 7. Samples of plaque
are set aside for measurement. Plaques are boxed and coded to correspond
to the samples. The tests run for quality assurance purposes are:
1. Appearance
2. Thickness
3. Weight per unit area
4. Void volume
5. Electrical resistance.
These tests were selected from a larger group which included (a)
mechanical strength, (b) grid location,(c) double layer capacitance and
(d) ability to be impregnated. The test procedures are described in
the following s3ection.
- 23 -
1i,~a-i ~;:i;iliilgai ~
-n ~::~::~~:~s~~--P
I -- : --a
;::i~: : ~~ ~:~ - :: ~i~~~~:: :~:::~: ~ ~ ..
I: : . :: : ;i: ::~~::~: : _
i ~~ : :: ::
: .- : ~4
" ~:: : .. : . ::::
:i: :~
;;i ~ e3~~1~_: ::::: e~eP"g~L~ II __I:~:::::::::~-: i:: ~~: 9: -:j ::~~::-::::~_
i~~ a_,M
:- -- i;-
~.-~~.4A; ;i;s~*~
~~l- po;_r~~-~.
:s
5~-L ;--:"
H ::::_
,.
:: :r "s~ ~
'I
: -:: ~~~.s::~:i:: ~::-- :::
: r
ri i-R:
e~_~%'x
,~r*~-:::
I:-:8:~: ~::::
8-~91 ~
I -- - ' ~f~r~~-::: a~~~ ~
~::i::: :::
~_~~~:~!: : : :~:: -" :
c~~.i~~~~~
~i~~~, a e~s- r;_ l~"-~ICEB-:_~-:-2~~~~-~-Q.
d-":' -~~_~L-Q~IA-:-d_: ~g 1 g~_0:B.~. :: ~~~~t T_- , -::~~~~~;ri:::::::
oRrclNA~ pAGEIS
OF pOOR C1UAWTZ Figure 7. Plaque Cutting Shears at Furnace Exit
TEST PROCEDURES
A. Void Volume and Porosity of Sintered Plaque
The capacity of a cell is dependent upon the total void volume of
plaque, the impregnation level and the utilization of active material.
This simplified statement may be written as:
(1) C L6,
where the definition of the symbols are obvious. This simplified equation
can be regarded as exact under certain experimental conditions. One such
set of conditions is an early, flooded cycle such as the final formation
discharge. The utilization, e, under these conditions ranges from about
0.9 to 1.25, depending upon plaque characteristics and additives.
While the exact capacity of a cell is related to the capacity of
equation 1, the importance of the uniformity of loading with active materials
and of uniformity of void volume is also of utmost importance, particularly
where the impregnation is carried out using an immersion process.
There are several ways to measure void volume. The most direct is
to fill the voids with a liquid and determine the quantity of liquid
imbibed. This is a direct measure of voids penetrated bythat liquid.
If the impregnation solution reaches the same voids, then the measure-
ment is extremely useful. It has been demonstrated that approximately
95% of the voids measured by water imbibition are entered by the positiveimpregnation solution and converted to Ni(OH)2 . In addition, this type
of measurement can be reproduced to better than 2 percentile units.
- 25 -
The water imbibition procedure for freshly sintered plaque is:
(a) Weigh plaque
(b) Immerse in water
(c) Remove excess water by dragging over glass
until only microdroplets are left on the glass
(d) Reweigh
The void volume is then calculated from the weight gain.
There is an alternative way of measuring void volume using the sample
weight and geometry, but this will contain two errors. One is in the
averaging to obtain thickness, and the second is in defining the surface of
a plaque based on a mesh grid.
Once void volume is known, these values may be converted to porosity.
Restricting void volume to the direct measurement, there remains two
definitions of porosity. The first definition is plaque porosity which
may be defined mathematically as:
(2) p = v
where m is weight of the plaque, p is 8.9g/cm3 , the density of nickel,
and v is void volume. The second definition is that of sinter porosity
which excludes the grid and is defined as:
(3) vP v + (m-g)/p
where g is the weight of the grid. Two typical grid weights are 36.6 mg/cm2
for 20 x 20 mesh 7 mil Ni wire and 40.7 mg/cm2 for 3 mil perforated Ni, 40%
open area. There is a preference for using sinter porosity, since this is
related to the same kind of sinter regardless of plaque thickness.
- 26 -
Sinter porosity is a design parameter than enables one to obtain
the same sinter characteristics for plaques of different thicknesses.
Void volume is the quality assurance parameter to help ensure unif6rm
capacity.
B. Thickness and Uniformity
The definition of the thickness of a plaque was brought into question
while discussing void volume determination. This was brought about by the
realization that plaque thickness over the grid openings is less than
contiguous regions. For the purpose of cell design the definition of
thickness is less ambiguous. The thickness one measures with a micrometer
touching, but not compressing the material is the definition. Since
positive plaque tends to thicken during impregnation, some vagueness
remains even in this definition.
Uniformity is the repeatability of the measurement over the sample,
and from sample to sample. Uniformity in this work is given as the varia-
bility:
(4) v = X100,
where 0 is the standard deviation from the mean, X is the mean and v
(variability) is expressed as a percentage.
C. Grid Location
It had been intended to measure the depth at which the grid is located
by scraping the sinter on a sample and using a depth gauge. However, the
doctor blade fixture design adopted centers the grid so well that the
value of such measurements are trivial.
- 27 -
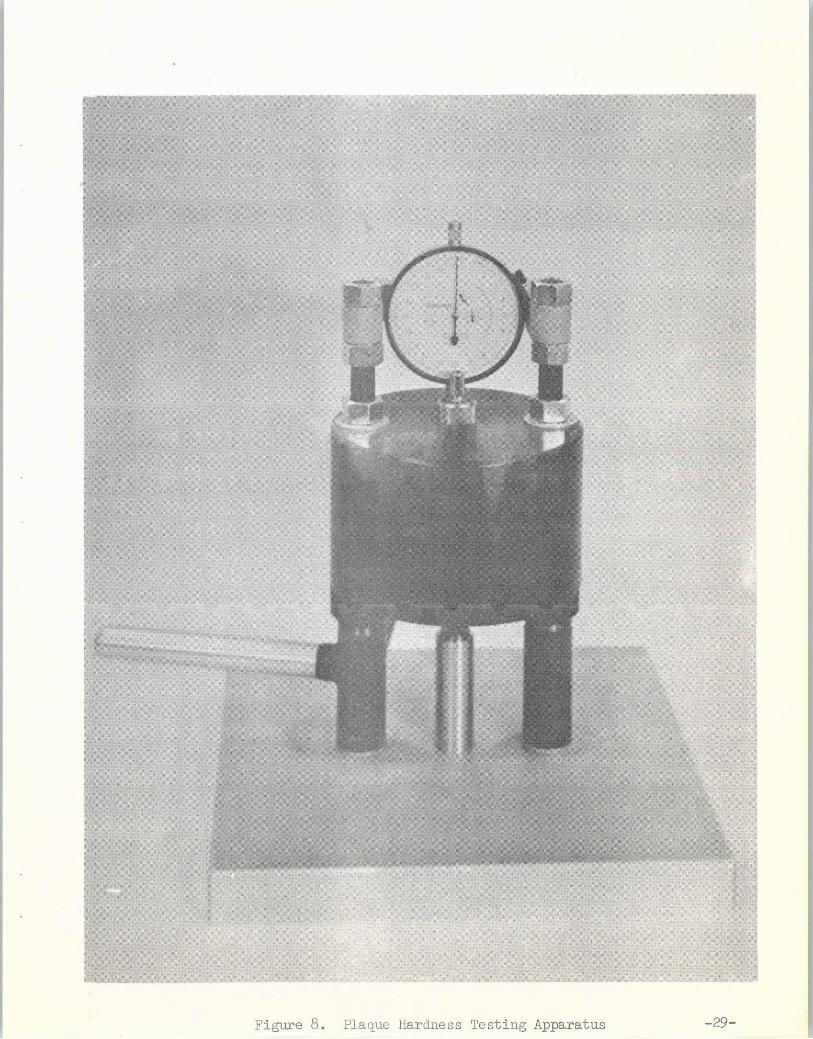
D. Mechanical Strength
The desire was to sinter plaques in such a way as to resist blistering
and shedding. Part of this problem is due to the hydrated oxides formed
on conversion, and part is due to plaque that is not sufficiently strong
to resist the pressures built up withir' the voids.
At the beginning of this program, before the grid centering was solved,
an analysis was run on plaque by analogy to a reinforced concrete beam.(2)
Because the neutral axis was dependent upon the location of the grid, and
the strength measured could differ by a factor of 4 in a 25 mil thick
plaque, the 4 point bend test was not used.
The real measurement would be resistance to a volume change within
the interstices of the plaque. Bell Telephone Laboratories impregnates
a plaque with water and then plunges the wet plaque into liquid nitrogen.
This test is quantitative at the one pressure corresponding to the volume
change from water to ice.
A coining test was decided upon although it is unidirectional as isthe 4 point bend test. A device was built, Figure 8, with which a 25 pound
weight is lowered onto the plaque. The coining stud has a diameter of
0.088 inches resulting in a pressure of 2 tons per square inch. Results
are obtained quickly and repeatably. Orientation of the face does not
affect results. There are differences in results between operators which
probably could be eliminated by automating the device.
(2) S. Timoshenko, Strength of Materials, D. Van Nostrand, Princeton, 1962(3) Private Communication from Dr. R. Beauchamp
- 28 -
3< - -<< 4~
4 > <l~i \~
4o4 '<"B 4-.~ sl-~"b
4~ ~~W ~ -B
V~: 4~~~a~~~~
I -':-V~ ~--,:-sF4.L~I4
-~~~k:li~~i~3:4 4:::
4s~E 4~-
Fiue8 lau ades etn pprts-9
E. Plaque Surface Area
The surface area in batteries has been suspected of being important,
but this has not been established. One reason, perhaps, for the liack of
correlation has been the use of gaseous measurements of surface area.
Gases with their low molecular weights and surface tension can penetrate
regions inaccessible to electrolyte. This consideration leads to the
necessity of measuring only the area represented by the electrode/electro-
lyte interface. In turn this suggests measurement of the double layer
capacitance.
The double layer capacitance is most usually measured by impressing
a current and measuring dv/dt. The voltage usually changes by a signi-
ficant amount due to faradaic processes which should be avoided as much as
possible because the slope dV/dt is not then indicative of the charge
placed on the double layer.
If instead of a current, a voltage step is impressed and the voltage
step is small enough to preclude major faradaic processes, then the
differential double layer capacitance could be measured by integrating
current required to ireach a steady voltage state at the impressed potential.
Consider an unpoised electrode with a double layer in existance at the
interface. A potential V will be exhibited due to a double layer charge qo
The capacitance then is given by the equation:
(5) Vo = qo/C.
When a small additional voltage is applied to this electrode, and it is
assumed that this appears only across the electrode/electrolyte interface,
a current will flow. The current will charge the interface. If the
faradaic and thermal reactions are minimized the current will decay to
zero, and the voltage-charge relation may be written as:
(6) V = (qo + q)
- 30 -
where V is the new electrode potential and q is the additional charge
placed on the double layer. If the two sets of quiescent conditions are
subtrated, and one defines T= V-Vo, then:
(7) =-q, or
(7a) C = 1 i(t)dti = 0
Equation 7a is used both for calculating the double layer capacitance
as well as for testing for errors due to faradaic currents. Equation 7a
is similar to that used by Bird, et. al. A second test for absence of
faradaic currents is a plot of 1 versus peak current which should be
proportional. Yet a third test is that the current reaches zero. A
fourth test is: after removing the applied potential and the electrode
returns to its original value, the current must correspond to removal
of charge from the double layer and the charge removed must equal to
charge injected into the capacitor. Because unimpregnated plaque is
an unpoised electrode the last test must be applied judiciously using
the actual rest potential at the time the capacitative discharge current
reaches zero.
The test cell used to measure double layer capacitance is shown in
Figure 9. A three electrode system is used. It is important that the
counter electrode is spaced from the test electrode sufficiently to pre-
clude evolved gases from reaching the test electrode. In these experiments
a nickel oxide electrode was used as a reference electrode. The cell -is
filled with electrolyte to cover the test electrode.
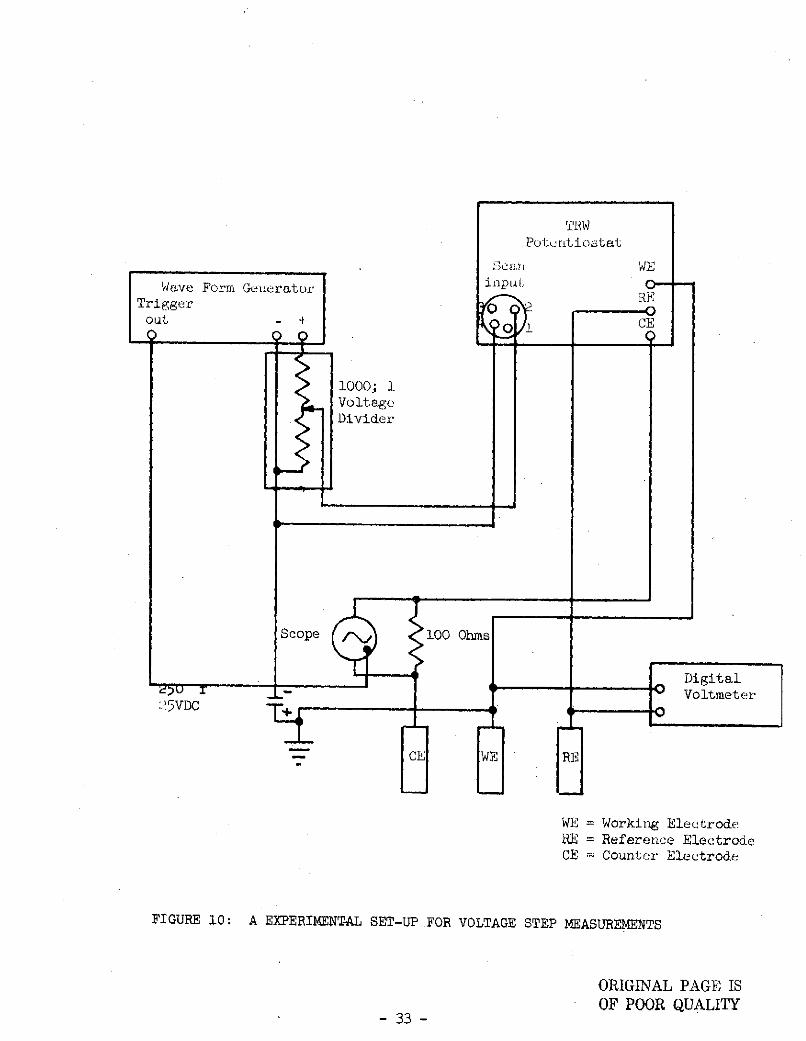
The instrumentation is shown in Figure 10. An Exact Model 505B provides
the pulse. Because of the limitation on pulse amplitude and the stable
lower limit of the wave form generator, a voltage divider is used. The
(4) J. Bird, et al, Power Sources Conference Proceedings, p. 146, 1968
- 31 -
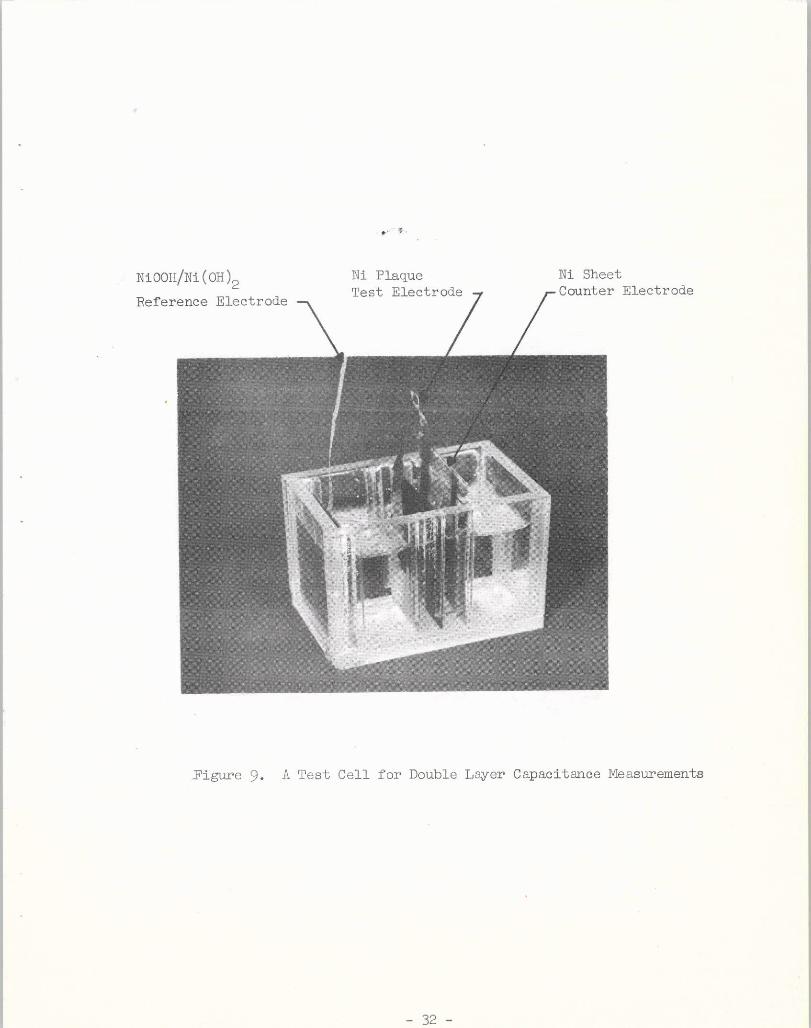
NiOOH/Ni(OH) Ni Plaque Ni Sheet
Test Electrode Counter ElectrodeReference Electrode
Eigure 9. A Test Cell for Double Layer Capacitance Measurements
-32 -
TRWPot t tiost at
Scan WE
Wave Form Geterator input RE
Trigger REout - + CE
1000; 1VoltageDivider
I Digital
d)U Voltmeter: 5VDC
Ch WE RE
WE = Working ElectrodeRE = Reference ElectrodeCE = Counter Electrode
FIGURE 10: A EXPERIMENTAL SET-UP FOR VOLTAGE STEP MEASUREMENTS
ORIGINAL PAGE ISOF POOR QUALITY
- 33 -
condenser indicated between tle shielded case and ground is a filter.
The output of the generator is the input to the TRW Potentiostat. The
current is measured as the voltage drop across a 100 ohm resistor in
the counter electrode leg of the circuit. The digital voltmeter is
used to measure the reference to test electrode potential.
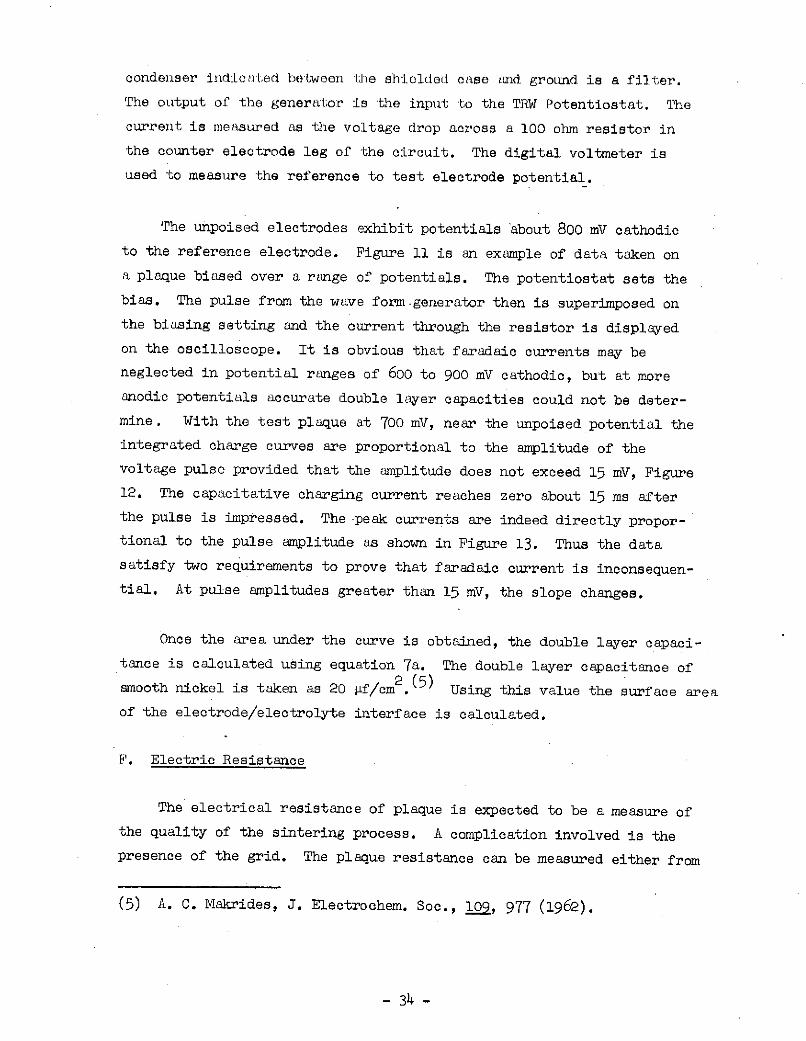
The unpoised electrodes exhibit potentials about 800 mV cathodic
to the reference electrode. Figure 11 is an example of data taken on
a plaque biased over a range of potentials. The potentiostat sets the
bias. The pulse from the wave form generator then is superimposed on
the biasing setting and the current through the resistor is displayed
on the oscilloscope. It is obvious that faradaic currents may be
neglected in potential ranges of 600 to 900 mV cathodic, but at more
anodic potentials accurate double layer capacities could not be deter-
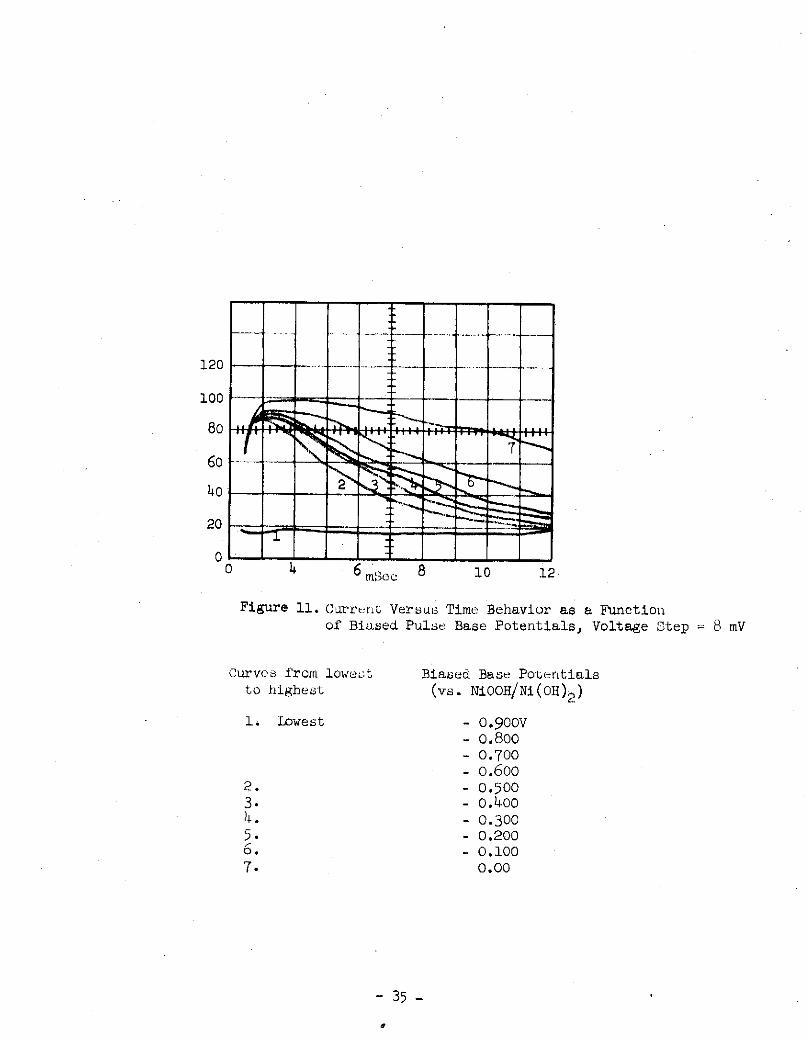
mine. With the test plaque at 700 mV, near the unpoised potential the
integrated charge curves are proportional to the amplitude of the
voltage pulse provided that the amplitude does not exceed 15 mV, Figure
12. The capacitative charging current reaches zero about 15 ms after
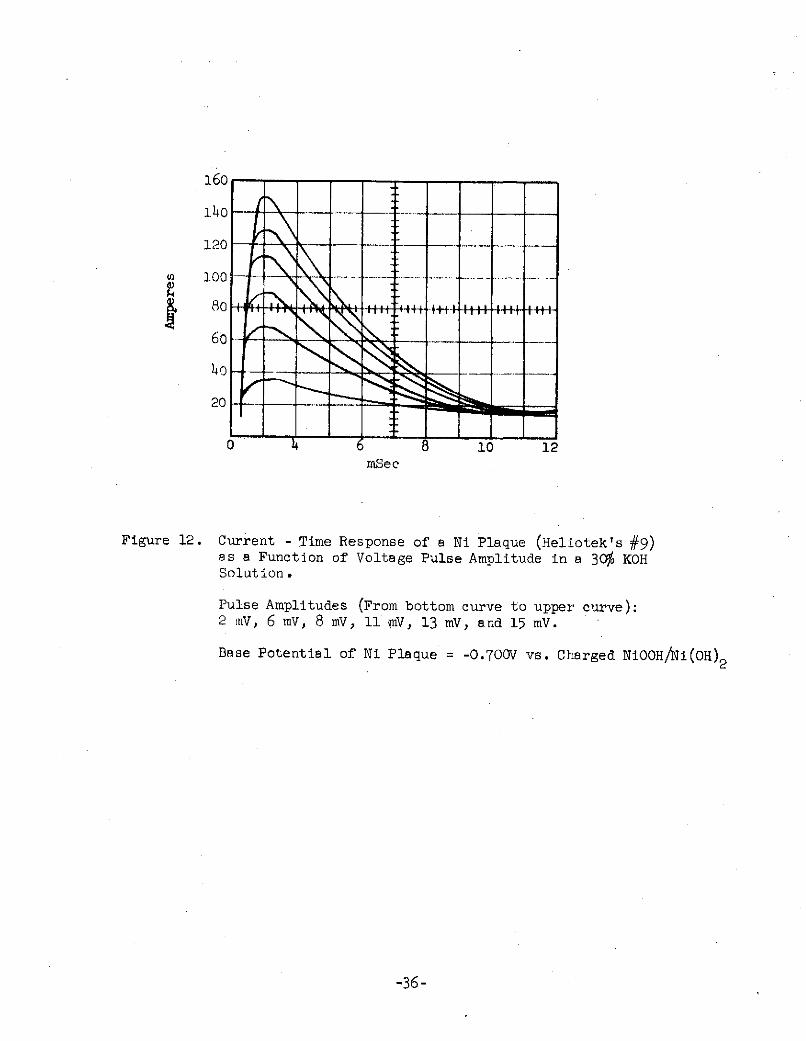
the pulse is impressed. The peak currents are indeed directly propor-
tional to the pulse amplitude as shown in Figure 13. Thus the data
satisfy two requirements to prove that faradaic current is inconsequen-
tial. At pulse amplitudes greater than 15 mV, the slope changes.
Once the area under the curve is obtained, the double layer capaci-
tance is calculated using equation 7a. The double layer capacitance of
smooth nickel is taken as 20 if/cm 2 (5) Using this value the surface area
of the electrode/electrolyte interface is calculated.
F. Electric Resistance
The electrical resistance of plaque is expected to be a measure of
the quality of the sintering process. A complication involved is the
presence of the grid. The plaque resistance can be measured either from
(5) A. C. Makrides, J. Electrochem. Soc., 109, 977 (1962).
- 34 -
120
100 -
60 . . . . --
80
20
0 4 6 mSe 8 10 12
Figure 11. Current Versus Time Behavior as a Functionof Biased Pulse Base Potentials, Voltage Step = 8 mV
Curves from loweLt Biased Base Potentialsto highest (vs. NiOOH/Ni(OH)2 )
1. Lowest - 0.900V- 0.800- 0.700- 0.600
2. - 0.5003. - 0.4004. - 0.3005. - 0.2006. - 0.1007. 0.00
- 35 -
16o
14o
120
100
20-0 0 6 12
mSec
Figure 12. Current - Time Response of a Ni Plaque (Heliotek's #9)as a Function of Voltage Pulse Amplitude in a 30% KOHSolution.
Pulse Amplitudes (From bottom curve to upper curve):2 mV, 6 mV, 8 mV, 11 mV, 13 mV, and 15 mV.
Base Potential of Ni Plaque = -0.700V vs. Charged NiOOH/Ni(OH) 2
-36-
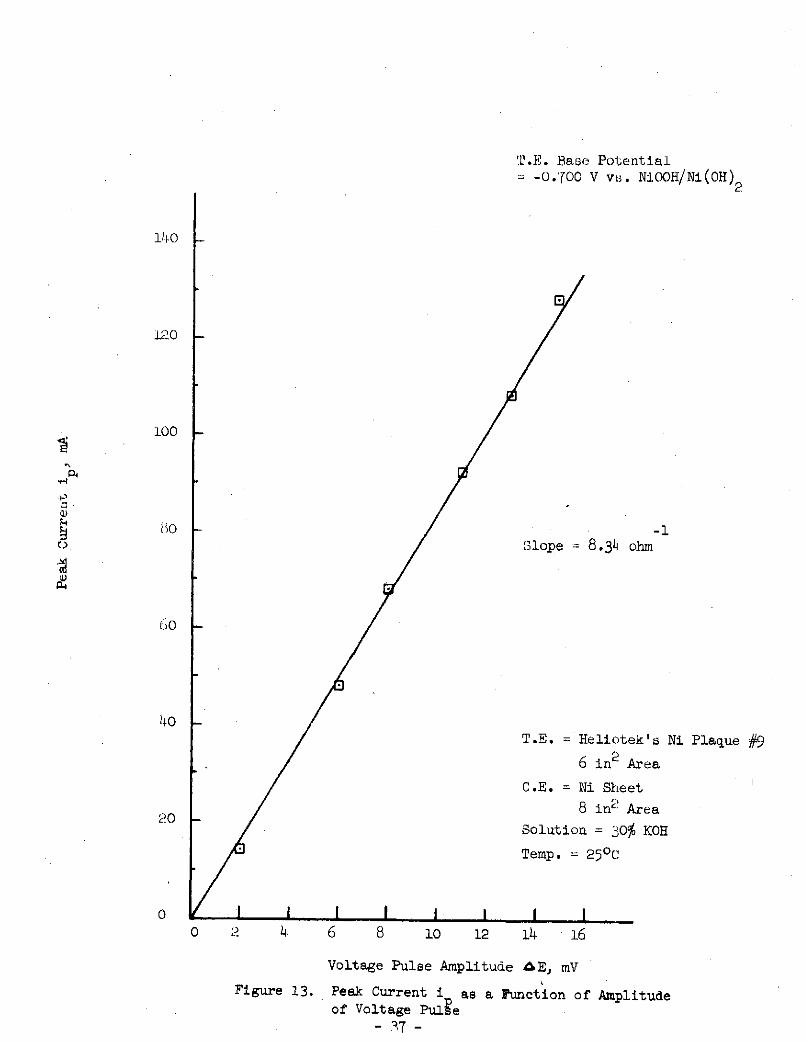
T.E. Base Potential-0.700 V vu. NiOOH/Ni(OH)
140
120
100
80; -1
Slope 8.3 ohm
40T.E. = Heliotek's Ni Plaque #9
6 in2 Area
C.E. = Ni Sheet
8 in 2 AreaSolution = 30% KOH
Temp. = 250C
0 IlI IIII0 2 4 6 8 10 12 14 16
Voltage Pulse Amplitude AE, mV
Figure 13. Peak Current i as a lunction of Amplitudeof Voltage Pule
- 17 '
surface to surface or along one surface. Greater values of resistance
are measured along one surface, and this method has previously been
found to be valuable in assessing sintering quality. (6)
To make an absolute measure of resistance one has to be certain that
the current density is uniform in the regions where the measurement is
made. Relative measurements are able to be made more rapidly and more
repeatably with less care. Relative measurements are made using a
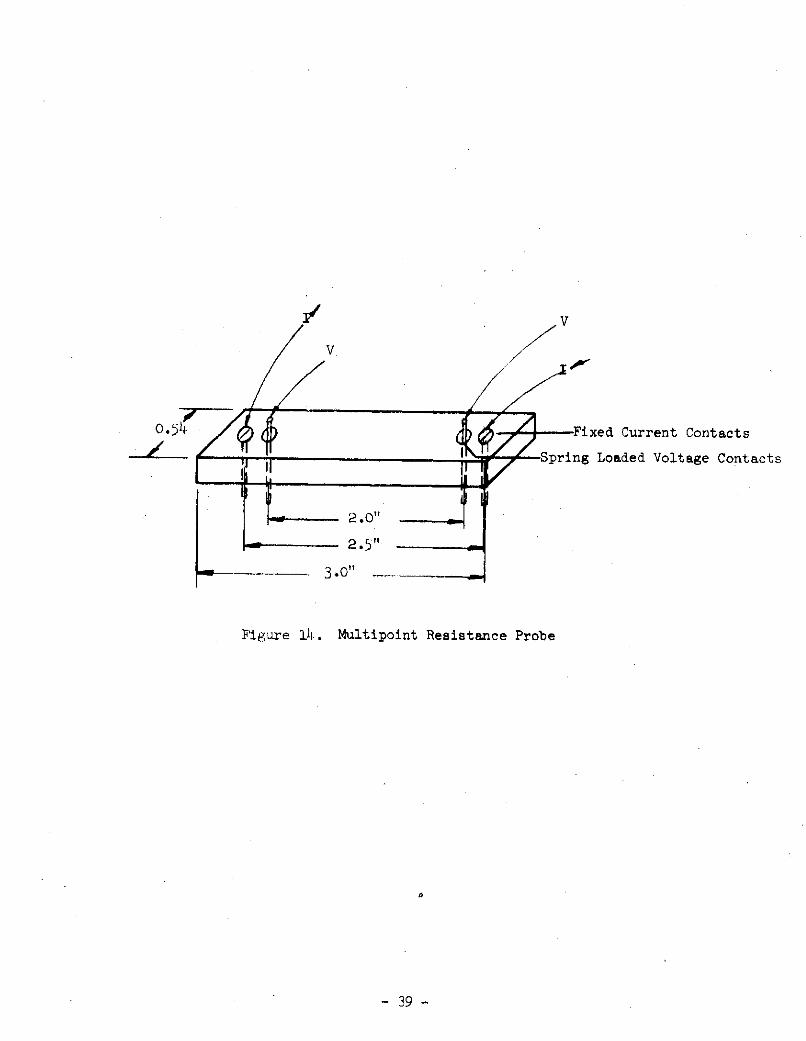
four-point probe. The probe is shown in Figure 14. The current contacts
are indicated by I and are conne:cted to a constant current power supply
set at 5A. The probe is contacted to the plaque with current off to
prevent arcing and welding. There is a shunt in the circuit to cali-
brate the current. The test sample is cut to 1.0" x 3.0" and the probe
applied parallel to the long axis. The voltage drop is measured between
the two spring-loaded pairs using a DVM.
With a 3 mil Ni sheet, alloy 200, the measured resistivity-o
was determined to be 11.0 x 10 ohm cm. The literature value of resis--6
tivity of pure Ni is 8.9 x 10 ohm cm. To avoid confusion with absolute
values of resistance or resistivity, resistance shall be reported directly
as the voltage drop under the experimental conditions described.
G. Physical Appearance
The physical appearance of plaque is judged visually. The character-
istics looked for are crazing due to mud caking during drying,
pock marks and bubbles due to entrapped air. Flatness of the plaque is
also gauged.
(6) H. N. Seiger, Unpublished data obtained between 1952 and 1956
- 38 -
Fixed Current Contacts
I2 n pring Loaded Voltage Contacts
2.0"
2.5"
Figure 14., Multipoint Resistance Probe
- 39 -
H. Impregnation Loadings
Since the prime function of plaque is to hold active materials,
it is only reasonable to determine the ability of plaque to be impreg-
nated. The more difficult plaque to impregnate to high levels is the
positive plate.
Impregnations were carried out using immersion techniques. Several
well known techniques were modified to assure a uniform impregnation
from surface to surface, and to minimize forces on the sinter from
within the interstices during conversion. These proprietary modifications
minimize blisters and shedding.
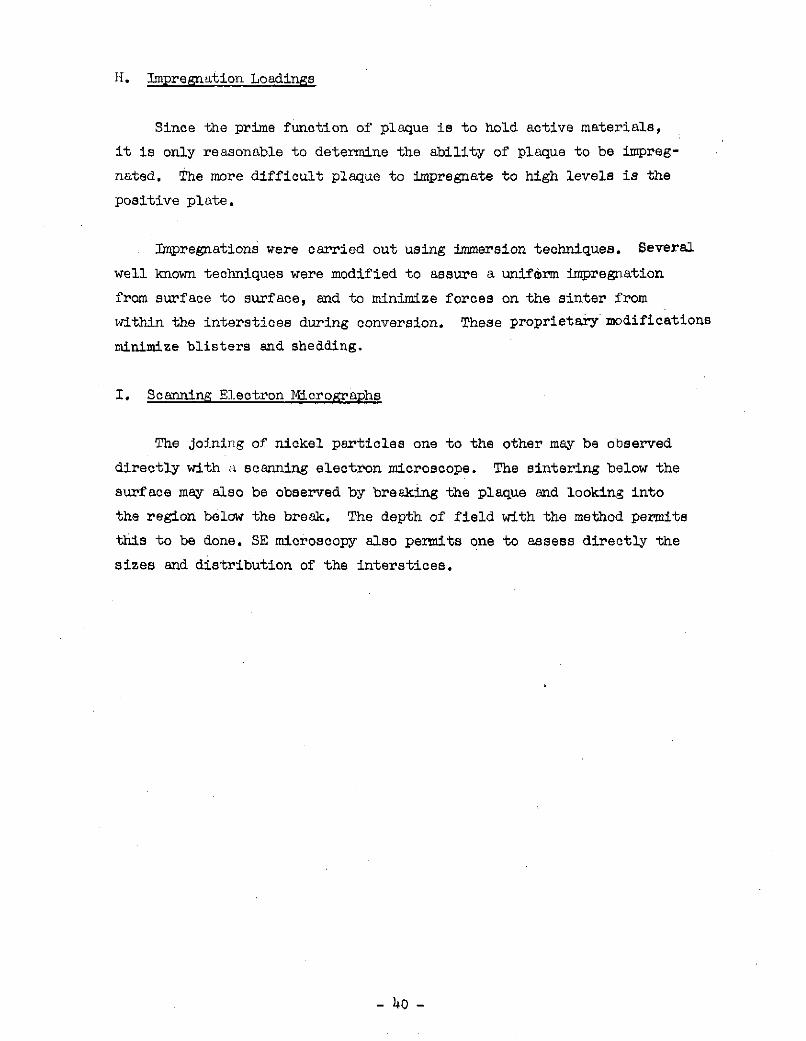
I. Scanning Electron Micrographs
The joining of nickel particles one to the other may be observed
directly with a scanning electron microscope. The sintering below the
surface may also be observed by breaking the plaque and looking into
the region below the break. The depth of field with the method permits
this to be done. SE microscopy also permits one to assess directly the
sizes and distribution of the interstices.
- 40 -
TEST RESULTS
The preliminary work enabled the judicious selection of sintering
conditions. This included the flow rates for the various gases as well
as the particular temperature profile. Calculations were made to have
a target for applying slurry and sintering. It was desired to sinter
plaque 25 mils thick and having a sinter porosity of 75%. These require-
ments set up the volume of slurry to be applied per unit area. The
calculated values are given in Table 2 for negative as well as positive
electrodes. These values can only .approximate the geometrical attributes
since plaque thickness cannot be unequivoctLbly defined in slurry processed
plaque. The thickness measured by micrometers is indicative of the number of
plates that can be placed in a cell, and this measurement is important.
The capacity is a function of the void volume entered by the impregnation
solution. This void volume is estimated from the water imbibed. With
these facts in mind, sintered plaque characteristics will be close to,
but not identical with the target values given in Table 2.
The slurry composition has been given earlier. The temperature
profile, the oxygen flow rate and the nitrogen curtain flow rates were
previously established. The effect of furnace temperature, residence
time for plaque in the furnace and hydrogen/nitrogen forming gas are
variables which should be selected. A factorial experiment was run to -
determine the values of these variables for manufacture of positive plaque
for the 100 Ali cells.
Since there are only 3 factors, a two level experiment requires only
8 samples. A complete factorial was run and this also included the base
level plaque conditions promulgated in the preliminary investigative
work. The factorial experimental values are shown in Table 3.
Plaque was sintered and then tested. The test results are given in
Table 4. Included in Table 4 are some parameters measured on plaque
- 41 -
Table 2
Target Parameters for Sintered Plaque
Item Positives Negatives
Grid weight, gns/in2 .250 .250
Thickness, mils 25 25
Sinter porosity, % 75 78
Sinter Weight, GMS/in 2 .846 .748
Plaque Weight, GMS/in 2 1.096 .998
Void Volume, cm /in2 .285 .296
- 42 -
Table 3
Factorial Experiment
for
Sintering Positive Plaque
Factor: Furnace Setpoints Belt Speed % H2 in forming gasOC
zone 1, zone 2, zone 3 inches/minute
Base Level, B 775 925 lo00 6 20
Unit change 25 2 10
High Level, H 800 950 1026 4 30
Low Level, L 750 900 975 8 10
Run No.
1 L L L
2 L H H
3 L H L
4 L L H
5 H H L
6 H L H
7 H H H
8 H L L
9 B B B
- 3 -
Table 4
Summary of MeasurementsVoid Surface Electri- Impreg. Plaque
Void Surface cal I g A Thick.
Volume Thickness Area Resist Loadings Weight PorosityMech. 2 esist. After
Sample No. cm /in 2 mils Strength cm2/g mV g/cm2 Voids Loading G/in2 Sinter, %
1. .260 24.0 9.2 848 13.2 2.01 .1 1.095 732. .282 24.6 9.1 990 13.1 1.99 1.2 1.170 73
3 .252 24.2 9.3 832 13.5 2.07 - .4 1.083 73.4 .291 24.9 9.6 856 13.5 1.99 1.3 1.159 74
5 .254 22.5 7.9 774 12.3 1.93 .4 1.128 726 .281 24.3 8.9 820 12.5 1.96 1.1 1.178 73
7 .262 23.7 8.2 808 11.7 2.02 .4 1.182 718 o .276 22.3 7.9 804 12.9 1.96 2.8 1.145 75
9 .278 24.7 9.2 928 13.0 1.99 1.0 1.171 73
x 1.146- = 3.2%
Goal (Table 2) XS (+) .285 25 1.99 1.o96(-) .296 25 .998
No Oxid.ATM 29.0 528 18.0DA* .271 25.2 11.5 428 21.3 .756 82SW .254 26.2 10.0 748 16.1 1.022 72SF .027 26.0 11.3 <220 13.7 .987 **
SF* .261 994
SAl .225 25.0 8.9 854 21.8 .755 79SA2 .265 30.2 10.3 835 .957 77DB .366 32.1 14 1022 20.8 1.024 80
SB .346 30.8 13.1 818 10.3 1.149 **
3 Mil Ni 200 14.53 Mil Perf. Grid 34.9
*Evacuated to eliminate entrapped air
**Grid characteristics not known.* Prefix D denotes dry powder process, while prefix S is sued for slurry sinter process.
fabricated elsewhere. These plaques have various grids, and, in some
instances have been made by the dry powder process.
Most of the plaque made in the factorial experiment have reached
an adequate thickness and are rather strong. Electrical resistance and
impregnation loading levels are also adequate. Sample No. 9 was selected
for manufacture of positive electrode material. Sample No. 4 is closest
to that of the negative plaque material desired. This was used as the
sintering conditions and the slurry mix was altered by decreasing the
quantity of nickel powder and increasing the quantity of pore former to
more closely meet the targetted values.
These data can be used for analysis of the effect of the three
parameters on the sintering results. To perform the analysis, the data
obtained on plaque sintered at the high level of a factor were averaged
and compared to the data obtained on plaques sintered at the low level.
These two sets of data were examined using the student "t" test for
significance. The number of degrees of freedom is 6 so that significance
was taken at the 90% confidence level. The results of the data analysis are
given in Table 5. The higher hydrogen flow rates are associated with an
increase in void volume and thickness. The higher temperature settings
increase plaque strength and conductivity while slightly, but significantly,
decreases thickness. In all cases, the factors varied can be compromised
without greatly varying the plaque quality. The base level, Sample No. 9,
was most nearly the target values for the positives. The conditions for
this sample came from the preliminary work.
Plaque was then sintered for fabrication of the 100 AH cells required
by the contract. Some random samples are shown in Table 6. The plaques
for the negatives are based on a 78% porosity. The last column indicates
that porosity is quite uniform have a variability of 0.2%. The void volume
has a variability of 3% while the specific weight has a variability of 1.5%.
The process variable considered most important in impregnation by an immersion
process is void volume. A variability of 3% indicates the variability that
one may encounter in capacity due to vmid volume. The positives were tar-
getted for a 75% porosity. The variabilities are about the same as for
- 45 -
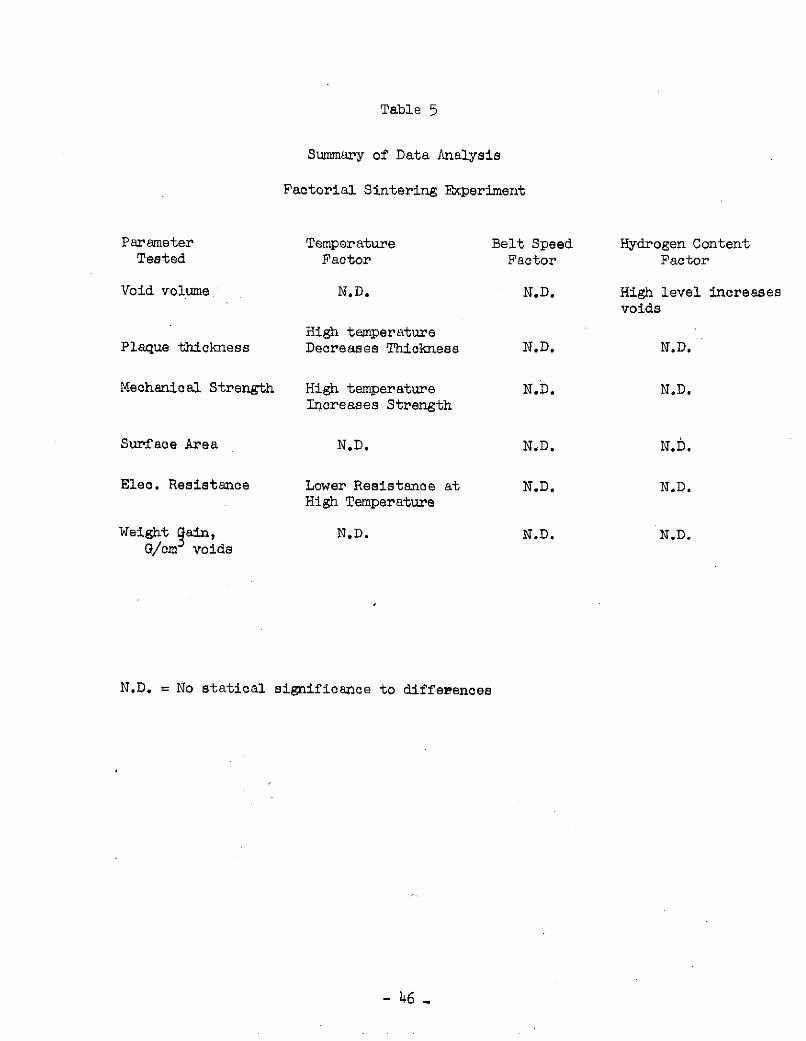
Table 5
Summary of Data Analysis
Factorial Sintering Experiment
Parameter Temperature Belt Speed Hydrogen ContentTested Factor Factor Factor
Void volume N.D. N.D. High level increasesvoids
High temperaturePlaque thickness Decreases Thickness N.D. N.D.
Mechanical Strength High temperature N.D. N.D.Increases Strength
Surface Area N.D. N.D. N.D.
Elec. Resistance Lower Resistance at N.D. N.D.High Temperature
Weight gain, N.D. N.D. N.D.G/cm voids
N.D. = No statical significance to differences
- 46 -
the negative electrodes. It should be noted that a less rigorous set of
sinteri ig conditions were used for the negative electrodes to obtain greater
porosity. As a consequence the resistance is greater than for the positives
although the negative electrodes are somewhat thicker by about 2 mils.
Tables 6B and C contain data on the weight of plaque used for
impregnation of the positive and negative electrodes for the 100 AH
cells. The weight variances appear to be less for the production runthant for the plaque data in 'TLble (A, but only because 6A represents
the complete run while Tables 6B and C are for only part of the run.The weight gain variabilities are in line with the void volume varia-bility of plaque.
The theoretical capacity of the positive electrodes in the 100 AHcell is 128 AH and of the negatives is 303AH. This ratio requires anexplanation. The original impregnation processes did not load plaqueuniformly. This became apparent by observing pore entry of about 65%in both positives and negatives and by scanning electron microscopy.Work was directed to yield a uniform impregnation. The reason forthe inadequate entry into the positives were found, and the processrevised to effectively load 95% of the pores. The cause of non-uniformloading of the negatives is complex. While attempting to overcome theproblems of the negatives, the positives were being impregnated. Areduced loading was used so that, in the event the negative plate loadingcould not be made uniform, there would be an adequate negative to positiveratio. Hence, the positives were loaded to a level of 1.3 g/cm voidsinstead of 1.8 g/cm . A partial solution was made for the negative loading
and was used resulting in a loading level of 2.2g/cm 3 voids.
With further investigations completed at the end of the program, thenegative loadings could be increased to 2.8g/cm3 voids. Utilizing bothimprovements the theoretical capacity would be increased to 180 AH andan expected formation ratio of 1.6 to 1, negative to positive capacity.
u'INAL pAGE IS
OF POOI QALIr1TS47
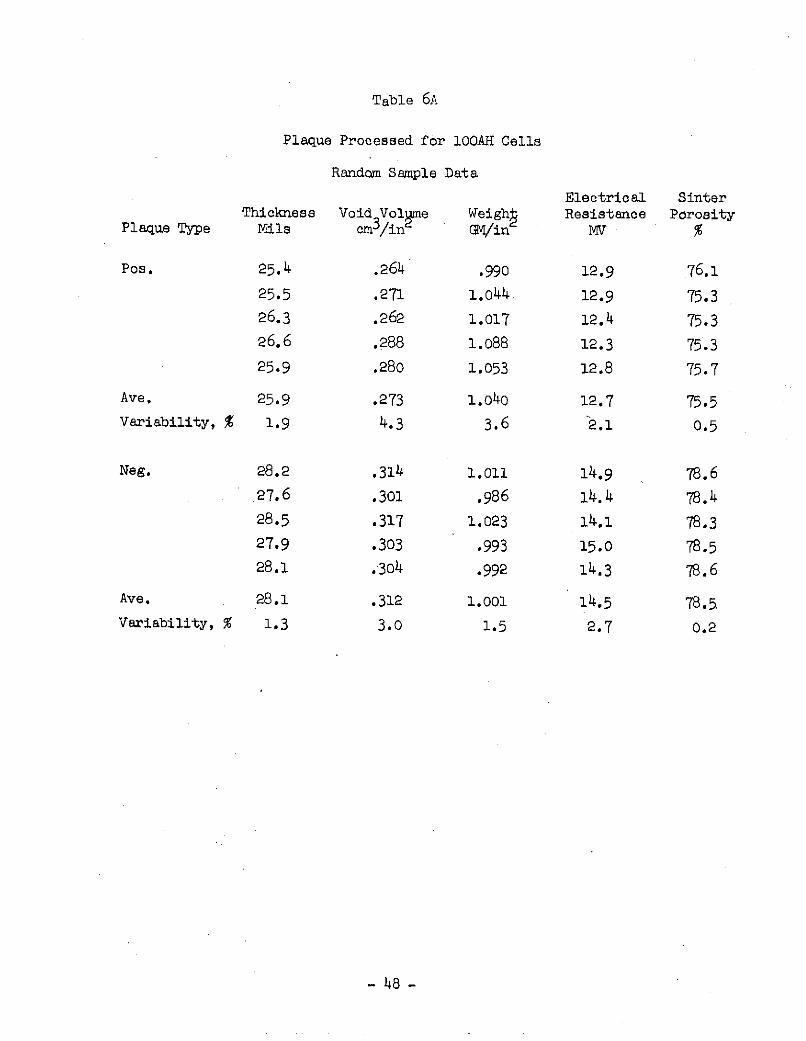
Table 6A
Plaque Processed for 100AH Cells
Random Sample Data
Electrical SinterThickness Void Volume Weighs Resistance Porosity
Plaque Type Mils cm3/in GM/in MV %
Pos. 25.4 .264 .990 12.9 76.1
25.5 .271 1.044 12.9 75.3
26.3 .262 1.017 12.4 75.326.6 .288 1.088 12.3 75.3
25.9 .280 1.053 12.8 75.7
Ave. 25.9 .273 1.040 12.7 75.5Variability, % 1.9 4.3 3.6 -2.1 0.5
Neg. 28.2 .314 1.011 14.9 78.6
27.6 .301 .986 14.4 78.4
28.5 .317 1.023 14.1 78.327.9 .303 .993 15.0 78.528.1 .304 .992 14.3 78.6
Ave. 28.1 .312 1.001 14.5 78.5Variability, % 1.3 3.0 1.5 2.7 0.2
- 48 -
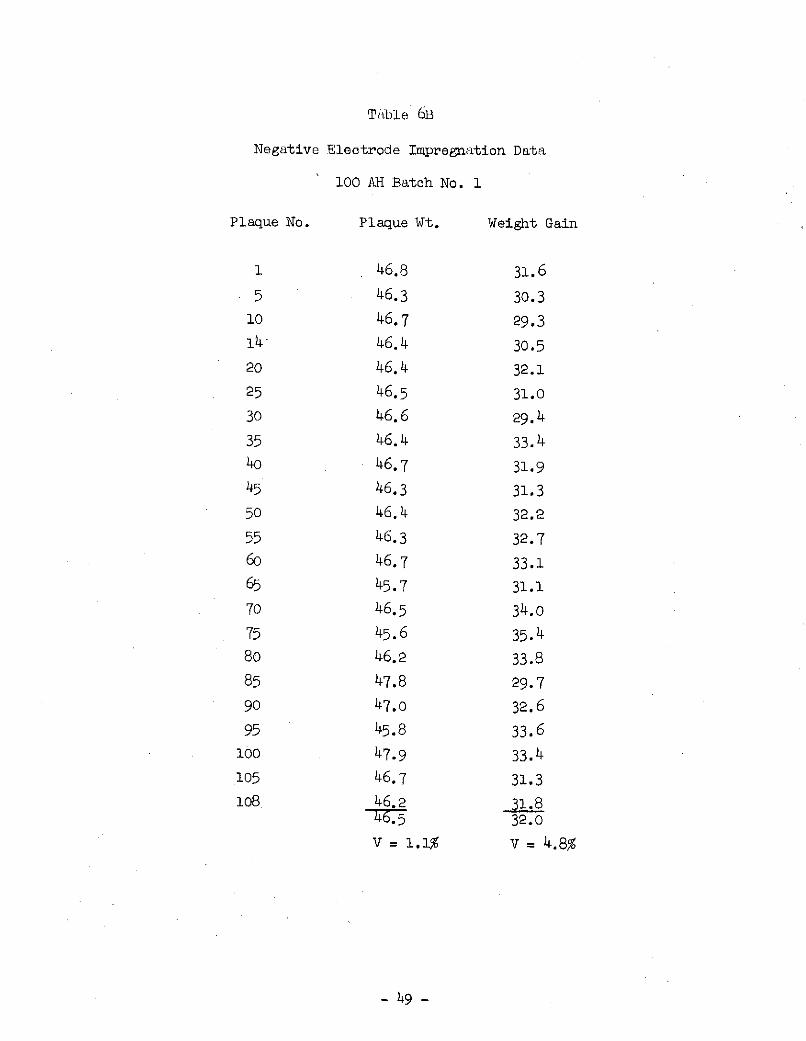
Table 6B
Negative Electrode Impregnation Data
100 AH Batch No. 1
Plaque No. Plaque Wt. Weight Gain
1 46.8 31.6
5 46.3 30.3
10 46.7 29.3
14 46.4 30.5
20 46.4 32.1
25 46.5 31.0
30 46.6 29.4
35 46.4 33.4
40o 46.7 31.9
45 46.3 31.350 46.4 32.2
55 46.3 32.7
60o 46.7 33.1
65 45.7 31.1
70 46.5 34.0
75 45.6 35.4
80 46.2 33.8
85 47.8 29.7
90 47.0 32.6
95 45.8 33.6
100 47.9 33.4
105 46.7 31.3
108 46.2 31.846.5 32.0
V = 1.1% v = 4.8%
- 49 -
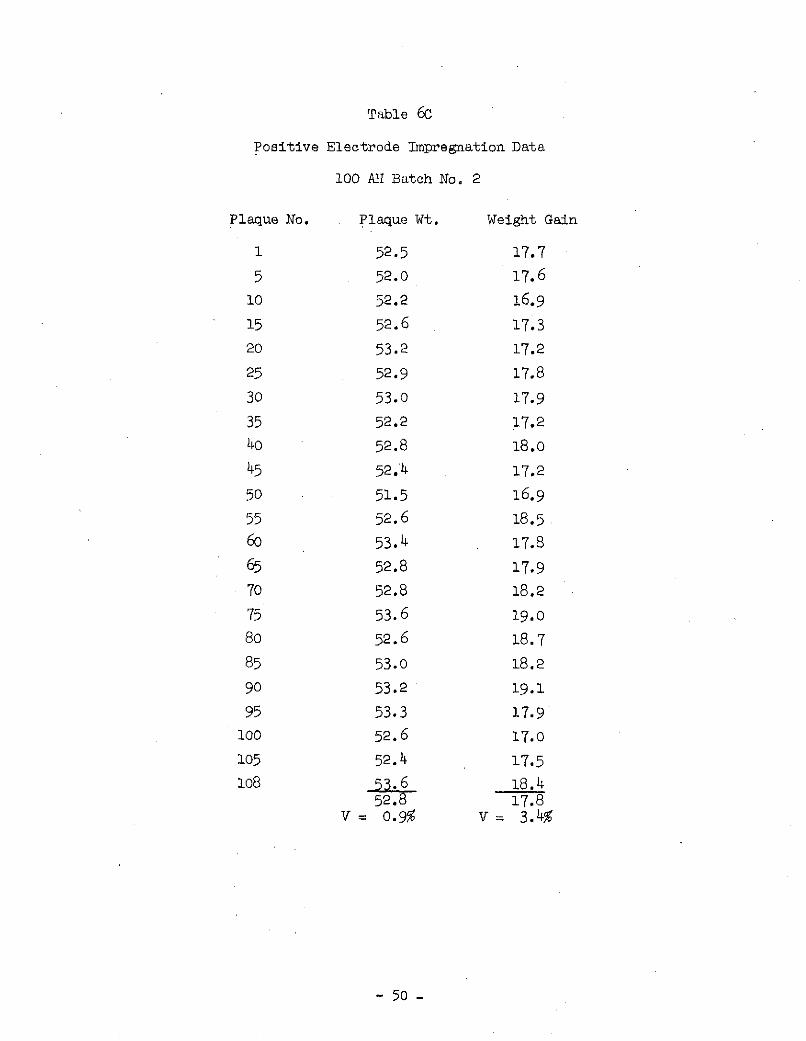
Table 6C
Positive Electrode Impregnation Data
100 AH Batch No. 2
Plaque No. Plaque Wt. Weight Gain
1 52.5 17.7
5 52.0 17.6
10 52.2 16.9
15 52.6 17.3
20 53.2 17.2
25 52.9 17.8
30 53.0 17.9
35 52.2 17.2
40o 52.8 18.0
45 52.4 17.2
50 51.5 16.9
55 52.6 18.56o 53.4 17.8
65 52.8 17.9
70 52.8 18.2
75 53.6 19.0
80 52.6 18.7
85 53.0 18.2
90 53.2 19.1
95 53.3 17.9
100 52.6 17.0
105 52.4 17.5108 53.6 18.4
52.8 17.8v= 0.9% v= 3.4%
- 50 -
100 AH C E L L DE S I G N
The design featuresof the 100 AH cell are given in the Statement
of Work (L18-1380) as:
(a) Opposed terminals
(b) Full width plate tabs
(c) Integral plate tabs and substrate
(d) Pure nickel substrates
(e) Polypropylene separator, if found acceptable
(f) Consideration given to thermal control
Thermal analysis indicates that heat can be conducted to the cell
cases via the grid. The greater the number of grids the better the
conduction so that 25 mil thick electrodes were selected. One ceramic
to metal seal was used in the cell and that was for the positive terminal.
It is contended that corrosion processes are dependent upon the potential
with respect to the electrolyte rather than on potential drops. Since
the positive electrode on open circuit is about +0.5 volts to a SHE in the
same electrolyte, the corrosion rate at the positive braze will be the
same whether the negative plates are joined to the case or to another
seal. To clarify this point, imagine a SHE appropriately equipped as a
test probe in the solution. This probe is used to measure the potentials.
The potential governs the processes that occur. If the probe indicates
(7) R. McGrath, Final Report to Heliotek, HAC Data Bank 1-4189,October 1971.
- 51 -
that one braze alloy is at the same potential as the positive electrode
because it is short circuited to the positive by design, these certain
processes can occur. These processes are (1) oxygen evolution on low
overpotential braze alloys and (2) oxidation of certain metals present
in the braze. Silver and copper are two materials which are oxidized
at the potential of the nickel oxide electrode. If a noble metal such
as platinum is present, this has a low oxygen overvoltage, and, although
it will not corrode, it will decrease the charge efficiency. Hence, the
double ammeter test has great value in materials selection for seals.
The braze joint short-circuited to the negative electrode is
protected against corrosion. The other braze joints are at floating
potentials. If any attain values close to the negative electrode then
reduction can occur. Potentials at the floating braze joints will be
dependent upon the composition of the gas present in the cell. Since
oxygen is usually present, these braze joints will be at some inter-
mediate potential.
Reduction of the oxidized silver somehow gives rise to the migration.
Whenever migration is observed it extends from the intermediate braze
joint to the one short-circuited to the positive electrode.
From the above discussion it is T parent that the use of a single
ceramic to metal seal will not result in failure any more so than using
two feed throughs. Using one seal also increases reliability as well as
providing a path for conduction of heat to the case through- the negative
comb and tab assembly. Thus the single terminal design aids in thermal
control.
The opposed tab design was followed. Full width tab integral with
the substrate was used. There is a notch in the tabs for the stud
- 52 -
location. The tab and grid are Ni 200.
The footprint of the cell was selected to allow interchangeability
with standard sealed 100 AH cells. The plate sizes are approximately
6.3" x 7" and are .025" thick. There are 25 positive plates and 26
negative plates per cell. The integral tabs of the negative electrodes
are welded into a comb bar which, in turn, is welded to the bottom of
the case. The positive tabs are welded to the comb bar which, in turn,
is welded to the stud of the ceramic-to-metal feed through.
The separator used is a polypropylene, RAI P145122, heat sealed
into bags and placed on the positive electrodes. The polypropylene
separators are considered acceptable provided the cells are sealed
without entrapped air.
A teflon liner is used around the plate stack assembly. The teflon
electrically insulates the negative electrodes from the case along the
broad faces and facilitates insertion of the assembly into the case.
After filling with electrolyte and setting of precharge on the
negative electrodes the cells were put through an electrical checkout.
The cell design is given in Table X.
Discharge curve for cell S/N 1 at 50 amperes and 100 amperes is
shown in Figures 15 and 16, respectively. This cell was formed in an
electrolyte containing lithium hydroxide, and also is filled with a
lithiated electrolyte. Lithiation depresses the voltage level slightly
during discharge. Lithiation is suspected also of depressing the
voltage level slightly during charge, which probably accounts for an(9)improved charge efficiency.( Charge efficiency is a
(8) H. N. Seiger, Presentation at Battery Workshop, NASA/GSFC, 1972(9) Private communication with Dr. R. Beauchamp, B.T.L.
- 53 -
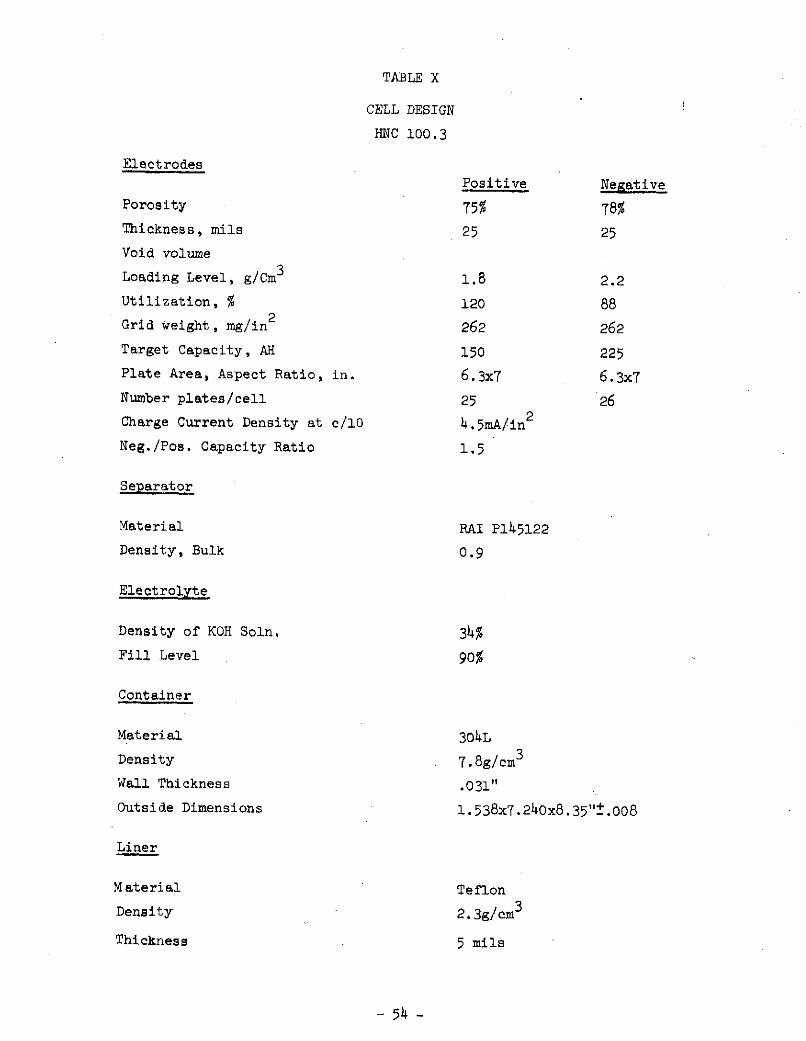
TABLE X
CELL DESIGN
HNC 100.3
Electrodes
Positive Negative
Porosity 75% 78%
Thickness, mils 25 25
Void volume
Loading Level, g/Cm3 1.8 2.2
Utilization, % 120 88
Grid weight, mg/in 2 262 262
Target Capacity, AH 150 225
Plate Area, Aspect Ratio, in. 6 .3x7 6 .3x7
Number plates/cell 25 26
Charge Current Density at c/10 4.5mA/in2
Neg./Pos. Capacity Ratio 1.5
Separator
Material RAI P145122
Density, Bulk 0.9
Electrolyte
Density of KOH Soln. 34%
Fill Level 90%
Container
Material 304L
Density 7.8g/cm3
Wall Thickness .031"
Outside Dimensions 1.538x7.240x8.35".008
Liner
Material Teflon
Density 2.3g/cm3
Thickness 5 mils
- 54 -
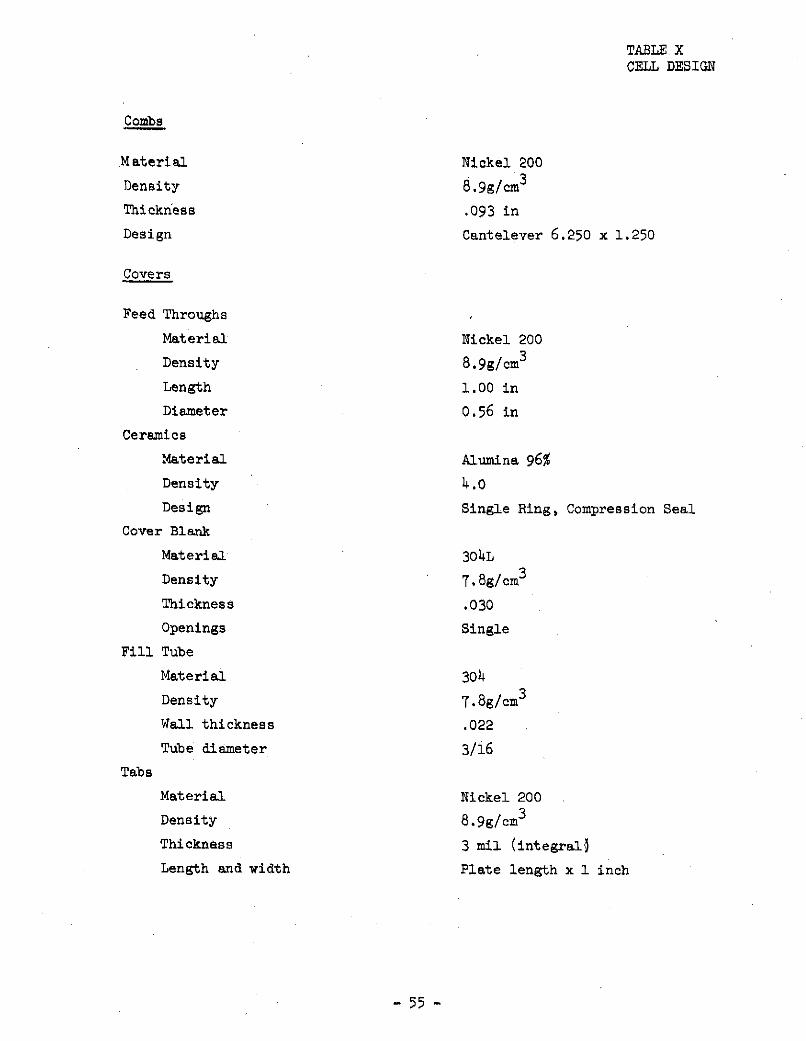
TABLE XCELL DESIGN
Combs
Material Nickel 200
Density 8.9g/cm 3
Thickness .093 in
Design Cantelever 6.250 x 1.250
Covers
Feed Throughs
Material Nickel 200
Density 8.9g/cm3
Length 1.00 in
Diameter 0.56 in
Ceramics
Material Alumina 96%
Density 4.0
Design Single Ring, Compression Seal
Cover Blank
Material 30 4L
Density 7.8g/cm3
Thickness .030
Openings Single
Fill Tube
Material 304
Density 7.8g/cm3
Wall thickness .022
Tube diameter 3/16
Tabs
Material Nickel 200
Density 8.9g/cm3
Thickness 3 mil (integral)
Length and width Plate length x 1 inch
- 55 -
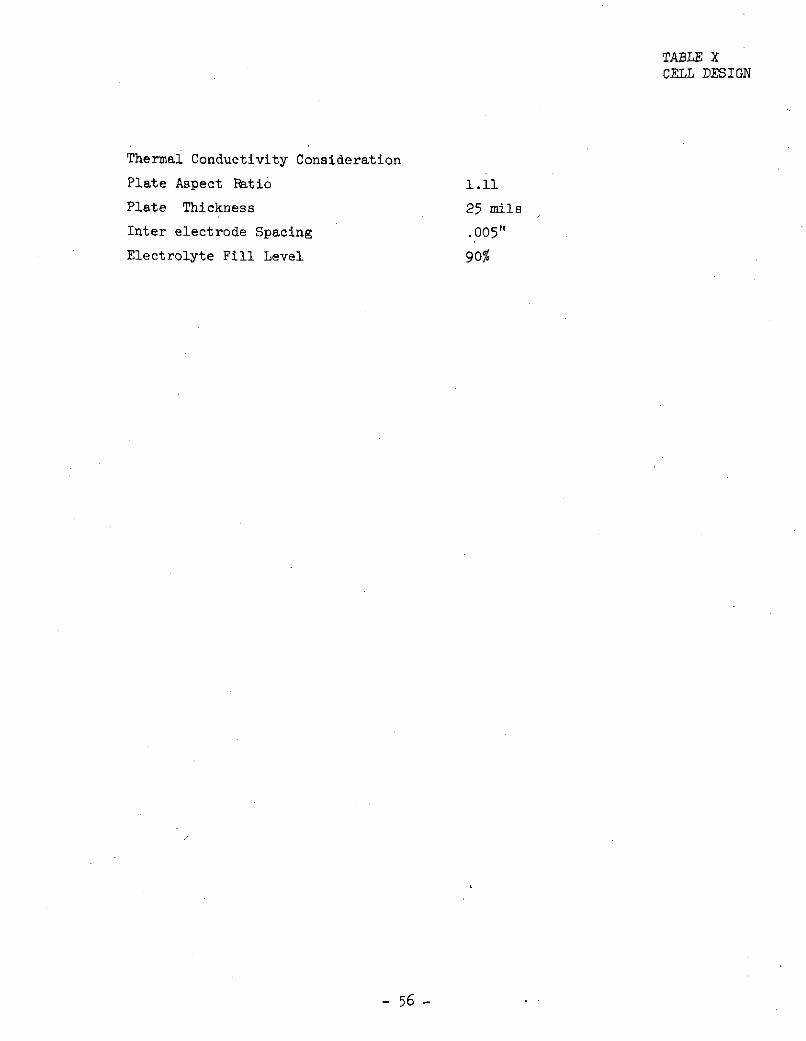
TABLE XCELL DESIGN
Thermal Conductivity Consideration
Plate Aspect Ratio 1.11
Plate Thickness 25 mils
Inter electrode Spacing .005"
Electrolyte Fill Level 90%
- 56 -
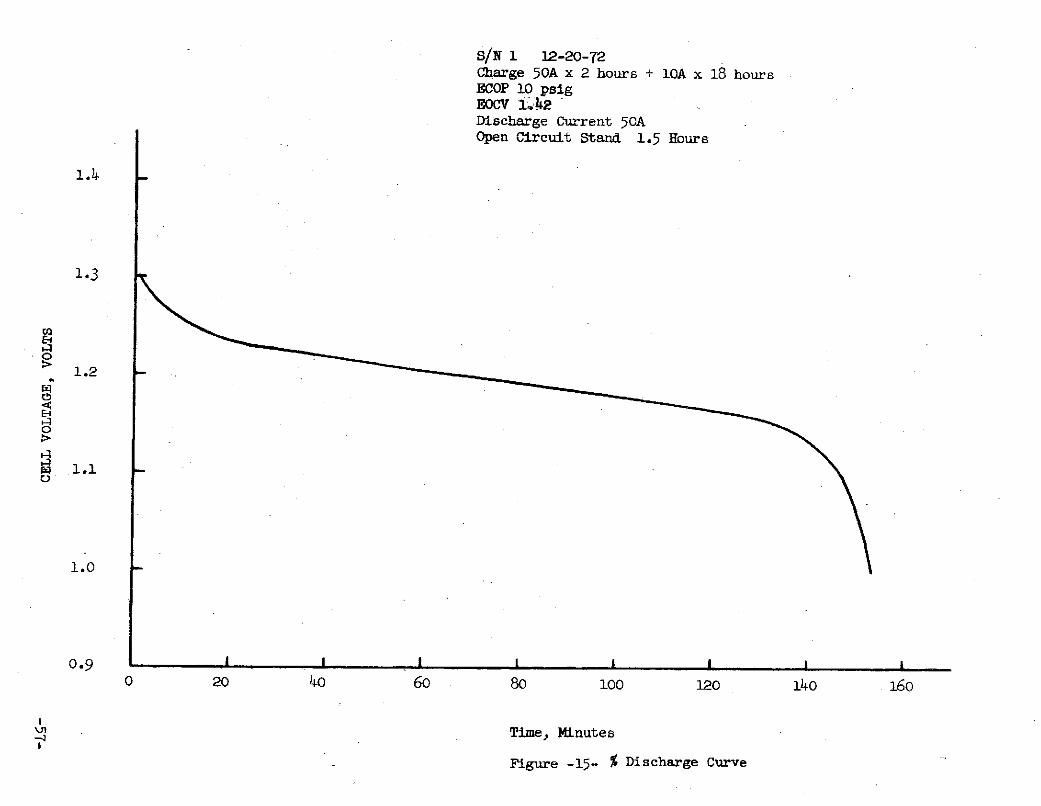
S/N 1 12-20-72Charge 50A x 2 hours + 10A x 18 hoursECOP 10 psigEOCV il.i4&2Discharge Current 50AOpen Circuit Stand 1.5 Hours
1.4
1.3
O
1.2
1.1
1.0
0.9 I I I I I0 20 40 60 80 100 120 140 160
Time, Minutes
Figure -15- % Discharge Curve
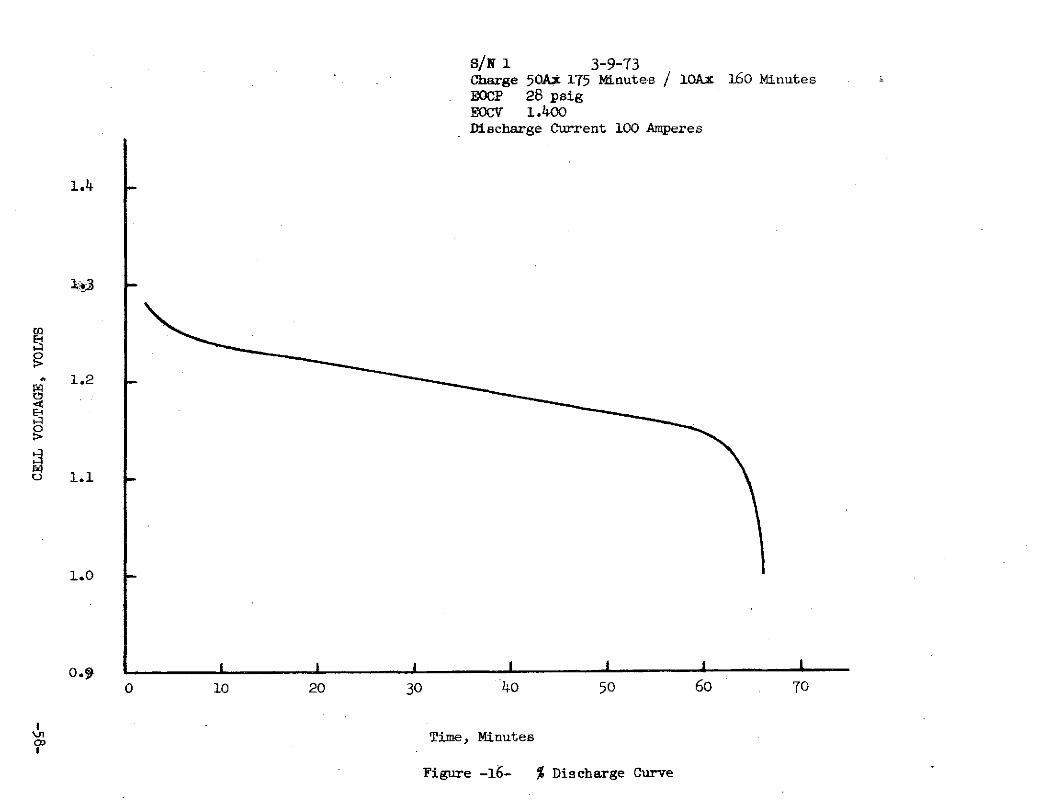
S/N 1 3-9-73Charge 50AX 175 Minutes / iAx 160 MinutesEOCP 28 psigEOCV 1.400Discharge Current 100 Amperes
1.2 -1.2
U 1.1
1.0
0.9 I I I I0 1o 20 30 4o 50 60 70
OTime, Minutes
Figure -16- % Discharge Curve
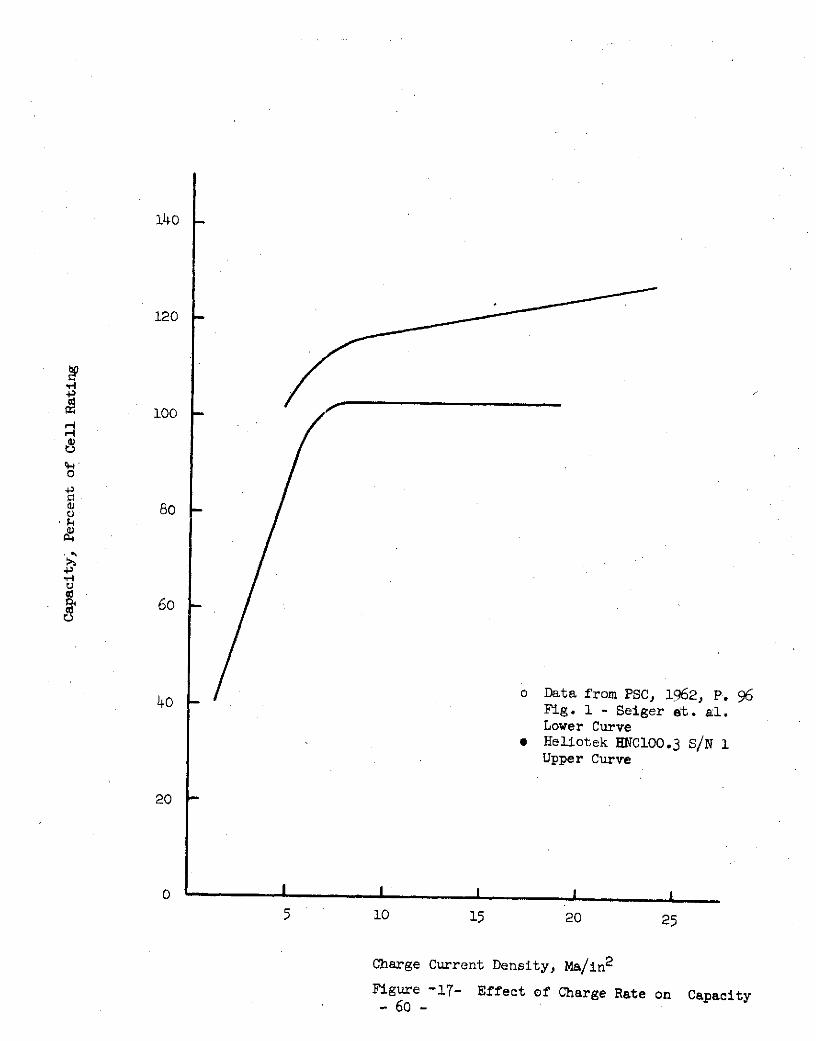
function, also, of charge rate, temperature and state of charge.* Effect
of charge rate on capacity on S/N 1 is shown in Figure 17 along with
previously published data.(10) Both sets of data indicate a decrease
of capacity at charge current densities below 7 mA/in2 of plate area.
(11)Similar findings were also observed by MacArthur.
As a result of the charge efficiency curves, it may be readily
concluded that charge efficiency may be improved by using thicker
plates. This will degrade the thermal transfer rate in proportion
to the decreased number of plates. However, decreasing the number
of plates also decreases weight and increases capacity. In the case
of the 100AH cell considered here, increasing plate thickness from
25 to 33 mils decreases' weight 6 ounces and increases capacity 5%.
The process of decreasing the number of plates would also decrease
the total geometric area of the negative electrodes. This in turn would
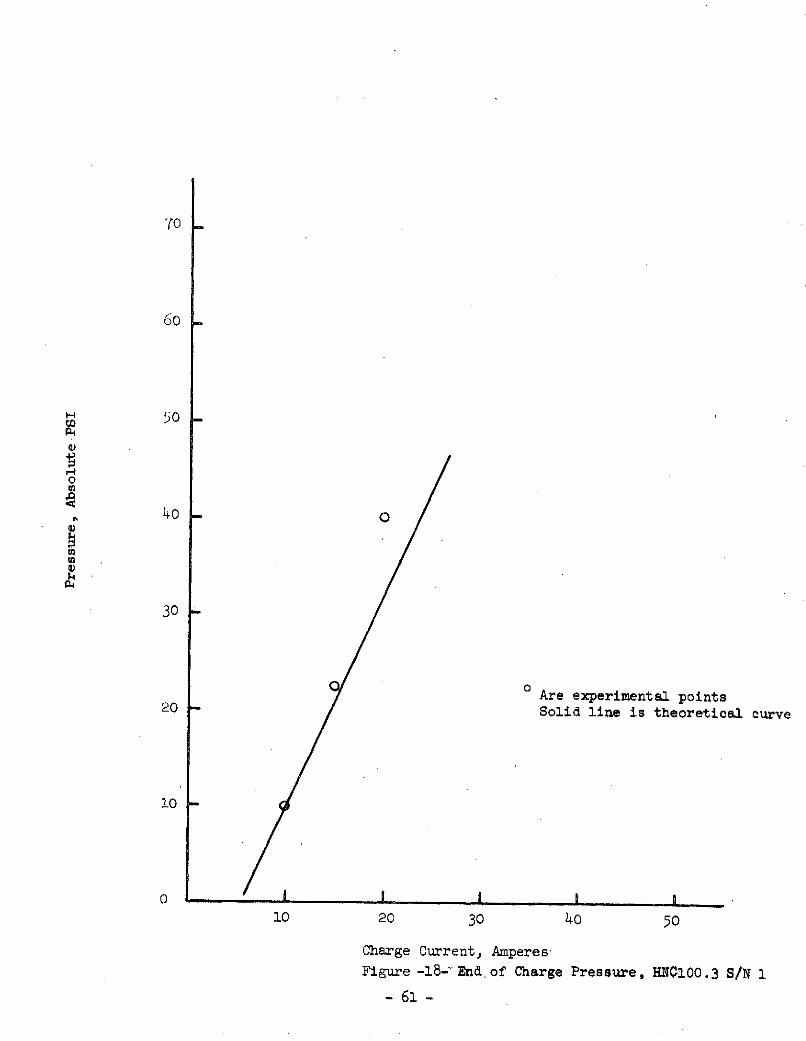
tend to increase the oxygen pressure during overcharge. To investigate
this effect the data obtained on a 10A (C/10) charge were used to
calculate the expected pressures at higher charge rates. The calculated
pressure-current curve is shown in Figure 18 along with three experimental
points corresponding to 15A (0/6.6) and 20A (C/5). The agreement
is not as close as one might want, but it is sufficient for estimation
of the pressures that may be expected when the number of plates in a
cell is decreased.
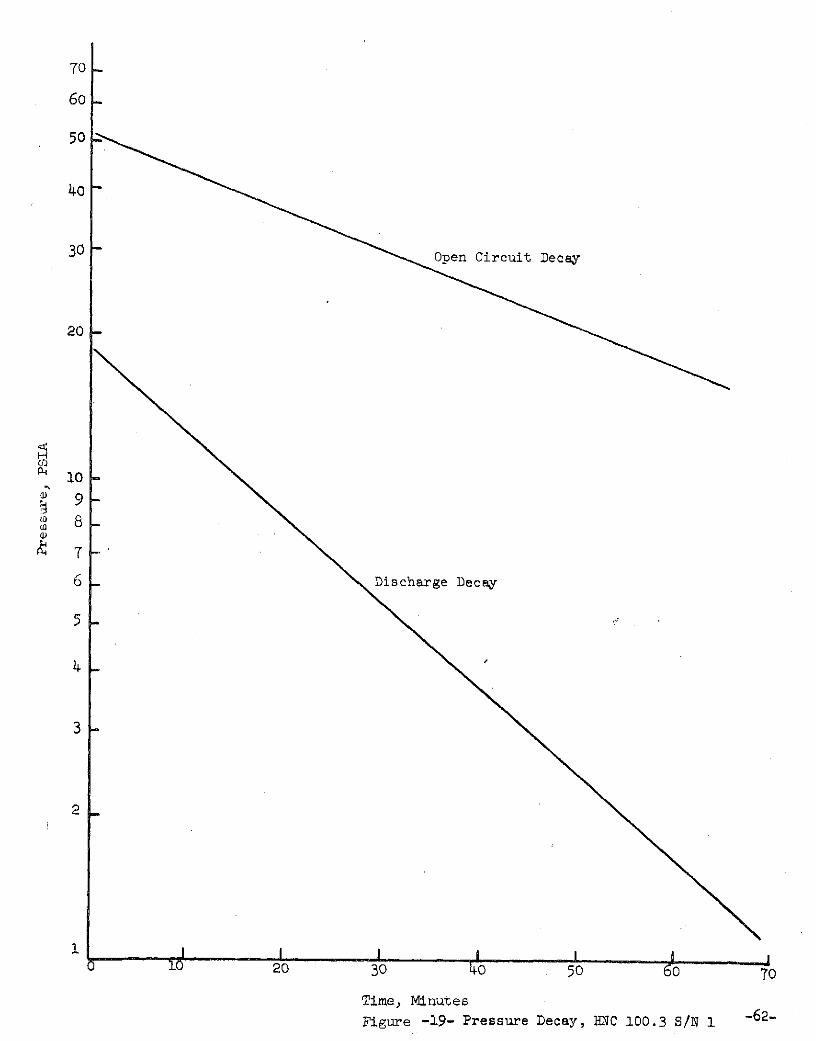
It has been known that the recombination rate of oxygen at the
negative electrode is greater during overcharge than while on open
circuit.(12) Figure 19 shows that the recombination rate for oxygen
consumption is also greater during discharge than it is on open circuit.
(10) H. N. Seiger, et al, Preceedings P.S.C., p. 96, 1962.
(11) D. MacArthur, Presentation at ECS Meeting, 1968
(12) H. N. Seiger, Presentation at the ECS Meeting, New York 1963
* Charging efficiencies are also dependent on the concentration of
the electrolyte.
- 59 -
120
100
0
80
6o60
40 o Data from PSC, 1962, P. 96Fig. 1 - Seiger et. al.Lower Curve
* Heliotek HNC100.3 S/N 1Upper Curve
20
0 I I I I I5 10 15 20 25
Charge Current Density, Ma/in 2
Figure -17- Effect of Charge Rate on Capacity- 60 -
6o
H50Co
40 0
30
0 Are experimental points20 Solid line is theoretical curve
10
o I I I I I10 20 30 40 50
Charge Current, Amperes
Figure -18-" End, of Charge Pressure, HNC100.3 S/N 1
- 61 -
70 -
60
50
40o
30Open Circuit Decay
20
10
9-8
7
6 Discharge Decay
5
4
3
2_
U 10 20 30 40 50 06 70
Time, Minutes
Figure -19- Pressure Decay, HNC 100.3 S/N 1 -62-
Hence, it is concluded that the recombination reaction is slower on open
circuit than it is when current passes through the cell. On open circuit
the time required for the pressure to decay to one-half its initial value,
t 1/2, is 38 minutes. During discharge it is 17 minutes. These numbers
are of value only for comparison in the same cell. Such numbers cannot
be used for comparison of different sizes of cells since the value largely
depends on the gas volume within a cell, which in turn is design dependent.
- 63 -
NEW TECHNOLOGY
While this program was carried out, eight new technology items were
identified and reported to NASA. These items are briefly identified as
follows:
1. Slurry Deaeration
The very slow rolling of slurry allows the slurry to release admixed
air. Rolling rates are 0.2 to 1.0 turns per minute. The rolling drum
capacity is 15 gallons, but is never more than 2/3 filled.
2. Oxamide Pore Former
An insoluble crystal decomposing into gaseous products at some
temperature above ambient but below sintering was needed to control
pores. The organic compound oxamide fulfills the characteristics
needed.
3. Slurry Applicator
The machine designed for applying slurry to the grid has several
key features. These are: (1) a pumping of slurry through to pores to
ensure complete filling, (2) a set of guides to ensure that the grid
is centrally located in the sinter and (3) a closed box-like structure
to prevent admixture of air in the slurry scraped off the wet green
plaque.
4. Temperature Ramp Profile
The need for a gradual increase of temperature as the plaque enters
the furnace was recognized. This permits ablation of the binder and the
pore former. It also provides the temperature for nickel oxidation.
- 64
5. Mechanical Strength Testing Apparatus
In response to a need for strength measurements independent of gridlocation a testing device was designed. The design measures the degree
of degradation of sintered plaque to a coining force. A dead weight is
applied to the plaque through a set of anvils and the degree of coining
is measured.
6. Surface Area Measurements
The electrode/electrolyte interfacial area was measured using a
pulsed potential step technique. To avoid errors due to faradaic processesa small potential step is applied to the test sample. The current required
to bring the sample to a steady state at the new potential is measured andused for surface area calculations.
7. Oxygenation Prior to Sintering
It was found that admission of oxygen in limited quantity to thesintering furnace in that region where the temperature is still belowsintering conditions improved the sinter. The first advantage was abetter adhesion of sinter to the substrate. The second advantage wasa uniform sinter that was strong. A third advantage is that the amount ofoxygen can be precisely controlled.
Oxygenation is however common to other metallurgical sintering
processes.
8. Design of the 100 AH Cell
The opposed terminals with large cross-sectional areas coupled withthe thin plates conducts heat to the broad surface of the cell readily.
- 65 -

To further enhance this conduction the case of the cell is common with
the negative electrodes. Enhancement of thermal conductivity was further
achieved by elimination of air that could be entrapped in the electrodes.
- 66 -
CONCLUDING REMARKS
The primary objectives of this program to develop the procedures
and controls, and select the materials and equipment necessary to
determine the production methods needed to secure uniform, consistent
and defect-free plaque material has been completely attained. In
fact, the results of the program exceed the goals in that not only
is the plaque very uniform, defect free, and controllable, it is
also quite strong and easily loaded with active materials.
In retrospect, some information of interest that developed
during the course of this contract is:
(1) Accurate control of the oxidizing atmosphere and temperatures
in firing produces uniform sintering throughout the plaque.
and promotes adhesion of sinter to grid.
(2) The addition of a pore former to the slurry apparently not
only provides controlled vestibales within the plaque to allow
easy access to the depth of the plaque but also contributes to
the final strength.
(3) Large voids in the plaque can be avoided simply by removing
entrapped air by a simple rolling process.
(4) Use of guide fingers in the doctor blade assembly to position
the grid within the plaque.
(5) Establishing that utilization of active material depends upon
sinter porosity.
(6) Establishing that the capacity is dependent upon charge rate,
and that there is a significant fall-off of capacity at charge
current densities below 7 MA/in 2
(7) Finding that air may be entrapped within the cell which should
be eliminated. This thereby increases the volume of electrolyte
injected into a cell, but there is no sacrifice in overcharge
performance.
(8) The oxygen recombination rate is slower on open circuit.than it
is during charge and'discharge.
- 67 -
(9) The surface area of plaque that is involved in the electrode/
electrolyte interface can be determined by a voltage pulse
technique.
(10) Recognizing that the Cd(OH)2 precipitated during conversion from
the nitrates acts as a dialysis membrane, has given rise to
process change that makes the loading of the negative electrodes
more uniform.
(11) Tracing the stresses in the positive electrodes to the nature
of the nickel hydroxide precipitated led to process changes that
decreased blistering and thickening.
- 68 -
RECOMMENDATIONS
The design of large size nickel cadmium cells can be altered
to increase the specific energy to values in excess of 20 WH/lb
without sacrifice of quality. Thus, the weight of a 100 AH cell
targetted to deliver 125AH can be reduced to the neighborhood of
six pounds. The specific recommendations to accomplish this follow,
but it must be recognized that the strong uniform plaque developed
under this program permit these recommendations.
1. Investigate the use of more porous and thicker positive plaque
materials. The increased strength of the plaque developed under
this program allows such a change. With more porous plaque the
ratio of active material to inactive material is increased. Such
changes must be made within the constraint that the utilization
of positive active material decreases with increased porosity.
2. Investigate the use of more porous and thicker negative electrode
compatible with the positive plaque material. As plaque.becomes
both thicker and more porous it tends to weaken. The optimal
design characteristics should be sought.
3. Develop a computer program for design of battery cells. Changes
in utilization and aspect ratios incur changes in separator volume
and can weights. Optimization of batteries is too complicated
to be done analytically, and an appropriate computer program
can determine the optima.
4. Increase loading levels of the positive electrode by use of
electrochemical deposition of active materials. Such methods
allow loadings of 1.8 g/cm 3 of void or higher while decreasing theincidence of defects due to blistering and decreasing the total amount
of thickening.
5. Decrease sinter corrosion during impregnation. This may be done
readily by maintaining the sinter at a cathodic potential whenever
it is in contact with a corrosive environment.
- 69 -
ACKNOWLEDGEMENTS
The authors wish to acknowledge the contribution of many people
who have helped in various ways to carry out the program. These include
notably Mr. J. Fredrick Jansen, Mr. R. Oliver, Mr. M. van Leeuwen and
Mr. Eugene Ralph. Measurements and fabrication were carried out by
Dr. N. P. Yao; Dr. Vincent Puglisi, Mr. M. Milden, Mr. Walter Perrin,
Mrs. Carlene Bonnell. Mr. Paul Ritterman's assistance in the final
stages of the program was invaluable.
- 70 -

APPENDIX I
- 71 -
APPENDIX I
DERIVATION OF THE MAXIMUM CAPACITY RELATIONSHIPS
Formation cycling and other testing of positive electrodes under
flooded conditions indicate that the dischargeable capacity exceeds
the theoretical capacity. The theoretical capacity is obtained by
obtainig the weight gain as Ni(OH)2 after loading and basing the cal-
culation on a one electron change. The reason for greater than theo-
retical values may be due either to conversion of some sintered metal
or oxidation to a valence state greater than 3. Workers at Bell Telephone
Laboratories reported that there is no apparent attack on the sinter.
It is not the purpose of this writing to ascertain the fundamental
mechanism for values in excess of theoretical, but rather to note some
isolated findings that appear to indicate a relationship between the
dischargeable capacity and plaque characteristics.
Dr. Beauchamp and Maurer of BTL observe capacities exceeding theo-
retical loadings by 20%. Results in this laboratory on similar plaque
were also 20% above theoretical. The plaque used was made by a slurry
process and had a sinter porosity of 72%.* Plates made using plaque
made by the loose powder method yielded 5% more capacity than the
theoretical value. These plaques were 82% porous. Many years ago
similar plates were found to yield values of 2 to 3% above theoretical
values. Recently, a third point has been added. Heliotek produced plaque
with a sinter porosity of 75% and obtained a formation capacity 15% above
the theoretical. Admittedly, these findings did not come from a controlled
experiment and require substantiation, but they are based on experiments
by several groups. These data are plotted in Figure A-1. A straight line
was eyeballed through these data points. The equation for the line is:
*Porosities are given based on the sinter neglecting the presence of thegrid. This procedure eliminates consideration of thickness and the grid.
- 72 -
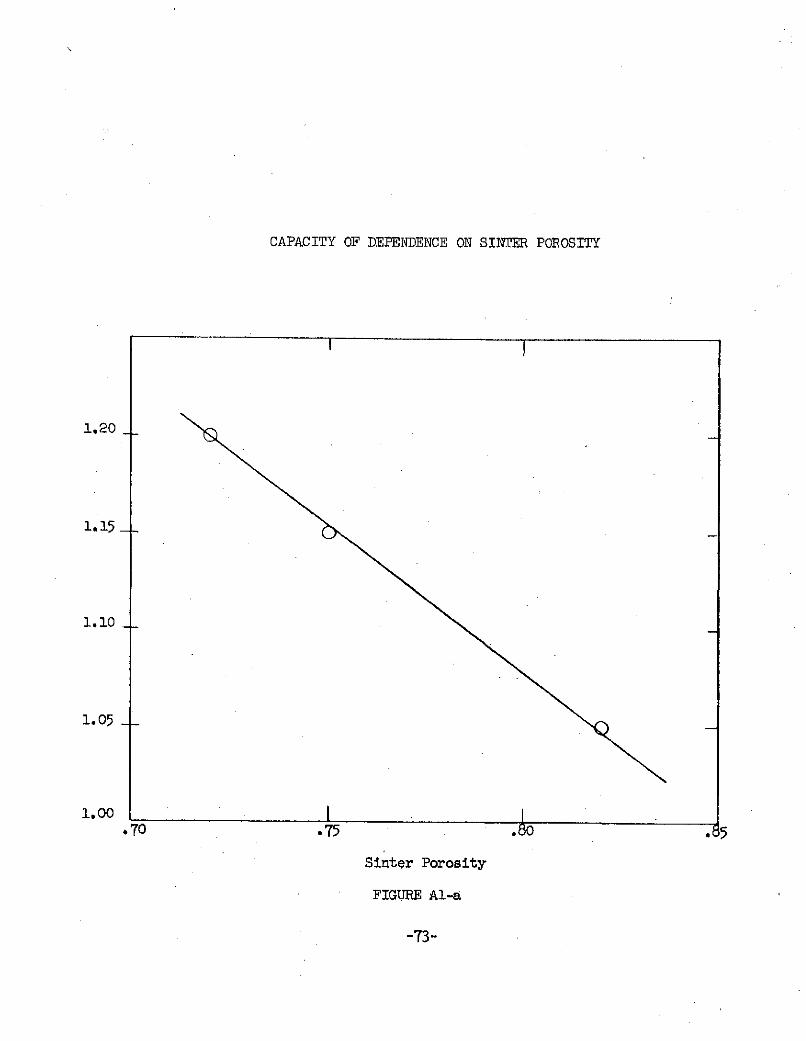
CAPACITY OF DEPENDENCE ON SINTER POROSITY
1.20
1. 15
1.10
1.05
1.00.70 .75 .80
Sinter Porosity
FIGURE Al-a
-73-
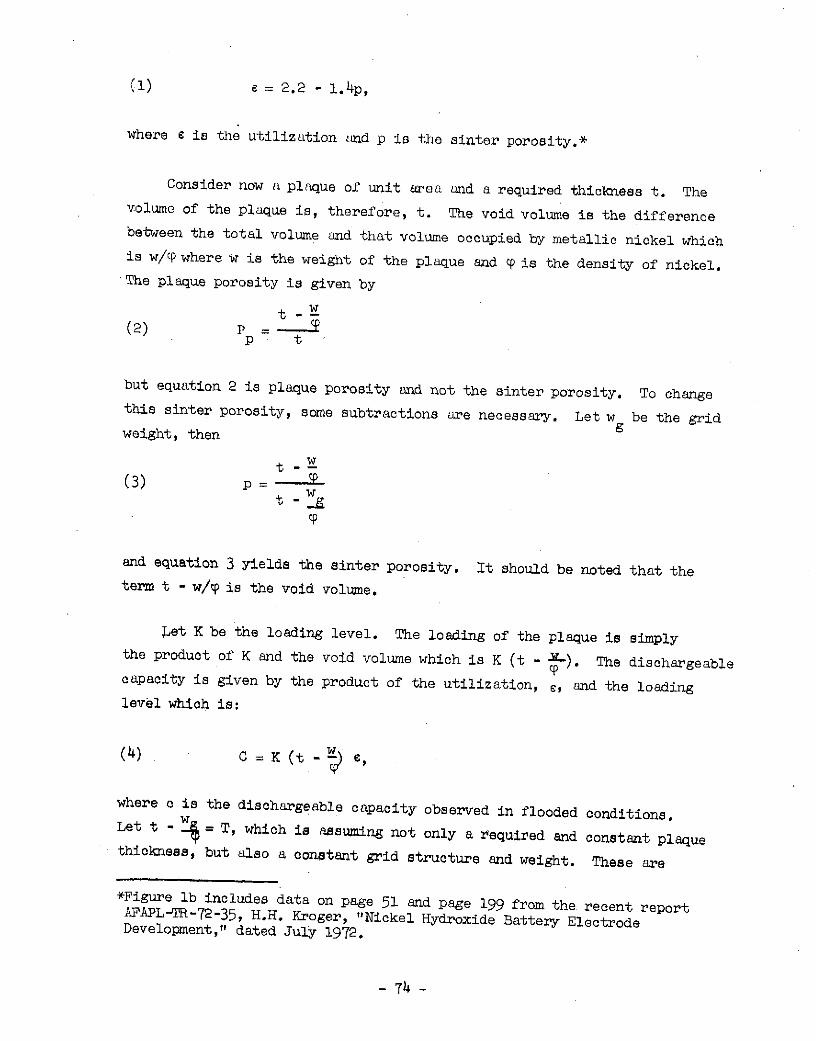
(1) e = 2.2 - 1.4p,
where e is the utilization aInd p is the sinter porosity.*
Consider now a plaque of unit area and a required thickness t. Thevolume of the plaque is, therefore, t. The void volume is the differencebetween the total volume and that volume occupied by metallic nickel whichis w/cP where w is the weight of the plaque and p is the density of nickel.The plaque porosity is given by
t - w
(2) P = - -_p t
but equation 2 is plaque porosity and not the sinter porosity. To changethis sinter porosity, some subtractions are necessary. Let w be the gridweight, then
t w
(3) P = ,Pt- w
and equation 3 yields the sinter porosity. It should be noted that theterm t - w/ is the void volume.
Let K be the loading level. The loading of the plaque is simplythe product of K and the void volume which is K (t - -f). The dischargeablecapacity is given by the product of the utilization, e, and the loadinglevel which is:
(4) C = K (t - E,
where c is the dischargeable capacity observed in flooded conditions.Let t - w = T, which is assuming not only a required and constant plaquethickness, but also a constant grid structure and weight. These are
*Figure lb includes data on page 51 and page 199 from the recent reportAFAPL-TR-72-35, H.H. Kroger, "Nickel Hydroxide Battery ElectrodeDevelopment," dated July 1972.
- 74 -
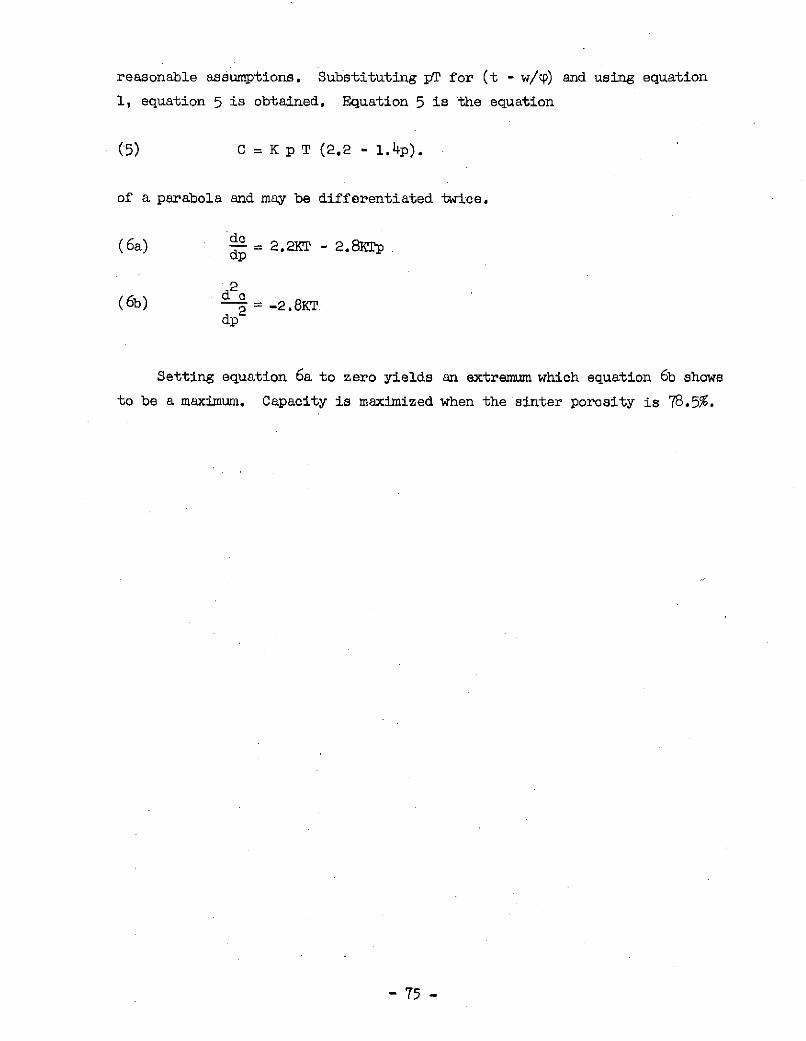
reasonable assumptions. Substituting pT for (t - w/p) and using equation
1, equation 5 is obtained. Equation 5 is the equation
(5) C = K p T (2.2 - 1.4p).
of a parabola and may be differentiated twice.
(6a) dc 2.2KT - 2.8ITpdp
2(6b) d = -2.8
dp
Setting equation 6 a to zero yields an extremum which equation 6b shows
to be a maximum. Capacity is maximized when the sinter porosity is 78.5%.
- 75 -