Embed Size (px)
Citation preview
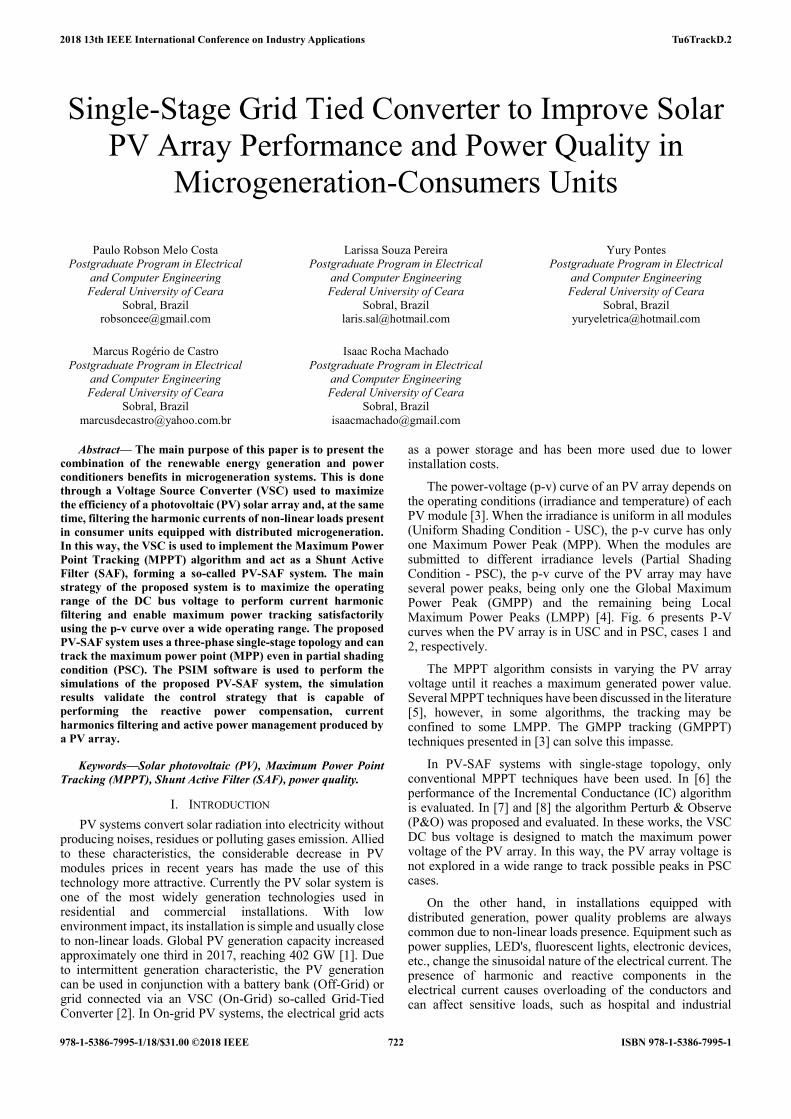
Single-Stage Grid Tied Converter to Improve Solar
PV Array Performance and Power Quality in
Microgeneration-Consumers Units
Paulo Robson Melo Costa
Postgraduate Program in Electrical
and Computer Engineering
Federal University of Ceara
Sobral, Brazil [email protected]
Marcus Rogério de Castro
Postgraduate Program in Electrical
and Computer Engineering
Federal University of Ceara
Sobral, Brazil
Larissa Souza Pereira
Postgraduate Program in Electrical
and Computer Engineering
Federal University of Ceara
Sobral, Brazil [email protected]
Isaac Rocha Machado
Postgraduate Program in Electrical
and Computer Engineering
Federal University of Ceara
Sobral, Brazil
Yury Pontes
Postgraduate Program in Electrical
and Computer Engineering
Federal University of Ceara
Sobral, Brazil [email protected]
Abstract— The main purpose of this paper is to present the
combination of the renewable energy generation and power
conditioners benefits in microgeneration systems. This is done
through a Voltage Source Converter (VSC) used to maximize
the efficiency of a photovoltaic (PV) solar array and, at the same
time, filtering the harmonic currents of non-linear loads present
in consumer units equipped with distributed microgeneration.
In this way, the VSC is used to implement the Maximum Power
Point Tracking (MPPT) algorithm and act as a Shunt Active
Filter (SAF), forming a so-called PV-SAF system. The main
strategy of the proposed system is to maximize the operating
range of the DC bus voltage to perform current harmonic
filtering and enable maximum power tracking satisfactorily
using the p-v curve over a wide operating range. The proposed
PV-SAF system uses a three-phase single-stage topology and can
track the maximum power point (MPP) even in partial shading
condition (PSC). The PSIM software is used to perform the
simulations of the proposed PV-SAF system, the simulation
results validate the control strategy that is capable of
performing the reactive power compensation, current
harmonics filtering and active power management produced by
a PV array.
Keywords—Solar photovoltaic (PV), Maximum Power Point
Tracking (MPPT), Shunt Active Filter (SAF), power quality.
I. INTRODUCTION
PV systems convert solar radiation into electricity without producing noises, residues or polluting gases emission. Allied to these characteristics, the considerable decrease in PV modules prices in recent years has made the use of this technology more attractive. Currently the PV solar system is one of the most widely generation technologies used in residential and commercial installations. With low environment impact, its installation is simple and usually close to non-linear loads. Global PV generation capacity increased approximately one third in 2017, reaching 402 GW [1]. Due to intermittent generation characteristic, the PV generation can be used in conjunction with a battery bank (Off-Grid) or grid connected via an VSC (On-Grid) so-called Grid-Tied Converter [2]. In On-grid PV systems, the electrical grid acts
as a power storage and has been more used due to lower installation costs.
The power-voltage (p-v) curve of an PV array depends on the operating conditions (irradiance and temperature) of each PV module [3]. When the irradiance is uniform in all modules (Uniform Shading Condition - USC), the p-v curve has only one Maximum Power Peak (MPP). When the modules are submitted to different irradiance levels (Partial Shading Condition - PSC), the p-v curve of the PV array may have several power peaks, being only one the Global Maximum Power Peak (GMPP) and the remaining being Local Maximum Power Peaks (LMPP) [4]. Fig. 6 presents P-V curves when the PV array is in USC and in PSC, cases 1 and 2, respectively.
The MPPT algorithm consists in varying the PV array voltage until it reaches a maximum generated power value. Several MPPT techniques have been discussed in the literature [5], however, in some algorithms, the tracking may be confined to some LMPP. The GMPP tracking (GMPPT) techniques presented in [3] can solve this impasse.
In PV-SAF systems with single-stage topology, only conventional MPPT techniques have been used. In [6] the performance of the Incremental Conductance (IC) algorithm is evaluated. In [7] and [8] the algorithm Perturb & Observe (P&O) was proposed and evaluated. In these works, the VSC DC bus voltage is designed to match the maximum power voltage of the PV array. In this way, the PV array voltage is not explored in a wide range to track possible peaks in PSC cases.
On the other hand, in installations equipped with distributed generation, power quality problems are always common due to non-linear loads presence. Equipment such as power supplies, LED's, fluorescent lights, electronic devices, etc., change the sinusoidal nature of the electrical current. The presence of harmonic and reactive components in the electrical current causes overloading of the conductors and can affect sensitive loads, such as hospital and industrial
2018 13th IEEE International Conference on Industry Applications Tu6TrackD.2
978-1-5386-7995-1/18/$31.00 ©2018 IEEE 722 ISBN 978-1-5386-7995-1
equipment. The Shunt Active Filter (SAF) can eliminate for these undesirable harmonic components so that only the fundamental current component is supplied by the grid [9].
In addition to reactive and harmonic power compensation, the SAF can also be used for active power grid injection if there is any energy source connected to DC bus, such as fuel cell or solar PV array. If the PV array is used, the system is so-called PV-SAF system. The single-stage topology designation derives from connecting the PV Array directly to the DC bus, eliminating the use of an intermediate DC/DC converter, increasing system efficiency and decreasing the number of circuit components. The disadvantage of this topology is the need for a large number of PV modules connected in a string to achieve the DC bus voltage compatible with the AC grid voltage.
Several SAF control strategies were proposed, such as the control based on the PQ theory [10-12], lattice wave digital filter (LWDF) based control approach [13], adaptive controls schemes [6], synchronous reference frame theory (SRF) [7] and character of triangle function (CTF) control technique [8].
This work presents the design and analysis of a PV-SAF system with single-stage topology optimized for the GMMPT algorithm execution. The system is evaluated in Partial Shading Condition and non-linear load. The SAF control strategy is based on the PQ or instantaneous powers theory and the GMPPT technique is based on the estimation of the possible power peaks location in p-v curve. The main advantages of the proposed system are:
1) Development of a topology that combines renewable energy management with power quality improvement for microgenerating-consuming units;
2) Power factor improvement during day and night;
3) Improvement in the harmonics filtering performance due to the Moving Average Filter (MAF) used to separate the instantaneous powers components (average and oscillating components);
4) Simplified topology (single-stage), eliminating the use of an intermediate DC/DC converter, decreasing losses and complexity;
5) PV array efficiency improvement in PSC due to the fast GMPPT algorithm proposed;
6) Operating voltage range (tracking voltage range) increasing due to the use of the Space Vector Modulation (SVPWM) technique. For a given rated grid voltage, the SVPWM technique allows the use of a lower DC-bus voltage without compromising vectorial current control.
The performance of the proposed system is analyzed in a permanent and transient periods through simulations implemented in the PSIM software.
II. SYSTEM STRUCTURE AND DESIGN
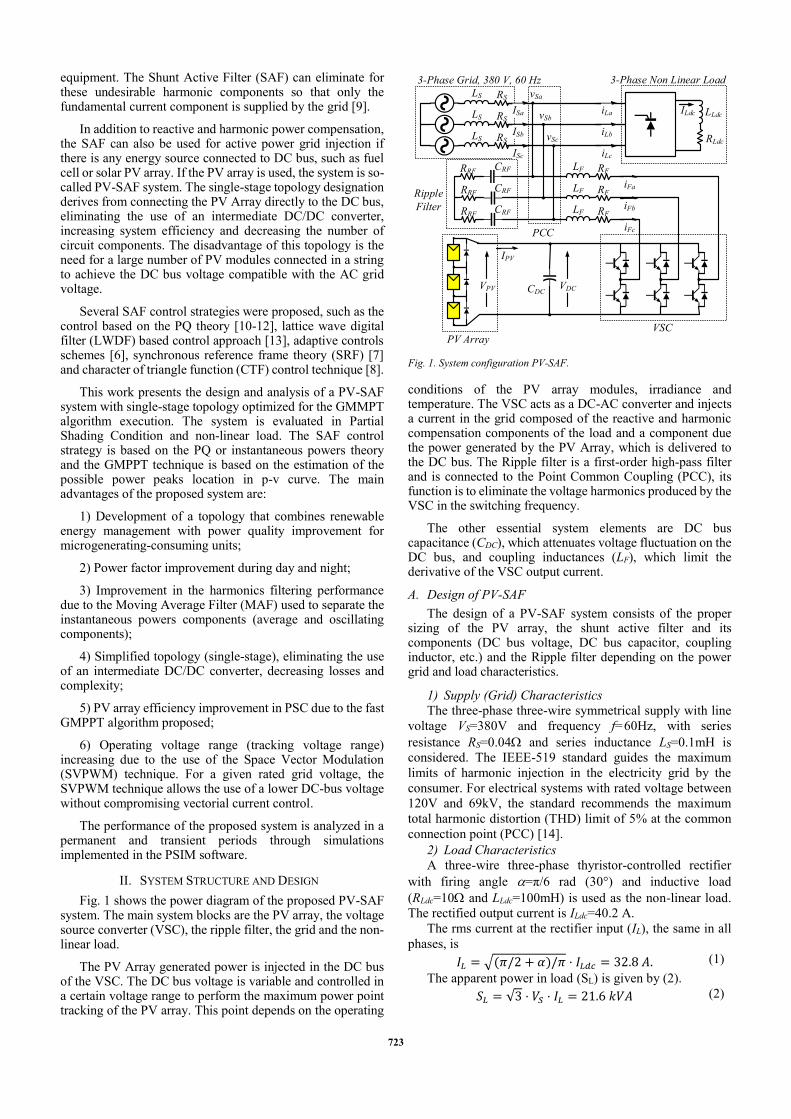
Fig. 1 shows the power diagram of the proposed PV-SAF system. The main system blocks are the PV array, the voltage source converter (VSC), the ripple filter, the grid and the non-linear load.
The PV Array generated power is injected in the DC bus of the VSC. The DC bus voltage is variable and controlled in a certain voltage range to perform the maximum power point tracking of the PV array. This point depends on the operating
conditions of the PV array modules, irradiance and temperature. The VSC acts as a DC-AC converter and injects a current in the grid composed of the reactive and harmonic compensation components of the load and a component due the power generated by the PV Array, which is delivered to the DC bus. The Ripple filter is a first-order high-pass filter and is connected to the Point Common Coupling (PCC), its function is to eliminate the voltage harmonics produced by the VSC in the switching frequency.
The other essential system elements are DC bus capacitance (CDC), which attenuates voltage fluctuation on the DC bus, and coupling inductances (LF), which limit the derivative of the VSC output current.
A. Design of PV-SAF
The design of a PV-SAF system consists of the proper sizing of the PV array, the shunt active filter and its components (DC bus voltage, DC bus capacitor, coupling inductor, etc.) and the Ripple filter depending on the power grid and load characteristics.
1) Supply (Grid) Characteristics
The three-phase three-wire symmetrical supply with line
voltage VS=380V and frequency f=60Hz, with series
resistance RS=0.04 and series inductance LS=0.1mH is
considered. The IEEE-519 standard guides the maximum
limits of harmonic injection in the electricity grid by the
consumer. For electrical systems with rated voltage between
120V and 69kV, the standard recommends the maximum
total harmonic distortion (THD) limit of 5% at the common
connection point (PCC) [14].
2) Load Characteristics
A three-wire three-phase thyristor-controlled rectifier
with firing angle =π/6 rad (30°) and inductive load
(RLdc=10 and LLdc=100mH) is used as the non-linear load.
The rectified output current is ILdc=40.2 A.
The rms current at the rectifier input (IL), the same in all
phases, is
𝐼𝐿 = √(𝜋/2 + 𝛼)/𝜋 ⋅ 𝐼𝐿𝑑𝑐 = 32.8 𝐴. (1)
The apparent power in load (SL) is given by (2).
𝑆𝐿 = √3 ⋅ 𝑉𝑆 ⋅ 𝐼𝐿 = 21.6 𝑘𝑉𝐴 (2)
RSLS
RSLS
RSLS
RFLF
RFLF
RFLF
CDC
RRFCRF
RRFCRF
RRFCRF
VPV VDC
IPV
VSCPV Array
3-Phase Non Linear Load
RLdc
LLdcILdciLa
iLb
iLc
ISa
ISb
ISc
iFa
iFb
iFc
3-Phase Grid, 380 V, 60 Hz
Ripple
Filter
PCC
vSa
vSb
vSc
Fig. 1. System configuration PV-SAF.
723
Equation (3) shows the rms fundamental component (1st
harmonic) of the rectifier input current (IL1).
𝐼𝐿1 = 2√2 ⋅ 𝐼𝐿𝑑𝑐 ⋅ 𝑠𝑖𝑛(𝜋/4 + 𝛼/2)/𝜋 = 31.3 𝐴 (3)
The first harmonic displacement angle of rectifier input
current with reference to voltage phase () is the same of
thyristor firing angle (), =30°.
The load active power in the fundamental frequency (PL)
is given.
𝑃𝐿 = √3 ⋅ 𝑉𝑆 ⋅ 𝐼𝐿1 ⋅ 𝑐𝑜𝑠(𝜃) = 17.8 𝑘𝑊 (4)
Equation (5) shows the total load reactive power (QL) in
the fundamental frequency.
𝑄𝐿 = √3 ⋅ 𝑉𝑆 ⋅ 𝐼𝐿1 ⋅ 𝑠𝑖𝑛(𝜃) = 10.3 𝑘𝑉𝐴𝑟 (5)
The harmonic content of rectifier input current (ILh) is
given by:
𝐼𝐿ℎ = √𝐼𝐿2 − 𝐼𝐿1
2 = 9.7 𝐴. (6)
So, the total harmonic power on the load, given by HL, is:
𝐻𝐿 = √3 ⋅ 𝑉𝑆 ⋅ 𝐼𝐿ℎ = 6.4 𝑘𝑉𝐴. (7)
For n=1,3,5,..., the nth harmonic of rectifier input current
can be given by (8).
𝑖𝐿𝑛 =4 𝐼𝐿𝑑𝑐𝑛𝜋
𝑠𝑖𝑛 (𝑛(𝜋/2 + 𝛼)
2) 𝑐𝑜𝑠(2𝜋𝑛𝑓𝑡 + 𝛿𝑛) (8)
Calculating the time-derivative of equation (8), the
maximum slope for the nth harmonic is obtained.
(𝑑𝑖𝐿𝑛𝑑𝑡)𝑚𝑎𝑥
=8𝑓𝐼𝐿𝑑𝑐𝑛
𝑠𝑖𝑛 (𝑛(𝜋/2 + 𝛼)
2) (9)
Thus, given that 𝑖𝐿 = ∑ 𝑖𝐿𝑛, it follows:
(𝑑𝑖𝐿𝑑𝑡)𝑚𝑎𝑥
= ∑ (𝑑𝑖𝐿𝑛𝑑𝑡)𝑚𝑎𝑥
∞
𝑛=1
. (10)
The result of (10), up to 50th harmonic component is
calculated, in according to IEEE-519, and the maximum
derivative iL is:
(𝑑𝑖𝐿𝑑𝑡)𝑚𝑎𝑥
= 284.1 𝑘𝐴/𝑠. (11)
3) SAF Design
The shunt active filter (SAF) design comprises the VSC
project and passive components sizing.
Based on design criteria taking account the load and grid
characteristics, the DC bus voltage level (VDC), DC bus
capacitance (CDC), coupling inductance (LF), switching
frequency (fS) and ripple filter (RRF and CRF) are determinates.
The design parameters used for the SAF were: 2% of
maximum ripple in the DC bus voltage (ΔVDC); maximum
output current ripple ∆IF=6%. The switching frequency is
fs=100kHz.
The SAF is used to compensate all reactive and harmonic
content of the current load. In addition, the energy generated
by the PV Array must be injected in the power grid. Taking
account the result of the maximum power generated by the
PV Array at (19) and adding a 25% margin for transients, a
nominal power of the SAF is given by (12).
𝑆𝐴𝑃𝐹 = 1.25√𝑃𝑃𝑉2 + 𝑄𝐿
2 + 𝐻𝐿2 = 17.4 𝑘𝑉𝐴
(12)
So, 18kVA is considered.
The DC bus voltage operating range must be chosen to
ensure the compensation of the maximum derivative load
current in (11). At the same time, it must also be limited to
keep the current ripple at acceptable levels.
The lower limit of the VDC operating range (VDCmin)
depends of the rated power grid voltage and the kind of
modulation applied to control the VSC power switches. The Space Vector modulation technique was chosen due
to the DC bus more efficient use and the lower harmonic voltage distortion compared to the sinusoidal PWM (SPWM) or Hysteresis technique [15].
Considering the maximum modulation index in the submodulation region operation, m=0.907, the VDCmin can be chose by (13) [16]:
𝑉𝐷𝐶𝑚𝑖𝑛 = √2𝑉𝑆/𝑚 = 590 𝑉 (13)
After that, the coupled inductance is computed to limit the
high frequencies components of current and at the same time,
allows the harmonic compensating. Therefore, is necessary
ensuring that [17]:
𝐿𝐹 ≤ (𝑉𝐷𝐶𝑚𝑖𝑛 − 𝑉𝑆/√3)/(𝑑𝑖𝐿/𝑑𝑡 )𝑚𝑎𝑥= 0.99 𝑚𝐻
(14)
The maximum DC bus voltage is designed to maintain the ripple of the filter output current within the acceptable threshold (ΔIF) to the designed coupling inductance value. Considering the result obtained in (12), the SAF output current
peak value is: 𝐼𝐹𝑝 = √2/3𝑆𝐴𝑃𝐹/𝑉𝑆 . The upper limit of the
VDC operating range (VDCmax) is defined in (15) [17].
𝑉𝐷𝐶𝑚𝑎𝑥 = 2𝐿𝐹𝐼𝐹𝑝∆𝐼𝐹𝑓𝑆 + √2/3𝑉𝑆 = 774.4 𝑉 (15)
The DC bus capacitance sizing is based on the DC bus
voltage ripple resulting from load unbalance (2th harmonic)
[9].
𝐶𝐷𝐶 =𝑆𝐴𝑃𝐹
4𝜋∆𝐼𝐹𝑓∆𝑉𝐷𝐶𝑉𝐷𝐶𝑚𝑎𝑥2 = 1991 𝜇𝐹. (16)
Was considered CDC=2000μF.
For the sizing of the Ripple Filter, the filter time constant
must be much shorter than the power grid fundamental
frequency (f), RRFCRF<1/f. Considering RRFCRF=2TS, where
RRF and CRF are the resistance and the capacitance of the
Ripple Filter, respectively, and TS are the switching period of
the VSC. Since the switching frequency is equal to 100kHz,
the selected ripple filter parameters are RRF=5Ω and
CRF=4μF. The filter impedance at the switching frequency is
5.0Ω and at the fundamental frequency is 663.2Ω, which is
sufficiently large and thus the ripple filter drains a negligible
current at the fundamental frequency [9].
After the design of the SAF, is presented the proper sizing
of the PV array.
B. PV Array Design
In the PV array design, the number of PV modules and how they are connected must be chosen. In the single-stage topology, the PV array is directly connected to the DC bus of the VSC. So, without the step-up (boost) stage, the modules must be connected in series to reach the required DC bus voltage. The maximum power voltage of the modules in series (VMPP,a), should be within the operating voltage range of the DC bus.
The PV module chosen is Kyocera's KD210TM. Being G the irradiance and T the temperature over the PV modules, the module parameters under standard test conditions (STC, G=1000W/m² and T=25°C) are: the generated power (PmSTC) is 210 W, the open circuit voltage (VOC,mSTC) is 33.2 V and the maximum power voltage (VMPP,mSTC) is 26.6 V.
724

The PV curves in various operating conditions provided by the manufacturer datasheet were used to obtain the physical model parameters of the simulated PV module in the PSIM software. The physical model of the PSIM PV module is used to verify the module behavior in two extreme conditions: high irradiance with high temperature (operating condition 1) or low irradiance with low temperature (operating condition 2). It is considered the installation on the Brazil Northeast region.
The PV module parameters under operating condition 1 (G=1400W/m² and T=75°C) are given: power generated Pm1=227.3W, open circuit voltage VOC,m1=27.4V and voltage in maximum power operating VMPP,m1=21.1V.
In the operating condition 2, (G=400W/m² and T=30°C), the module parameters are: power generated Pm2=81.3W, open circuit voltage VOC,m2=31.5V and voltage in maximum power operating VMPP,m2=25.8V.
The number of modules connected in series (N) is chosen in such way that the voltage in maximum power operating condition of the PV array must be lower than the maximum DC bus voltage allowed. This voltage will be maximum when the PV modules are operating in condition 2.
𝑁 ≤ 𝑉𝐷𝐶𝑚𝑎𝑥/𝑉𝑀𝑃𝑃,𝑚2 = 30.0 (17)
N=30 modules connected in series are supported.
Considering all PV modules under the same operating conditions (USC), the lowest value of VMPP,a will occur when the array are in operating condition 1.
(𝑉𝑀𝑃𝑃,𝑎)𝑚𝑖𝑛 = 𝑁 ⋅ 𝑉𝑀𝑃𝑃,𝑚1 = 633.0 𝑉 (18)
Since the minimum allowable voltage for the DC bus of the VSC is still less than the lower voltage of the PV array in USC (Uniform Shading Condition), a GMPPT algorithm can be used to locate the overall peak of the p-v curve in PSC (Partial Shading condition). The difference between the minimum voltage of the DC bus, VDCmin, and the minimum MPP voltage in USC, (VMPP,a)min, makes it possible, together with a GMPPT technique, that the total generation of the arrangement is not impaired if partial or total shading occurs in up to 6 modules (20% of the PV array).
A shaded module would limit the current of all modules in series. However, the GMPPT technique allows finding the new global operating point at full power, thereby reducing the operating voltage of the array. A PV array voltage reduction causes the modules with low irradiance to be short circuited by their respective bypass diodes, so that the current of the assembly is no longer limited by the shaded modules.
Operation at the maximum power of the PV array occurs when all modules are in operational condition 1.
𝑃𝑃𝑉 = 𝑁 ⋅ 𝑃𝑚1 = 6.82 𝑘𝑊 (19) Since the power structure was presented and sized, the
control techniques of the system are now being studied.
III. CONTROL TECHNIQUE OF PV-SAF
The PV-SAF System control strategy is divided into two main functions. The first concerns the GMPP tracking of the PV Array to extract the maximum power within the established DC bus voltage range. The second is the SAF reference currents calculations using the instantaneous power theory.
1) GMPPT Algorithm
Fig. 2 shows the flowchart of the proposed GMPPT algorithm. According to [18], (20) can find the location of the possible power peaks in the p-v curve. This strategy is a correction of the Fractional Open-Circuit Voltage technique, which approximates the maximum power peak voltage by VMPP=k1VOC, where VOC is the open circuit voltage and k1 is a proportionality constant and has its value between 0.71 and 0.80 [5]. This relation is valid for one module, however, when the number of modules is large the error is accumulated and makes it unusable [18].
𝑉𝑀𝑃𝑃,𝑗 = [𝑎(𝑗 − 1) + 𝑘1]𝑉𝑂𝐶,𝑚 (20)
In (20), a is a constant with a value ranging from 0.8 to 0.97 and j is the number of the possible peaks that varies from 1 to N. Based on the analysis of the PV Array subjected to various operating conditions, the following constants k1=0.75 and a=0.83 were used in the proposed system.
With this, it is possible to track the LMPPs more quickly by jumping directly to the locations where these possible peaks would be located within the allowable DC bus voltage range. The measures of power at these points are compared to verify which is the GMPP. Periodically the generated power change is verified, if this variation is greater than 10% it is assumed that the operating conditions of the PV Array have changed and the tracking is redone to find a possible new GMPP.
2) Shunt SAF Control Fig. 3 shows the control scheme of the SAF using PQ
theory. Three-phase load currents and the PCC voltages are measured and used to calculate the real (p) and imaginary (q) powers.
Clark’s Transformation in (21) transforms these three-phase PCC voltages into two-phase α–β orthogonal
Fig. 2. Proposed GMPPT algorithm.
Is VMPP,j >
VDCmin?
No
Yes Is PPVj > Pmax ? No
Yes
Update Pmax by
PPVj and VMPP by
VMPP,j
Update VPV,a by
VMPP
Estimate VMPP,j by
Eq. (20), Update
VPV,a and Measure
PPVj
Decrement j
j = N
Start
Is ΔPPV/PPV > 0.1?Yes
No
725

coordinates (vSα and vSβ). Similarly, the three-phase load currents are transformed into two-phase α–β orthogonal coordinates (iLα and iLβ) in (22).
(𝑣𝑆𝛼𝑣𝑆𝛽) = √
2
3
(
1 −
1
2−1
2
0√3
2−√3
2 )
(
𝑣𝑆𝑎𝑣𝑆𝑏𝑣𝑆𝑐) (21)
(𝑖𝐿𝛼𝑖𝐿𝛽) = √
2
3
(
1 −
1
2−1
2
0√3
2−√3
2 )
(
𝑖𝐿𝑎𝑖𝐿𝑏𝑖𝐿𝑐
) (22)
From (21) and (22), the instantaneous real power (pL) and the instantaneous imaginary power (qL) flowing into the load side are computed in (23) [10].
(𝑝𝐿𝑞𝐿) = (
𝑣𝑆𝛼 𝑣𝑆𝛽𝑣𝑆𝛽 −𝑣𝑆𝛼
) (𝑖𝐿𝛼𝑖𝐿𝛽) (23)
Let �̅�𝐿 and 𝑝𝐿 are the average component and the oscillating component of 𝑝𝐿 , respectively, and �̅�𝐿 and �̃�𝐿 are the average component and the oscillating component of 𝑞𝐿, respectively. Therefore, these may be expressed as
𝑝𝐿 = �̅�𝐿 + 𝑝𝐿 ,𝑞𝐿 = �̅�𝐿 + �̃�𝐿 .
(24)
In (24), the fundamental component of the load current is transformed to average components �̅�𝐿 and �̅�𝐿 , and the harmonics are transformed to oscillating components 𝑝𝐿 and �̃�𝐿. The average components can be separated by using low-pass filters or using a Moving Average Filter (MAF). The use of MAF ensures a faster dynamic response to the load steps and a better compensation of low order current harmonics [7].
The VSC reference currents into two-phase α–β
orthogonal coordinates i*F and i*
Fβ are obtained as
(𝑖𝐹𝛼∗
𝑖𝐹𝛽∗ ) =
1
𝑣𝑆𝛼2+𝑣𝑆𝛽
2 (𝑣𝑆𝛼 𝑣𝑆𝛽𝑣𝑆𝛽 −𝑣𝑆𝛼
) (𝑝∗
𝑞∗), (25)
where p* and q* are the reference real and imaginary powers that the SAF must compensate. Since PLOSS is the active instantaneous power required to regulate the DC bus voltage and PPV is the PV Array power generated, the reference powers are expressed as
𝑝∗ = 𝑃𝐿𝑂𝑆𝑆 − 𝑃𝑃𝑉 − 𝑝𝐿 ,𝑞∗ = −𝑞𝐿 .
(26)
To perform the vector control of the VSC currents, i*F and
i*Fβ are transformed into d-q coordinates by using the Park's
Transformation in (27). The d-q axes are in synchronism with
the supply voltage, the supply voltage phase angle (S) is obtained by using the quadrature Phase Locked-Loop (qPLL).
(𝑖𝐹𝑑∗
𝑖𝐹𝑞∗ ) = (
𝑠𝑖𝑛(𝜃𝑆) −𝑐𝑜𝑠(𝜃𝑆)𝑐𝑜𝑠(𝜃𝑆) 𝑠𝑖𝑛(𝜃𝑆)
) (𝑖𝐹𝛼∗
𝑖𝐹𝛽∗ ) (27)
Fig. 4 shows the vector control scheme of the VSC currents. There is a control loop for i*Fd and another for i*
Fq, the controllers outputs are the reference voltages of the VSC into d-q coordinates (v*
Fd e v*Fq) [19]. The reference voltages
v*Fd and v*
Fq are transformed into abc coordinates by using the Inverse Clark and Park Transformation in (28).
(
𝑣𝐹𝑎∗
𝑣𝐹𝑏∗
𝑣𝐹𝑐∗)
= √2
3
(
𝑠𝑖𝑛(𝜃𝑆) 𝑐𝑜𝑠(𝜃𝑆)
𝑠𝑖𝑛 (𝜃𝑆 −2𝜋
3) 𝑐𝑜𝑠 (𝜃𝑆 −
2𝜋
3)
𝑠𝑖𝑛 (𝜃𝑆 −4𝜋
3) 𝑐𝑜𝑠 (𝜃𝑆 −
4𝜋
3))
(𝑣𝐹𝑑∗
𝑣𝐹𝑞∗ )
(28)
Fig. 3. Shunt active power filter using PQ theory scheme control.
Clarke s
Transformation
by (21) and (22)iLa
iLb
iLc
vSa
vSb
vSc
iLα
iLβ
vSα
vSβ
Instantaneous
Powers
Calculation
by (23)
VREF
VDC
+-
PI
Controller PLOSS
_
x
MAF+-
pL
pL
_pL~
qL
--
+
-1
Park s
Transformation
by (27)
αβ Reference
Currents
Calculation
by (25)
-qL(pLOSS - pL - PPV)
_
qPLL
iFα*
iFβ*
iFd*
iFq*
~
vSα
vSβ
vSd
vSq
GMPPT
VPV
IPVVPV
*
Fig. 4. Reference currents vectorial control scheme.
+-
PI
ControlleriFd*
iFd
vFd*
+-
vSd
ω LF
+
+ PI
ControlleriFq*
vFq*
-
iFq
-
ω LF
-
θS
Inverse Clarke
and Park
Transformation
by (28)
vFa*
vFb*
vFc*
VDC
Space Vector
Modulation
VSCDC Bus
VDC
//
//
Switching
Commands
To Grid
// // //
To
PV Array
726

The Space Vector modulation is used to generate the VSC switching commands [20].
IV. TEST RESULTS VALIDATION
To validate the proposed PV-SAF system strategies control, the system was simulated in PSIM software.
Fig. 5 shows the p-v curves of PV array in both operating conditions simulated. Starting in Case 1, in this situation, all the 30 PV array modules are irradiated at 1000W/m² and the temperature is 50°C. At time t=265ms, the PV Array operating condition is changed to Case 2. In this case, 5 modules are shaded and their irradiances change to 200W/m², the remaining 25 modules continue with 1000W/m². The modules temperature continues at 50°C in Case 2.
Fig. 6 presents the PV-SAF system dynamic performance when occurs changes in irradiance on the PV array modules. In t=130ms the GMPPT algorithm is started. After irradiance decreasing in some PV Array modules (from Case 1 to Case 2), the generated power decreases and the GMPPT algorithm detects this change, tracks again and reaches a new operating point where the DC bus voltage is lower. It can be observed that the generated power decrease 64.5% after 5 modules are shaded while the DC bus voltage is maintained the same. However, after the correct GMPPT algorithm proceeding and the new GMPP reach, the generated power decrease only 14.3% after the 5 modules shaded. From the tracking start to the steady-state, the average GMPPT search time is 58ms.
Fig. 7 shows the PV-SAF system performance in steady-state during Case 1 conditions. The DC bus voltage is 730V, which is the PV array maximum power voltage in Case 1 conditions and was set by the GMPPT algorithm. It can be observed that the supply current is sinusoidal and has acceptable switching frequency ripple, since the system is operating with a DC bus voltage lower than the maximum designed DC bus voltage (774V). While the load current THD (total harmonic distortion) is 25.76%, the source current THD is reduced to 3.39% due the active filtering performance. The power factor (PF) seen on the load side is 0.79 while the seen
0
1000
2000
3000
4000
5000
6000
0 100 200 300 400 500 600 700 800 900
PPV (W)
VPV (V)
Case 1 Case 2GMPP
GMPP
LMPP
Fig. 5. P-v curves of Case 1 and Case 2 situations.
-500
0
500
0.08 0.1 0.12 0.14 0.16 0.18 0.2 0.22 0.24 0.26 0.28 0.3 0.32 0.34 0.36 0.38 0.4
v Sa
(V)
-100
0
100
0.08 0.1 0.12 0.14 0.16 0.18 0.2 0.22 0.24 0.26 0.28 0.3 0.32 0.34 0.36 0.38 0.4
i Sa
(A)
-100
0
100
0.08 0.1 0.12 0.14 0.16 0.18 0.2 0.22 0.24 0.26 0.28 0.3 0.32 0.34 0.36 0.38 0.4
i La
(A)
-100
0
100
0.08 0.1 0.12 0.14 0.16 0.18 0.2 0.22 0.24 0.26 0.28 0.3 0.32 0.34 0.36 0.38 0.4
i Fa
(A)
500
600
700
800
0.08 0.1 0.12 0.14 0.16 0.18 0.2 0.22 0.24 0.26 0.28 0.3 0.32 0.34 0.36 0.38 0.4
VD
C(V
)
0.5
2.5
4.5
6.5
0.08 0.1 0.12 0.14 0.16 0.18 0.2 0.22 0.24 0.26 0.28 0.3 0.32 0.34 0.36 0.38 0.4
PP
V(k
W)
t (s)
Fig. 6. Performance of PV-SAF under change in irradiance.
727

on the source side is improved to 0.99. In this situation, the PV array generated power is 5.63kW, i.e., the PV-SAF system is compensating 100% of the reactive and harmonic load powers and still compensates 31.5% of the load active power.
Fig. 8 presents the PV-SAF system performance in steady-state during Case 2 conditions. It can be observed that the supply current has more low order harmonics and less harmonics near the switching frequency than when the system is in Case 1 conditions. Due to the shaded modules, the MPP voltage is lower (598V) and this decrease the system ability to compensate the abrupt change in load current. However, as the system is designed to operate with a minimum voltage of 590V on the DC bus, harmonic compensation is still satisfactorily performed and the source current THD is reduced to 4.26%. In this situation, the PV array generated power is 4.70 kW, i.e., the PV-SAF system is compensating 100% of the reactive and harmonic load powers and still compensates 26.3% of the load active power.
The supply currents THD in steady-state is within the IEEE-519 standard limits in both irradiance conditions analyzed.
When the PV array generated power is approximately equal to the load active power, the supply current will be very low and its THD index may exceed 5%.
V. CONCLUSION
In this paper, a PV-SAF single-stage system using PQ theory and a new GMPPT technique has been presented for a three-phase and three-wire grid and non-linear load integrated. The validation of the model and control has been carried out through simulations done in PSIM. The main advantage of the proposed system is the possibility of use and execute a GMPPT algorithm even when using the single-stage topology for PV-SAF system. The simulations results have shown that
the proposed PV-SAF system has performed satisfactorily under non-linear loads and variable solar irradiance. The GMPPT algorithm is competent to detect changing in irradiance condition and to track the PV array maximum power point even in partial shading condition. Apart from injecting the maximum possible power extracted from the PV array into the grid, the proposed PV system also provides reactive power compensation as well as harmonic elimination in day time and also during night. The harmonic compensation was satisfactory across the designed DC bus voltage range. The level of harmonics injected in the grid currents in considered conditions is within limits and recommendations to the IEEE-519 standard.
ACKNOWLEDGMENT
P.R.M.C. is thankful to CAPES (Coordenação de Aperfeiçoamento de Pessoal de Nível Superior).
REFERENCES
[1] REN21, “Renewables 2018 global status report,” ISBN 978-3-
9818911-3-3, 2018. [2] H. Vahedi, P. Labbe, and K. Al-Haddad, “Sensor-less five-level packed
U-cell inverter operating in stand-alone and grid-connected modes,” IEEE Trans. Ind. Informat., vol. 12, no. 1, pp. 361–370, Feb. 2016.
[3] E. I. Batzelis, P. S. Georgilakis, S. A. Papathanassiou, “Energy models for photovoltaic systems under partial shading conditions: a comprehensive review”, IET Renew. Power Gener., vol. 9, Iss. 4, pp. 340–349, 2015.
[4] I. R. Balasubramanian, S. I. Ganesan, N. Chilakapati, “Impact of partial shading on the output power of PV systems under partial shading conditions”, IET Power Eletron., vol. 7, Iss. 3, pp. 657–666, 2014.
[5] T. Esram and P. L. Chapman, “Comparison of photovoltaic array maximum power point tracking techniques,” IEEE Trans. Energy Conversion, vol. 22, no. 2, pp. 439–449, Jun. 2007.
[6] S. Kumar, I. Hussain, B. Singh, A. Chandra and K. Al-Haddad, “An Adaptive Control Scheme of SPV System Integrated to AC
-50
-25
0
25
50
PPV
IaiLa (A)
iSa (A)
0.22 0.23 0.24 0.25 0.26t (s)
0
25
50
1 3 5 7 9 11 13 15 17 19 21 23 25 27 29
Harmonic number
Isa
Ila THDISa: 3.39%
THDILa: 25.76%
PFISa: 0.99
PFILa: 0.79
ILa (A)
ISa (A)
Fig. 7. Supply and load currents in Case 1 (USC) steady-state situation.
-50
-25
0
25
50
PPV
IaiLa (A)
iSa (A)
0.34 0.35 0.36 0.37 0.38t (s)
0
25
50
1 3 5 7 9 11 13 15 17 19 21 23 25 27 29
Harmonic number
Isa
Ila THDISa: 4.26%
THDILa: 25.72%
PFISa: 0.99
PFILa: 0.77
ILa (A)
ISa (A)
Fig. 8. Supply and load currents in Case 2 (PSC) steady-state situation.
728
Distribution System,” IEEE Trans. Ind. Appl., vol. 53, no. 6, pp. 5173–5181, Nov./Dec. 2017.
[7] S. Devassy and B. Singh, “Design and Performance Analysis of Three-Phase Solar PV Integrated UPQC,” IEEE Trans. Ind. Appl., vol. 54, no. 1, pp. 73–81, Jan./Feb. 2018.
[8] R. K. Agarwal, I. Hussain and B. Singh, “Three-phase single-stage grid tied solar PV ECS using PLL-less fast CTF control technique”, IET Power Eletron., vol. 10, Iss. 2, pp. 178–188, 2016.
[9] B. Singh, A. Chandra, and K. Al-Haddad, Power Quality: Problems and Mitigation Techniques. New Delhi, India: Wiley-Blackwell, Jan. 2015.
[10] H. Akagi, E. H. Watanabe and M. Aredes, Instantaneous power theory and applications power conditioning. New Jersey: Wiley-IEEE Press, 2007.
[11] B. Yahia, D. Hind and C. Rashid, “The Application of an Active Power Filter on a Photovoltaic Power Generation System”, Inter. Journal of Renew. Energy Res., vol. 2, no. 4, pp. 583-590, 2012.
[12] N. Shah, C. Rajagopalan, “Experimental investigation of a multifunctional grid interactive photovoltaic system operating in partial shading conditions”, IET Renew. Power Gener., vol. 10, Iss. 9, pp. 1382–1392, 2016.
[13] S. Kumar and B. Singh, “A Multipurpose PV System Integrated to a Three-Phase Distribution System Using an LWDF-Based Approach,” IEEE Trans. Power Eletron., vol. 33, no. 1, pp. 739–748, Jan. 2018.
[14] IEEE 519 Recommended Practices and Requirements for Harmonic Control in Electrical Power Systems, IEEE Standard, 2014.
[15] K. V. Kumar, P. A. Michael, J. P. John and S. S. Kumar, “Simulation and comparison of SPWM and SVPWM control for three phase inverter”, ARPN Journal of Engineering and Applied Sciences, vol. 5, no. 7, Jul. 2010.
[16] I. M. Syed, K. Raahemifar, “Space Vector PWM and Model Predictive Control for Voltage Source Inverter Control”, International Journal of Industrial and Manufacturing Engineering, vol. 8, no. 11, 2014.
[17] R. L. de A Ribeiro, C. C. de Azevedo and R. M. de Sousa, “A Robust Adaptive Control Strategy of Active Power Filters for Power-Factor Correction, Harmonic Compensation, and Balancing of Nonlinear Loads”, IEEE Trans. Power Eletron., vol. 27, no. 2, pp. 718–730, Feb. 2012.
[18] J. Ahmed and Z. Salam, “An Improved Method to Predict the Position of Maximum Power Point During Partial Shading for PV Arrays,” IEEE Trans. Ind. Informat., vol. 11, no. 6, pp. 1378–1387, Dec. 2015.
[19] R. Pena, J. C. Clare and G. M. Asher, “Doubly fed induction generator uising back-to-back PWM converters and its application to variable speed wind-energy generation”, IEE Proc. Electr. Power Appl., vol. 143, no. 3, May. 1996.
[20] V. V. Bhandankar and A. J. Naik, “Simulation of Space Vector Modulation in PSIM”, International Journal of Engineering and Sciences, vol. 8, iss. 2, pp. 49-53, 2016.
729