Embed Size (px)
Citation preview
IZA DP No. 1097
Single Mothers and Work
Libertad Gonzalez
DI
SC
US
SI
ON
PA
PE
R S
ER
IE
S
Forschungsinstitutzur Zukunft der ArbeitInstitute for the Studyof Labor
March 2004
Single Mothers and Work
Libertad Gonzalez Universitat Pompeu Fabra,
CREA and IZA Bonn
Discussion Paper No. 1097 March 2004
IZA
P.O. Box 7240 53072 Bonn
Germany
Phone: +49-228-3894-0 Fax: +49-228-3894-180
Email: [email protected]
Any opinions expressed here are those of the author(s) and not those of the institute. Research disseminated by IZA may include views on policy, but the institute itself takes no institutional policy positions. The Institute for the Study of Labor (IZA) in Bonn is a local and virtual international research center and a place of communication between science, politics and business. IZA is an independent nonprofit company supported by Deutsche Post World Net. The center is associated with the University of Bonn and offers a stimulating research environment through its research networks, research support, and visitors and doctoral programs. IZA engages in (i) original and internationally competitive research in all fields of labor economics, (ii) development of policy concepts, and (iii) dissemination of research results and concepts to the interested public. IZA Discussion Papers often represent preliminary work and are circulated to encourage discussion. Citation of such a paper should account for its provisional character. A revised version may be available on the IZA website (www.iza.org) or directly from the author.
IZA Discussion Paper No. 1097 March 2004
ABSTRACT
Single Mothers and Work∗
Western countries differ greatly in the extent to which single mothers participate in the labor market. Using LIS data for 15 countries, I propose and estimate a simple structural model of labor supply that incorporates the main variables that influence the work decision for single mothers. The results suggest that a large part of the cross country variation in the employment rates of single mothers can be explained by their different demographic characteristics and by the variation in expected income in the in-work versus out-of-work states. Women with higher expected earnings are more likely to work. Higher in-work benefits encourage employment. Single mothers with higher income from other sources, including child support, are less likely to work. Even after demographic and income variables are controlled for, the country dummies remain significant. This indicates that other variables not explicitly incorporated in the model, such as childcare arrangements or social and cultural backgrounds, may also play a relevant role. JEL Classification: J52, J12, I38 Keywords: single mothers, labor supply Libertad Gonzalez Departamento de Economía y Empresa Universitat Pompeu Fabra Edificio Jaume I Ramón Trias Fargas 25-27 08005 Barcelona Spain Tel.: +34 93 542 2610 Fax: +34 93 542 1746 Email: [email protected]
∗ I would like to thank Bruce Meyer, Joe Altonji, Chris Taber, Luojia Hu, Tim Smeeding and anonymous referee for their helpful comments. All remaining errors are my own.
2
1. Introduction
Single mother families have received a lo t of attention from researchers and policy
makers in recent years. This is partly attributable to the large increases in the prevalence
of this type of family that took place in some Western countries during the past few
decades.1 Some of the questions raised by the increasing prevalence of this non-
traditional family type regard the conflicting role of women as mothers and
breadwinners.
Western countries differ greatly in the extent to which single mothers participate in
the labor market. In the mid-1990s, 27 percent of single mothers in the United Kingdom
reported working at least 10 hours a week, compared with 76 percent in the United
States. Single mothers out of work are more likely to be poor and dependent on public
support. On the other hand, the effects of maternal employment on children are still not
well understood. Higher income in the household is associated with positive outcomes
for children, 2 but lack of maternal care and parental supervision is thought to affect
children and adolescents negatively. 3
This paper analyzes the sources of the large variation in the employment rates of
single mothers across countries. Labor market conditions and benefit systems have a
potential to influence the work decision of women. Understanding what drives the labor
supply decisions of single mothers under different environments would help inform
policies aimed at preventing and alleviating poverty for these particularly vulnerable
families. A multi-country analysis is especially attractive since the large variation in
1 See Gonzale z (2003). 2 See Duncan et al. (1994), Duncan and Brooks-Gunn (1997), Mayer (1997), McLoyd (1998). 3 The literature on the effects of maternal employment on children is mixed. Some have found negative effects of maternal employment when children are young (Harvey 1999, Belsky 1988). Others find that maternal employment has positive effects on children in low-income families (Allesandri 1992, Vandell and Ramanan 1992, Moore et al. 1996, Zaslow and Emig 1997).
3
public support and labor market conditions provides an excellent source of
identification for the effects of interest.
A few studies outside of economics have described the different environments that
single mothers face in several countries.4 Their descriptive analyses agree that many
factors may contribute to explain the variation in the labor market participation of single
mothers across countries, including benefit systems, labor market conditions, and social
and cultural backgrounds, but they conclude that none of them can individually account
for most of that variation. Clearly a more structured multivariate analysis is needed in
order to analyze the relative contribution of the different factors at play.
I start by describing the employment rates of single mothers in 15 different
countries, using data from the Luxembourg Income Study. In some countries, the large
majority of single mothers stay home and out of paid work, while in others, most
unmarried women with children are employed.
In section 3, I first explore the possibility that this cross-country variation is related
to factors that affect employment rates for all women in a given country. Thus I
compare employment rates for single mothers with other groups of women (married
mothers and single women without children). It turns out that in some countries single
mothers are much more likely to work than other women, while in other countries single
mothers are much less likely to work than other women. This suggests that there are
additional sources of variation that affect single mothers differentially.
It is also possible that being a “single mother” means very different things in
different countries, in terms of their age, marital status, number and age of their
children, etc, and that these characteristics are related to labor force participation. Thus,
next I describe the composition of single mothers in the 15 countries in terms of
4 See Bradshaw et al. (1996), Kilkey (2001), Duncan and Edwards (1997).
4
demographics characteristics, and analyze how much of the variation in employment
rates can be attributed to variation in these characteristics.
I propose a simple structural model of labor supply that points at the variables that
are potentially relevant for the work decision of single mothers (a full description of the
model can be found in the appendix). The structural model suggests that the expected
income in the events of working versus not working plays a role in the work decision.
The most important components of income are expected earnings in the event of
working, and the level of benefits to which the woman is entitled. Benefits may include
both universal family or child allowances and income-tested social assistance. Countries
vary greatly both in terms of the types of assistance available to single mothers and the
extent to which benefits are means-tested. Section 4 analyzes the contribution of labor
market conditions and benefit systems to the variation in the labor force participation of
single mothers across countries.
The results from the structural estimation suggest that a large part of the cross
country variation in the employment rates of single mothers can be explained by their
different demographic characteristics and by the variation in expected income in the in-
work versus out-of-work states. Older and more educated single mothers are more likely
to work, while more and younger children reduce the probability of working. Women
with higher expected earnings are more likely to work. Higher expected benefits if
working encourage employment. Single mothers with higher income from other
sources, including child support, are less likely to work. Even after demographic and
income variables are controlled for, however, the country dummies remain significant
and, in some cases, sizeable, indicating that other variables not explicitly incorporated
in the model, such as childcare arrangements or social and cultural backgrounds, may
also play a role in explaining the cross-country variation.
5
2. Data
I use cross-sectional data for 15 countries from the Luxembourg Income Study (LIS).
The LIS database is a collection of household income surveys that includes 29
countries, with data sets that span up to three decades, organized in 5 waves, although
not all countries have data for each of the waves.
I keep all LIS countries with information on earnings and hours worked in at least
two different periods. I exclude Mexico from the analysis due to the large institutional
differences with respect to the rest of the countries. This leaves 15 countries, 6 of them
with just 2 periods available, and 9 with 3 periods available.5 The three periods are
approximately 1985, 1990 and 1995.
Single mother families are defined as households headed by a female and containing
only the mother and her dependent children under 18 years of age.6 I characterize a
woman as “employed” if she reports working at least 10 hours a week and positive
earnings.7 The sample size (pooled country and period data) is 13,440 single mothers, of
which 57 percent work.
3. Descriptive Analysis
3.1 Comparing Employment Rates Across Countries
The proportion of single mothers in paid work varies greatly across the 15 countries in
the sample. In the mid-1990s, employment rates for single mothers ranged from 20% in
The Netherlands and 27% in the UK to 76% in the US and 72% in France and Austria.
5 The countries included are: Australia, Austria, Belgium, Canada, France, (Western) Germany, Hungary, Ireland, Israel, Luxembourg, The Netherlands, Russia, Sweden, United Kingdom, and United States. 6 Unmarried women with children who live with the grandparents of the children are excluded from the sample since they cannot be identified in the data. Cohabiting couples with children are not counted as single mother families. 7 I also explore alternative definitions of employment. First I consider different hours cutoffs: any positive number of hours and at least 15 hours worked a week. I also perform the analysis defining as employed any woman reporting positive earnings.
6
Of course, these numbers may just reflect differences in overall female labor force
participation trends. Thus our first task is to find out whether this variation in the
employment rates of single mothers is driven by factors that affect all women or is
specific to single mothers.
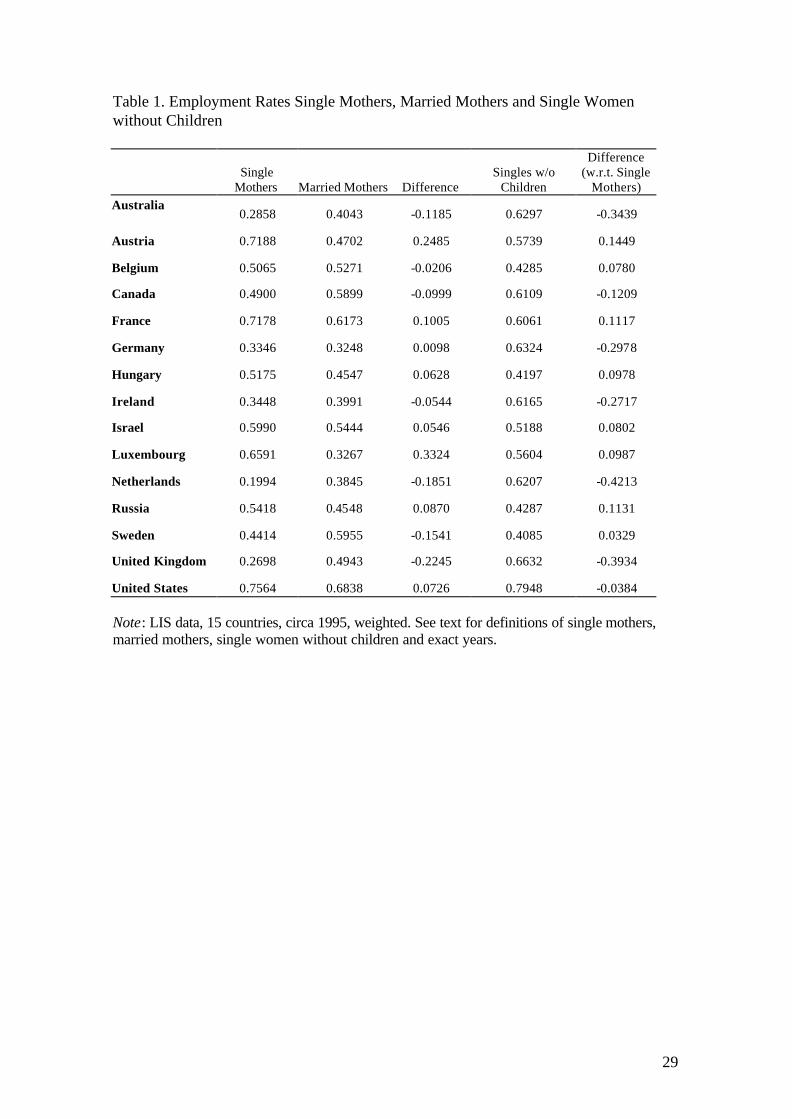
Table 1 shows employment rates for single mothers in the mid-1990s in the 15
countries in the sample, and a comparison with employment rates for married mothers
and single women without children. 8 Employment rates for married mothers can
account for only 25 percent of the variation in employment rates for single mothers.9
Employment rates for single women without children are essentially uncorrelated with
employment rates for single mothers (correlation of –0.03). In some of the countries,
single mothers are much more likely to work than other women, while in others single
mothers are much less likely to work than other women. Let us describe these different
experiences in more detail.
• France, Austria and Luxembourg have very high absolute employment rates (ER)
for single mothers (>65%), and those rates are also much higher than ER for married
mothers and even single women without children.
• In the United States and Israel, ER for single mothers are high, but they are very
similar to ER for the other groups of women.
• Hungary and Russia have intermediate ER for single mothers compared with the
rest of the countries, and those rates are higher than ER for the other groups of women.
• In Sweden and Belgium, ER for single mothers are intermediate compared with the
rest of the countries. Those rates are similar to ER for single childless women, but they
8 I define “married mothers” as married women living with their husband and children younger than 18, and “single women without children” as unmarried women living in households with no children under 18. 9 A linear regression on employment rates for single mothers where the only independent variable is the employment rate of married mothers for the 15 countries in the third period yields an R2 of .248 (only .19 if adjusted).
7
are lower than ER for married mothers. In Canada, ER for single mothers is
intermediate but lower than ER for both single childless women and married mothers.
• In Ireland and Germany, ER for single mothers are very low, and similar to ER for
married mothers, while ER are much higher for single women without children.
• The Netherlands, the United Kingdom and Australia have very low ER for single
mothers (<30%), and those are also much lower than ER for the other two groups of
women.
In summary, the cross-country variation in employment rates for single mothers does
not just reflect overall trends in female labor force participation, but seems to be driven
in large part by additional sources of variation that are specific to single mothers.
3.2 Comparing Individual Characteristics of Single Mothers
It is of course possible that single mothers are very different across countries in terms of
their age composition, their education level, the number and age of their children, and
other variables that affect the likelihood of working. It is also possible that there are
variables that affect single mothers differentially across countries, such as social
protection systems that vary in their targeting, generosity, degree of income testing, etc.
In order to sort these out, I begin by studying the demographic characteristics of single
mothers across the 15 countries. Then I adjust employment rates to account for the
different composition of the pool of single mothers in each country.
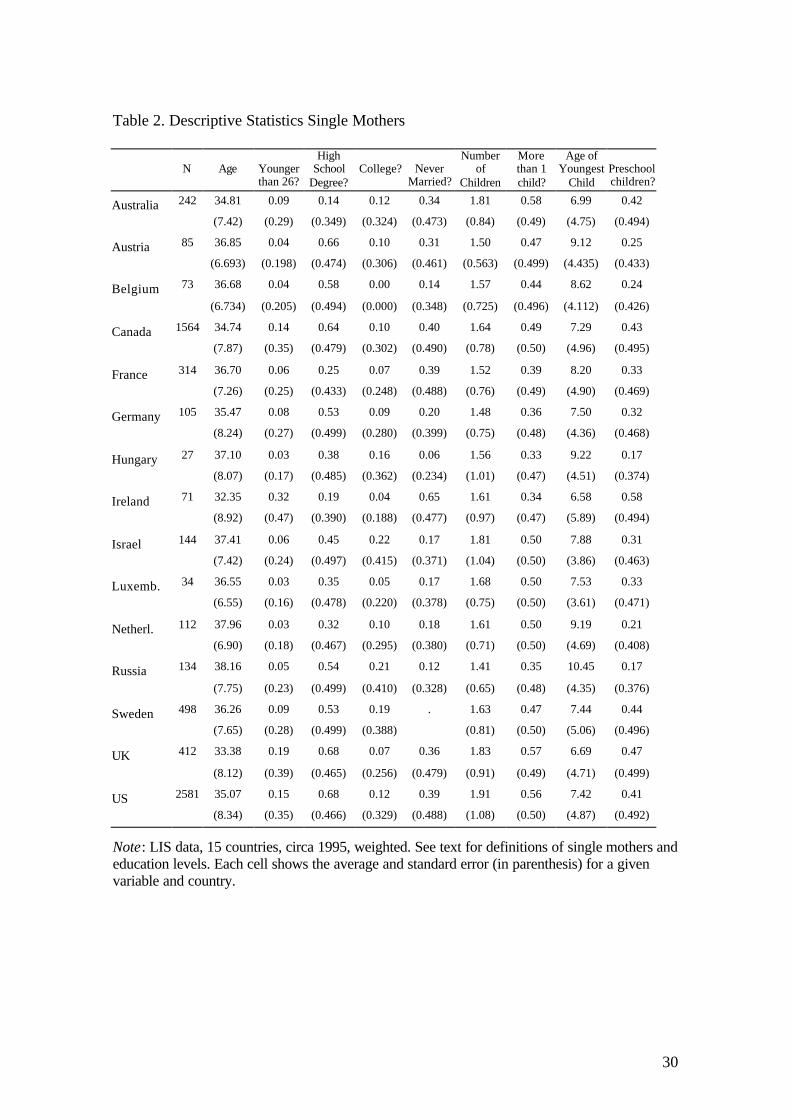
Pooling all countries together, in the mid-1990s the average single mother was 36
years old and had 2 children, the youngest one being 8 years old. More than 70 percent
of single mothers had at least a high school degree (or equivalent), and more than 30
percent had never been married (the rest being either separated, divorced or widowed).
However these characteristics vary significantly across the countries in the sample (see
8
table 2). To illustrate this point, let us compare two of them, Ireland and Israel. The
average single mother in Ireland was 32 years old, versus 37 in Israel. Moreover, in
Ireland 32 percent of all single mothers were younger than 26 years old, compared with
only 6 percent in Israel. Only 23 percent of Irish single mothers had at least a high
school degree, versus 67 percent of their Israeli counterparts. The majority of Irish
single mothers were never married (65 percent), while in Israel single mothers were
much more likely to be divorced or widowed (only 17 percent of Israeli single mothers
had never been married). We expect the older, more educated Israeli single mothers
would be more likely to work than the Irish. Israeli single mothers had on average more
children than the Irish ones (1.8 versus 1.6), but their children were older. On average,
the youngest child in the household was 7.9 years old in Israel, compared with 6.6 in
Ireland. Irish single mothers were more likely to have a preschool-age child (58 percent
of them did, versus 31 percent in Israel). We suspect these differences may be part of
the reason why the employment rates of single mothers were so much higher in Israel
(60 percent) than in Ireland (34 percent).
3.3 Descriptive Models
In order to find out to what extent the variation in employment rates across countries
can be attributed to differences in individual characteristics, I compare the results from a
Probit on employment rates that includes only country (and time) dummies with the
results obtained when including the above mentioned demographic controls, plus female
unemployment rates (in order to control for business cycle effects). Tables 3 and 4
report the coefficients, standard errors and average derivatives from both specifications.

9
Average derivatives are provided so we can interpret the results in terms of marginal
effects.10
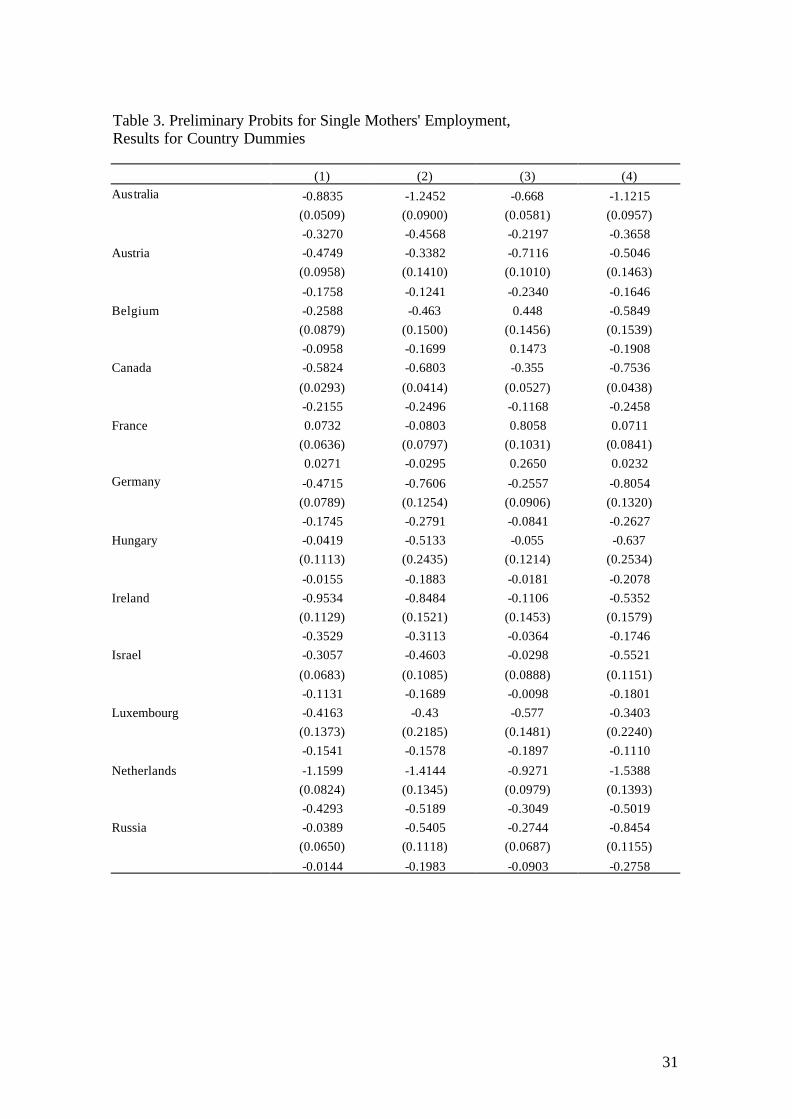
The first and second columns report the results from Probit regressions that include
only country and time dummies. The first specification includes time dummies that are
common for all countries (the omitted period is the last one), while the second
introduces country-specific time dummies. The omitted country is the US (in 1997, or
third period). The employment rate of single mothers in the US in 1997 was 76 percent,
the highest of all 15 countries in the mid-1990s. Thus the average derivatives on the
country dummies reflect the difference in employment rates between the US and each of
the other countries, after controlling for the time effects. All other countries have lower
employment rates than the US in the third period, as can be seen in column 2 (see
average derivatives). Note the large differences with respect to The Netherlands (52
percent), the UK and Australia (46 percent). Note also that almost all the country
dummies are highly significant.
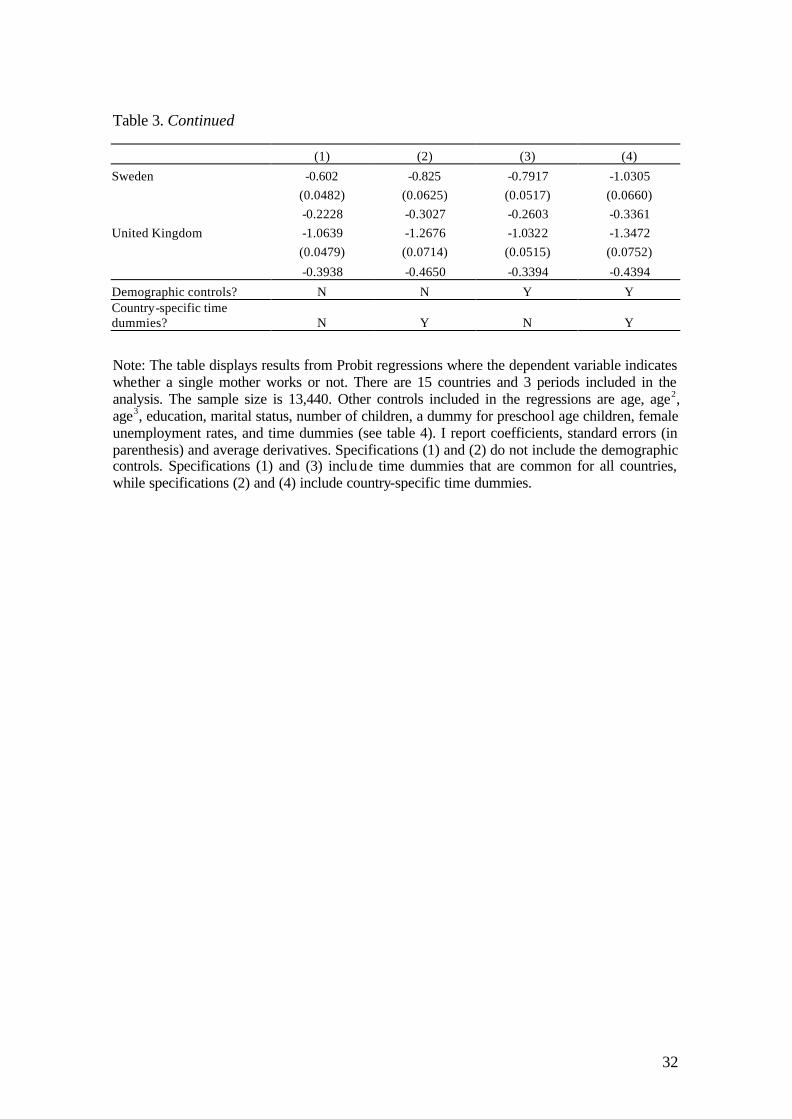
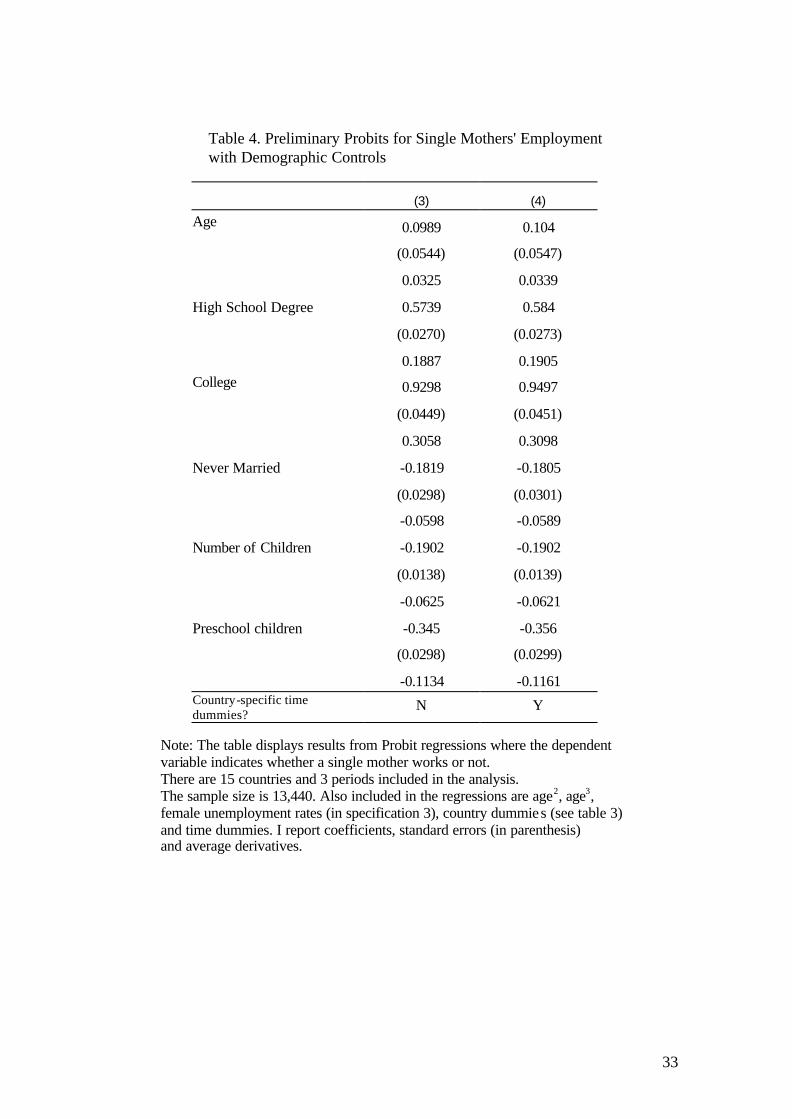
The third and fourth columns show the results from including the controls for
individual characteristics and unemployment rates.11 All the controls are significant and
show the expected signs (see table 4). Older single mothers are more likely to work.
Higher education levels also increase the likelihood of working. 12 College attendants are
31 percentage points more likely to work than single mothers without a high school
degree. Having more and younger children reduces the probability of working, as do
high unemployment rates. An additional child reduces the likelihood of working by 6
10 Marginal effects measure the effect of changes in the explanatory variables on the dependent variable. In the Probit model, the parameters of the model do not coincide with the marginal effects, which vary with the values of x. Thus, in order to interpret the estimated model, I evaluate the marginal effects at every observation and report the average of the individual marginal effects. 11 Female unemployment rates are included only in the regressions with time dummies that are common for all countries. 12 See Appendix for the definitions of education levels.
10
percentage points, while the presence of a preschool age child does so by 11 to 12
points.
We are interested in learning how much of the cross-country variation in
employment rates can be explained by these controls. Going back to our example from
section 3.2, the first column in table 3 shows that single mothers in Ireland are 24
percentage points less likely to work than their counterparts in Israel. Once we control
for the different composition of the single mother population in both countries, the third
column shows that the difference in employment rates has been reduced to 3 percentage
points. Thus, almost 90 percent of the gap in employment rates between Israel and
Ireland can be attributed to differences in the individual characteristics of single mothers
in these two countries, according to this specification.
We may be especially interested in understanding the gap in employment rates with
respect to the US. The countries with lower employment rates (see table 1) experience a
considerable reduction in the gap with respect to the US once we account for these
controls. The controls explain 90 percent of the difference with Ireland, 33 percent of
the difference in employment rates with Australia, 29 percent of the difference with The
Netherlands, 52 percent of the gap with Germany, and just 14 percent with respect to
the UK (compare average derivatives from columns 1 and 3). This specification also
accounts for a large part of the difference in employment rates between the US and
Israel (91 percent) and Canada (46 percent). In some of the other cases, however, the
controls slightly “over-explain” the gap, or even widen it.
It seems there is a significant portion of the cross-country variation in the
employment rate of single mothers that cannot be explained by differences in their
individual characteristics or unemployment rates. The difference is still larger than 25
11
percentage points between the US and France, The Netherlands, Sweden and the UK.
Most of the country dummies are still significant.
The regression results reported so far did not account for the fact that part of the
variation in employment rates for single mothers across countries is driven by factors
that affect employment for all women in a given country, and not specifically single
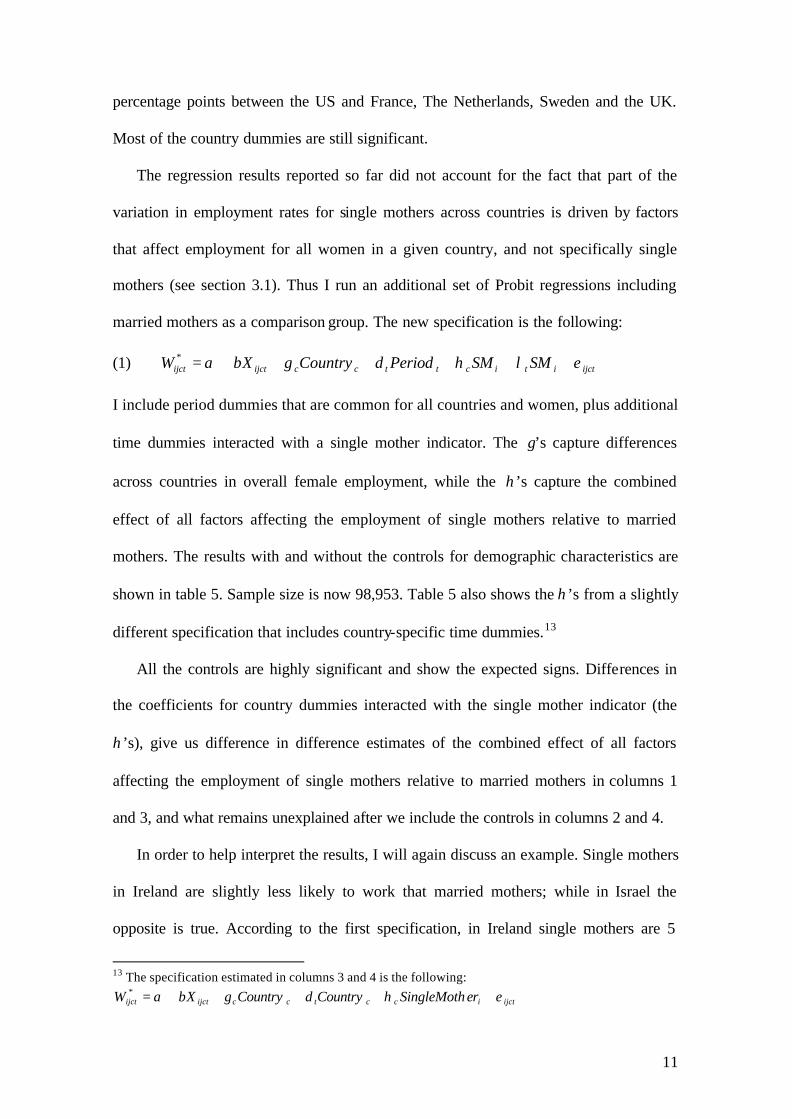
mothers (see section 3.1). Thus I run an additional set of Probit regressions including
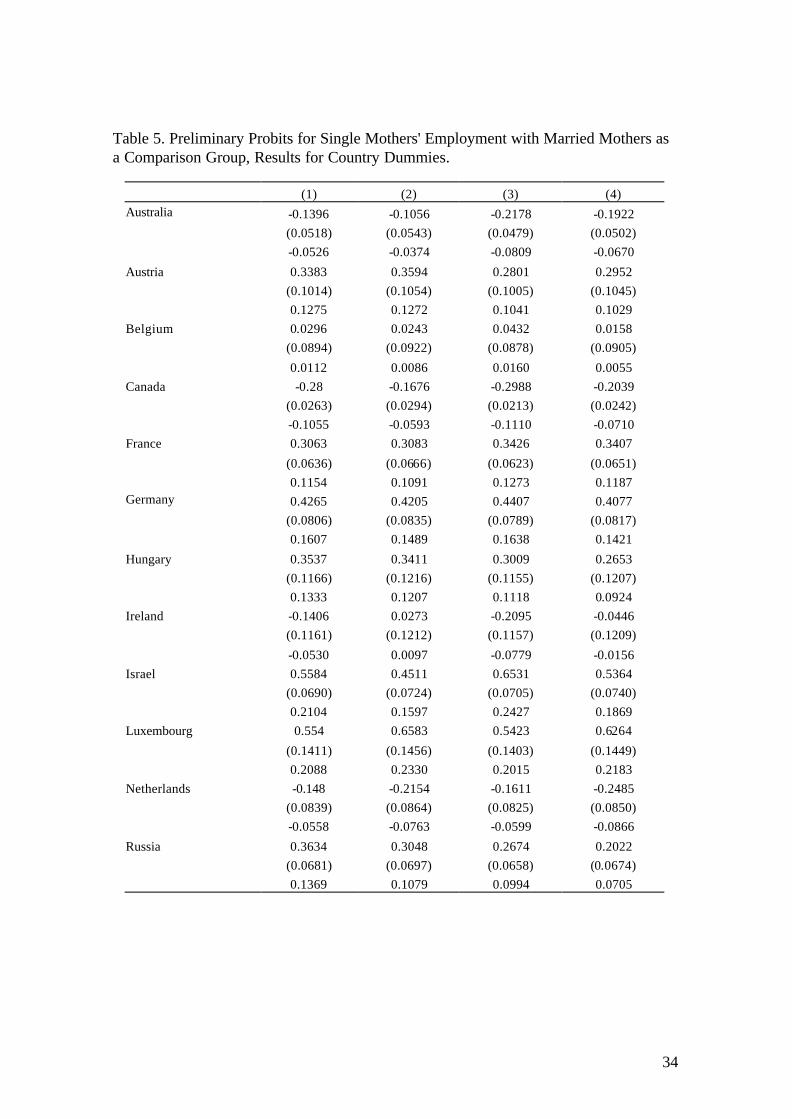
married mothers as a comparison group. The new specification is the following:
(1) ijctiticttccijctijct SMSMPeriodCountryXW εληδγβα ++++++=*
I include period dummies that are common for all countries and women, plus additional
time dummies interacted with a single mother indicator. The γ’s capture differences
across countries in overall female employment, while the η’s capture the combined
effect of all factors affecting the employment of single mothers relative to married
mothers. The results with and without the controls for demographic characteristics are
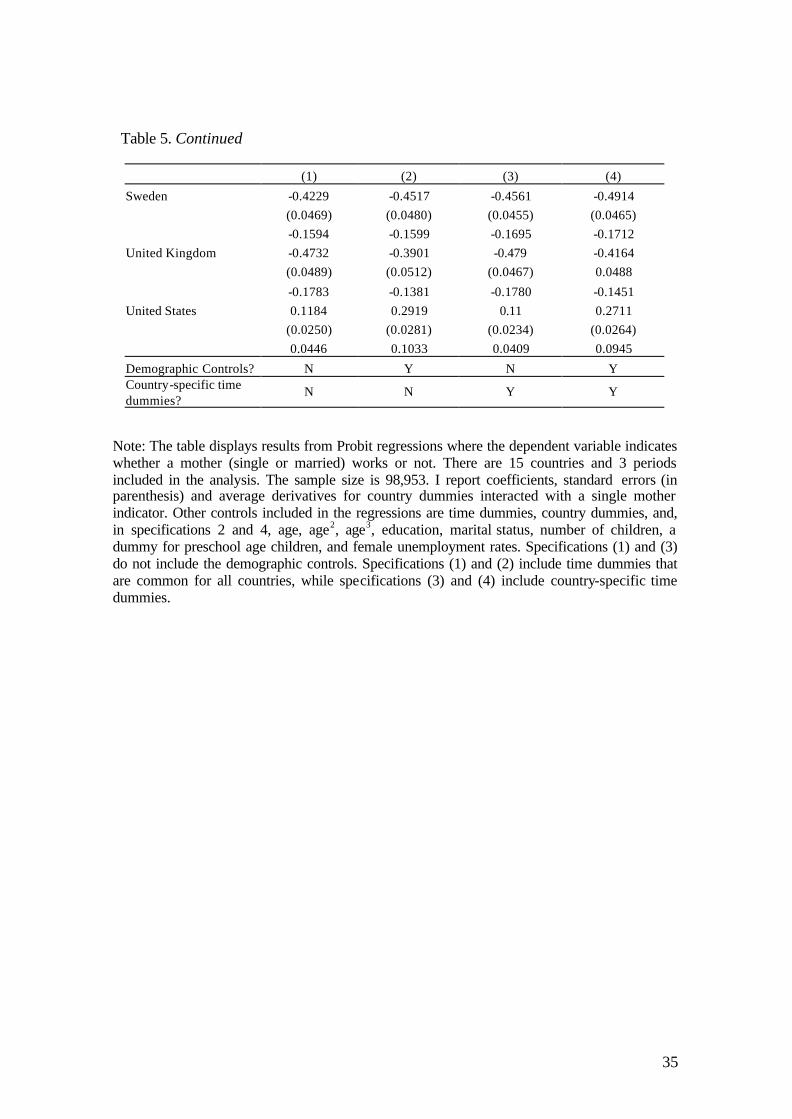
shown in table 5. Sample size is now 98,953. Table 5 also shows the η’s from a slightly
different specification that includes country-specific time dummies.13
All the controls are highly significant and show the expected signs. Differences in
the coefficients for country dummies interacted with the single mother indicator (the
η’s), give us difference in difference estimates of the combined effect of all factors
affecting the employment of single mothers relative to married mothers in columns 1
and 3, and what remains unexplained after we include the controls in columns 2 and 4.
In order to help interpret the results, I will again discuss an example. Single mothers
in Ireland are slightly less likely to work that married mothers; while in Israel the
opposite is true. According to the first specification, in Ireland single mothers are 5
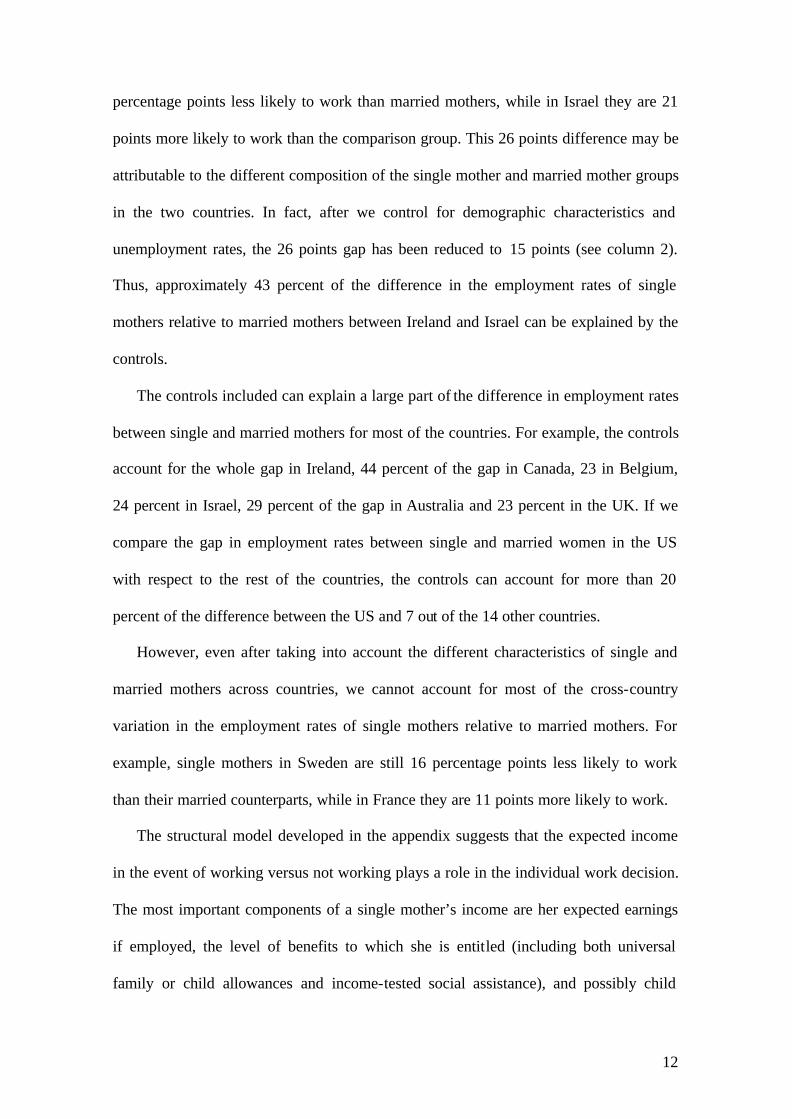
13 The specification estimated in columns 3 and 4 is the following:
ijcticctccijctijct erSingleMothCountryCountryXW εηδγβα +++++=*
12
percentage points less likely to work than married mothers, while in Israel they are 21
points more likely to work than the comparison group. This 26 points difference may be
attributable to the different composition of the single mother and married mother groups
in the two countries. In fact, after we control for demographic characteristics and
unemployment rates, the 26 points gap has been reduced to 15 points (see column 2).
Thus, approximately 43 percent of the difference in the employment rates of single
mothers relative to married mothers between Ireland and Israel can be explained by the
controls.
The controls included can explain a large part of the difference in employment rates
between single and married mothers for most of the countries. For example, the controls
account for the whole gap in Ireland, 44 percent of the gap in Canada, 23 in Belgium,
24 percent in Israel, 29 percent of the gap in Australia and 23 percent in the UK. If we
compare the gap in employment rates between single and married women in the US
with respect to the rest of the countries, the controls can account for more than 20
percent of the difference between the US and 7 out of the 14 other countries.
However, even after taking into account the different characteristics of single and
married mothers across countries, we cannot account for most of the cross-country
variation in the employment rates of single mothers relative to married mothers. For
example, single mothers in Sweden are still 16 percentage points less likely to work
than their married counterparts, while in France they are 11 points more likely to work.
The structural model developed in the appendix suggests that the expected income
in the event of working versus not working plays a role in the individual work decision.
The most important components of a single mother’s income are her expected earnings
if employed, the level of benefits to which she is entitled (including both universal
family or child allowances and income-tested social assistance), and possibly child

13
support and/or alimony payments. Countries vary greatly both in terms of the types of
assistance available to single mothers and the extent to which benefits are means-tested,
as well as in the level of earnings that single mothers can expect should they work.
Section 4 analyzes the contribution of labor market conditions and benefit systems to
the variation in the labor force participation of single mothers across countries by
estimating the structural model proposed in the appendix.
4. Structural Estimates of the Employment Decision
According to the structural model (see the appendix for details), the probability that a
single mother works is a function of her expected net earnings if working, her expected
benefits if working and if not working, her other non-labor income, and her individual
characteristics:
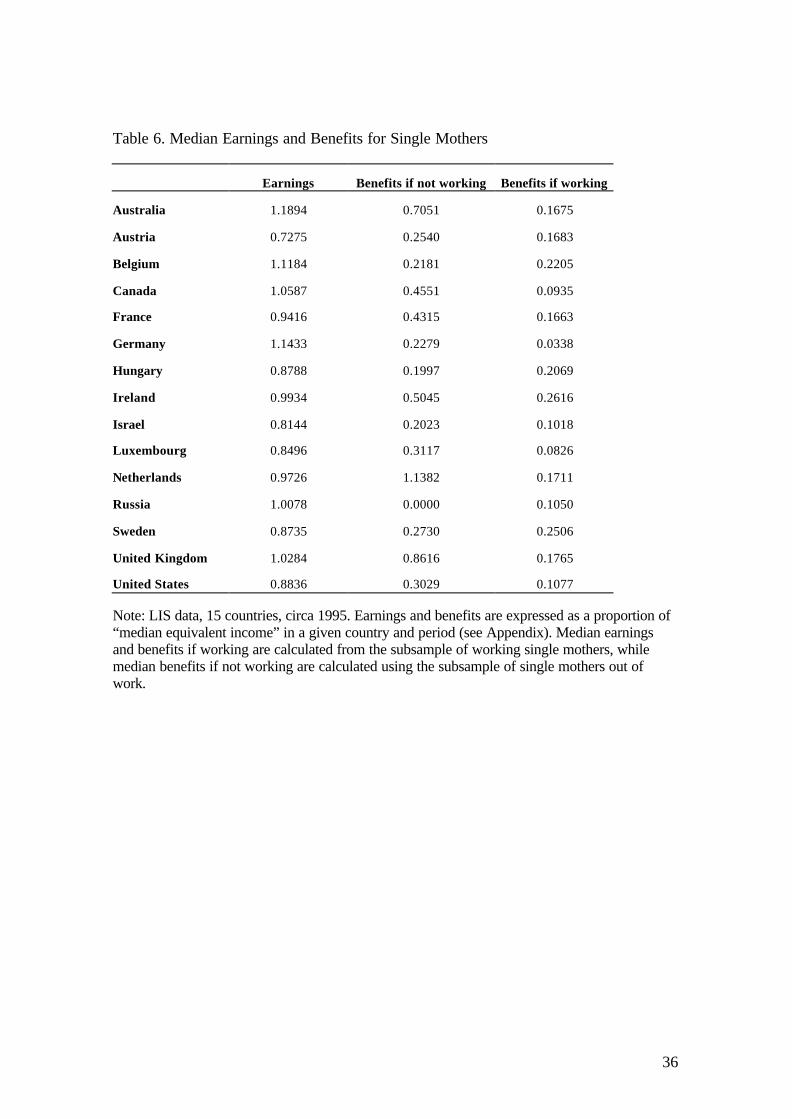
(2) Φ{α1 Ε[net earnings]+ α2 Ε[Benefits if working]− α3 Βenefits not working+ + α4 Other Non-Labor Income+ X’γ}. Table 6 shows median earnings for working single mothers by country in the third
period, as well as median level of benefits received by single mothers working and not
working in each country. Median earnings range from 73 percent of median equivalent
income (MEI) in Austria to 119 percent in Australia. The US is located in the middle of
this range with 88 percent of MEI.14
The level of benefits that single mothers receive if they stay at home varies a great
deal across countries as well. In Russia, benefits are zero at the median, while in The
Netherlands the median out-of-work single mother receives benefits that amount to 114
percent of MEI. There is also a large variation in how much the level of benefits is
reduced if single mothers take up employment. In all countries but Russia and Hungary,
14 See appendix for the definition of “median equivalent income”.
14
single mothers who work, experience a reduction in the level of benefits that they
receive. In Belgium, the median level of benefits is virtually the same for out-of-work
and in-work single mothers (21.8 versus 22 percent of MEI). But in The Netherlands,
the reduction is dramatic: from 114 percent of MEI for out-of work single mothers to 17
percent for those who work. This indicates that benefits might be part of the story why
single mothers are so likely to stay at home in The Netherlands (their employment rate
was 20 percent in 1994).
In order to estimate the structural model, we need to include expected earnings,
expected benefits and other non- labor income in the work regressions. We observe
“other non- labor income” directly for all single mother households.15 However, we do
not observe earnings for single mothers out of work, or the benefits that they would
receive in the counterfactual state.
I estimate expected (net) earnings using predicted hourly wages and the observed
distribution of hours. I assume that all single mothers face the same hours distribution. I
calculate the hours distribution including all single mothers and pooling all 15 countries
and 3 periods, and using LIS weights. On average, employed single mothers work 36.8
hours a week, or (in a work year of 48 weeks) 1,766 hours a year.16
I also assume that a woman can predict her own wage rate based on her individual
characteristics and labor market conditions. The expected wage rate can thus be
estimated as a function of the woman’s characteristics, allowing the coefficients to vary
by country. I run wage regressions including as explanatory variables the woman’s age,
her educational attainment, her marital status, whether she has children, and time
dummies, separately by country. I include all women 18 to 60 years old with positive
15 Note that child support payments are included in “other non-labor income”. 16 Note that this average excludes observations for single mothers working less than 10 hours a week.

15
earnings in the analysis.17 Thus identification of predicted wages for single mothers
comes from using a larger sample of women in the wage regressions. However this
regression does not account for possible selection biases due to unobserved wages for
non-working women.
The sample size in the wage regressions is 143,872. I normalize hourly wage by
median equivalent income in a given country and period. Virtually all of the country
wage regressions have R2 between .16 and .50.18 Then we can assign each non-working
single mother her predicted wage rate, and we can include expected earnings as an
explanatory variable in the Probits. 19
We also do not observe the level of benefits if working that a single mother would
receive if she is in fact not working, or the benefits if not working that a working single
mother would receive in the alternative state. I estimate those counterfactuals separately
by country and period using observed benefit levels for working and non-working
single mothers, as a function of the number and ages of the children in the household
and earnings (for benefits if working).20 Thus expected benefits are identified by using
the variation in actual benefits received by single mothers in and out of work by
country, period, number of children, age of the youngest child, and actual earnings.
I then estimate Probit regressions for the probability that a single mother works,
including, in addition to the demographic controls, expected net earnings, expected
benefits if working and if not working, and other non- labor income. All the monetary
variables are normalized by median equivalent income in a given country and period.
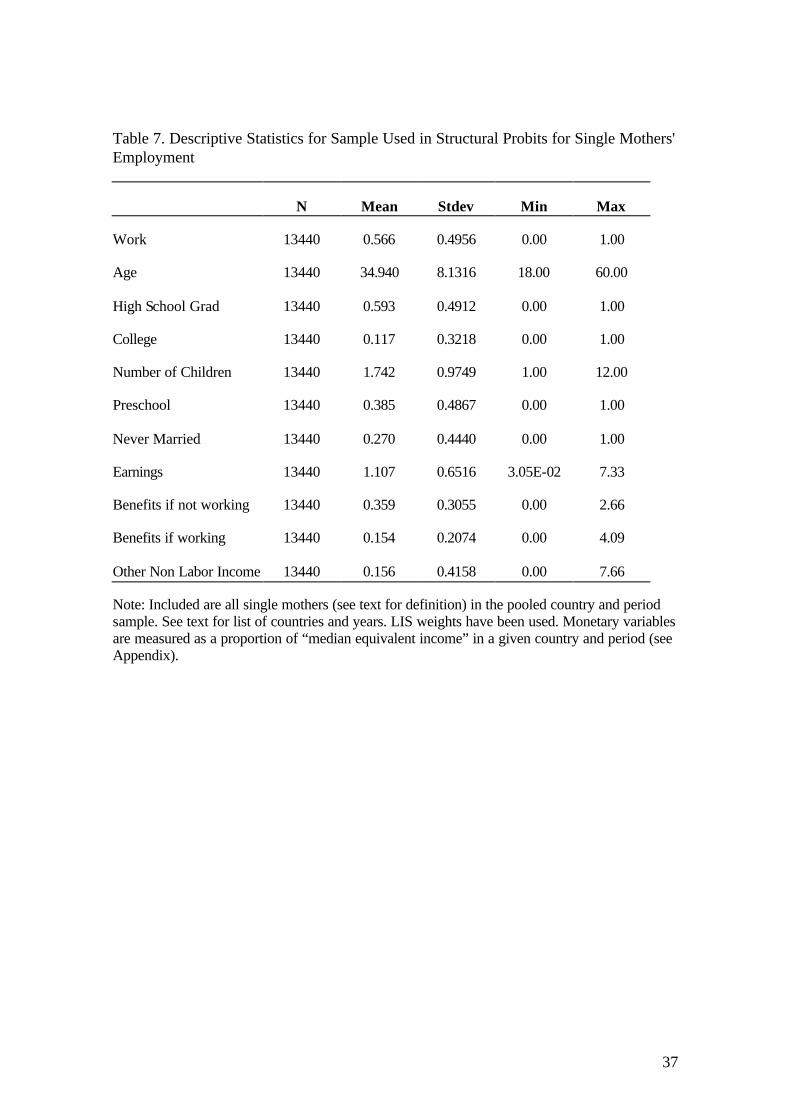
Table 7 shows some descriptive statistics for all variables included in the regressions for
17 I exclude observations for women with hourly wage below the 1st and above the 99th percentiles for a given country. 18 The exception is for Russia, with an R2 of .043. See Appendix for more details on the wage regressions. 19 I perform the analysis using imputed wages only for single mothers out of work and observed wages for the rest, but as a robustness check I also report the results from imputing expected wages for all single mothers. 20 See appendix for details on how the benefits variables are constructed.
16
the pooled country and period sample. The sample size is 13,440. Expected net earnings
for single mothers are on average 111 percent of MEI. Single mothers receive on
average benefits amounting to 36 percent of MEI if they are out of work, versus 15
percent of MEI if they work. Their other non- labor income amounts to an average of 16
percent of MEI.
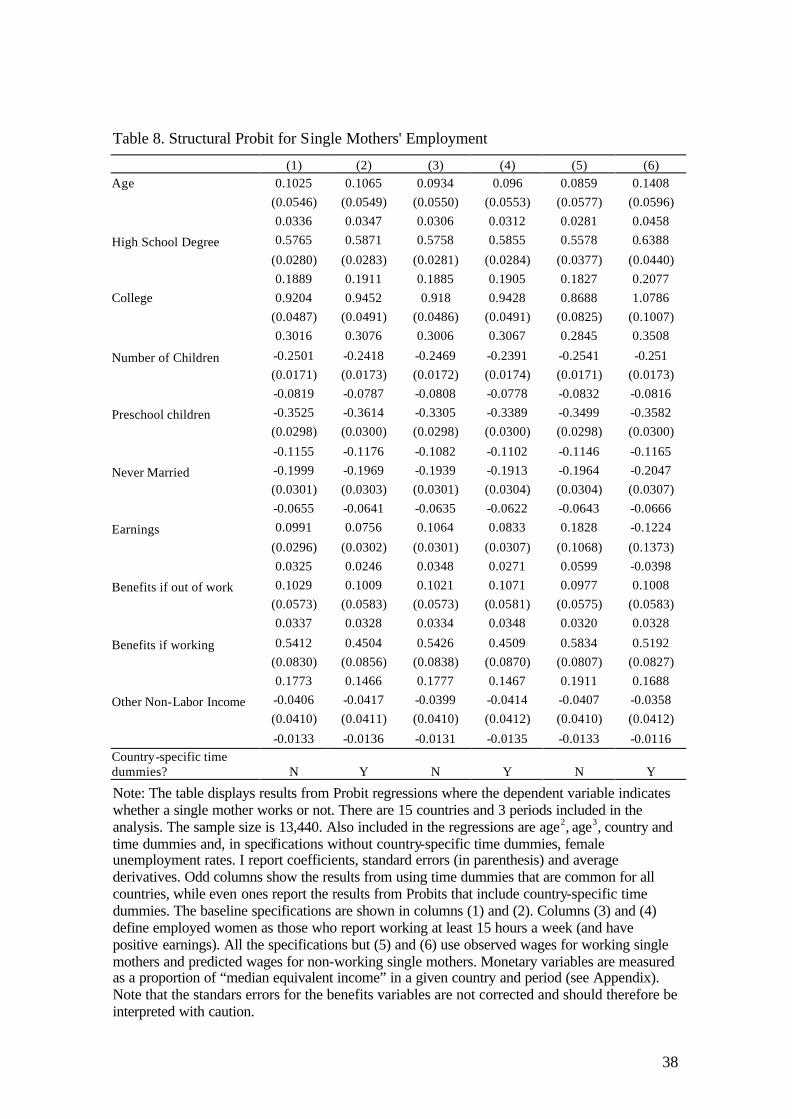
The results from estimating the structural Probit are shown in tables 8 and 9. All the
specifications but (5) and (6) use observed wages for working single mothers and
predicted wages for non-working single mothers. The baseline specifications are shown
in columns (1) and (2). Odd columns show the results from using time dummies that are
common for all countries, while even ones report the results from Probits that include
country-specific time dummies. Columns (3) and (4) define employed women as those
who report working at least 15 hours a week (and have positive earnings).21
Note that the coefficients on the income variables display the expected signs, which
are consistent across specifications (with the exception of expected benefits if not
working, which displays positive signs but is not significant). Higher expected earnings
are significantly associated with a higher probability of working. An increase in net
expected earnings of 10 percent (the equivalent of a 95 cents increase in hourly wages
for the US in 1997) would result in an increase in the likelihood of working of between
.25 and .35 percentage points. These estimates are not significant in the specifications
that use predicted earnings for all single mothers. As expected, higher other non- labor
income is associated with lower employment rates. An increase in other non- labor
income of 10 percent (the equivalent of about 280 US annual dollars in 1997) would
21 Other specifications have been estimated assuming that women can predict their total earnings (wage times hours), so that expected earnings are derived from earnings regressions run separately by country (instead of wage regressions). These results are not reported here but do not vary significantly from the reported models.
17
decrease the probability of working by .12 to .14 percentage points. This effect is
however not significant.
Benefit levels are also significantly associated with the likelihood of working. A 10
percent increase in benefits if working would increase the likelihood of working by 1.5
to 2.2 percentage points. Benefits if not working show insignificant effects. This
suggests the interesting possibility that increasing in-work benefits is more effective at
encouraging work than reducing benefits for single mothers out of work. Employment
rates seem to be more sensitive to changes in in-work benefits.
Although introducing earnings and benefits to the specification does not eliminate
the significance of the country fixed effects, the magnitudes are considerably smaller
after controlling for the income variables. The model can explain between 15 and 73
percent of the gap in employment rates for single mothers between the US and 6 out of
the other 14 countries, according to specification (3). We can account for 73 percent of
the gap with Israel and 66 percent of the gap with Ireland, and 46 percent with
Germany. However, the model “over-explains” the gap with Belgium. After controlling
for individual characteristics and income variables, the employment gap with respect to
six other countries has in fact widened.
The results presented so far in this section did not account for the fact that part of
the variation in employment rates for single mothers across countries is driven by
factors that affect employment for all women in a given country, and not specifically
single mothers. Thus I also report the results from Probit regressions that include
married mothers as a comparison group (see table 10).22 Column 1 is the baseline
specification while column 2 assumes women can predict their total earnings. The
22 Note that married mothers have an additional source of income in the household, the husband’s earnings, which is also included in the regressions.
18
coefficients (the η’s) reflect the remaining gap in employment rates between single and
married mothers in a given country, after controlling for demographic characteristics
and income variables. The model explains a significant part of the gap in employment
rates for most of the countries (9 out of the 15). For example, we can account for 59
percent of the gap in Russia, 44 percent in Israel and France, and 42 percent in Hungary,
and 33 percent in Germany, according to the first specification.
Differences in the coefficients for country dummies interacted with the single
mother indicator (the η’s), give us difference in difference estimates of the unexplained
gap in the employment of single mothers relative to married mothers across countries.
Going back to the example from previous sections, the specification with no controls
showed there was a gap of 26 points between Ireland and Israel in the employment rates
of single relative to married mothers. Demographic characteristics and unemployment
rates could account for about 43 percent of the gap. Once we introduce the income
variables, in the second specification the original 26-point gap has been reduced to 2.4
points, i.e. the model accounts for 90 percent of the difference in the employment rates
of single mothers relative to married mothers between Ireland and Israel.
However, there is a lot of variability in how well the model can explain the variation
across countries. We can account for more than 15 percent of the gap in employment
rates between the US and just 7 of the other 14 countries. The model works especially
well in closing the gap with France, Israel, Hungary and Russia (more than 60 percent
of the gap is accounted for), but it does not help explain the difference with respect to
Australia or The Netherlands.
19
5. Summary and Conclusions
This paper describes the large cross-country variation in the degree to which single
mothers participate in the labor market, even after we control for differences in overall
female employment. Using data for 15 countries from the Luxembourg Income Study, I
show that single mothers are much more likely to work than other women in some
countries, while they are much less likely to work in others.
I propose and estimate a simple structural model of labor supply that incorporates
the main variables that influence the work decision for single mothers. The results from
the structural estimation suggest that a large part of the cross country variation in the
employment rates of single mothers can be explained by their different demographic
characteristics and by the variation in expected income in the in-work versus out-of-
work states. Older and more educated single mothers are more likely to work, while
more and younger children reduce the probability of working. Women with higher
expected earnings are more likely to work. Single mothers with higher income from
other sources, including child support, are less likely to work.
Higher benefits if working encourage employment, while benefits if not working
show insignificant effects. Note that higher benefits if working raise expected income in
the “employed” state, and thus, according to the model, should make a woman more
likely to work. This should be read in the context of benefits systems that often
“penalize” working single mothers by drastically reducing public support when the
woman works a certain number of hours. In this sense, the reported findings suggest
that reducing the “means-tested” nature of benefits would induce women to work to a
greater extent than decreasing the level of assistance that they receive when they stay at
home.

20
The model can account for a large part of the cross-country variation in the
employment rates of single mothers relative to other women. However, even after
demographic and income variables are controlled for, the country dummies remain
significant and, in some cases, sizeable. This indicates that other variables not explicitly
incorporated in the model, such as childcare arrangements or social and cultural
backgrounds, may also play a role in explaining the cross-country variation.
21
Appendix
A) A Simple Model of Labor Supply for Single Mothers
The empirical estimation is motivated by a very simple structural model that follows
Meyer and Rosenbaum (2001). The model, although very simplified, provides guidance
regarding the variables that enter the work decision for single mothers and the expected
direction of the different effects.
A woman's utility is assumed to have as arguments her income Y, non-market time
L, individual characteristics X, and a random term ε:
(A.1) ),,,( εXLYUU =
A single mother decides whether to take up paid work or not in order to maximize her
utility, subject to her budget and time constraints.23 Thus, a single mother's decision to
work depends on the comparison between her maximal utility (U*) in and out of
employment.24 She will work if her expected utility of working exceeds the expected
utility of not working:
(A.2) ),,(),,( 00** XLYUXLYU ww > ,
where subscript w stands for "paid work" and 0 stands for "out of paid work". I define
W* as the difference in the maximal utility in these two alternative states. A single
mother will decide to work if W*>0, where
(A.3) ),,(),,( 00*** XLYUXLYUW ww −=
We only observe the sign of W*, i.e. whether a woman works or not: ]0[1 * >= WW .
23 Note that I am assuming that income equals consumption, i.e. there is no saving or borrowing. This seems like a reasonable approximation for most single mother families. 24 For convenience, I use the term “work” as a synonym for paid work or market work.
22
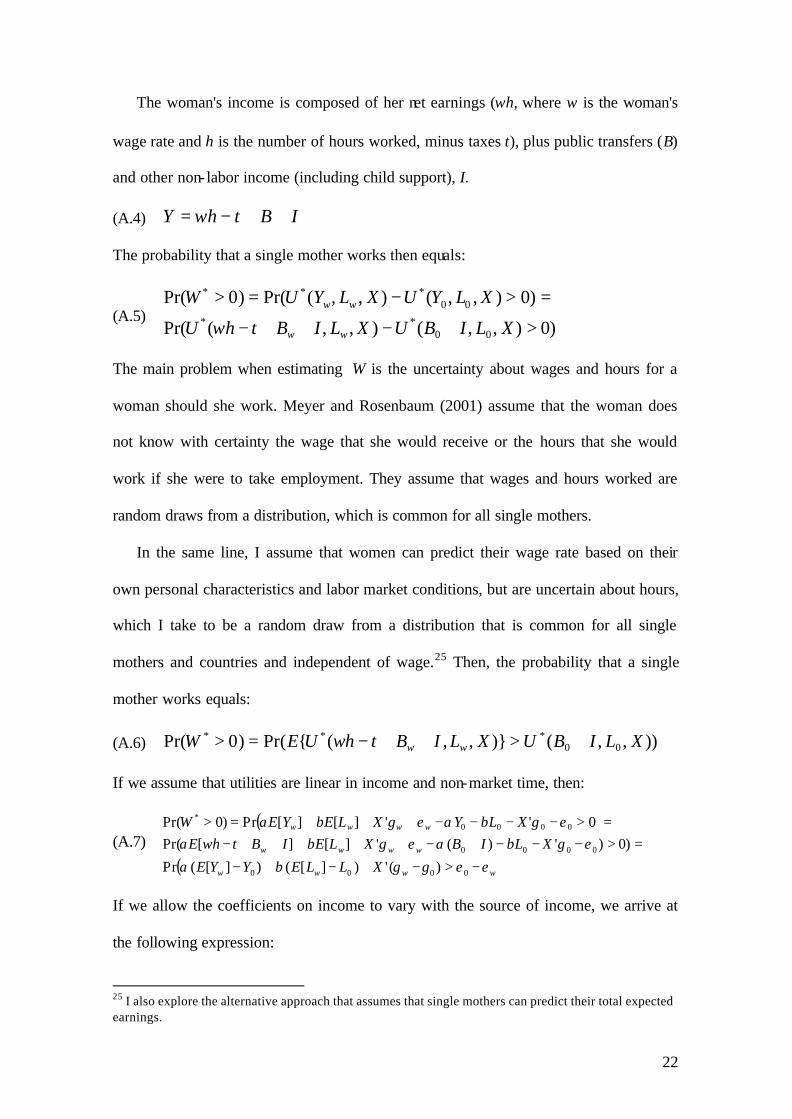
The woman's income is composed of her net earnings (ωh, where ω is the woman's
wage rate and h is the number of hours worked, minus taxes t), plus public transfers (B)
and other non- labor income (including child support), I.
(A.4) IBthY ++−= ω
The probability that a single mother works then equals:
(A.5) )0),,(),,(Pr(
)0),,(),,(Pr()0Pr(
00**
00***
>+−++−
=>−=>
XLIBUXLIBthU
XLYUXLYUW
ww
ww
ω
The main problem when estimating W is the uncertainty about wages and hours for a
woman should she work. Meyer and Rosenbaum (2001) assume that the woman does
not know with certainty the wage that she would receive or the hours that she would
work if she were to take employment. They assume that wages and hours worked are
random draws from a distribution, which is common for all single mothers.
In the same line, I assume that women can predict their wage rate based on their
own personal characteristics and labor market conditions, but are uncertain about hours,
which I take to be a random draw from a distribution that is common for all single
mothers and countries and independent of wage.25 Then, the probability that a single
mother works equals:
(A.6) )),,()},,({Pr()0Pr( 00*** XLIBUXLIBthUEW ww +>++−=> ω
If we assume that utilities are linear in income and non-market time, then:
(A.7) ( )
( )wwww
wwww
wwww
XLLEYYE
XLIBXLEIBthEXLYXLEYEW
εεγγβα
εγβαεγβωαεγβαεγβα
−>−+−+−
=>−−−+−+++++−=>−−−−+++=>
0000
0000
0000*
)(')][()][(Pr
)0)')('][][Pr(0''][][Pr)0Pr(
If we allow the coefficients on income to vary with the source of income, we arrive at
the following expression:
25 I also explore the alternative approach that assumes that single mothers can predict their total expected earnings.
23
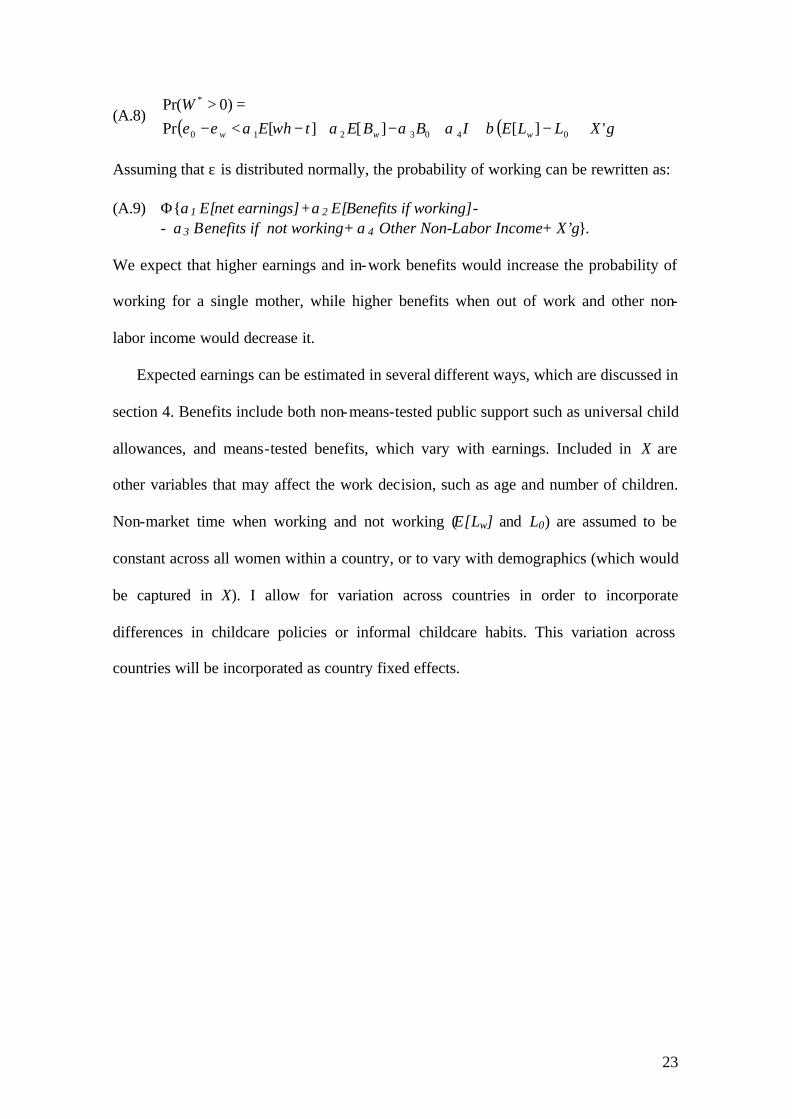
(A.8) ( )( )γβαααωαεε '][][][Pr
)0Pr(
0403210
*
XLLEIBBEthEW
www +−++−+−<−=>
Assuming that ε is distributed normally, the probability of working can be rewritten as:
(A.9) Φ{α1 Ε[net earnings]+ α2 Ε[Benefits if working]− − α3 Βenefits if not working+ α4 Other Non-Labor Income+ X’γ}. We expect that higher earnings and in-work benefits would increase the probability of
working for a single mother, while higher benefits when out of work and other non-
labor income would decrease it.
Expected earnings can be estimated in several different ways, which are discussed in
section 4. Benefits include both non-means-tested public support such as universal child
allowances, and means-tested benefits, which vary with earnings. Included in X are
other variables that may affect the work decision, such as age and number of children.
Non-market time when working and not working (E[Lw] and L0) are assumed to be
constant across all women within a country, or to vary with demographics (which would
be captured in X). I allow for variation across countries in order to incorporate
differences in childcare policies or informal childcare habits. This variation across
countries will be incorporated as country fixed effects.
24
B) Empirical Estimation of the Structural Model
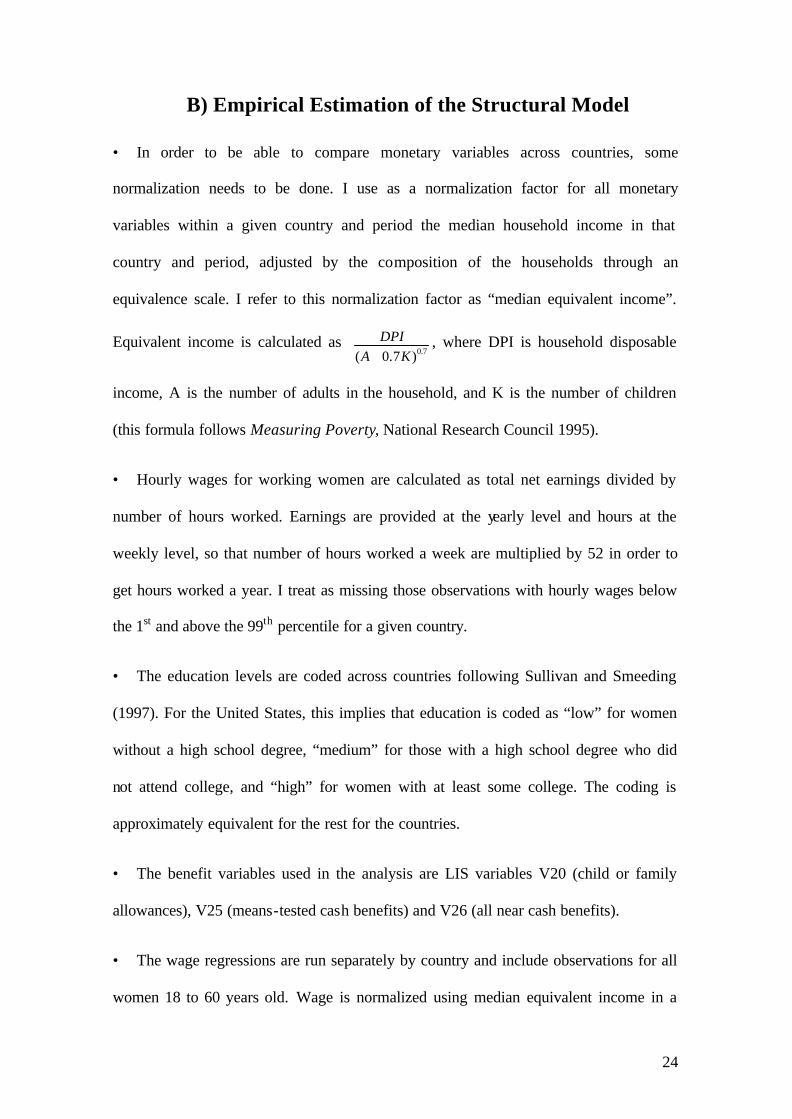
• In order to be able to compare monetary variables across countries, some
normalization needs to be done. I use as a normalization factor for all monetary
variables within a given country and period the median household income in that
country and period, adjusted by the composition of the households through an
equivalence scale. I refer to this normalization factor as “median equivalent income”.
Equivalent income is calculated as 7.0)7.0( KA
DPI+
, where DPI is household disposable
income, A is the number of adults in the household, and K is the number of children
(this formula follows Measuring Poverty, National Research Council 1995).
• Hourly wages for working women are calculated as total net earnings divided by
number of hours worked. Earnings are provided at the yearly level and hours at the
weekly level, so that number of hours worked a week are multiplied by 52 in order to
get hours worked a year. I treat as missing those observations with hourly wages below
the 1st and above the 99th percentile for a given country.
• The education levels are coded across countries following Sullivan and Smeeding
(1997). For the United States, this implies that education is coded as “low” for women
without a high school degree, “medium” for those with a high school degree who did
not attend college, and “high” for women with at least some college. The coding is
approximately equivalent for the rest for the countries.
• The benefit variables used in the analysis are LIS variables V20 (child or family
allowances), V25 (means-tested cash benefits) and V26 (all near cash benefits).
• The wage regressions are run separately by country and include observations for all
women 18 to 60 years old. Wage is normalized using median equivalent income in a

25
given country and period. The variables included in the regressions are: age, age2, age3,
two dummies for educational attainment, two dummies for marital status (married being
the omitted category), a dummy indicating whether she has children, and time dummies.
• The regressions for expected benefits if not working are run separately for each
country and period, and include observations for single mothers out of paid work.
Benefits are normalized using median equivalent income in a given country and period.
The variables included in the regressions are number of children, number of children
squared, and age of the youngest child.
• The regressions for expected benefits if working are run separately for each country
and period, and include observations for single mothers in paid work. The variables
included in the regressions are number of children, number of children squared, age of
the youngest child, earnings, and earnings2, and earnings3.
26
References
Allesandri, S. M. (1992), "Effects of Maternal Work Status in Single-Parent Families on Children's Perceptions of Self and Family and School Achievement", Journal of Experimental Child Psychology, 54, pp. 417-433. Belsky, J. (1988), "The 'Effects' of Infant Day Care Reconsidered", Early Childhood Research Quarterly 3, pp. 235-272. Bradshaw, Jonathan (1998), ''International Comparisons of Support for Lone Parents'', in Private Lives & Public Responses. Lone parenthood & future policy in the UK, pp. 154-168, London, Policy Studies Institute. Bradshaw, Jonathan, Steven Kennedy, Majella Kilkey, Sandra Hutton, Anne Corden, Tony Eardley, Hilary Holmens and Joanna Neale (1996), The employment of lone parents: a comparison of policy in 20 countries, pp. 64, Family Policy Studies Centre, London. Bradshaw, Jonathan, Lars Inge Terum and Anne Skevik (2000), ''Lone Parenthood in the 1990s: New Challenges, New Responses?'', The University of York, Social Policy Research Unit, ISSA Conference, Helsinki. Duncan, G. J., J. Brooks-Gunn and P. K. Klebanov (1994), "Economic Deprivation and Early Childhood Development." Child Development 65, pp. 296-318. Duncan, G. J. and J. Brooks-Gunn, eds. (1997), Consequences of Growing Up Poor. New York, Russel Sage. Duncan, Simon and Rosalind Edwards (1997), Single Mothers in an International Context: Mothers or Workers?, pp. ix-285, UCL Press, London. Ermisch, John (1991), Lone parenthood: An Economic Analysis, Cambridge, New York, Cambridge University Press, pp. xv-194. Ermisch, John F. and Robert E. Wright (1991), "Welfare Benefits and Lone Parent's Employment in Great Britain", The Journal of Human Resources, 26, pp. 424-456. Gonzalez, Libertad (2003), “The Determinants of the Prevalence of Single Mothers: A Cross-Country Analysis”, unpublished draft, Northwestern University. Hanratty, Maria J. (1994), ''Social Welfare Programs for Women and Children: The United States versus France'', in Blank, R. (ed.), Social Protection versus Economic Flexibility: Is There a Trade-off?, pp. 301-331, National Bureau of Economic Research, Comparative Labor Market Series, Chicago and London, University of Chicago Press. Harvey, E. (1999), "Short-Term and Long-Term Effects of Early Parental Employment on Children of the National Longitudinal Survey of Youth." Developmental Psychology 35, pp. 445-459.
27
Heckman, James J. (1993), “What Has Been Learned About Labor Supply in the Past Twenty Years?”, American Economic Review 83(2), pp. 116-121. Hotz, V. Joseph and Robert A. Miller (1988), “An Empirical Analysis of Life Cycle Fertility and Female Labor Supply”, Econometrica, Vol. 56(1), pp. 91-118. Jenkins, Stephen J. (1992), ''Lone Mother's Employment and Full-Time Work Probabilities'', The Economic Journal, 102(411), pp. 310-320. Kamerman, Sheila B. (1991), “Child Care Policies and Programs: An International Overview”, Journal of Social Issues 47(2), pp. 179-196. Kilkey, Majella (2001), Lone Mothers Between Paid Work and Care. The policy regime in twenty countries, pp. xvii-304, Ashgate Publishing Ltd, Aldershot, England. Killingsworth, Mark R., and James J. Heckman (1999), ''Female Labor Supply: A Survey'', in O. Ashenfelter and D. Card (eds.), Handbook of Labor Economics, pp. 103-204, Amsterdam, The Netherlands. Leon, Alexis (2002), “Family Allowances and Female Labor Force Participation”, unpublished draft, Massachusetts Institute of Technology. Mayer, S. E. (1997), What Money Can't Buy: Family Income and Children's Life Chances, Cambridge, MA, Harvard University Press. McLoyd, V. (1998), "Children in Poverty: Development, Public Policy, and Practice", in Handbook of Child Psychology, 4th ed., ed. I. E. Siegel and K. A. Renninger, New York, Wiley. Meyer, Bruce D. and Dan T. Rosenbaum (2000), “Making Single Mothers Work: Recent Tax and Welfare Policy and its Effects”, National Tax Journal 53(4), pp. 1027-1062. Meyer, Bruce D., and Dan T. Rosenbaum (2001), ''Welfare, the Earned Income Tax Credit, and the Labor Supply of Single Mothers'', Quarterly Journal of Economics 116, pp. 1063-1114. Mincer, Jacob (1985), “Intercountry Comparisons of Labor Force Trends and of Related Developments: An Overview”, Journal of Labor Economics, 3(1, Part 2), S1-S32. Montgomery, Edward and John Navin (1996), “Cross-State Variation in Medicaid Programs and Female Labor Supply”, Economic Inquiry, 38(3), pp. 402-418. Moore, K. A., M. Zaslow and A.K. Driscoll (1996), "Maternal Employment in Low- Income Families: Implications for Children's Development." Paper presented at meeting From Welfare to Work: Effects of Parents and Children, sponsored by the Packard Foundation and the American Academy of Arts and Sciences, Airlie Center, Virginia.
28
National Research Council (1995), Measuring Poverty: A New Approach, Constance F. Citro and Robert T. Michael (eds.), pp. xx-501, Washington, DC, National Academy Press. Schultz, Paul T. (1994), "Marital Status and Fertility in the United States. Welfare and Labor Market Effects", The Journal of Human Resources, 29, pp. 637-669. Sullivan, Dennis H. and Timothy M. Smeeding (1997), “Educational Attainment and Earnings Inequality in Eight Nations”, LIS Working Paper #164, Luxembourg, Luxembourg Income Study. Vandell, D. L. and J. Ramanan (1992), "Effects of Early and Recent Maternal Employment on Children from Low-Income Families." Child Development 63, pp. 938-949. Whiteford, Peter and Jonathan Bradshaw (1994), ''Benefits and Incentives for Lone Parents: A Comparative Analysis'', International Social Security Review, 47(3/4), pp. 69-89. Zaslow M. J. and C. A. Emig (1997), "When Low-Income Mothers Go to Work: Implications for Children." Future of Children 7, pp. 110-115.
29
Table 1. Employment Rates Single Mothers, Married Mothers and Single Women without Children
Single
Mothers Married Mothers Difference Singles w/o
Children
Difference (w.r.t. Single
Mothers) Australia
0.2858 0.4043 -0.1185 0.6297 -0.3439
Austria 0.7188 0.4702 0.2485 0.5739 0.1449
Belgium 0.5065 0.5271 -0.0206 0.4285 0.0780
Canada 0.4900 0.5899 -0.0999 0.6109 -0.1209
France 0.7178 0.6173 0.1005 0.6061 0.1117
Germany 0.3346 0.3248 0.0098 0.6324 -0.2978
Hungary 0.5175 0.4547 0.0628 0.4197 0.0978
Ireland 0.3448 0.3991 -0.0544 0.6165 -0.2717
Israel 0.5990 0.5444 0.0546 0.5188 0.0802
Luxembourg 0.6591 0.3267 0.3324 0.5604 0.0987
Netherlands 0.1994 0.3845 -0.1851 0.6207 -0.4213
Russia 0.5418 0.4548 0.0870 0.4287 0.1131
Sweden 0.4414 0.5955 -0.1541 0.4085 0.0329
United Kingdom 0.2698 0.4943 -0.2245 0.6632 -0.3934
United States 0.7564 0.6838 0.0726 0.7948 -0.0384 Note: LIS data, 15 countries, circa 1995, weighted. See text for definitions of single mothers, married mothers, single women without children and exact years.
30
Table 2. Descriptive Statistics Single Mothers
N Age Younger
than 26?
High School
Degree? College? Never
Married?
Number of
Children
More than 1 child?
Age of Youngest
Child Preschool children?
Australia 242 34.81 0.09 0.14 0.12 0.34 1.81 0.58 6.99 0.42
(7.42) (0.29) (0.349) (0.324) (0.473) (0.84) (0.49) (4.75) (0.494)
Austria 85 36.85 0.04 0.66 0.10 0.31 1.50 0.47 9.12 0.25
(6.693) (0.198) (0.474) (0.306) (0.461) (0.563) (0.499) (4.435) (0.433)
Belgium 73 36.68 0.04 0.58 0.00 0.14 1.57 0.44 8.62 0.24
(6.734) (0.205) (0.494) (0.000) (0.348) (0.725) (0.496) (4.112) (0.426)
Canada 1564 34.74 0.14 0.64 0.10 0.40 1.64 0.49 7.29 0.43
(7.87) (0.35) (0.479) (0.302) (0.490) (0.78) (0.50) (4.96) (0.495)
France 314 36.70 0.06 0.25 0.07 0.39 1.52 0.39 8.20 0.33
(7.26) (0.25) (0.433) (0.248) (0.488) (0.76) (0.49) (4.90) (0.469)
Germany 105 35.47 0.08 0.53 0.09 0.20 1.48 0.36 7.50 0.32
(8.24) (0.27) (0.499) (0.280) (0.399) (0.75) (0.48) (4.36) (0.468)
Hungary 27 37.10 0.03 0.38 0.16 0.06 1.56 0.33 9.22 0.17
(8.07) (0.17) (0.485) (0.362) (0.234) (1.01) (0.47) (4.51) (0.374)
Ireland 71 32.35 0.32 0.19 0.04 0.65 1.61 0.34 6.58 0.58
(8.92) (0.47) (0.390) (0.188) (0.477) (0.97) (0.47) (5.89) (0.494)
Israel 144 37.41 0.06 0.45 0.22 0.17 1.81 0.50 7.88 0.31
(7.42) (0.24) (0.497) (0.415) (0.371) (1.04) (0.50) (3.86) (0.463)
Luxemb. 34 36.55 0.03 0.35 0.05 0.17 1.68 0.50 7.53 0.33
(6.55) (0.16) (0.478) (0.220) (0.378) (0.75) (0.50) (3.61) (0.471)
Netherl. 112 37.96 0.03 0.32 0.10 0.18 1.61 0.50 9.19 0.21
(6.90) (0.18) (0.467) (0.295) (0.380) (0.71) (0.50) (4.69) (0.408)
Russia 134 38.16 0.05 0.54 0.21 0.12 1.41 0.35 10.45 0.17
(7.75) (0.23) (0.499) (0.410) (0.328) (0.65) (0.48) (4.35) (0.376)
Sweden 498 36.26 0.09 0.53 0.19 . 1.63 0.47 7.44 0.44
(7.65) (0.28) (0.499) (0.388) (0.81) (0.50) (5.06) (0.496)
UK 412 33.38 0.19 0.68 0.07 0.36 1.83 0.57 6.69 0.47
(8.12) (0.39) (0.465) (0.256) (0.479) (0.91) (0.49) (4.71) (0.499)
US 2581 35.07 0.15 0.68 0.12 0.39 1.91 0.56 7.42 0.41
(8.34) (0.35) (0.466) (0.329) (0.488) (1.08) (0.50) (4.87) (0.492) Note: LIS data, 15 countries, circa 1995, weighted. See text for definitions of single mothers and education levels. Each cell shows the average and standard error (in parenthesis) for a given variable and country.
31
Table 3. Preliminary Probits for Single Mothers' Employment, Results for Country Dummies
(1) (2) (3) (4) Australia -0.8835 -1.2452 -0.668 -1.1215 (0.0509) (0.0900) (0.0581) (0.0957) -0.3270 -0.4568 -0.2197 -0.3658 Austria -0.4749 -0.3382 -0.7116 -0.5046 (0.0958) (0.1410) (0.1010) (0.1463)
-0.1758 -0.1241 -0.2340 -0.1646 Belgium -0.2588 -0.463 0.448 -0.5849 (0.0879) (0.1500) (0.1456) (0.1539) -0.0958 -0.1699 0.1473 -0.1908 Canada -0.5824 -0.6803 -0.355 -0.7536
(0.0293) (0.0414) (0.0527) (0.0438) -0.2155 -0.2496 -0.1168 -0.2458 France 0.0732 -0.0803 0.8058 0.0711 (0.0636) (0.0797) (0.1031) (0.0841) 0.0271 -0.0295 0.2650 0.0232 Germany -0.4715 -0.7606 -0.2557 -0.8054 (0.0789) (0.1254) (0.0906) (0.1320) -0.1745 -0.2791 -0.0841 -0.2627 Hungary -0.0419 -0.5133 -0.055 -0.637 (0.1113) (0.2435) (0.1214) (0.2534)
-0.0155 -0.1883 -0.0181 -0.2078 Ireland -0.9534 -0.8484 -0.1106 -0.5352 (0.1129) (0.1521) (0.1453) (0.1579) -0.3529 -0.3113 -0.0364 -0.1746 Israel -0.3057 -0.4603 -0.0298 -0.5521
(0.0683) (0.1085) (0.0888) (0.1151) -0.1131 -0.1689 -0.0098 -0.1801 Luxembourg -0.4163 -0.43 -0.577 -0.3403 (0.1373) (0.2185) (0.1481) (0.2240) -0.1541 -0.1578 -0.1897 -0.1110
Netherlands -1.1599 -1.4144 -0.9271 -1.5388 (0.0824) (0.1345) (0.0979) (0.1393) -0.4293 -0.5189 -0.3049 -0.5019 Russia -0.0389 -0.5405 -0.2744 -0.8454 (0.0650) (0.1118) (0.0687) (0.1155)
-0.0144 -0.1983 -0.0903 -0.2758
32
Table 3. Continued
(1) (2) (3) (4)
Sweden -0.602 -0.825 -0.7917 -1.0305 (0.0482) (0.0625) (0.0517) (0.0660) -0.2228 -0.3027 -0.2603 -0.3361 United Kingdom -1.0639 -1.2676 -1.0322 -1.3472 (0.0479) (0.0714) (0.0515) (0.0752)
-0.3938 -0.4650 -0.3394 -0.4394
Demographic controls? N N Y Y Country-specific time dummies? N Y N Y Note: The table displays results from Probit regressions where the dependent variable indicates whether a single mother works or not. There are 15 countries and 3 periods included in the analysis. The sample size is 13,440. Other controls included in the regressions are age, age2, age3, education, marital status, number of children, a dummy for preschool age children, female unemployment rates, and time dummies (see table 4). I report coefficients, standard errors (in parenthesis) and average derivatives. Specifications (1) and (2) do not include the demographic controls. Specifications (1) and (3) include time dummies that are common for all countries, while specifications (2) and (4) include country-specific time dummies.
33
Table 4. Preliminary Probits for Single Mothers' Employment with Demographic Controls
(3) (4)
Age 0.0989 0.104
(0.0544) (0.0547)
0.0325 0.0339
High School Degree 0.5739 0.584
(0.0270) (0.0273)
0.1887 0.1905 College 0.9298 0.9497
(0.0449) (0.0451)
0.3058 0.3098
Never Married -0.1819 -0.1805
(0.0298) (0.0301)
-0.0598 -0.0589
Number of Children -0.1902 -0.1902
(0.0138) (0.0139)
-0.0625 -0.0621
Preschool children -0.345 -0.356
(0.0298) (0.0299)
-0.1134 -0.1161 Country-specific time dummies?
N Y
Note: The table displays results from Probit regressions where the dependent variable indicates whether a single mother works or not. There are 15 countries and 3 periods included in the analysis. The sample size is 13,440. Also included in the regressions are age2, age3, female unemployment rates (in specification 3), country dummies (see table 3) and time dummies. I report coefficients, standard errors (in parenthesis) and average derivatives.
34
Table 5. Preliminary Probits for Single Mothers' Employment with Married Mothers as a Comparison Group, Results for Country Dummies.
(1) (2) (3) (4) Australia -0.1396 -0.1056 -0.2178 -0.1922 (0.0518) (0.0543) (0.0479) (0.0502) -0.0526 -0.0374 -0.0809 -0.0670
Austria 0.3383 0.3594 0.2801 0.2952 (0.1014) (0.1054) (0.1005) (0.1045) 0.1275 0.1272 0.1041 0.1029 Belgium 0.0296 0.0243 0.0432 0.0158 (0.0894) (0.0922) (0.0878) (0.0905)
0.0112 0.0086 0.0160 0.0055 Canada -0.28 -0.1676 -0.2988 -0.2039 (0.0263) (0.0294) (0.0213) (0.0242) -0.1055 -0.0593 -0.1110 -0.0710 France 0.3063 0.3083 0.3426 0.3407
(0.0636) (0.0666) (0.0623) (0.0651) 0.1154 0.1091 0.1273 0.1187 Germany 0.4265 0.4205 0.4407 0.4077 (0.0806) (0.0835) (0.0789) (0.0817) 0.1607 0.1489 0.1638 0.1421
Hungary 0.3537 0.3411 0.3009 0.2653 (0.1166) (0.1216) (0.1155) (0.1207) 0.1333 0.1207 0.1118 0.0924 Ireland -0.1406 0.0273 -0.2095 -0.0446 (0.1161) (0.1212) (0.1157) (0.1209)
-0.0530 0.0097 -0.0779 -0.0156 Israel 0.5584 0.4511 0.6531 0.5364 (0.0690) (0.0724) (0.0705) (0.0740) 0.2104 0.1597 0.2427 0.1869 Luxembourg 0.554 0.6583 0.5423 0.6264
(0.1411) (0.1456) (0.1403) (0.1449) 0.2088 0.2330 0.2015 0.2183 Netherlands -0.148 -0.2154 -0.1611 -0.2485 (0.0839) (0.0864) (0.0825) (0.0850) -0.0558 -0.0763 -0.0599 -0.0866
Russia 0.3634 0.3048 0.2674 0.2022 (0.0681) (0.0697) (0.0658) (0.0674) 0.1369 0.1079 0.0994 0.0705
35
Table 5. Continued
(1) (2) (3) (4)
Sweden -0.4229 -0.4517 -0.4561 -0.4914 (0.0469) (0.0480) (0.0455) (0.0465) -0.1594 -0.1599 -0.1695 -0.1712 United Kingdom -0.4732 -0.3901 -0.479 -0.4164 (0.0489) (0.0512) (0.0467) 0.0488
-0.1783 -0.1381 -0.1780 -0.1451 United States 0.1184 0.2919 0.11 0.2711 (0.0250) (0.0281) (0.0234) (0.0264) 0.0446 0.1033 0.0409 0.0945
Demographic Controls? N Y N Y Country-specific time dummies?
N N Y Y
Note: The table displays results from Probit regressions where the dependent variable indicates whether a mother (single or married) works or not. There are 15 countries and 3 periods included in the analysis. The sample size is 98,953. I report coefficients, standard errors (in parenthesis) and average derivatives for country dummies interacted with a single mother indicator. Other controls included in the regressions are time dummies, country dummies, and, in specifications 2 and 4, age, age2, age3, education, marital status, number of children, a dummy for preschool age children, and female unemployment rates. Specifications (1) and (3) do not include the demographic controls. Specifications (1) and (2) include time dummies that are common for all countries, while specifications (3) and (4) include country-specific time dummies.
36
Table 6. Median Earnings and Benefits for Single Mothers
Earnings Benefits if not working Benefits if working
Australia 1.1894 0.7051 0.1675
Austria 0.7275 0.2540 0.1683
Belgium 1.1184 0.2181 0.2205
Canada 1.0587 0.4551 0.0935
France 0.9416 0.4315 0.1663
Germany 1.1433 0.2279 0.0338
Hungary 0.8788 0.1997 0.2069
Ireland 0.9934 0.5045 0.2616
Israel 0.8144 0.2023 0.1018
Luxembourg 0.8496 0.3117 0.0826
Netherlands 0.9726 1.1382 0.1711
Russia 1.0078 0.0000 0.1050
Sweden 0.8735 0.2730 0.2506
United Kingdom 1.0284 0.8616 0.1765
United States 0.8836 0.3029 0.1077 Note: LIS data, 15 countries, circa 1995. Earnings and benefits are expressed as a proportion of “median equivalent income” in a given country and period (see Appendix). Median earnings and benefits if working are calculated from the subsample of working single mothers, while median benefits if not working are calculated using the subsample of single mothers out of work.
37
Table 7. Descriptive Statistics for Sample Used in Structural Probits for Single Mothers' Employment
N Mean Stdev Min Max
Work 13440 0.566 0.4956 0.00 1.00
Age 13440 34.940 8.1316 18.00 60.00
High School Grad 13440 0.593 0.4912 0.00 1.00
College 13440 0.117 0.3218 0.00 1.00
Number of Children 13440 1.742 0.9749 1.00 12.00
Preschool 13440 0.385 0.4867 0.00 1.00
Never Married 13440 0.270 0.4440 0.00 1.00
Earnings 13440 1.107 0.6516 3.05E-02 7.33
Benefits if not working 13440 0.359 0.3055 0.00 2.66
Benefits if working 13440 0.154 0.2074 0.00 4.09
Other Non Labor Income 13440 0.156 0.4158 0.00 7.66 Note: Included are all single mothers (see text for definition) in the pooled country and period sample. See text for list of countries and years. LIS weights have been used. Monetary variables are measured as a proportion of “median equivalent income” in a given country and period (see Appendix).
38
Table 8. Structural Probit for Single Mothers' Employment
(1) (2) (3) (4) (5) (6) Age 0.1025 0.1065 0.0934 0.096 0.0859 0.1408
(0.0546) (0.0549) (0.0550) (0.0553) (0.0577) (0.0596)
0.0336 0.0347 0.0306 0.0312 0.0281 0.0458
High School Degree 0.5765 0.5871 0.5758 0.5855 0.5578 0.6388
(0.0280) (0.0283) (0.0281) (0.0284) (0.0377) (0.0440)
0.1889 0.1911 0.1885 0.1905 0.1827 0.2077 College 0.9204 0.9452 0.918 0.9428 0.8688 1.0786
(0.0487) (0.0491) (0.0486) (0.0491) (0.0825) (0.1007)
0.3016 0.3076 0.3006 0.3067 0.2845 0.3508
Number of Children -0.2501 -0.2418 -0.2469 -0.2391 -0.2541 -0.251
(0.0171) (0.0173) (0.0172) (0.0174) (0.0171) (0.0173)
-0.0819 -0.0787 -0.0808 -0.0778 -0.0832 -0.0816
Preschool children -0.3525 -0.3614 -0.3305 -0.3389 -0.3499 -0.3582
(0.0298) (0.0300) (0.0298) (0.0300) (0.0298) (0.0300)
-0.1155 -0.1176 -0.1082 -0.1102 -0.1146 -0.1165
Never Married -0.1999 -0.1969 -0.1939 -0.1913 -0.1964 -0.2047
(0.0301) (0.0303) (0.0301) (0.0304) (0.0304) (0.0307)
-0.0655 -0.0641 -0.0635 -0.0622 -0.0643 -0.0666
Earnings 0.0991 0.0756 0.1064 0.0833 0.1828 -0.1224
(0.0296) (0.0302) (0.0301) (0.0307) (0.1068) (0.1373)
0.0325 0.0246 0.0348 0.0271 0.0599 -0.0398
Benefits if out of work 0.1029 0.1009 0.1021 0.1071 0.0977 0.1008
(0.0573) (0.0583) (0.0573) (0.0581) (0.0575) (0.0583)
0.0337 0.0328 0.0334 0.0348 0.0320 0.0328
Benefits if working 0.5412 0.4504 0.5426 0.4509 0.5834 0.5192
(0.0830) (0.0856) (0.0838) (0.0870) (0.0807) (0.0827)
0.1773 0.1466 0.1777 0.1467 0.1911 0.1688
Other Non-Labor Income -0.0406 -0.0417 -0.0399 -0.0414 -0.0407 -0.0358
(0.0410) (0.0411) (0.0410) (0.0412) (0.0410) (0.0412)
-0.0133 -0.0136 -0.0131 -0.0135 -0.0133 -0.0116 Country-specific time dummies? N Y N Y N Y
Note: The table displays results from Probit regressions where the dependent variable indicates whether a single mother works or not. There are 15 countries and 3 periods included in the analysis. The sample size is 13,440. Also included in the regressions are age2, age3, country and time dummies and, in specifications without country-specific time dummies, female unemployment rates. I report coefficients, standard errors (in parenthesis) and average derivatives. Odd columns show the results from using time dummies that are common for all countries, while even ones report the results from Probits that include country-specific time dummies. The baseline specifications are shown in columns (1) and (2). Columns (3) and (4) define employed women as those who report working at least 15 hours a week (and have positive earnings). All the specifications but (5) and (6) use observed wages for working single mothers and predicted wages for non-working single mothers. Monetary variables are measured as a proportion of “median equivalent income” in a given country and period (see Appendix). Note that the standars errors for the benefits variables are not corrected and should therefore be interpreted with caution.
39
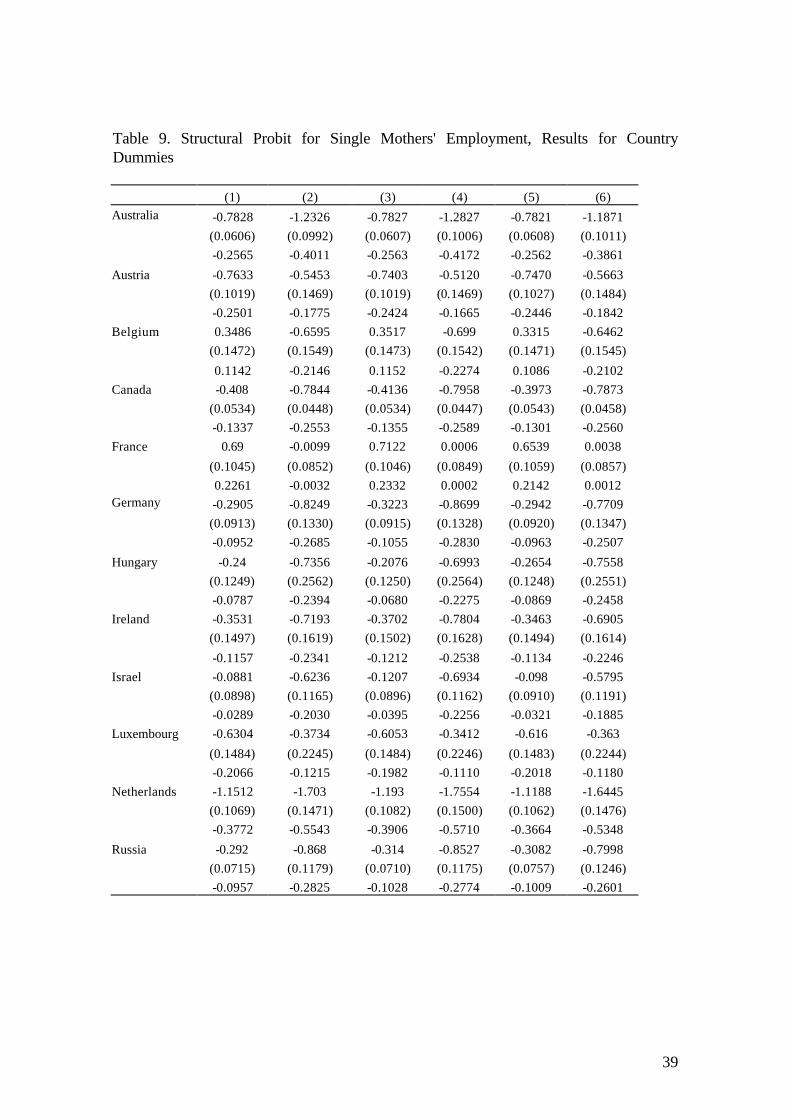
Table 9. Structural Probit for Single Mothers' Employment, Results for Country Dummies (1) (2) (3) (4) (5) (6) Australia -0.7828 -1.2326 -0.7827 -1.2827 -0.7821 -1.1871 (0.0606) (0.0992) (0.0607) (0.1006) (0.0608) (0.1011) -0.2565 -0.4011 -0.2563 -0.4172 -0.2562 -0.3861
Austria -0.7633 -0.5453 -0.7403 -0.5120 -0.7470 -0.5663 (0.1019) (0.1469) (0.1019) (0.1469) (0.1027) (0.1484) -0.2501 -0.1775 -0.2424 -0.1665 -0.2446 -0.1842 Belgium 0.3486 -0.6595 0.3517 -0.699 0.3315 -0.6462 (0.1472) (0.1549) (0.1473) (0.1542) (0.1471) (0.1545)
0.1142 -0.2146 0.1152 -0.2274 0.1086 -0.2102 Canada -0.408 -0.7844 -0.4136 -0.7958 -0.3973 -0.7873 (0.0534) (0.0448) (0.0534) (0.0447) (0.0543) (0.0458) -0.1337 -0.2553 -0.1355 -0.2589 -0.1301 -0.2560 France 0.69 -0.0099 0.7122 0.0006 0.6539 0.0038
(0.1045) (0.0852) (0.1046) (0.0849) (0.1059) (0.0857) 0.2261 -0.0032 0.2332 0.0002 0.2142 0.0012 Germany -0.2905 -0.8249 -0.3223 -0.8699 -0.2942 -0.7709 (0.0913) (0.1330) (0.0915) (0.1328) (0.0920) (0.1347) -0.0952 -0.2685 -0.1055 -0.2830 -0.0963 -0.2507
Hungary -0.24 -0.7356 -0.2076 -0.6993 -0.2654 -0.7558 (0.1249) (0.2562) (0.1250) (0.2564) (0.1248) (0.2551) -0.0787 -0.2394 -0.0680 -0.2275 -0.0869 -0.2458 Ireland -0.3531 -0.7193 -0.3702 -0.7804 -0.3463 -0.6905 (0.1497) (0.1619) (0.1502) (0.1628) (0.1494) (0.1614)
-0.1157 -0.2341 -0.1212 -0.2538 -0.1134 -0.2246 Israel -0.0881 -0.6236 -0.1207 -0.6934 -0.098 -0.5795 (0.0898) (0.1165) (0.0896) (0.1162) (0.0910) (0.1191) -0.0289 -0.2030 -0.0395 -0.2256 -0.0321 -0.1885 Luxembourg -0.6304 -0.3734 -0.6053 -0.3412 -0.616 -0.363
(0.1484) (0.2245) (0.1484) (0.2246) (0.1483) (0.2244) -0.2066 -0.1215 -0.1982 -0.1110 -0.2018 -0.1180 Netherlands -1.1512 -1.703 -1.193 -1.7554 -1.1188 -1.6445 (0.1069) (0.1471) (0.1082) (0.1500) (0.1062) (0.1476) -0.3772 -0.5543 -0.3906 -0.5710 -0.3664 -0.5348
Russia -0.292 -0.868 -0.314 -0.8527 -0.3082 -0.7998 (0.0715) (0.1179) (0.0710) (0.1175) (0.0757) (0.1246) -0.0957 -0.2825 -0.1028 -0.2774 -0.1009 -0.2601
40
Table 9. Continued (1) (2) (3) (4) (5) (6)
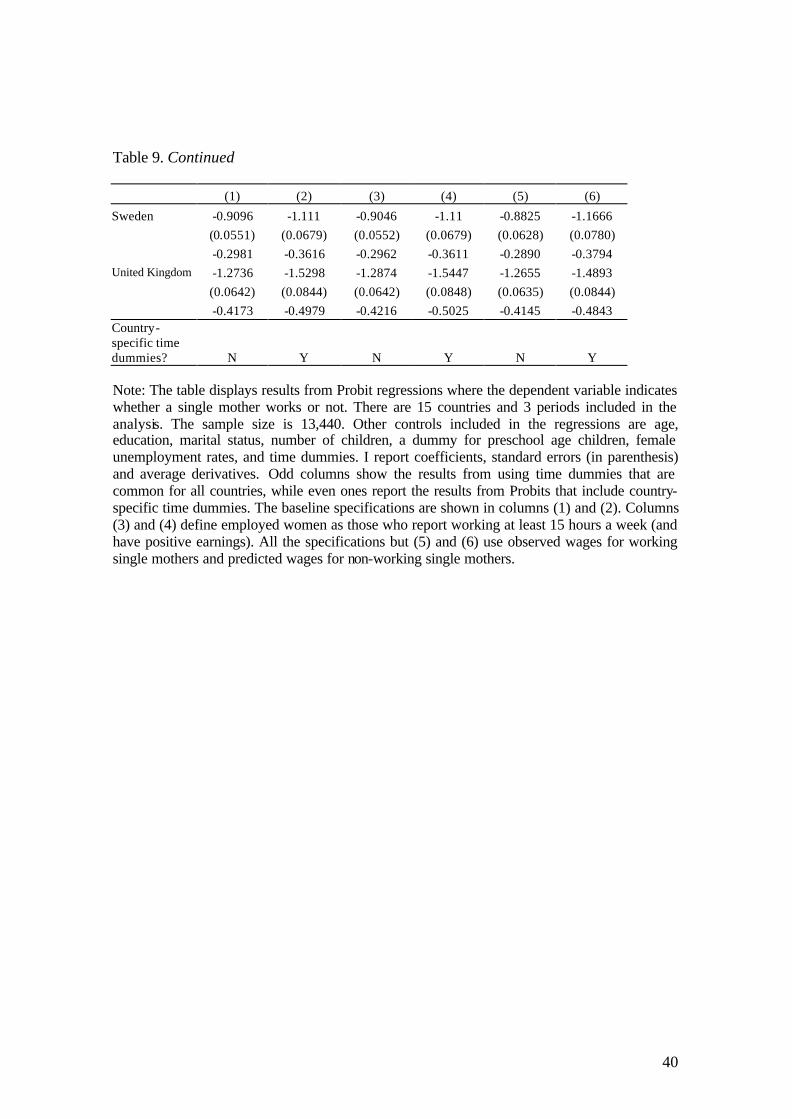
Sweden -0.9096 -1.111 -0.9046 -1.11 -0.8825 -1.1666 (0.0551) (0.0679) (0.0552) (0.0679) (0.0628) (0.0780) -0.2981 -0.3616 -0.2962 -0.3611 -0.2890 -0.3794 United Kingdom -1.2736 -1.5298 -1.2874 -1.5447 -1.2655 -1.4893 (0.0642) (0.0844) (0.0642) (0.0848) (0.0635) (0.0844) -0.4173 -0.4979 -0.4216 -0.5025 -0.4145 -0.4843 Country-specific time dummies? N Y N Y N Y Note: The table displays results from Probit regressions where the dependent variable indicates whether a single mother works or not. There are 15 countries and 3 periods included in the analysis. The sample size is 13,440. Other controls included in the regressions are age, education, marital status, number of children, a dummy for preschool age children, female unemployment rates, and time dummies. I report coefficients, standard errors (in parenthesis) and average derivatives. Odd columns show the results from using time dummies that are common for all countries, while even ones report the results from Probits that include country-specific time dummies. The baseline specifications are shown in columns (1) and (2). Columns (3) and (4) define employed women as those who report working at least 15 hours a week (and have positive earnings). All the specifications but (5) and (6) use observed wages for working single mothers and predicted wages for non-working single mothers.
41
Table 10. Structural Probit for Single Mothers' Employment with Married Mothers as Comparison Group, Results for Country Dummies
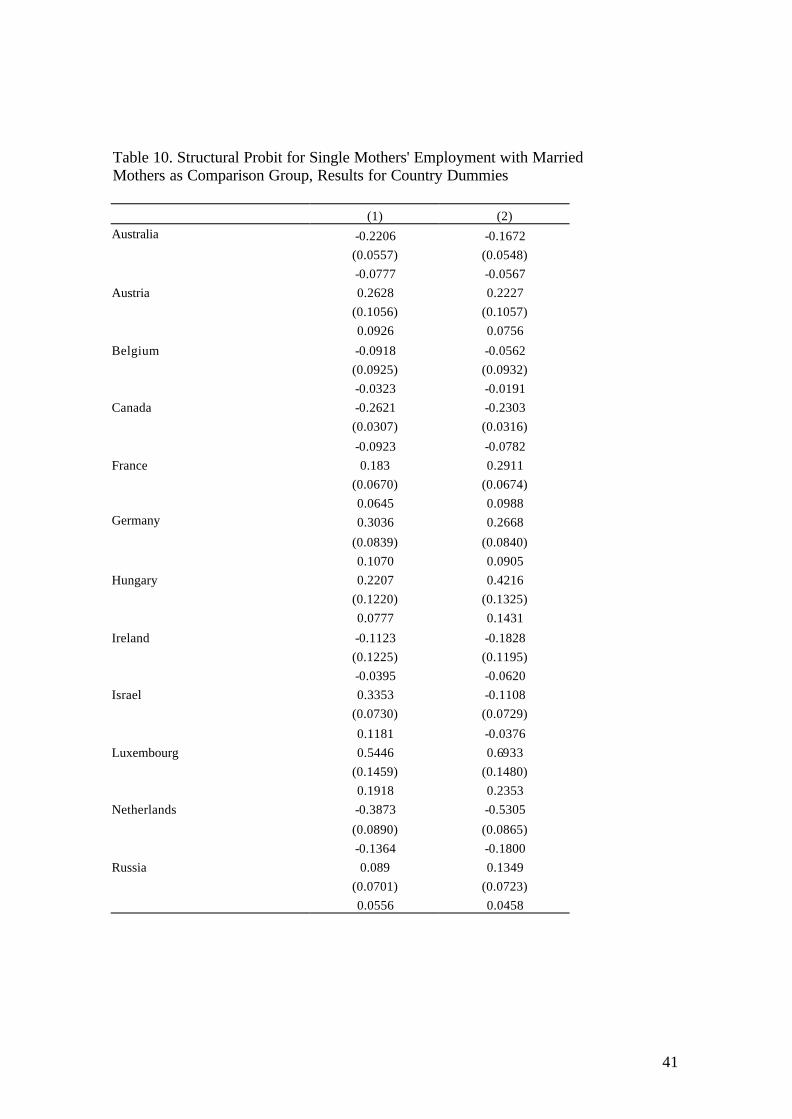
(1) (2) Australia -0.2206 -0.1672 (0.0557) (0.0548) -0.0777 -0.0567 Austria 0.2628 0.2227 (0.1056) (0.1057) 0.0926 0.0756
Belgium -0.0918 -0.0562 (0.0925) (0.0932) -0.0323 -0.0191 Canada -0.2621 -0.2303 (0.0307) (0.0316)
-0.0923 -0.0782 France 0.183 0.2911 (0.0670) (0.0674) 0.0645 0.0988 Germany 0.3036 0.2668
(0.0839) (0.0840) 0.1070 0.0905 Hungary 0.2207 0.4216 (0.1220) (0.1325) 0.0777 0.1431
Ireland -0.1123 -0.1828 (0.1225) (0.1195) -0.0395 -0.0620 Israel 0.3353 -0.1108 (0.0730) (0.0729)
0.1181 -0.0376 Luxembourg 0.5446 0.6933 (0.1459) (0.1480) 0.1918 0.2353 Netherlands -0.3873 -0.5305
(0.0890) (0.0865) -0.1364 -0.1800 Russia 0.089 0.1349 (0.0701) (0.0723) 0.0556 0.0458
42
Table 10. Continued
(1) (2)
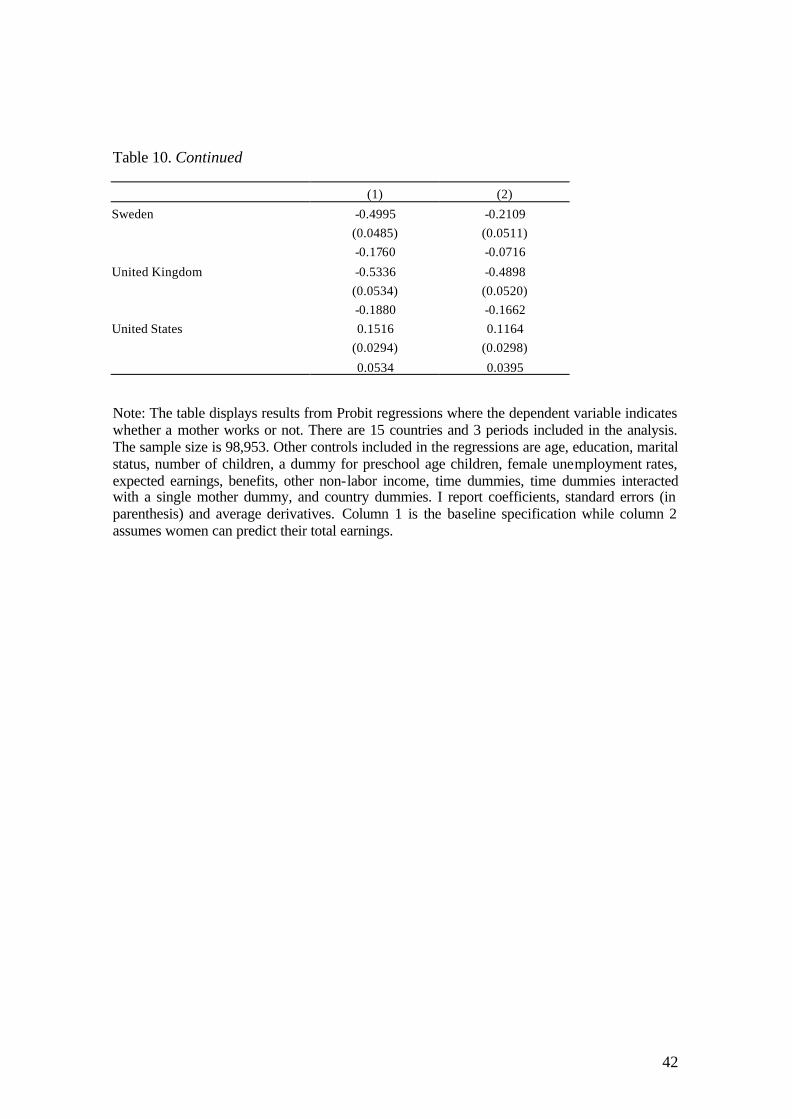
Sweden -0.4995 -0.2109 (0.0485) (0.0511) -0.1760 -0.0716
United Kingdom -0.5336 -0.4898 (0.0534) (0.0520) -0.1880 -0.1662 United States 0.1516 0.1164 (0.0294) (0.0298)
0.0534 0.0395 Note: The table displays results from Probit regressions where the dependent variable indicates whether a mother works or not. There are 15 countries and 3 periods included in the analysis. The sample size is 98,953. Other controls included in the regressions are age, education, marital status, number of children, a dummy for preschool age children, female unemployment rates, expected earnings, benefits, other non-labor income, time dummies, time dummies interacted with a single mother dummy, and country dummies. I report coefficients, standard errors (in parenthesis) and average derivatives. Column 1 is the baseline specification while column 2 assumes women can predict their total earnings.