Embed Size (px)
Citation preview
IZA DP No. 3286
Single Mothers and Poverty in Costa Rica
T. H. GindlingLuis Oviedo
DI
SC
US
SI
ON
PA
PE
R S
ER
IE
S
Forschungsinstitutzur Zukunft der ArbeitInstitute for the Studyof Labor
January 2008
Single Mothers and Poverty in Costa Rica
T. H. Gindling University of Maryland Baltimore County
and IZA
Luis Oviedo IICE, University of Costa Rica
Discussion Paper No. 3286 January 2008
IZA
P.O. Box 7240 53072 Bonn
Germany
Phone: +49-228-3894-0 Fax: +49-228-3894-180
E-mail: [email protected]
Any opinions expressed here are those of the author(s) and not those of IZA. Research published in this series may include views on policy, but the institute itself takes no institutional policy positions. The Institute for the Study of Labor (IZA) in Bonn is a local and virtual international research center and a place of communication between science, politics and business. IZA is an independent nonprofit organization supported by Deutsche Post World Net. The center is associated with the University of Bonn and offers a stimulating research environment through its international network, workshops and conferences, data service, project support, research visits and doctoral program. IZA engages in (i) original and internationally competitive research in all fields of labor economics, (ii) development of policy concepts, and (iii) dissemination of research results and concepts to the interested public. IZA Discussion Papers often represent preliminary work and are circulated to encourage discussion. Citation of such a paper should account for its provisional character. A revised version may be available directly from the author.
IZA Discussion Paper No. 3286 January 2008
ABSTRACT
Single Mothers and Poverty in Costa Rica*
Despite increasing average real family incomes in Costa Rica in the late 1990s and early 2000s, poverty rates did not fall. In this paper, we argue that during this period economic growth in Costa Rica did not translate into reduced poverty because of changes in family structure and in the labor market, and that these changes had an important gender dimension. Specifically, an increase in the proportion of Costa Rican households headed by single mothers led to an increase in the number of women with children entering the labor force. Many of these mothers, new entrants to the labor force, were unable or unwilling to find full-time work in the high-paying formal sector, and ended up unemployed or working part-time as self-employed workers. These labor market phenomena, in turn, contributed to low incomes for households vulnerable to poverty, especially those households headed by single mothers. JEL Classification: I32, J12, J38 Keywords: poverty, single mothers, employment, wages, Central America, Costa Rica Corresponding author: T. H. Gindling Department of Economics University of Maryland Baltimore County Baltimore, Maryland 21250 USA E-mail: [email protected]
* We are grateful for comments and suggestions provided by Andrew Mason, Jaime Saavedra, Carlos Sobrado and Juan Diego Trejos. An earlier version of this paper was written as part of the Labor Market Study for the World Bank Poverty Assessment of Costa Rica (supervised by Andrew Mason and Carlos Sobrado). We would like to thank the World Bank for their support for this research project, although all conclusions and opinions expressed are our own and should not be attributed to the World Bank.
I. Introduction
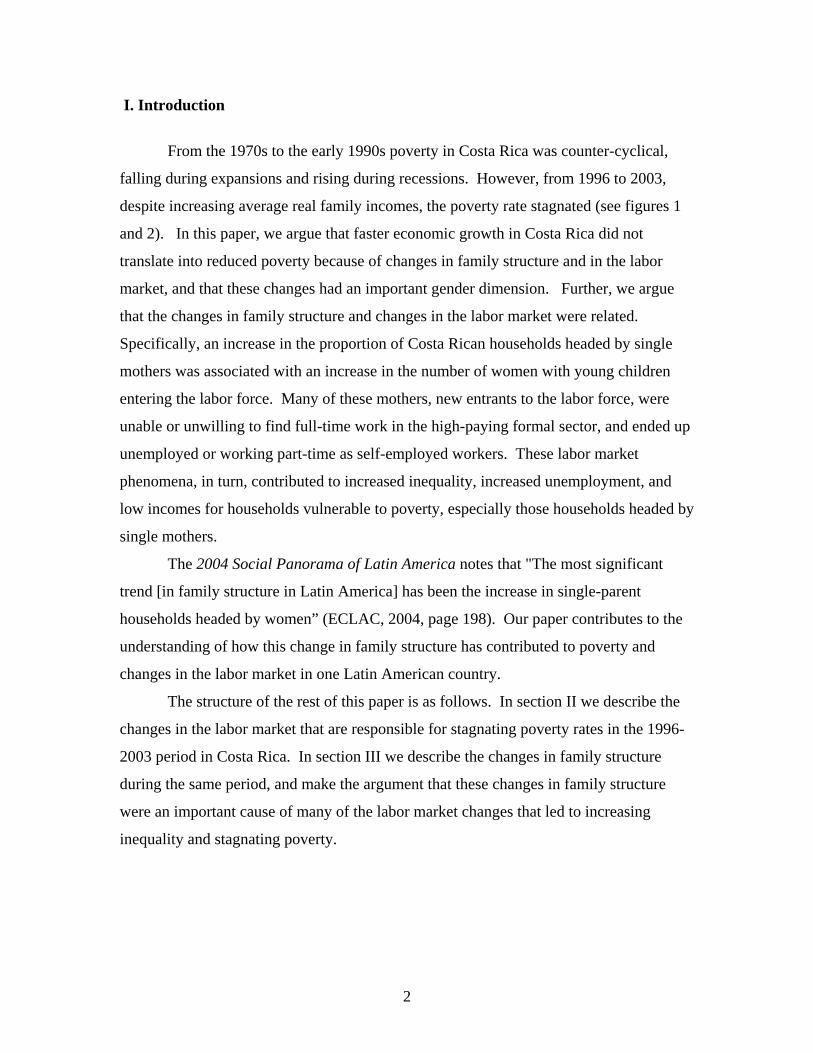
From the 1970s to the early 1990s poverty in Costa Rica was counter-cyclical,
falling during expansions and rising during recessions. However, from 1996 to 2003,
despite increasing average real family incomes, the poverty rate stagnated (see figures 1
and 2). In this paper, we argue that faster economic growth in Costa Rica did not
translate into reduced poverty because of changes in family structure and in the labor
market, and that these changes had an important gender dimension. Further, we argue
that the changes in family structure and changes in the labor market were related.
Specifically, an increase in the proportion of Costa Rican households headed by single
mothers was associated with an increase in the number of women with young children
entering the labor force. Many of these mothers, new entrants to the labor force, were
unable or unwilling to find full-time work in the high-paying formal sector, and ended up
unemployed or working part-time as self-employed workers. These labor market
phenomena, in turn, contributed to increased inequality, increased unemployment, and
low incomes for households vulnerable to poverty, especially those households headed by
single mothers.
The 2004 Social Panorama of Latin America notes that "The most significant
trend [in family structure in Latin America] has been the increase in single-parent
households headed by women” (ECLAC, 2004, page 198). Our paper contributes to the
understanding of how this change in family structure has contributed to poverty and
changes in the labor market in one Latin American country.
The structure of the rest of this paper is as follows. In section II we describe the
changes in the labor market that are responsible for stagnating poverty rates in the 1996-
2003 period in Costa Rica. In section III we describe the changes in family structure
during the same period, and make the argument that these changes in family structure
were an important cause of many of the labor market changes that led to increasing
inequality and stagnating poverty.
2
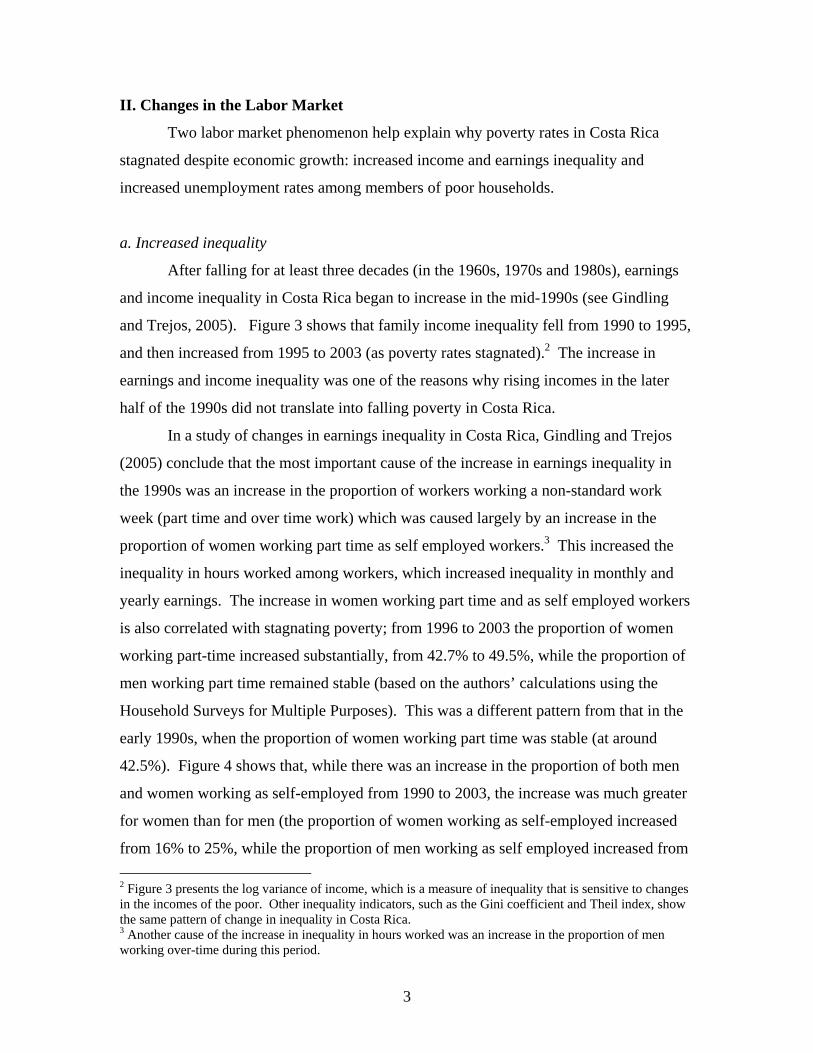
II. Changes in the Labor Market
Two labor market phenomenon help explain why poverty rates in Costa Rica
stagnated despite economic growth: increased income and earnings inequality and
increased unemployment rates among members of poor households.
a. Increased inequality
After falling for at least three decades (in the 1960s, 1970s and 1980s), earnings
and income inequality in Costa Rica began to increase in the mid-1990s (see Gindling
and Trejos, 2005). Figure 3 shows that family income inequality fell from 1990 to 1995,
and then increased from 1995 to 2003 (as poverty rates stagnated).2 The increase in
earnings and income inequality was one of the reasons why rising incomes in the later
half of the 1990s did not translate into falling poverty in Costa Rica.
In a study of changes in earnings inequality in Costa Rica, Gindling and Trejos
(2005) conclude that the most important cause of the increase in earnings inequality in
the 1990s was an increase in the proportion of workers working a non-standard work
week (part time and over time work) which was caused largely by an increase in the
proportion of women working part time as self employed workers.3 This increased the
inequality in hours worked among workers, which increased inequality in monthly and
yearly earnings. The increase in women working part time and as self employed workers
is also correlated with stagnating poverty; from 1996 to 2003 the proportion of women
working part-time increased substantially, from 42.7% to 49.5%, while the proportion of
men working part time remained stable (based on the authors’ calculations using the
Household Surveys for Multiple Purposes). This was a different pattern from that in the
early 1990s, when the proportion of women working part time was stable (at around
42.5%). Figure 4 shows that, while there was an increase in the proportion of both men
and women working as self-employed from 1990 to 2003, the increase was much greater
for women than for men (the proportion of women working as self-employed increased
from 16% to 25%, while the proportion of men working as self employed increased from 2 Figure 3 presents the log variance of income, which is a measure of inequality that is sensitive to changes in the incomes of the poor. Other inequality indicators, such as the Gini coefficient and Theil index, show the same pattern of change in inequality in Costa Rica. 3 Another cause of the increase in inequality in hours worked was an increase in the proportion of men working over-time during this period.
3
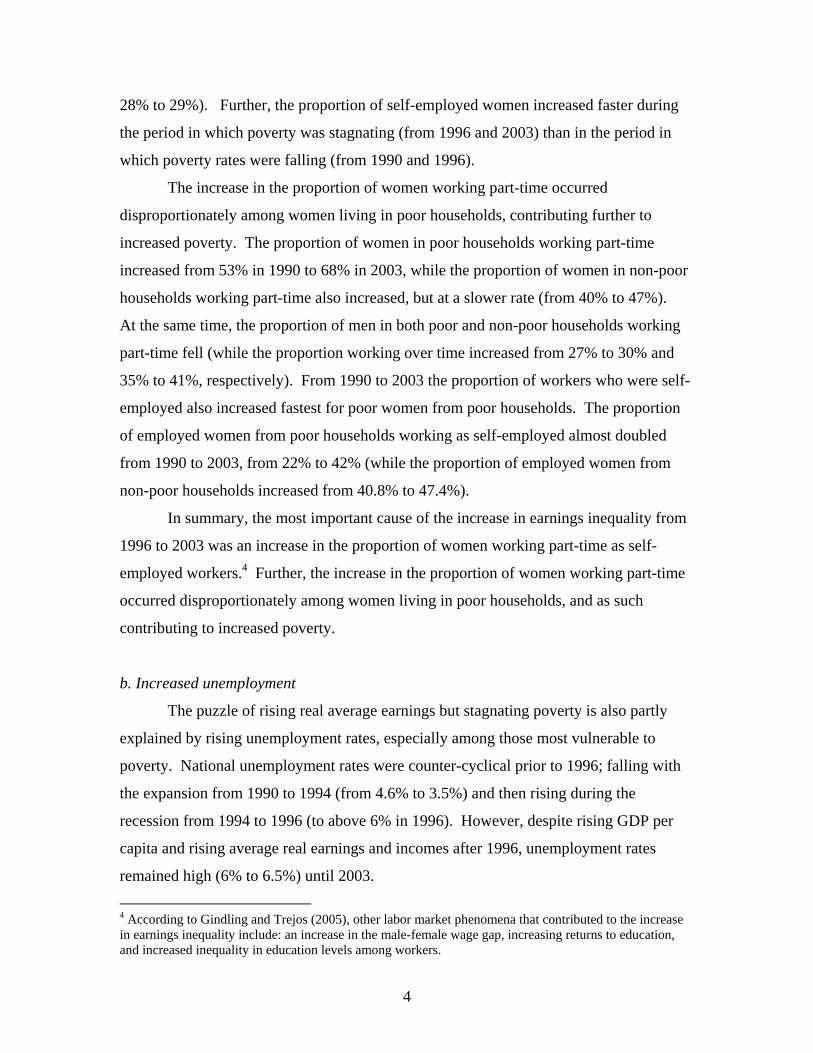
28% to 29%). Further, the proportion of self-employed women increased faster during
the period in which poverty was stagnating (from 1996 and 2003) than in the period in
which poverty rates were falling (from 1990 and 1996).
The increase in the proportion of women working part-time occurred
disproportionately among women living in poor households, contributing further to
increased poverty. The proportion of women in poor households working part-time
increased from 53% in 1990 to 68% in 2003, while the proportion of women in non-poor
households working part-time also increased, but at a slower rate (from 40% to 47%).
At the same time, the proportion of men in both poor and non-poor households working
part-time fell (while the proportion working over time increased from 27% to 30% and
35% to 41%, respectively). From 1990 to 2003 the proportion of workers who were self-
employed also increased fastest for poor women from poor households. The proportion
of employed women from poor households working as self-employed almost doubled
from 1990 to 2003, from 22% to 42% (while the proportion of employed women from
non-poor households increased from 40.8% to 47.4%).
In summary, the most important cause of the increase in earnings inequality from
1996 to 2003 was an increase in the proportion of women working part-time as self-
employed workers.4 Further, the increase in the proportion of women working part-time
occurred disproportionately among women living in poor households, and as such
contributing to increased poverty.
b. Increased unemployment
The puzzle of rising real average earnings but stagnating poverty is also partly
explained by rising unemployment rates, especially among those most vulnerable to
poverty. National unemployment rates were counter-cyclical prior to 1996; falling with
the expansion from 1990 to 1994 (from 4.6% to 3.5%) and then rising during the
recession from 1994 to 1996 (to above 6% in 1996). However, despite rising GDP per
capita and rising average real earnings and incomes after 1996, unemployment rates
remained high (6% to 6.5%) until 2003.
4 According to Gindling and Trejos (2005), other labor market phenomena that contributed to the increase in earnings inequality include: an increase in the male-female wage gap, increasing returns to education, and increased inequality in education levels among workers.
4
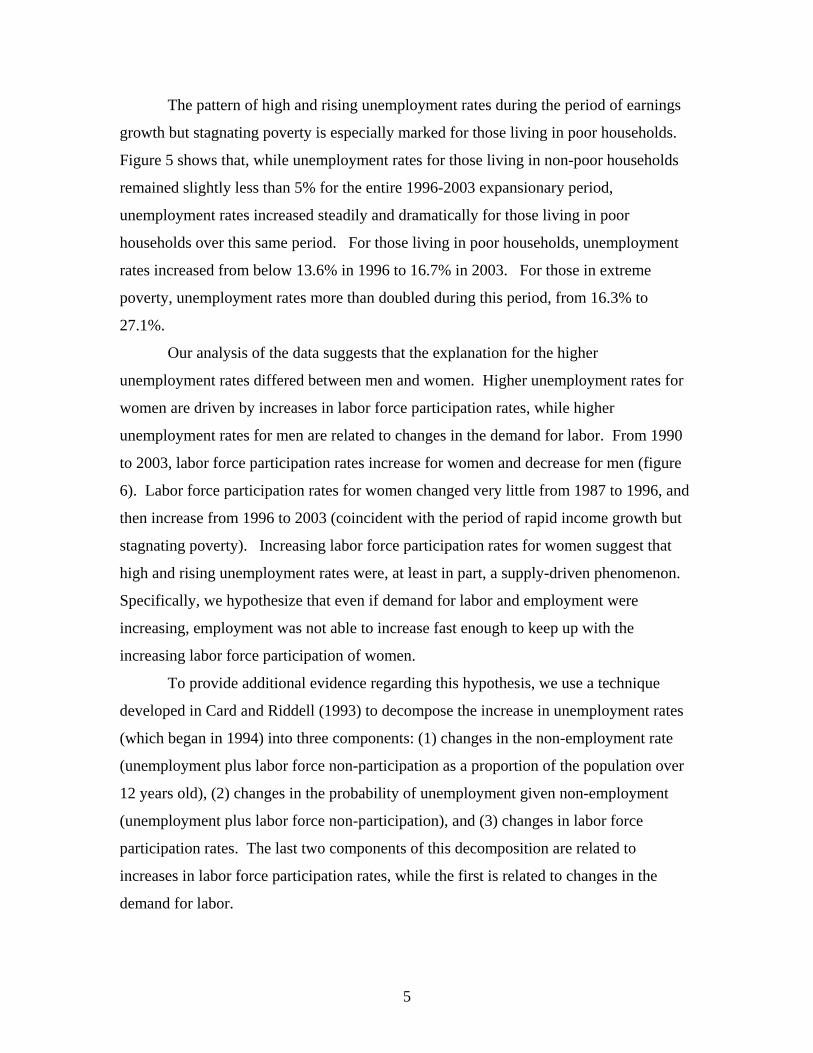
The pattern of high and rising unemployment rates during the period of earnings
growth but stagnating poverty is especially marked for those living in poor households.
Figure 5 shows that, while unemployment rates for those living in non-poor households
remained slightly less than 5% for the entire 1996-2003 expansionary period,
unemployment rates increased steadily and dramatically for those living in poor
households over this same period. For those living in poor households, unemployment
rates increased from below 13.6% in 1996 to 16.7% in 2003. For those in extreme
poverty, unemployment rates more than doubled during this period, from 16.3% to
27.1%.
Our analysis of the data suggests that the explanation for the higher
unemployment rates differed between men and women. Higher unemployment rates for
women are driven by increases in labor force participation rates, while higher
unemployment rates for men are related to changes in the demand for labor. From 1990
to 2003, labor force participation rates increase for women and decrease for men (figure
6). Labor force participation rates for women changed very little from 1987 to 1996, and
then increase from 1996 to 2003 (coincident with the period of rapid income growth but
stagnating poverty). Increasing labor force participation rates for women suggest that
high and rising unemployment rates were, at least in part, a supply-driven phenomenon.
Specifically, we hypothesize that even if demand for labor and employment were
increasing, employment was not able to increase fast enough to keep up with the
increasing labor force participation of women.
To provide additional evidence regarding this hypothesis, we use a technique
developed in Card and Riddell (1993) to decompose the increase in unemployment rates
(which began in 1994) into three components: (1) changes in the non-employment rate
(unemployment plus labor force non-participation as a proportion of the population over
12 years old), (2) changes in the probability of unemployment given non-employment
(unemployment plus labor force non-participation), and (3) changes in labor force
participation rates. The last two components of this decomposition are related to
increases in labor force participation rates, while the first is related to changes in the
demand for labor.
5
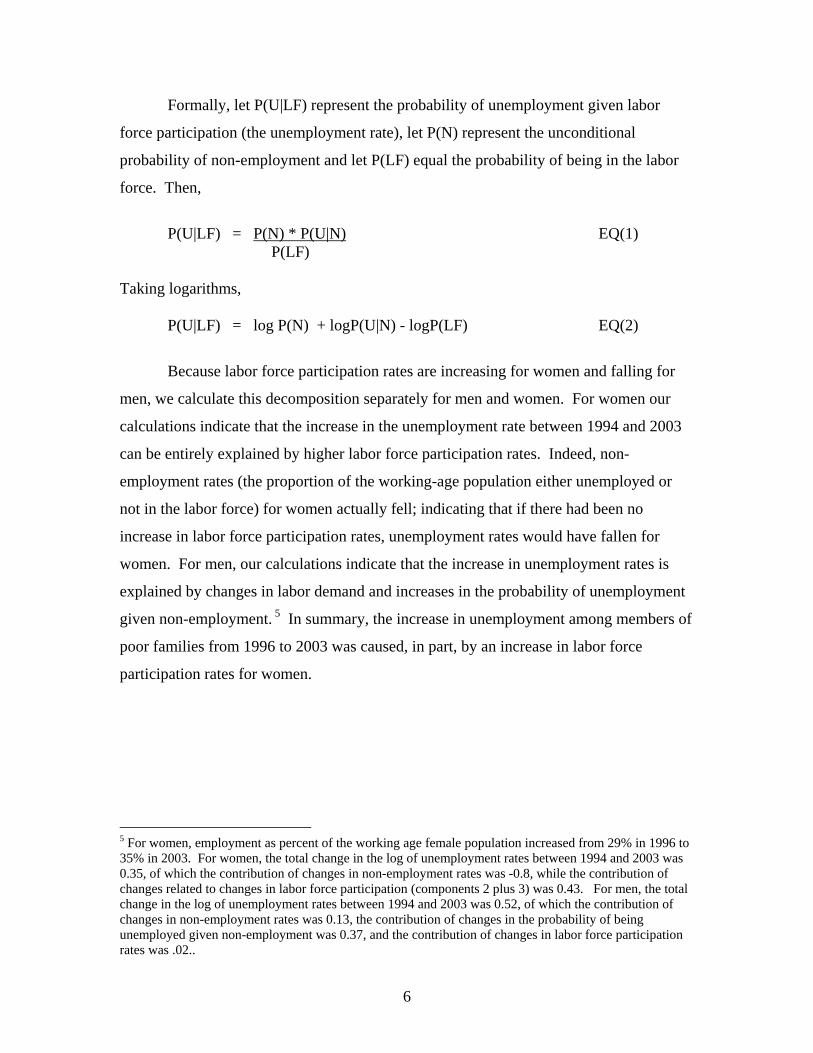
Formally, let P(U|LF) represent the probability of unemployment given labor
force participation (the unemployment rate), let P(N) represent the unconditional
probability of non-employment and let P(LF) equal the probability of being in the labor
force. Then,
P(U|LF) = P(N) * P(U|N) EQ(1) P(LF) Taking logarithms, P(U|LF) = log P(N) + logP(U|N) - logP(LF) EQ(2)
Because labor force participation rates are increasing for women and falling for
men, we calculate this decomposition separately for men and women. For women our
calculations indicate that the increase in the unemployment rate between 1994 and 2003
can be entirely explained by higher labor force participation rates. Indeed, non-
employment rates (the proportion of the working-age population either unemployed or
not in the labor force) for women actually fell; indicating that if there had been no
increase in labor force participation rates, unemployment rates would have fallen for
women. For men, our calculations indicate that the increase in unemployment rates is
explained by changes in labor demand and increases in the probability of unemployment
given non-employment. 5 In summary, the increase in unemployment among members of
poor families from 1996 to 2003 was caused, in part, by an increase in labor force
participation rates for women.
5 For women, employment as percent of the working age female population increased from 29% in 1996 to 35% in 2003. For women, the total change in the log of unemployment rates between 1994 and 2003 was 0.35, of which the contribution of changes in non-employment rates was -0.8, while the contribution of changes related to changes in labor force participation (components 2 plus 3) was 0.43. For men, the total change in the log of unemployment rates between 1994 and 2003 was 0.52, of which the contribution of changes in non-employment rates was 0.13, the contribution of changes in the probability of being unemployed given non-employment was 0.37, and the contribution of changes in labor force participation rates was .02..
6
III. Changes in Family Structure
In the last section, we identified the following explanations for stagnating poverty
from 1996 to 2003 in Costa Rica despite economic growth: an increase in the proportion
of working women from poor households working part-time as self-employed workers
and an increase in the labor force participation rates for women in poor families, which in
turn caused an increase in unemployment rates among members of poor households. In
this section, we show that these labor market phenomena are related to changes in the
structure of Costa Rican households. The most notable change in the structure of Costa
Rican households is an increase in the proportion of female-headed households, which
increased from 18.0% of all households in 1990 to 25.5% in 2003, and the related decline
in "traditional" two-parent male headed households (from 61.6% of all households in
1990 to 49.6% in 2003, see table 1). The most rapid increase in the proportion of female-
headed households occurred during the period when poverty rates were stagnating despite
economic growth; from 1996 to 2003 the proportion of households headed by women
increased from 20.7% to 25.5% (as opposed to an increase of only 3.1 percentage points
from 1990 to 1996). Further, in the 1990s it became increasingly likely that a poor
household was a female-headed household; the proportion of poor households headed by
women increased from 20.4% of poor households in 1990 to 33.0% in 2003 (table 1).
The proportion of female-headed households among the non-poor also increased in this
period, although the increase is smaller (from 17.2% to 23.4% of non-poor households).
In an analysis of the relationship between family structure and poverty, it is
important to distinguish female headed households headed by single mothers from female
headed households without children. In the aggregate, female household heads are not
necessarily poorer than male household heads. For example, ECLAC (2003) finds no
systematic difference in poverty rates for male and female headed households in Latin
America. Some female headed households are less likely to be poor than the average
household, such as the increasing number of economically independent young women in
Latin America who are reported as female-headed households (ECLAC 2004).6 On the
6 Slon and Zúniga (2006), using a panel data set of household heads constructed from the 2000-2002Costa Rican Household Surveys for Multiple Purposes, find that the probability of exiting poverty is lower for
7
other hand, poverty rates for households with children that are headed by single mothers
are higher than for any other family type in almost all Latin American countries (ECLAC
2004). As we can see from table 1, this is also true in Costa Rica--among family types
poverty rates are highest for single female headed households with children.
Female headed households in Costa Rica are overwhelmingly single parent
households (table 1).7 The typical female headed household is a single parent household
with children (while the typical male headed household is a two parent household with
children). As we can also see from table 1, the proportion of poor households headed by
single mothers in Costa Rica increased from 13.4% in 1990 to 16.8% in 1996 to 22.5% in
2003. During the period when incomes were growing but poverty was stagnant (1996-
2003) single mother headed households were the only type of household that increased
their poverty share. The increase in the number of single mother households in poverty
was not due to an increase in poverty rates among such households, which remained
steady (and even fell slightly), but rather to an increase in the proportion of such
households in the population in general. The proportion households headed by single
mothers increased from 11.5% in 1996 to 13.5% in 2003 (after remaining relatively
steady from 1990 to 1996).
The increase in single mother headed households contributed to stagnating
poverty rates during this period directly because such households are more likely to be
poor than other types of households. Single mother headed households are more likely to
be poor than other households, in part, because single mothers are more likely than others
to earn low wages. Table 2 presents the characteristics of poor and non-poor female
headed single parent households with children. Comparing single mothers with male
heads of “traditional” two parent families (table 3) shows that poor single mothers are
more likely to be unemployed, more likely to work part-time and more likely to work as
self-employed workers; labor market phenomenon that we have identified as causes of
the increase in inequality and stagnating poverty in the 1996-2003 period. Compared to
non-poor female household heads, poor female household heads are more likely to female-headed households than for male-headed households, and that the probability that a non-poor household becomes poor is higher for female-headed households than for male headed households (after controlling for other factors that affect transitions into and out of poverty). 7 We define a single-parent household is one where, according to the Household Surveys of Multiple Purposes, neither a spouse (esposo) nor companion (compañero) is present.
8
participate in the labor force, have higher levels of unemployment, are more likely to
work part-time and are more likely to work as self-employed workers (table 2).
Further, between 1996 and 2003 (when poverty rates stagnated despite economic
growth) labor force participation, unemployment, part-time work and self-employment
become more prevalent in families headed by poor single mothers. For example, table 4
shows that, among the poor, almost all new female labor force participants came from
households headed by single mothers; the proportion of poor female labor force
participants living in households headed by single mothers increased from 36.4%in 1990
to 48.3% in 2003(while the proportion of poor female labor force participants living in
male-headed households and in female-headed households without children decreased).
In addition, from 1996 to 2003 the proportion of poor single female household heads with
children who worked part time increased from 58.1% to 66.9%, the proportion working
in as self-employed workers increased from 49.6% to 51.8%, unemployment rates
increased from 5.2% to 9.0%, and labor force participation increased from 41.8% to
52.8% (table 2). On the other hand, during the same period, among male headed two
parent households labor force participation rates and the proportion working part time
fell. While unemployment rates and self-employment rates rose among male household
heads of two parent families, the increase was not as great as among single mothers
(comparing tables 2 and 3). For single mothers in non-poor households, from 1996 to
2003 the proportion who worked part time also increased, from 36.8% to 45.7%, the
proportion working in as self employed workers increased from 19.2% to over 25.4%,
and unemployment rates decreased from 2.7% to 2.1% (table 2).
In summary, the evidence suggests that the increase in the proportion of female
single parent households with children can help explain the labor market phenomenon
(higher labor force participation rates, higher unemployment rates and more part-time
workers in the self employed sector) that contributed to stagnating poverty rates and
higher earnings inequality in Costa Rica. Unfortunately, the Household Surveys for
Multiple Purposes do not allow us to identify the underlying sociological causes of the
increase in female headed households with children. For example, we cannot tell
whether these are women who have never been married, were married but have been
9
divorced or widowed, or who have lived in union libres but no longer have another adult
living in the household. This is an important focus of future research.8
V. Conclusions and Policy Implications
The period when poverty rates stagnated in Costa Rica despite growing average
real earnings and incomes coincided with a period of a large increase in the proportion of
households headed by women, and an even larger increase in the proportion of poor
households headed by single mothers. Because households headed by single mothers are
more likely to be poor than any other type of household, the increase in the proportion of
households headed by single mothers, by itself, increased poverty rates. The evidence is
also consistent with the story that these mothers, new entrants to the labor force, were
unable or unwilling to find full-time work in the high-paying formal sector, and ended up
unemployed or working part-time as self-employed workers. These labor market
phenomena, in turn, contributed to increased inequality, increased unemployment, and
low incomes for households vulnerable to poverty.
Our results suggests that many poor women in Costa Rica are single mothers who
presumably have the sole responsibility for child care, which may make it difficult to
work standard working hours in the formal sector. Policies that would make it easier for
8 The proportion of female single parent households without children also increased from 1987 to 2004 (although at a slower rate than the increase in female single parent households with children). These women are older and less likely to be labor market participants than female household heads with children and male household heads of "traditional" two-parent families; more than 65% are aged 65 years or older, while less than 10% are labor force participants. This suggests that these are older women who do not have access to the pensions of a spouse. Unfortunately, the household surveys do not allow us to identify whether these are women who were never married, who divorced, or whose husbands have died. From 1996 to 2003 there was also an increase in the proportion of wives in male-headed households who entered the labor force. From 1996 to 2003 an increasing percentage of wives living in poor households with children entered the labor force (the proportion increased from 11.5% to 13.5%). For wives from poor households, both employment rates and unemployment rates (as a percent of the population) increased. Among those employed, there was an increase in wives from poor families working part-time and as self-employed workers. While the increase in the proportion of households with working wives can help explain the increase in part-time and self-employed workers, it cannot help explain stagnating poverty rates because having two income earners in a household generally lowers the probability that a household is in poverty. Indeed, there is some evidence that the increase in the labor force participation rates of wives in two-parent families led to less poverty; the proportion of households with working spouses in Costa Rica increased more among non-poor households than among poor households (the proportion of poor male-headed households with an employed spouse increased from 6.7% in 1996 to 12.8% in 2003, while the proportion of non-poor male headed households with an employed spouse increased from 24.4% in 1996 to 32.2% in 2003).
10
single mothers to obtain and keep full-time work in the higher-paying formal sector could
help to reduce poverty rates in Costa Rica. Expanding the possibilities for child care for
poor families during normal working hours would make it easier for poor single mothers
to obtain high-paying full-time work. Public policies to expand access to child care
might include: expand government subsidies to poor families for child care, provide after
and before school child care programs in schools, and encourage private firms to provide
subsidized day care facilities at work. Trejos (2006) describes existing programs in this
area in Costa Rica, such as the Ministry of Health Program of Centros Infantiles and the
IMAS program Oportunidades de Atención a la Niñez. He makes the points that existing
programs cover a very small proportion of the poor families who need child care, and that
the small amount of spending on these programs has actually been falling since 2000.
Also, these programs are only for preschool-aged children. For school-aged children, the
Ministry of Education runs programs that make it easier to keep children in school, such
as free lunch and financial help for transport, uniforms, supplies, etc. However, there are
no after school child care programs for children who are older than preschool age. This
can leave a big gap in the work day because many Costa Rican public schools have two
sessions per day, so that a given child will be in school only in the afternoon or morning,
and will require child care for the other half of the work day.
Our results suggest that Costa Rica should reduce legal barriers to women who would
like to work non-standard work hours. For example, current Costa Rican legislation
limits the ability of employers to employ women at night. This legislation may force
women interested in part-time or night work into the lower paying informal sector.
Lastly, our results suggest that the Costa Rican government enact policies to provide
single mothers with the skills and other resources necessary to find and keep well-paid
employment. Poor single female household heads have very low skills compared to other
Costa Rican workers. This suggests that programs designed to increase the skills of
single mothers could contribute to reducing poverty in Costa Rica. One such set of
policies would make it easier for women (particularly younger single mothers) to
complete more formal education. Another set of policies would provide training for adult
single mothers. Current non-targeted Costa Rican government training (capacitación)
programs include training programs run through the Nacional de Parendizajo (INA),
11
Instituto de Desarrollo Agrario (IDA) and Consejo Nacional de Producción (CNP). In
addition, the IMAS administers training programs targeted towards the poor (especially
female household heads). Our results suggest the government expand these programs
targeted towards providing training for poor women.
12
BIBLIOGRAPHY
Bubinic, Mayra and Geeta Rao Gupta (1997), "Female-Headed Households and Female-Maintained Families: Are They Worth Targeting to Reduce Poverty in Developing Countries," Economic Development and Cultural Change, Vol. 45, No. 2 (January), pages 259-280.
Card, David and W. Craig Riddell, 1993, "A Comparative Analysis of Unemployment in Canada and the United States," in Small Differences That Matter, edited by David Card and Richard Freeman, University of Chicago Press, pages 149-190.
Economic Commission for Latin America and the Caribbean (ECLAC), 2003, "Poverty and Inequality from a Gender Perspective," chapter 3 in the 2002-2003 Social Panorama of Latin America, Santiago, Chile, pages 133-170.
Economic Commission for Latin America and the Caribbean (ECLAC), 2004, "Family Structures, Household Work and Well-being in Latin America," chapter 4 in the 2003-2004 Social Panorama of Latin America, Santiago, Chile, pages 193-224.
Gindling, T.H. and Juan Diego Trejos, 2005, "Accounting for Changing Inequality in Costa Rica: 1980-99," Journal of Development Studies, Vol. 41, No. 5, (July 2005), pp. 898-926.
Medeiros, Marcelo and Joana Simoes Costa, 2005, "Poverty Among Women in Latin America: Feminization or Over-representation?" Proceedings of the 33rd Brazilian Economic Meetings and UNDP Poverty Center Working Paper, Brasilia.
Slon, Pablo and Edwin Zúniga, 2006, "Poverty Dynamics in Costa Rica with Panel Data from Cross-Sections," CEPAL Review, Vol. 89 (August), pages 165-178.
Trejos, Juan Diego, 2006, “Pobreza y protección social en Costa Rica,” Report to the World Bank, backgound paper for the Poverty Assessment of Costa Rica, San José, Costa Rica. Trejos, Juan Diego, 2000, La Mujer Microempresaria en Costa Rica: Anos 90,” International Labor Office, Central American Project to Aid Programs for Micro-enterprises and Costa Rican National Institute for Women, Working Paper No. 5, San Jose, Costa Rica, August.
13
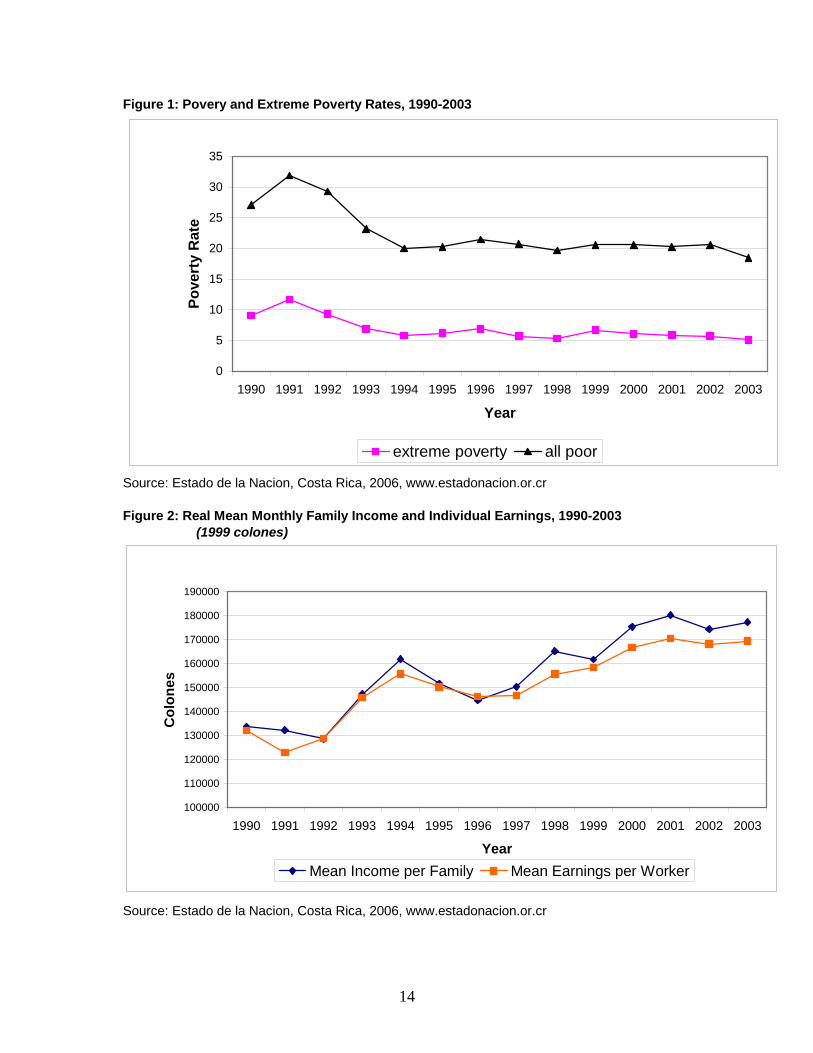
Figure 1: Povery and Extreme Poverty Rates, 1990-2003
Source: Estado de la Nacion, Costa Rica, 2006, www.estadonacion.or.cr
Figure 2: Real Mean Monthly Family Income and Individual Earnings, 1990-2003 (1999 colones)
Source: Estado de la Nacion, Costa Rica, 2006, www.estadonacion.or.cr
0
5
10
15
20
25
30
35
1990 1991 1992 1993 1994 1995 1996 1997 1998 1999 2000 2001 2002 2003
Year
Pove
rty
Rat
e
extreme poverty all poor
100000
110000
120000
130000
140000
150000
160000
170000
180000
190000
1990 1991 1992 1993 1994 1995 1996 1997 1998 1999 2000 2001 2002 2003
Year
Col
ones
Mean Income per Family Mean Earnings per Worker
14
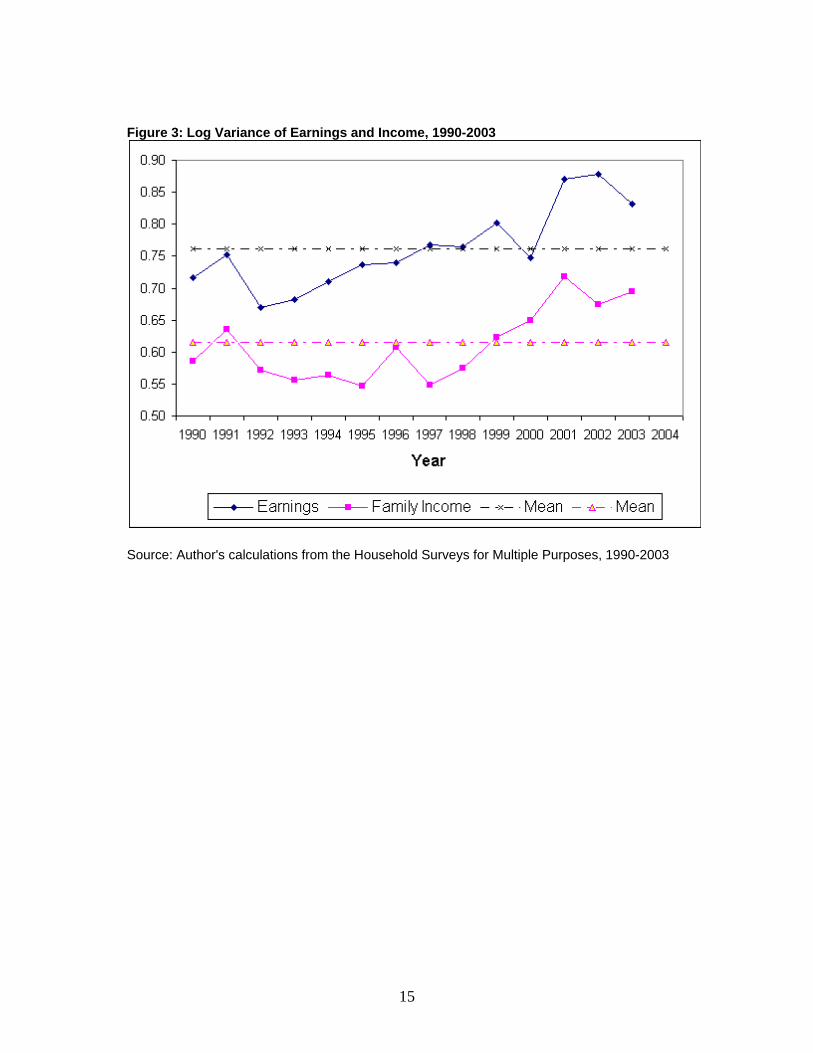
Figure 3: Log Variance of Earnings and Income, 1990-2003 Source: Author's calculations from the Household Surveys for Multiple Purposes, 1990-2003
15
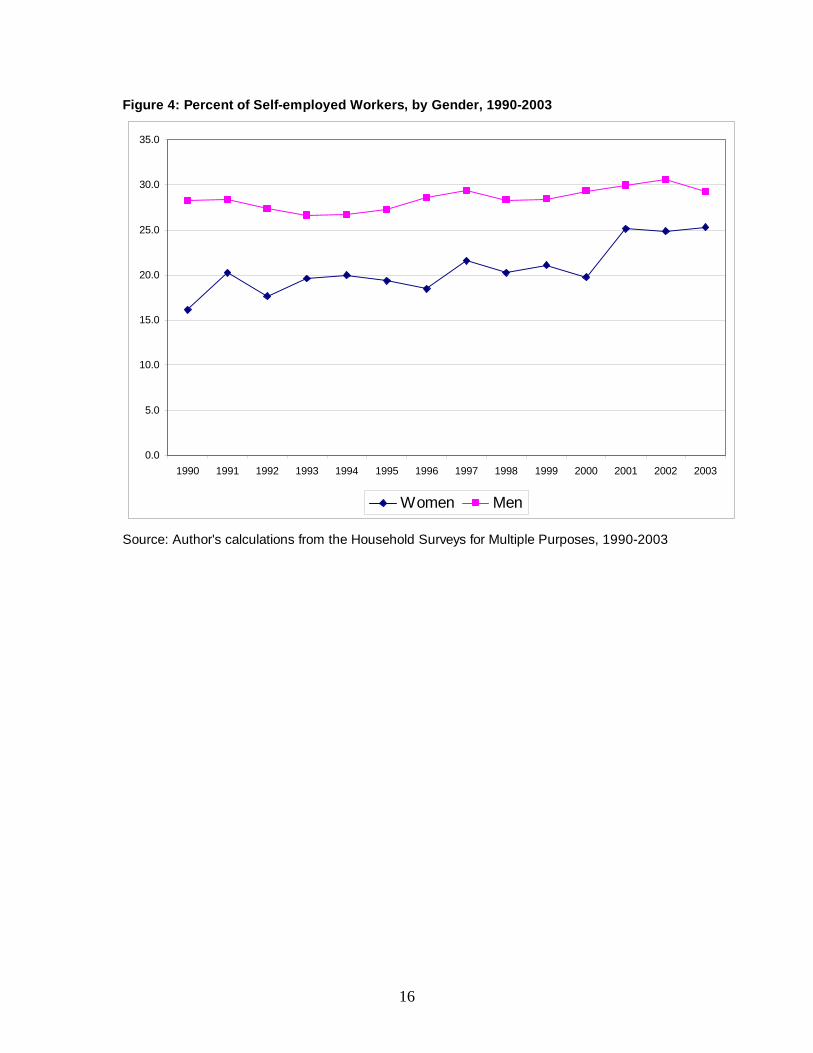
Figure 4: Percent of Self-employed Workers, by Gender, 1990-2003
Source: Author's calculations from the Household Surveys for Multiple Purposes, 1990-2003
0.0
5.0
10.0
15.0
20.0
25.0
30.0
35.0
1990 1991 1992 1993 1994 1995 1996 1997 1998 1999 2000 2001 2002 2003
Women Men
16
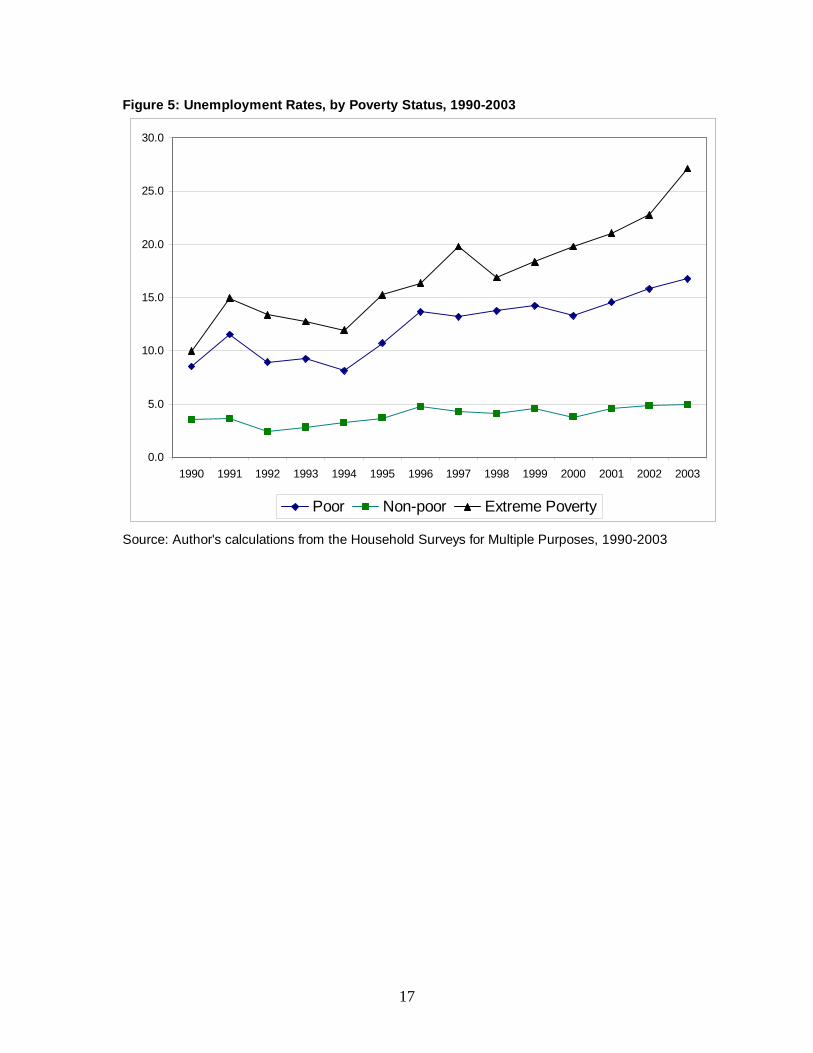
Figure 5: Unemployment Rates, by Poverty Status, 1990-2003
Source: Author's calculations from the Household Surveys for Multiple Purposes, 1990-2003
0.0
5.0
10.0
15.0
20.0
25.0
30.0
1990 1991 1992 1993 1994 1995 1996 1997 1998 1999 2000 2001 2002 2003
Poor Non-poor Extreme Poverty
17
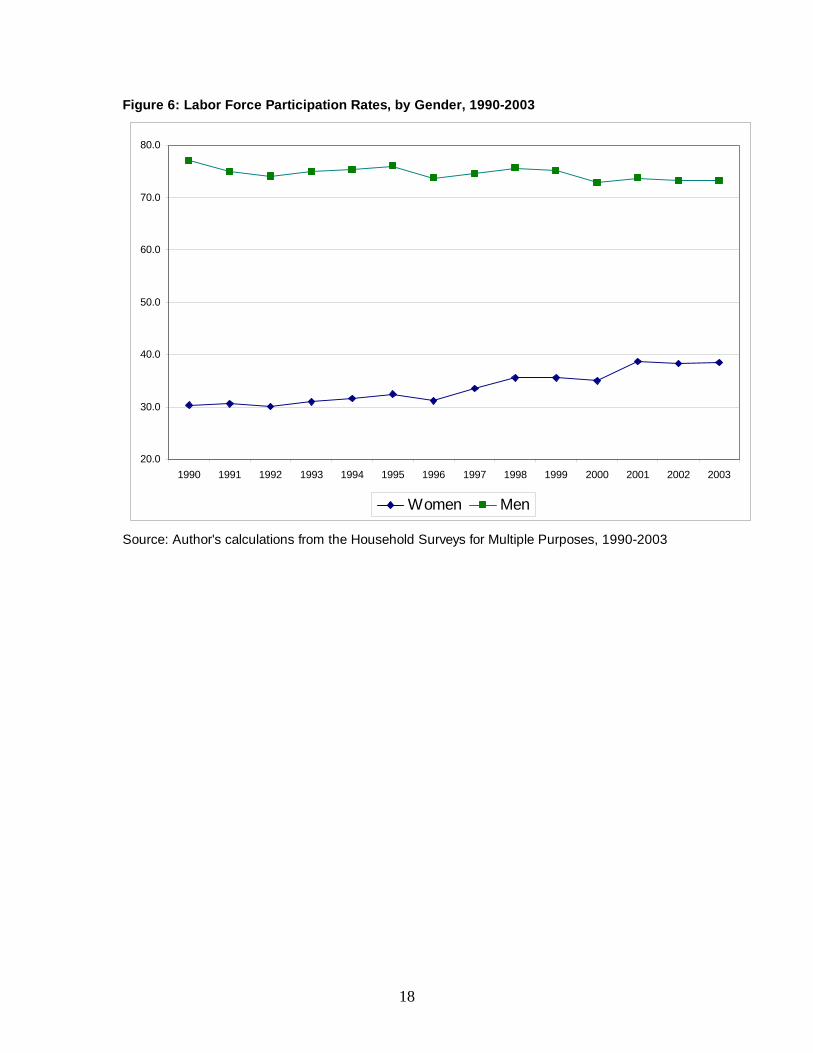
Figure 6: Labor Force Participation Rates, by Gender, 1990-2003
Source: Author's calculations from the Household Surveys for Multiple Purposes, 1990-2003
20.0
30.0
40.0
50.0
60.0
70.0
80.0
1990 1991 1992 1993 1994 1995 1996 1997 1998 1999 2000 2001 2002 2003
Women Men
18
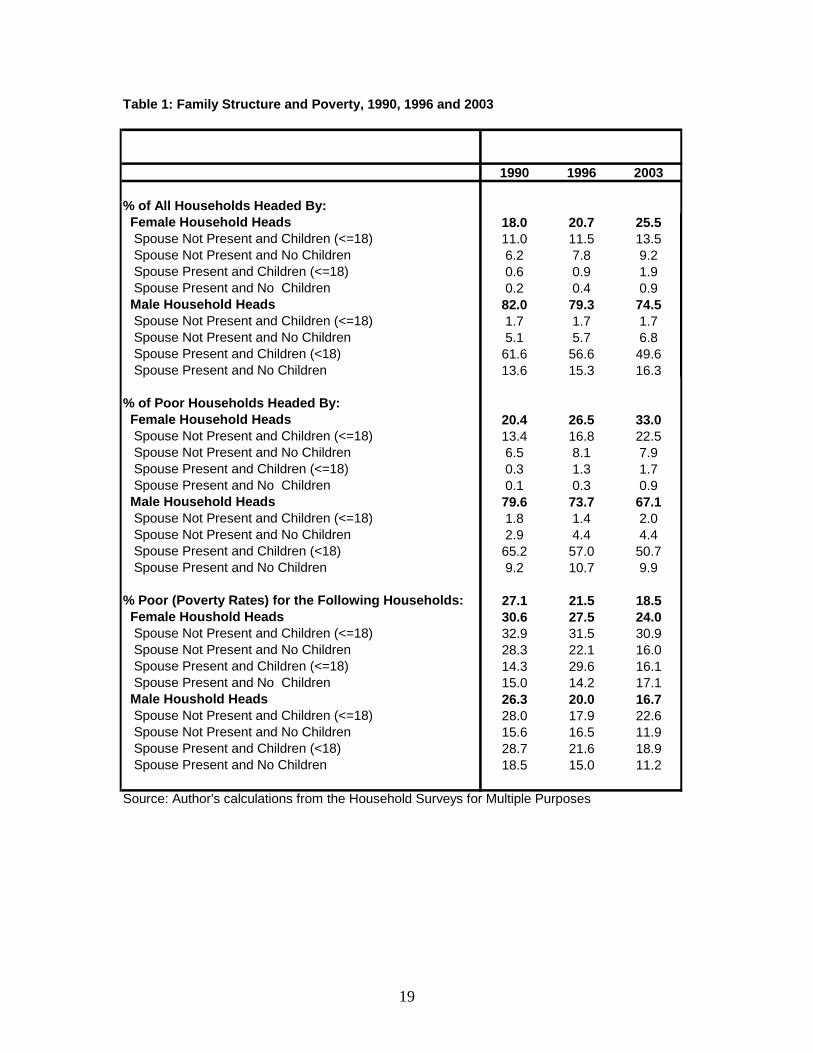
Table 1: Family Structure and Poverty, 1990, 1996 and 2003
1990 1996 2003
% of All Households Headed By: Female Household Heads 18.0 20.7 25.5 Spouse Not Present and Children (<=18) 11.0 11.5 13.5 Spouse Not Present and No Children 6.2 7.8 9.2 Spouse Present and Children (<=18) 0.6 0.9 1.9 Spouse Present and No Children 0.2 0.4 0.9 Male Household Heads 82.0 79.3 74.5 Spouse Not Present and Children (<=18) 1.7 1.7 1.7 Spouse Not Present and No Children 5.1 5.7 6.8 Spouse Present and Children (<18) 61.6 56.6 49.6 Spouse Present and No Children 13.6 15.3 16.3 % of Poor Households Headed By: Female Household Heads 20.4 26.5 33.0 Spouse Not Present and Children (<=18) 13.4 16.8 22.5 Spouse Not Present and No Children 6.5 8.1 7.9 Spouse Present and Children (<=18) 0.3 1.3 1.7 Spouse Present and No Children 0.1 0.3 0.9 Male Household Heads 79.6 73.7 67.1 Spouse Not Present and Children (<=18) 1.8 1.4 2.0 Spouse Not Present and No Children 2.9 4.4 4.4 Spouse Present and Children (<18) 65.2 57.0 50.7 Spouse Present and No Children 9.2 10.7 9.9
% Poor (Poverty Rates) for the Following Households: 27.1 21.5 18.5 Female Houshold Heads 30.6 27.5 24.0 Spouse Not Present and Children (<=18) 32.9 31.5 30.9 Spouse Not Present and No Children 28.3 22.1 16.0 Spouse Present and Children (<=18) 14.3 29.6 16.1 Spouse Present and No Children 15.0 14.2 17.1 Male Houshold Heads 26.3 20.0 16.7 Spouse Not Present and Children (<=18) 28.0 17.9 22.6 Spouse Not Present and No Children 15.6 16.5 11.9 Spouse Present and Children (<18) 28.7 21.6 18.9 Spouse Present and No Children 18.5 15.0 11.2
Source: Author's calculations from the Household Surveys for Multiple Purposes
19
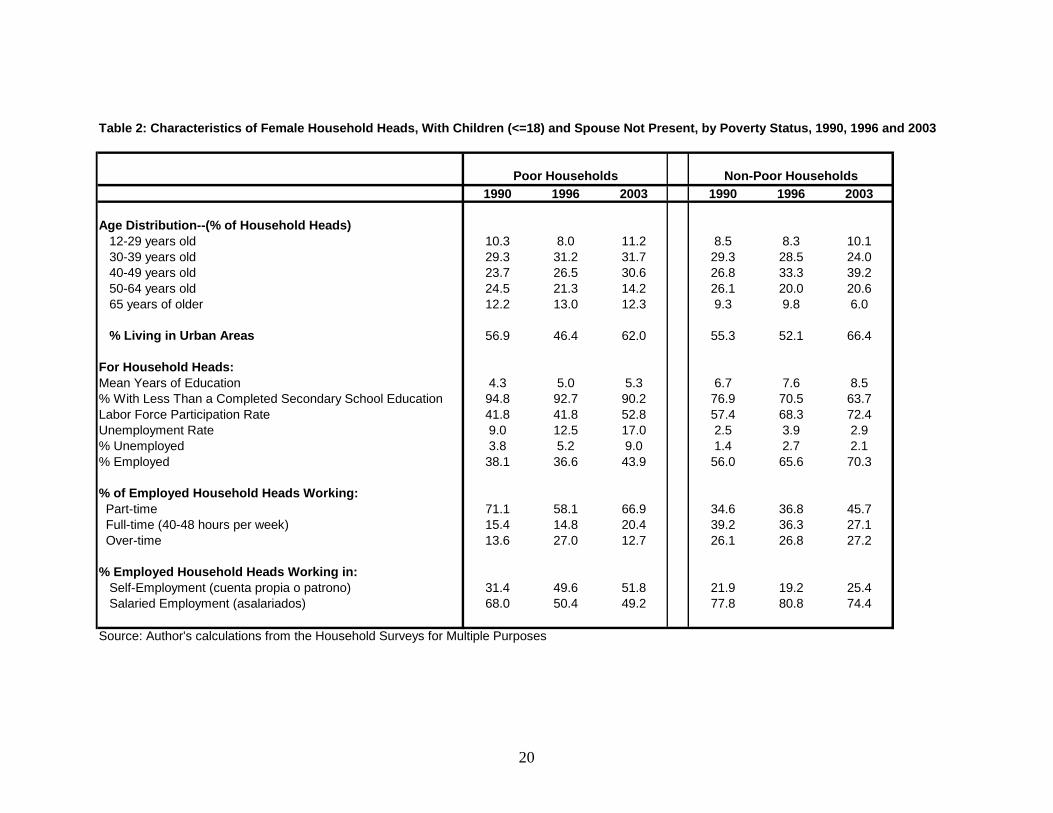
Table 2: Characteristics of Female Household Heads, With Children (<=18) and Spouse Not Present, by Poverty Status, 1990, 1996 and 2003
1990 1996 2003 1990 1996 2003
Age Distribution--(% of Household Heads)12-29 years old 10.3 8.0 11.2 8.5 8.3 10.130-39 years old 29.3 31.2 31.7 29.3 28.5 24.040-49 years old 23.7 26.5 30.6 26.8 33.3 39.250-64 years old 24.5 21.3 14.2 26.1 20.0 20.665 years of older 12.2 13.0 12.3 9.3 9.8 6.0
% Living in Urban Areas 56.9 46.4 62.0 55.3 52.1 66.4
For Household Heads:Mean Years of Education 4.3 5.0 5.3 6.7 7.6 8.5% With Less Than a Completed Secondary School Education 94.8 92.7 90.2 76.9 70.5 63.7Labor Force Participation Rate 41.8 41.8 52.8 57.4 68.3 72.4Unemployment Rate 9.0 12.5 17.0 2.5 3.9 2.9% Unemployed 3.8 5.2 9.0 1.4 2.7 2.1% Employed 38.1 36.6 43.9 56.0 65.6 70.3 % of Employed Household Heads Working: Part-time 71.1 58.1 66.9 34.6 36.8 45.7 Full-time (40-48 hours per week) 15.4 14.8 20.4 39.2 36.3 27.1 Over-time 13.6 27.0 12.7 26.1 26.8 27.2 % Employed Household Heads Working in: Self-Employment (cuenta propia o patrono) 31.4 49.6 51.8 21.9 19.2 25.4 Salaried Employment (asalariados) 68.0 50.4 49.2 77.8 80.8 74.4
Source: Author's calculations from the Household Surveys for Multiple Purposes
Non-Poor Households Poor Households
20
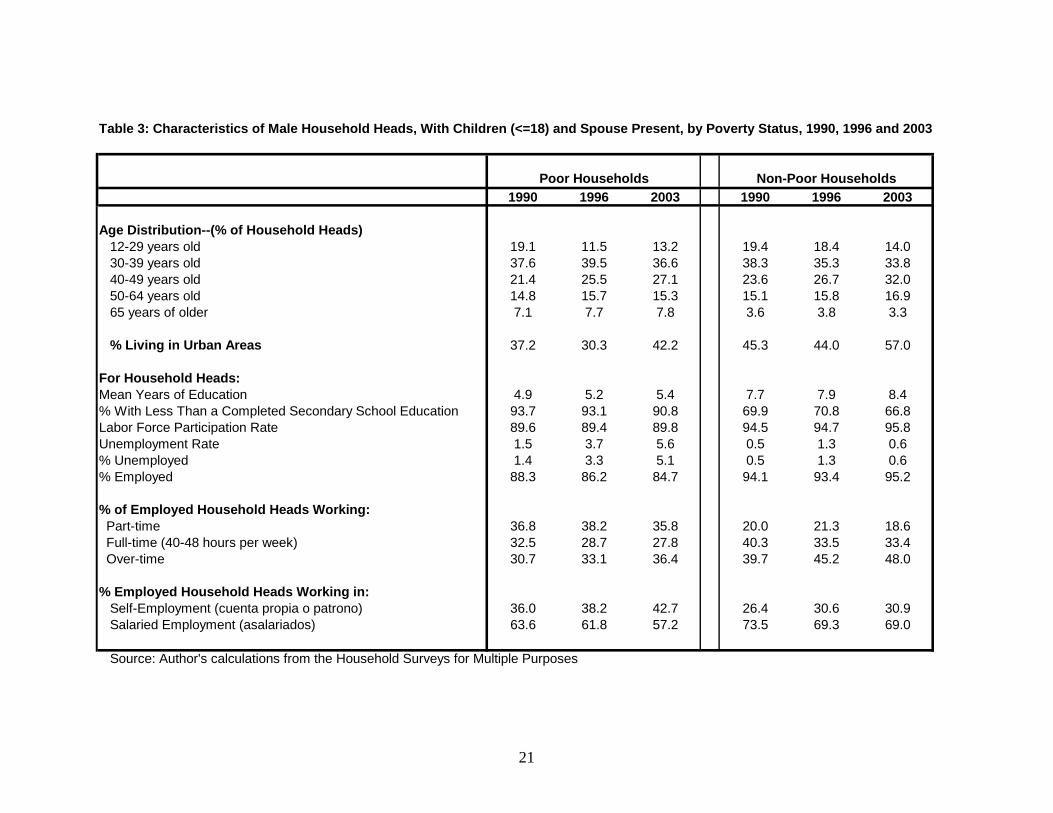
Table 3: Characteristics of Male Household Heads, With Children (<=18) and Spouse Present, by Poverty Status, 1990, 1996 and 2003
1990 1996 2003 1990 1996 2003
Age Distribution--(% of Household Heads)12-29 years old 19.1 11.5 13.2 19.4 18.4 14.030-39 years old 37.6 39.5 36.6 38.3 35.3 33.840-49 years old 21.4 25.5 27.1 23.6 26.7 32.050-64 years old 14.8 15.7 15.3 15.1 15.8 16.965 years of older 7.1 7.7 7.8 3.6 3.8 3.3
% Living in Urban Areas 37.2 30.3 42.2 45.3 44.0 57.0
For Household Heads:Mean Years of Education 4.9 5.2 5.4 7.7 7.9 8.4% With Less Than a Completed Secondary School Education 93.7 93.1 90.8 69.9 70.8 66.8Labor Force Participation Rate 89.6 89.4 89.8 94.5 94.7 95.8Unemployment Rate 1.5 3.7 5.6 0.5 1.3 0.6% Unemployed 1.4 3.3 5.1 0.5 1.3 0.6% Employed 88.3 86.2 84.7 94.1 93.4 95.2 % of Employed Household Heads Working: Part-time 36.8 38.2 35.8 20.0 21.3 18.6 Full-time (40-48 hours per week) 32.5 28.7 27.8 40.3 33.5 33.4 Over-time 30.7 33.1 36.4 39.7 45.2 48.0 % Employed Household Heads Working in: Self-Employment (cuenta propia o patrono) 36.0 38.2 42.7 26.4 30.6 30.9 Salaried Employment (asalariados) 63.6 61.8 57.2 73.5 69.3 69.0
Source: Author's calculations from the Household Surveys for Multiple Purposes
Non-Poor Households Poor Households
21
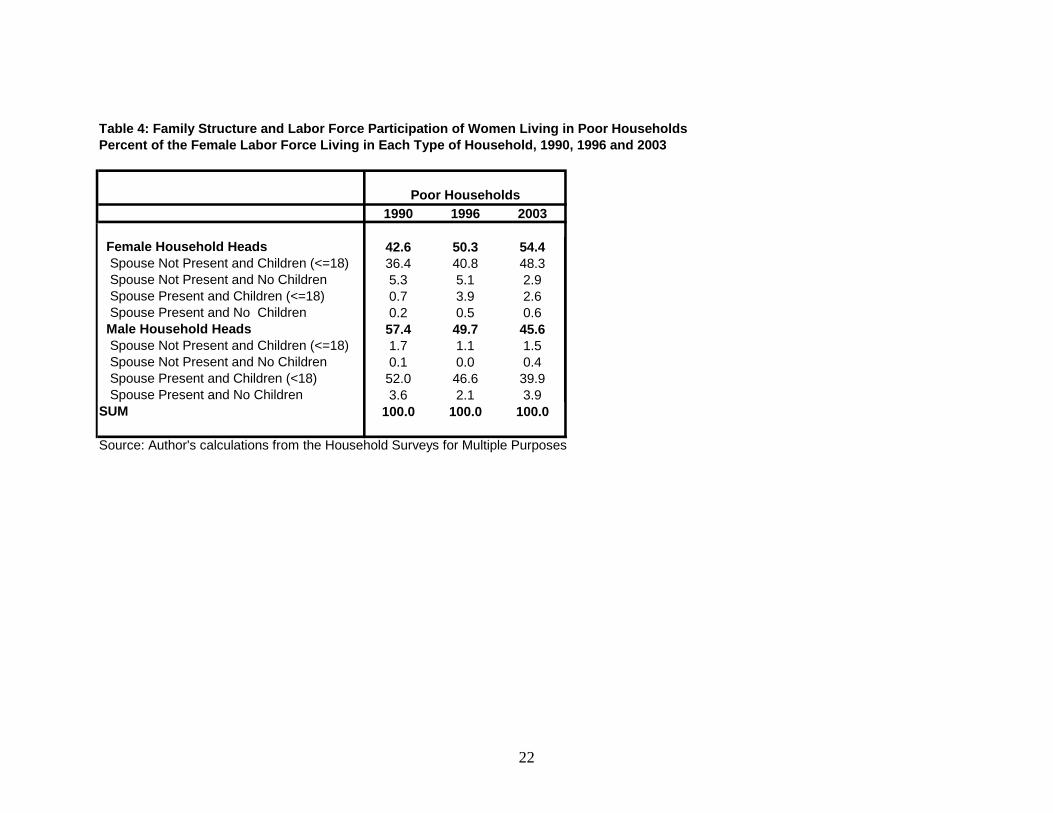
Table 4: Family Structure and Labor Force Participation of Women Living in Poor HouseholdsPercent of the Female Labor Force Living in Each Type of Household, 1990, 1996 and 2003
1990 1996 2003
Female Household Heads 42.6 50.3 54.4 Spouse Not Present and Children (<=18) 36.4 40.8 48.3 Spouse Not Present and No Children 5.3 5.1 2.9 Spouse Present and Children (<=18) 0.7 3.9 2.6 Spouse Present and No Children 0.2 0.5 0.6 Male Household Heads 57.4 49.7 45.6 Spouse Not Present and Children (<=18) 1.7 1.1 1.5 Spouse Not Present and No Children 0.1 0.0 0.4 Spouse Present and Children (<18) 52.0 46.6 39.9 Spouse Present and No Children 3.6 2.1 3.9SUM 100.0 100.0 100.0
Source: Author's calculations from the Household Surveys for Multiple Purposes
Poor Households
22