Embed Size (px)
Citation preview
Single-Image Super-Resolution: A Benchmark
Chih-Yuan Yang1, Chao Ma1,2, and Ming-Hsuan Yang1
1 University of California at Merced, USA2 Shanghai Jiao Tong University, China{cyang35,cma26,mhyang}@ucmerced.edu
Abstract. Single-image super-resolution is of great importance for vi-sion applications, and numerous algorithms have been proposed in recentyears. Despite the demonstrated success, these results are often gener-ated based on different assumptions using different datasets and met-rics. In this paper, we present a systematic benchmark evaluation forstate-of-the-art single-image super-resolution algorithms. In addition toquantitative evaluations based on conventional full-reference metrics, hu-man subject studies are carried out to evaluate image quality based onvisual perception. The benchmark evaluations demonstrate the perfor-mance and limitations of state-of-the-art algorithms which sheds lighton future research in single-image super-resolution.
Keywords: Single-image super-resolution, performance evaluation,metrics, Gaussian blur kernel width.
1 Introduction
The goal of single-image super-resolution (SISR) algorithms is to generate high-resolution (HR) images from a low-resolution (LR) image input. Numerous SISRalgorithms have been recently proposed with different assumptions and evalu-ation criteria. Broadly speaking, SISR algorithms can be categorized based ontheir tasks. While domain-specific SISR algorithms focus on specific classes of im-ages such as faces [35,42], scenes [33], and graphics artwork [18], generic SISR al-gorithms [10,38,8,3,27,30,11,46,9,34,32,12,5,39,44,43] are developed for all kindsof images where the priors are typically based on primitive image propertiessuch as edges and segments. In order to evaluate the performance of a SISR al-gorithm, human subject studies or ground truth images are used [33,43]. In thiswork, we focus on performance evaluation of state-of-the-art SISR algorithmsunder different settings based on a set of ground truth images.
Generic SISR algorithms in the literature are usually evaluated with differentimages and metrics with certain assumptions (e.g., scaling factor and Gaussiankernel width). In addition, the LR images may be generated from different pro-cesses (e.g., different downsampling processes). It is thus of great interest to sys-tematically and thoroughly evaluate state-of-the-art SISR algorithms within oneframework. For fair comparisons, the ground truth and LR test images shouldbe the same for all evaluated methods. Scaling factors and blur kernel width
D. Fleet et al. (Eds.): ECCV 2014, Part IV, LNCS 8692, pp. 372–386, 2014.c© Springer International Publishing Switzerland 2014
Single-Image Super-Resolution: A Benchmark 373
should be considered in performance evaluation. In addition, a wide range ofimages and metrics should be used for thorough examinations.
In this work, numerous state-of-the-art SISR methods are evaluated system-atically and thoroughly. Two large sets of images are used in the experiments.The Berkeley segmentation dataset [20] is widely used for low-level vision prob-lems, and the LIVE1 dataset [28] is commonly used for image quality assess-ment. We use a wide range of scaling factors and blur kernel width to examinethe performance of SISR methods under different assumptions. The HR imagesgenerated by SISR methods are evaluated by full-reference metrics and humanvisual perception. We present the evaluation results and show the limitationsof state-of-the-art methods. The findings from these large-scale experiments notonly confirm what is commonly believed but also suggest new research directionsfor SISR. In addition, a code library of state-of-the-art SISR algorithms is avail-able1 to the public for ease of reproducing experimental results and evaluatingnovel algorithms on a common platform.
2 Related Work
Generic SISR algorithms aim to generate high-quality HR images from a singleLR input image by exploiting certain image priors. According to the image priors,generic SISR algorithms can be categorized into several types of approaches.
Prediction Models. SISR algorithms in this category generate HR imagesfrom LR inputs through a predefined mathematical formula without trainingdata. Interpolation-based methods (bilinear, bicubic, and Lanczos) generate HRpixel intensities by weighted averaging neighboring LR pixel values. Since in-terpolated intensities are locally similar to neighboring pixels, these algorithmsgenerate good smooth regions but insufficient large gradients along edges andat high-frequency regions. The IP method [16] exploits a predefined downsam-pling model from a HR image to a LR image. Given an initial HR image, thismethod iteratively generates a LR image through the predefined downsamplingmodel and compensates the difference map in LR back to the HR image. Sincea generated HR image is designed to best match the LR input image under thelinear downsampling model, the contrast along edges is better enhanced thanthe results generated by bicubic interpolation.
Edge Based Methods. Edges are important primitive image structures thatplay a prime role in visual perception. Several SISR algorithms have been pro-posed to learn priors from edge features for reconstructing HR images. Variousedge features have been proposed such as the depth and width of an edge [8] orthe parameter of a gradient profile [30]. Since the priors are primarily learnedfrom edges, the reconstructed HR images have high-quality edges with propersharpness and limited artifacts. However, edge priors are less effective for mod-eling other high-frequency structures such as textures.
1 https://eng.ucmerced.edu/people/cyang35
374 C.-Y. Yang, C. Ma, and M.-H. Yang
Image Statistical Methods. Various image properties can be exploited aspriors to predict HR images from LR images. The heavy-tailed gradient distri-bution [15] is exploited in [27] for SISR. The sparsity property of large gradientsin generic images is exploited in [17] to reduce the computational load and in [41]to regularize the LR input images. Total variation has also been used as a reg-ularization term for generating HR images [1,48].
Patch Based Methods. Given a set of paired LR and HR training images,patches can be cropped from the training images to learn mapping functions. Theexemplar patches can be generated from external datasets [10,2], the input imageitself [11,9], or combined sources [44]. Various learning methods of the mappingfunctions have been proposed such as weighted average [31,2], kernel regres-sion [17], support vector regression [23], Gaussian process regression [13], sparsedictionary representation [46,7,5,24,45,39,47,19,14]. In addition to equally aver-aging overlapped patches, several methods for blending overlapped pixels havebeen proposed including weighted averaging [11,44], Markov Random Fields [10],and Conditional Random Fields [38].
3 Benchmark Settings
We use two sets of images as the ground truth to thoroughly evaluate the SISRalgorithms from diverse sources. From the ground truth HR images, we generateLR test images using various settings of scaling factor and blur kernel width. Wegenerate the SR images by the originally released code [27,17,46,5,43,36] or ourimplementation [16,30,11,9] if the code is not available. The generated SR imageare used to evaluate the performance of SISR algorithms and quality assessmentmetrics. In order to evaluate the performance of metrics, we conduct humansubject studies to generate perceptual scores of the SR images.
Test Image Sets. We use two image sets as the HR ground truth data forevaluation. The first set contains 200 images from the Berkeley segmentationdataset [20], which is widely used for SISR evaluations [11,9,32,12]. All imagesare of 321×481 pixels covering diverse contents acquired in a professional photo-graphic style. The second set contains 29 undistorted high-quality images fromthe LIVE1 dataset [28], which is widely used for image quality assessment [26].The resolution of these images ranges from 480× 720 to 512× 768 pixels.
Test Image Formation. There are several ways to generate LR test imagesfrom the ground truth images [27,30,36] such that the generated LR test imagesmay be numerically different. For clarity, we present an image formulation toaddress this problem. Given a ground truth HR image Ih, a scaling factor s, anda Gaussian blur kernel width σ, we generate a test LR image Il by
Il(xl, yl) =∑
x,y
w(x− xu, y − yu)Ih(x, y) + ε, (1)
where xl ∈ {1, . . . ,m} and yl ∈ {1, . . . , n} are indices of Il; x ∈ {1, . . . , s×m}and y ∈ {1, . . . , s×n} are indices of Ih; and ε denotes noise. The noise term
Single-Image Super-Resolution: A Benchmark 375
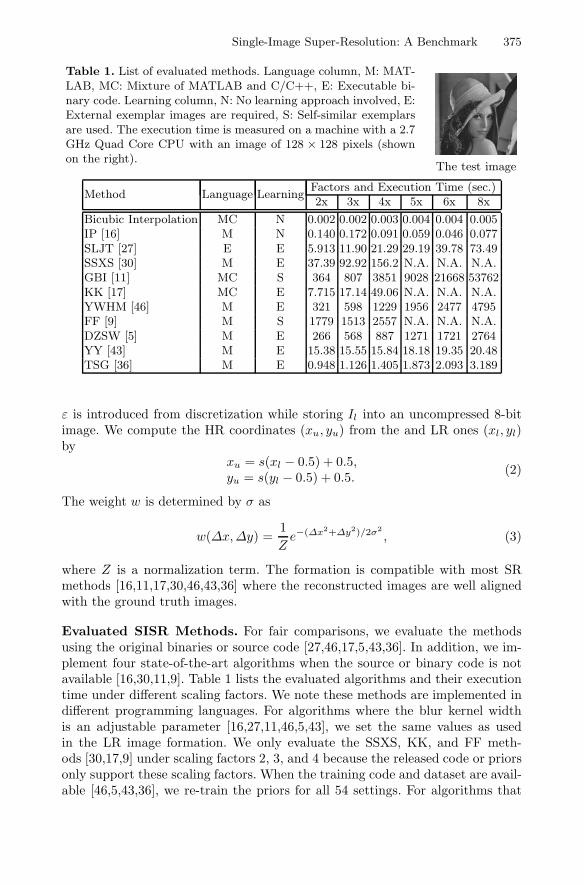
Table 1. List of evaluated methods. Language column, M: MAT-LAB, MC: Mixture of MATLAB and C/C++, E: Executable bi-nary code. Learning column, N: No learning approach involved, E:External exemplar images are required, S: Self-similar exemplarsare used. The execution time is measured on a machine with a 2.7GHz Quad Core CPU with an image of 128 × 128 pixels (shownon the right).
The test image
Method Language LearningFactors and Execution Time (sec.)2x 3x 4x 5x 6x 8x
Bicubic Interpolation MC N 0.002 0.002 0.003 0.004 0.004 0.005IP [16] M N 0.140 0.172 0.091 0.059 0.046 0.077SLJT [27] E E 5.913 11.90 21.29 29.19 39.78 73.49SSXS [30] M E 37.39 92.92 156.2 N.A. N.A. N.A.GBI [11] MC S 364 807 3851 9028 21668 53762KK [17] MC E 7.715 17.14 49.06 N.A. N.A. N.A.YWHM [46] M E 321 598 1229 1956 2477 4795FF [9] M S 1779 1513 2557 N.A. N.A. N.A.DZSW [5] M E 266 568 887 1271 1721 2764YY [43] M E 15.38 15.55 15.84 18.18 19.35 20.48TSG [36] M E 0.948 1.126 1.405 1.873 2.093 3.189
ε is introduced from discretization while storing Il into an uncompressed 8-bitimage. We compute the HR coordinates (xu, yu) from the and LR ones (xl, yl)by
xu = s(xl − 0.5) + 0.5,yu = s(yl − 0.5) + 0.5.
(2)
The weight w is determined by σ as
w(Δx,Δy) =1
Ze−(Δx2+Δy2)/2σ2
, (3)
where Z is a normalization term. The formation is compatible with most SRmethods [16,11,17,30,46,43,36] where the reconstructed images are well alignedwith the ground truth images.
Evaluated SISR Methods. For fair comparisons, we evaluate the methodsusing the original binaries or source code [27,46,17,5,43,36]. In addition, we im-plement four state-of-the-art algorithms when the source or binary code is notavailable [16,30,11,9]. Table 1 lists the evaluated algorithms and their executiontime under different scaling factors. We note these methods are implemented indifferent programming languages. For algorithms where the blur kernel widthis an adjustable parameter [16,27,11,46,5,43], we set the same values as usedin the LR image formation. We only evaluate the SSXS, KK, and FF meth-ods [30,17,9] under scaling factors 2, 3, and 4 because the released code or priorsonly support these scaling factors. When the training code and dataset are avail-able [46,5,43,36], we re-train the priors for all 54 settings. For algorithms that
376 C.-Y. Yang, C. Ma, and M.-H. Yang
require other parameter settings [27,30,46,5,9,43,36], the default values in thereleased code or manuscripts are used.
Human Subject Studies. We conduct human subject studies to evaluate theeffectiveness of existing metrics for performance evaluation of SR algorithms. Weselect 10 images from the BSD200 dataset [20] as the ground truth data. Theselected images cover a wide range of high-frequency levels in order to generatea representative subset of the entire BSD200 dataset. (See the supplementarymaterial for their high-frequency levels). From each ground truth image, 9 LRimages are generated using Eq. 1 under different settings (the scaling factorsof 2, 3, and 4, and the Gaussian kernel width of 0.4, 1.2, and 2.0). From eachLR image, we use 6 state-of-the-art methods to generate the SR images, and intotal we generate 540 SR images. We collect 16,200 perceptual scores from 30participants evaluating the 540 SR images without knowing the ground truthimages or the method names. The SR images are displayed in a random order toavoid bias to favor certain methods. Subjects are asked to give scores between 0to 10 to assess the image quality based on their visual perception.
4 Benchmark Evaluation Results
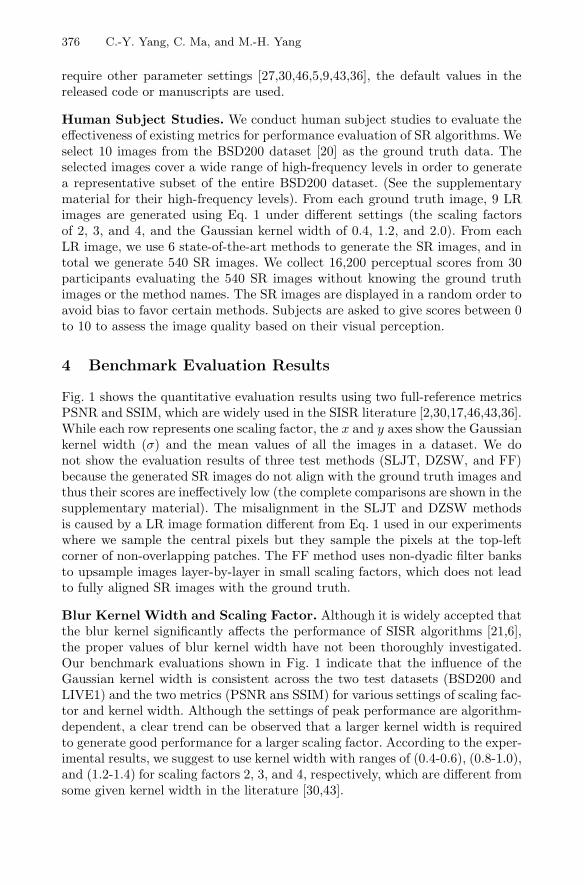
Fig. 1 shows the quantitative evaluation results using two full-reference metricsPSNR and SSIM, which are widely used in the SISR literature [2,30,17,46,43,36].While each row represents one scaling factor, the x and y axes show the Gaussiankernel width (σ) and the mean values of all the images in a dataset. We donot show the evaluation results of three test methods (SLJT, DZSW, and FF)because the generated SR images do not align with the ground truth images andthus their scores are ineffectively low (the complete comparisons are shown in thesupplementary material). The misalignment in the SLJT and DZSW methodsis caused by a LR image formation different from Eq. 1 used in our experimentswhere we sample the central pixels but they sample the pixels at the top-leftcorner of non-overlapping patches. The FF method uses non-dyadic filter banksto upsample images layer-by-layer in small scaling factors, which does not leadto fully aligned SR images with the ground truth.
Blur Kernel Width and Scaling Factor. Although it is widely accepted thatthe blur kernel significantly affects the performance of SISR algorithms [21,6],the proper values of blur kernel width have not been thoroughly investigated.Our benchmark evaluations shown in Fig. 1 indicate that the influence of theGaussian kernel width is consistent across the two test datasets (BSD200 andLIVE1) and the two metrics (PSNR ans SSIM) for various settings of scaling fac-tor and kernel width. Although the settings of peak performance are algorithm-dependent, a clear trend can be observed that a larger kernel width is requiredto generate good performance for a larger scaling factor. According to the exper-imental results, we suggest to use kernel width with ranges of (0.4-0.6), (0.8-1.0),and (1.2-1.4) for scaling factors 2, 3, and 4, respectively, which are different fromsome given kernel width in the literature [30,43].
Single-Image Super-Resolution: A Benchmark 377
PSNR SSIMBSD200 LIVE1 BSD200 LIVE1
Fig. 1. Performance evaluation. Eight SISR methods are evaluated using two imagesets (BSD200 and LIVE1) and two metrics (PSNR and SSIM) under six scaling factorsand nine values of Gaussian kernel width. From top to bottom, each row shows resultswith a scaling factor of 2, 3, 4, 5, 6, and 8. The plots show mean values for all SRimages of a dataset. The BSD200 dataset contains 200 images of 321× 481 pixels, andthe LIVE1 dataset contains 29 images ranging from 768× 512 to 480 × 720 pixels.
We explain these results by considering the LR image formation Eq. 1 whereσ determines the richness of information preserved in the LR images from theground truth images. If the value is too large, numerous ground truth pixels willbe assigned with similar weights in Eq. 1 and the generated LR image will beblurry, which means that little visual information is preserved for reconstructing
378 C.-Y. Yang, C. Ma, and M.-H. Yang
(a) ranked indices
(b) 1 / 37.56 (c) 2 / 34.84 (f) 197 / 20.20 (g) 198 / 19.88
(d) 3 / 33.78 (e) 4 / 33.45 (h) 199 / 19.60 (i) 200 / 18.83
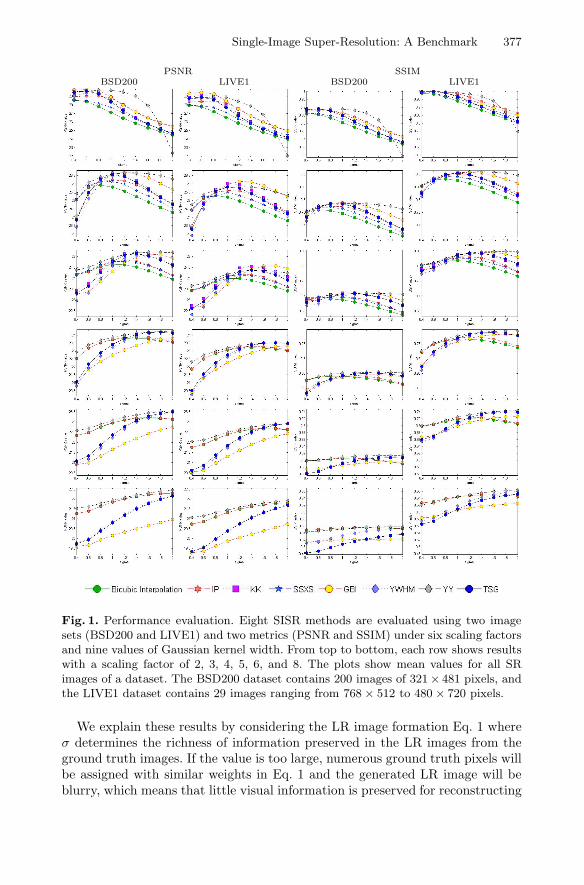
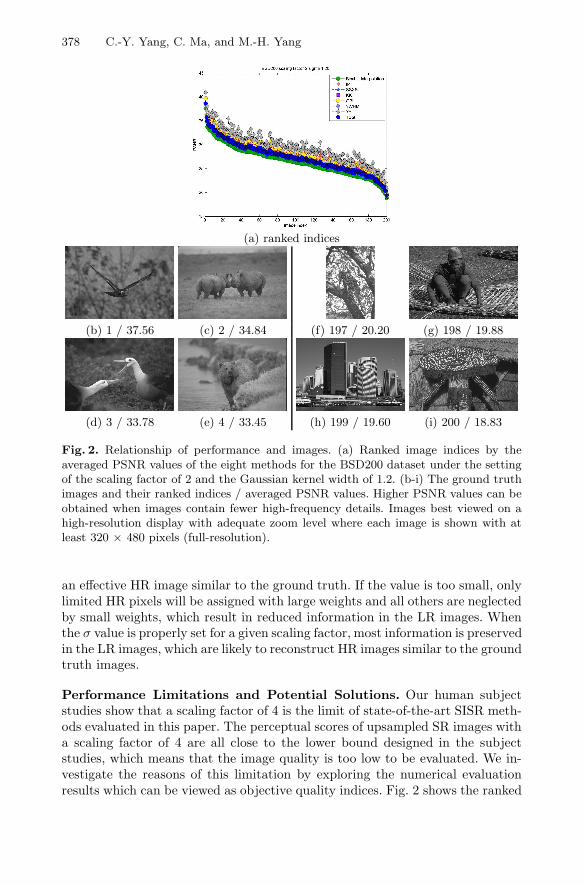
Fig. 2. Relationship of performance and images. (a) Ranked image indices by theaveraged PSNR values of the eight methods for the BSD200 dataset under the settingof the scaling factor of 2 and the Gaussian kernel width of 1.2. (b-i) The ground truthimages and their ranked indices / averaged PSNR values. Higher PSNR values can beobtained when images contain fewer high-frequency details. Images best viewed on ahigh-resolution display with adequate zoom level where each image is shown with atleast 320 × 480 pixels (full-resolution).
an effective HR image similar to the ground truth. If the value is too small, onlylimited HR pixels will be assigned with large weights and all others are neglectedby small weights, which result in reduced information in the LR images. Whenthe σ value is properly set for a given scaling factor, most information is preservedin the LR images, which are likely to reconstruct HR images similar to the groundtruth images.
Performance Limitations and Potential Solutions. Our human subjectstudies show that a scaling factor of 4 is the limit of state-of-the-art SISR meth-ods evaluated in this paper. The perceptual scores of upsampled SR images witha scaling factor of 4 are all close to the lower bound designed in the subjectstudies, which means that the image quality is too low to be evaluated. We in-vestigate the reasons of this limitation by exploring the numerical evaluationresults which can be viewed as objective quality indices. Fig. 2 shows the ranked
Single-Image Super-Resolution: A Benchmark 379
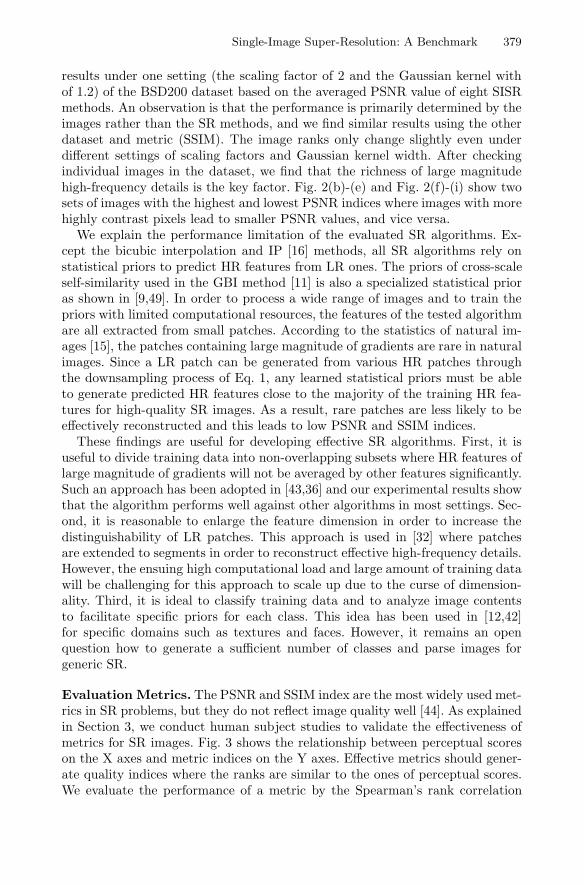
results under one setting (the scaling factor of 2 and the Gaussian kernel withof 1.2) of the BSD200 dataset based on the averaged PSNR value of eight SISRmethods. An observation is that the performance is primarily determined by theimages rather than the SR methods, and we find similar results using the otherdataset and metric (SSIM). The image ranks only change slightly even underdifferent settings of scaling factors and Gaussian kernel width. After checkingindividual images in the dataset, we find that the richness of large magnitudehigh-frequency details is the key factor. Fig. 2(b)-(e) and Fig. 2(f)-(i) show twosets of images with the highest and lowest PSNR indices where images with morehighly contrast pixels lead to smaller PSNR values, and vice versa.
We explain the performance limitation of the evaluated SR algorithms. Ex-cept the bicubic interpolation and IP [16] methods, all SR algorithms rely onstatistical priors to predict HR features from LR ones. The priors of cross-scaleself-similarity used in the GBI method [11] is also a specialized statistical prioras shown in [9,49]. In order to process a wide range of images and to train thepriors with limited computational resources, the features of the tested algorithmare all extracted from small patches. According to the statistics of natural im-ages [15], the patches containing large magnitude of gradients are rare in naturalimages. Since a LR patch can be generated from various HR patches throughthe downsampling process of Eq. 1, any learned statistical priors must be ableto generate predicted HR features close to the majority of the training HR fea-tures for high-quality SR images. As a result, rare patches are less likely to beeffectively reconstructed and this leads to low PSNR and SSIM indices.
These findings are useful for developing effective SR algorithms. First, it isuseful to divide training data into non-overlapping subsets where HR features oflarge magnitude of gradients will not be averaged by other features significantly.Such an approach has been adopted in [43,36] and our experimental results showthat the algorithm performs well against other algorithms in most settings. Sec-ond, it is reasonable to enlarge the feature dimension in order to increase thedistinguishability of LR patches. This approach is used in [32] where patchesare extended to segments in order to reconstruct effective high-frequency details.However, the ensuing high computational load and large amount of training datawill be challenging for this approach to scale up due to the curse of dimension-ality. Third, it is ideal to classify training data and to analyze image contentsto facilitate specific priors for each class. This idea has been used in [12,42]for specific domains such as textures and faces. However, it remains an openquestion how to generate a sufficient number of classes and parse images forgeneric SR.
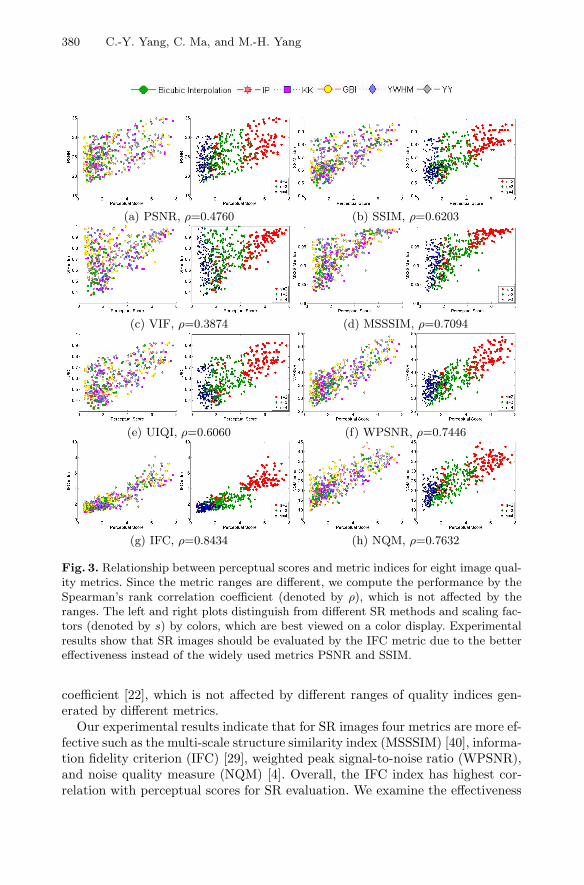
Evaluation Metrics. The PSNR and SSIM index are the most widely used met-rics in SR problems, but they do not reflect image quality well [44]. As explainedin Section 3, we conduct human subject studies to validate the effectiveness ofmetrics for SR images. Fig. 3 shows the relationship between perceptual scoreson the X axes and metric indices on the Y axes. Effective metrics should gener-ate quality indices where the ranks are similar to the ones of perceptual scores.We evaluate the performance of a metric by the Spearman’s rank correlation
380 C.-Y. Yang, C. Ma, and M.-H. Yang
(a) PSNR, ρ=0.4760 (b) SSIM, ρ=0.6203
(c) VIF, ρ=0.3874 (d) MSSSIM, ρ=0.7094
(e) UIQI, ρ=0.6060 (f) WPSNR, ρ=0.7446
(g) IFC, ρ=0.8434 (h) NQM, ρ=0.7632
Fig. 3. Relationship between perceptual scores and metric indices for eight image qual-ity metrics. Since the metric ranges are different, we compute the performance by theSpearman’s rank correlation coefficient (denoted by ρ), which is not affected by theranges. The left and right plots distinguish from different SR methods and scaling fac-tors (denoted by s) by colors, which are best viewed on a color display. Experimentalresults show that SR images should be evaluated by the IFC metric due to the bettereffectiveness instead of the widely used metrics PSNR and SSIM.
coefficient [22], which is not affected by different ranges of quality indices gen-erated by different metrics.
Our experimental results indicate that for SR images four metrics are more ef-fective such as the multi-scale structure similarity index (MSSSIM) [40], informa-tion fidelity criterion (IFC) [29], weighted peak signal-to-noise ratio (WPSNR),and noise quality measure (NQM) [4]. Overall, the IFC index has highest cor-relation with perceptual scores for SR evaluation. We examine the effectiveness
Single-Image Super-Resolution: A Benchmark 381
of the IFC metric for SR images by the extracted features and specialized ap-plication for natural images. First, the IFC metric is designed to evaluate theloss of image information so that it extracts wavelet features with focus on high-frequency details rather than low-frequency components. This metric matcheshuman perception well as visual perception is more sensitive to high-frequencydetails of SR images rather than low-frequency components. Second, the IFCmetric is developed based on natural scene statistics using the Gaussian scalemixtures [37] and the BSD200 dataset contains numerous such images.
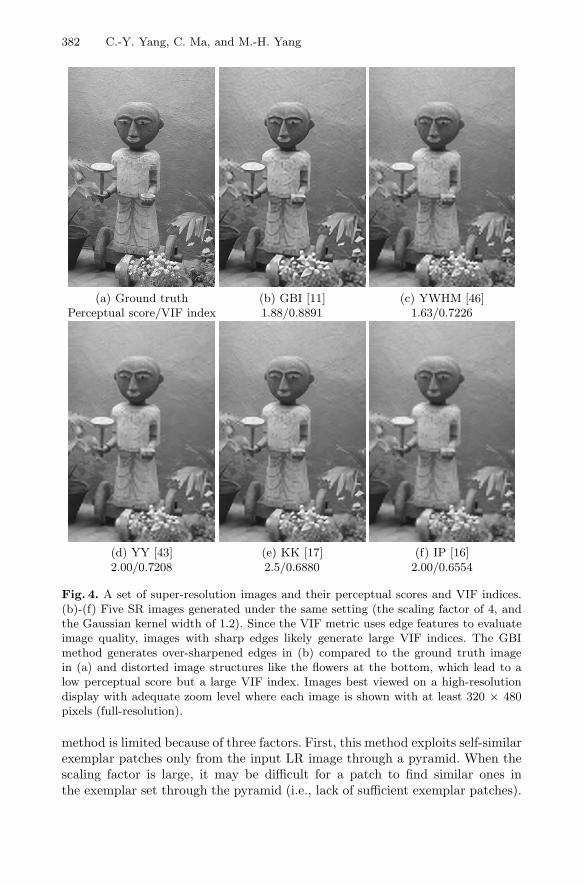
We note that the extracted features by the VIF method put more weight onedges which are of great importance for visual perception. As a result, SR imageswith sharp edges have large VIF values even though they are not visually pleas-ant. Fig. 3(c) shows that many points in the upper left region have low perceptualscores but high VIF indices, especially for images generated by the GBI method.We compare a set of the generated images in Fig. 4 where the one generated bythe GBI method contains apparently over-sharpened edges than other methods,which indicates the VIF metric is not effective for SR performance evaluation. Itis worth noticing that the weights computed in the WPSNR metric significantlyimprove the performance over the widely used PSNR metric (where the weightscan be viewed as the same). The weights of WPSNR in our experiments arecomputed by a function [25] that models contrast sensitivity of perception interms of spatial frequency. As a result, patches in a SR image carrying signalsn mid frequency ranges will be assigned with larger weights, and the smoothregions and complicated textures will have smaller weights. Thus the WPSNRmetric performs well with the assigned weights.
Evaluations of SISR Methods.As shown in Table 1, the bicubic interpolationand IP [16] methods perform well with low computational load. The IP methodalmost always outperforms the bicubic interpolation method in terms of visualquality by iteratively restoring high-frequency details based on a difference mapbetween the LR test image and a downsampled image of the estimated HR result.The restored high-frequency map enhances contrast of edges and textures, andmakes a SR image more similar to the ground truth image than the one generatedby bicubic interpolation. However, the IP method is limited by the accuracyof the restored high-frequency map. Since it is simply interpolated from a LRdifference map, the HR results are better when the compensated difference islimited with small scaling factor as shown in Fig. 1. The low computational loadof the back-projection method makes it widely used as a post-processing step torefine contrast in state-of-the-art SISR methods [11,46].
The GBI method [11] generates sharp contours as it uses a small scalingfactor (1.25) to upsample intermediate images in a pyramid. The exploited self-exemplar priors are effective for contour patches because the image structuresremain similar after being downsampled with a small scaling factor. Furthermore,it utilizes the back-projection compensation to enhance the contrast in every up-sampling iteration. Due to the generated sharp contours, the GBI method workswell for some settings such as scaling factor of 3 with σ greater than 0.6, and thescaling factor of 4 with σ greater than 1.4. However, the performance of the GBI
382 C.-Y. Yang, C. Ma, and M.-H. Yang
(a) Ground truth (b) GBI [11] (c) YWHM [46]Perceptual score/VIF index 1.88/0.8891 1.63/0.7226
(d) YY [43] (e) KK [17] (f) IP [16]2.00/0.7208 2.5/0.6880 2.00/0.6554
Fig. 4. A set of super-resolution images and their perceptual scores and VIF indices.(b)-(f) Five SR images generated under the same setting (the scaling factor of 4, andthe Gaussian kernel width of 1.2). Since the VIF metric uses edge features to evaluateimage quality, images with sharp edges likely generate large VIF indices. The GBImethod generates over-sharpened edges in (b) compared to the ground truth imagein (a) and distorted image structures like the flowers at the bottom, which lead to alow perceptual score but a large VIF index. Images best viewed on a high-resolutiondisplay with adequate zoom level where each image is shown with at least 320 × 480pixels (full-resolution).
method is limited because of three factors. First, this method exploits self-similarexemplar patches only from the input LR image through a pyramid. When thescaling factor is large, it may be difficult for a patch to find similar ones inthe exemplar set through the pyramid (i.e., lack of sufficient exemplar patches).
Single-Image Super-Resolution: A Benchmark 383
Second, the repeated usage of the back-projection results in over-contrasted con-tours. As shown in Fig. 4(b), the contours along the face and arms of the woodfigure are over-contrasted, and the image structures of the flowers at the bottomare distorted. Thus the performance of the GBI method decreases significantlywhen the scaling factor is greater than 4 (more details can be found in the sup-plementary material). Third, the method requires high computational load as aresult of searching for similar patches in a pyramid. As shown in Table 1, it isthe most computationally expensive method among all.
The YWHM, YY, and TSG methods [46,43,36] all upsample high-frequencycomponents (pixel gradients or patch difference) from LR to HR through learnedmapping functions, and the main difference is about learning approaches. Whilethe YWHM and TSG methods learn a pair of sparse dictionaries, the YY methodtrains numerous simple linear functions. The difference between the YWHM andTSG methods is usage of the dictionaries. Indeed the YWHM method uses thedictionaries to generate sparse coefficients while the TSG method uses the dic-tionaries as sets of anchor points in LR/HR feature spaces, which is more similarto the YY method in this manner. Since the computational load of generatingsparse coefficients is skipped, the TSG method gains significant advantages onexecution time over the YWHM method as shown in Table 1 while their perfor-mance is similar as shown in Fig. 1.
We discuss the difference of the YY and TSG methods since both partitionthe LR feature space into numerous subspaces in order to map LR featuresto HR space by individual linear functions. The most significant difference liesin anchor points used to partition the LR feature space where they are evenlyscattered in the YY method due to the L2-norm distance but restricted in aunit sphere in the TSG method because they are all bases of a sparse dictionary.The difference of anchor points lead to the differences of computational loadand performance. The unit-length anchor points used in the TSG method haveadvantages on computation in which the cost of finding anchor points is lower ashighest correlation can be easily computed by inner product. However, this stepin the YY method is computed by L2-norm distances which is computationallymore expensive. On the contrary, the evenly scattered anchor points used in theYY method lead to better performance for most settings as shown in Fig. 1because the regression functions can be learned more directly and effectively.As features extracted from training images are directly grouped by the evenlyscattered anchor points, the source patches are visually similar which in turnfacilitates learning better regression functions.
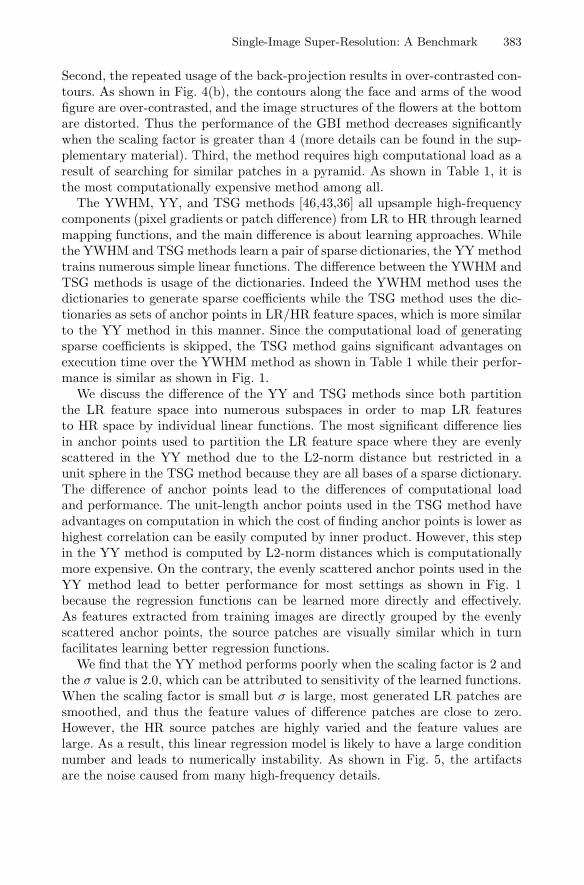
We find that the YY method performs poorly when the scaling factor is 2 andthe σ value is 2.0, which can be attributed to sensitivity of the learned functions.When the scaling factor is small but σ is large, most generated LR patches aresmoothed, and thus the feature values of difference patches are close to zero.However, the HR source patches are highly varied and the feature values arelarge. As a result, this linear regression model is likely to have a large conditionnumber and leads to numerically instability. As shown in Fig. 5, the artifactsare the noise caused from many high-frequency details.
384 C.-Y. Yang, C. Ma, and M.-H. Yang
(a) σ=1.6 (b) σ=1.8 (c) σ=2.0
Fig. 5. A set of super-resolution images to show the sensitivity of learned regressionfunctions in the YY method [43]. (a)-(c) The ground truth image and scaling factor of2 are the same while the only difference is the parameter of Gaussian kernel width (σ)used in the low-resolution image formation Eq. 1. The artifacts caused by sensitivity oflinear regression can be found along contours. Images best viewed on a high-resolutiondisplay with adequate zoom level where each image is shown with at least 320 × 480pixels (full-resolution).
5 Conclusion
In this paper, several state-of-the-art SISR methods are thoroughly studied.Hundreds of images are evaluated using various scaling factors and Gaussiankernel width values. Comprehensive experimental results show how state-of-the-art SISR methods perform with respect to scaling factor, Gaussian kernel andimage contents. The benchmark evaluations demonstrate the performance andlimitations of state-of-the-art algorithms quantitatively and qualitatively. Thedeveloped code library of state-of-the-art SISR algorithms provides a commonplatform for ease of reproducing experimental results and evaluating novel algo-rithms for future research.
Acknowledgment. This work is supported in part by the NSF CAREERGrant#1149783 and NSF IIS Grant #1152576. C. Ma is sponsored by CSC fellowship.
References
1. Aly, H.A., Dubois, E.: Image up-sampling using total-variation regularization witha new observation model. TIP 14(10), 1647–1659 (2005)
2. Chang, H., Yeung, D.Y., Xiong, Y.: Super-resolution through neighbor embedding.In: CVPR (2004)
Single-Image Super-Resolution: A Benchmark 385
3. Dai, S., Han, M., Xu, W., Wu, Y., Gong, Y.: Soft edge smoothness prior for alphachannel super resolution. In: CVPR (2007)
4. Damera-Venkata, N., Kite, T.D., Geisler, W.S., Evans, B.L., Bovik, A.C.: Imagequality assessment based on a degradation model. TIP 9(4), 636–650 (2000)
5. Dong, W., Zhang, L., Shi, G., Wu, X.: Image deblurring and super-resolution byadaptive sparse domain selection and adaptive regularization. TIP 20(7), 1838–1857 (2011)
6. Efrat, N., Glasner, D., Apartsin, A., Nadler, B., Levin, A.: Accurate blur modelsvs. image priors in single image super-resolution. In: ICCV (2013)
7. Elad, M., Zeyde, R., Protter, M.: Single image super-resolution using sparse rep-resentation. In: SIAM Imaging Science (2010)
8. Fattal, R.: Image upsampling via imposed edge statistics. In: SIGGRAPH (2007)9. Freedman, G., Fattal, R.: Image and video upscaling from local self-examples.
TOG 30(2), 1–11 (2011)10. Freeman, W.T., Jones, T.R., Pasztor, E.C.: Example-based super-resolution. IEEE
Computer Graphics and Applications, pp. 56–65 (March/April 2002)11. Glasner, D., Bagon, S., Irani, M.: Super-resolution from a single image. In: ICCV
(2009)12. HaCohen, Y., Fattal, R., Lischinski, D.: Image upsampling via texture hallucina-
tion. In: ICCP (2010)13. He, H., Siu, W.C.: Single image super-resolution using Gaussian process regression.
In: CVPR (2011)14. He, L., Qi, H., Zaretzki, R.: Beta process joint dictionary learning for coupled
feature spaces with application to single image super-resolution. In: CVPR (2013)15. Huang, J., Mumford, D.: Statistics of natural images and models. In: CVPR (1999)16. Irani, M., Peleg, S.: Improving resolution by image registration. CGVIP 53(3),
231–239 (1991)17. Kim, K.I., Kwon, Y.: Single-image super-resolution using sparse regression and
natural image prior. PAMI 32(6), 1127–1133 (2010)18. Kopf, J., Lischinski, D.: Depixelizing pixel art. In: SIGGRAPH (2011)19. Lu, X., Yuan, H., Yan, P., Yuan, Y., Li, X.: Geometry constrained sparse coding
for single image super-resolution. In: CVPR (2012)20. Martin, D., Fowlkes, C., Tal, D., Malik, J.: A database of human segmented natural
images and its application to evaluating segmentation algorithms and measuringecological statistics. In: ICCV (2001)
21. Michaeli, T., Irani, M.: Nonparametric blind super-resolution. In: ICCV (2013)22. Moore, D., McCabe, G.P., Craig, B.: Introduction to the Practice of Statistics, 7th
edn. W.H. Freeman (2005)23. Ni, K., Nguyen, T.: Image superresolution using support vector regression.
TIP 16(6), 1596–1610 (2007)24. Purkait, P., Chanda, B.: Image upscaling using multiple dictionaries of natural
image patches. In: Lee, K.M., Matsushita, Y., Rehg, J.M., Hu, Z. (eds.) ACCV2012, Part III. LNCS, vol. 7726, pp. 284–295. Springer, Heidelberg (2013)
25. Robson, J.G.: Spatial and temporal contrast-sensitivity functions of the visual sys-tem. Journal of the Optical Society of America (1966)
26. Saad, M.A., Bovik, A.C., Charrier, C.: Blind image quality assessment: A naturalscene statistics approach in the DCT domain. TIP 21(8), 3339–3352 (2012)
27. Shan, Q., Li, Z., Jia, J., Tang, C.K.: Fast image/video upsampling. In: SIGGRAPHAsia (2008)
28. Sheikh, H.R., Sabir, M.F., Bovik, A.C.: A statistical evaluation of recent full ref-erence image quality assessment algorithms. TIP 15(11), 3340–3451 (2006)
386 C.-Y. Yang, C. Ma, and M.-H. Yang
29. Sheikh, H.R., Bovik, A.C., de Veciana, G.: An information fidelity criterion forimage quality assessment using natural scene statistics. TIP 14(12), 2117–2128(2005)
30. Sun, J., Sun, J., Xu, Z., Shum, H.Y.: Image super-resolution using gradient profileprior. In: CVPR (2008)
31. Sun, J., Zheng, N.N., Tao, H., Shum, H.Y.: Image hallucination with primal sketchpriors. In: CVPR (2003)
32. Sun, J., Zhu, J., Tappen, M.F.: Context-constrained hallucination for image super-resolution. In: CVPR (2010)
33. Sun, L., Hays, J.: Super-resolution from internet-scale scene matching. In: ICCP(2012)
34. Tai, Y.W., Liu, S., Brown, M.S., Lin, S.: Super resolution using edge prior andsingle image detail synthesis. In: CVPR (2010)
35. Tappen, M.F., Liu, C.: A Bayesian approach to alignment-based image halluci-nation. In: Fitzgibbon, A., Lazebnik, S., Perona, P., Sato, Y., Schmid, C. (eds.)ECCV 2012, Part VII. LNCS, vol. 7578, pp. 236–249. Springer, Heidelberg (2012)
36. Timofte, R., Smet, V.D., Gool, L.V.: Anchored neighborhood regression for fastexample-based super-resolution. In: ICCV (2012)
37. Wainwright, M.J., Simoncelli, E.P., Willsky, A.S.: Random cascades on wavelettrees and their use in analyzing and modeling natural images. Applied and Com-putational Harmonic Analysis 11, 89–123 (2001)
38. Wang, Q., Tang, X., Shum, H.: Patch based blind image super resolution. In: ICCV(2005)
39. Wang, S., Zhang, L., Liang, Y., Pan, Q.: Semi-coupled dictionary learning with ap-plications to image super-resolution and photo-sketch synthesis. In: CVPR (2012)
40. Wang, Z., Simoncelli, E., Bovik, A.C.: Multi-scale structural similarity for imagequality assessment. In: IEEE Conference Record of the Thirty-Seventh AsilomarConference on Signals, Systems, and Computers (2003)
41. Xiong, X., Sun, X., Wu, F.: Robust web image/video super-resolution. TIP 19(8),2017–2028 (2010)
42. Yang, C.Y., Liu, S., Yang, M.H.: Structured face hallucination. In: CVPR (2013)43. Yang, C.Y., Yang, M.H.: Fast direct super-resolution by simple functions. In: ICCV
(2013)44. Yang, J., Lin, Z., Cohen, S.: Fast image super-resolution based on in-place example
regression. In: CVPR (2013)45. Yang, J., Wang, Z., Lin, Z., Shu, X., Huang, T.: Bilevel sparse coding for coupled
feature spaces. In: CVPR (2012)46. Yang, J., Wright, J., Huang, T., Ma, Y.: Image super-resolution via sparse repre-
sentation. TIP (2010)47. Yang, S., Wang, M., Chen, Y., Sun, Y.: Single-image super-resolution reconstruc-
tion via learned geometric dictionaries and clustered sparse coding. TIP 21(9),4016–4028 (2012)
48. Zhang, H., Yang, J., Zhang, Y., Huang, T.S.: Non-local kernel regression for imageand video restoration. In: Daniilidis, K., Maragos, P., Paragios, N. (eds.) ECCV2010, Part III. LNCS, vol. 6313, pp. 566–579. Springer, Heidelberg (2010)
49. Zontak, M., Irani, M.: Internal statistics of a single natural image. In: CVPR (2011)