Embed Size (px)
Citation preview
Journal of Experimental Botany, Vol. 71, No. 19 pp. 5911–5923, 2020doi:10.1093/jxb/eraa338 Advance Access Publication 3 August 2020
© The Author(s) 2020. Published by Oxford University Press on behalf of the Society for Experimental Biology. All rights reserved. For permissions, please email: [email protected]
RESEARCH PAPER
SINGLE FLOWER TRUSS and SELF-PRUNING signal developmental and metabolic networks to guide cotton architectures
Roisin C. McGarry1,*,†, , Xiaolan Rao1,2,†, , Qiang Li3,‡, Esther van der Knaap3 and Brian G. Ayre1,
1 BioDiscovery Institute, Department of Biological Sciences, University of North Texas, Denton, TX 76203-5017, USA2 College of Life Sciences, Hubei University, Wuhan, 430062, China3 Center for Applied Genetic Technologies, College of Agricultural and Environmental Sciences, University of Georgia, Athens, GA 30602, USA
‡Present address: College of Horticultural Science and Engineering, Shandong Agricultural University, Tai’an, China.†These authors contributed equally to this work.*Correspondence: [email protected]
Received 14 July 2020; Editorial decision 9 July 2020; Accepted 14 July 2020
Editor: Robert Sharwood, Australian National University, Australia
Abstract
Patterns of indeterminate and determinate growth specify plant architecture and influence crop productivity. In cotton (Gossypium hirsutum), SINGLE FLOWER TRUSS (SFT) stimulates the transition to flowering and determinate growth, while its closely related antagonist SELF-PRUNING (SP) maintains meristems in indeterminate states to favor vegetative growth. Overexpressing GhSFT while simultaneously silencing GhSP produces highly determinate cotton with reduced foliage and synchronous fruiting. These findings suggest that GhSFT, GhSP, and genes in these signaling networks hold promise for enhancing ‘annualized’ growth patterns and improving cotton product-ivity and management. To identify the molecular programs underlying cotton growth habits, we used comparative co-expression networks, differential gene expression, and phenotypic analyses in cotton varieties expressing altered levels of GhSFT or GhSP. Using multiple cotton and tomato datasets, we identified diverse genetic mod-ules highly correlated with SFT or SP orthologs which shared related Gene Ontologies in different crop species. Notably, altering GhSFT or GhSP levels in cotton affected the expression of genes regulating meristem fate and metabolic pathways. Further phenotypic analyses of gene products involved in photosynthesis, secondary metab-olism, and cell wall biosynthesis showed that early changes in GhSFT and GhSP levels profoundly impacted later development in distal tissues. Identifying the molecular underpinnings of GhSFT and GhSP activities emphasizes their broad actions in regulating cotton architecture.
Keywords: Cotton, determinate, indeterminate, RNA-Seq, SELF-PRUNING, SINGLE FLOWER TRUSS, transcriptomes, WGCNA.
Dow
nloaded from https://academ
ic.oup.com/jxb/article/71/19/5911/5879959 by U
niversity of Georgia user on 28 M
ay 2021
5912 | McGarry et al.
Introduction
Enhancing determinate crop architectures is desirable in agri-culture: the domestication of many species led to shorter varieties with favorable flowering times and increased yields (Blackman et al., 2010; Liu et al., 2010; Pin et al., 2010). The tomato (Solanum lycopersicum) SELF-PRUNING (SP) gene is a classic example of an architecture gene that revolutionized commercial crop production. Although appearing as a linear axis of growth, the wild tomato vine is a series of determinate, sympodial shoots of alternating vegetative and reproductive growth (Lifschitz et al., 2006; Shalit et al., 2009). Loss-of-function mutations in SP cause accelerated termination of sympodial units, resulting in more determinate, shorter tomato plants with more synchronous flowering and fruit ripening (Lifschitz et al., 2006; Shalit et al., 2009). These attributes were a boon for mechanical harvesting, and the sp mutation was introduced into commercial tomato cultivars (Yeager, 1927; Rick, 1978).
The Arabidopsis SP homolog, TERMINAL FLOWER 1 (TFL1), similarly controls developmental transitions (Ratcliffe et al., 1998; Hanzawa et al., 2005; Baumann et al., 2015). Loss-of-function Attfl1 mutants flower early and pro-duce a terminal flower in long-day photoperiods (Shannon and Meeks-Wagner 1991), whereas ectopic AtTFL1 ex-pression extends vegetative and reproductive phases and in-hibits the formation of floral meristems (Ratcliffe et al., 1998; Hanzawa et al., 2005; Baumann et al., 2015). TFL1 belong to the CENTRORADIALIS/TERMINAL FLOWER 1/SELF-PRUNING (CETS) gene family. FLOWERING LOCUS T (FT), encoding the long-distance flowering signal florigen, is a CETS protein with function antagonistic to TFL1 (Hanzawa et al., 2005; Ahn et al., 2006; Jaeger and Wigge, 2007; Ho and Weigel, 2014; Wang et al., 2015). In long-day conditions, AtFT is expressed in the companion cells of the leaf phloem, and the protein moves through the vasculature to meristems. AtFT and AtTFL1 bind the meristem-localized transcription factor FD to activate or repress, respectively, expression of floral meristem identity genes (Abe et al., 2005; Wigge et al., 2005; Hanano and Goto, 2011; Taoka et al., 2011). Consequently, the balance of TFL1 and FT expression directly regulates the balance of vegetative to reproductive growth.
In addition to controlling the transition to reproductive growth, CETS genes influence other aspects of development. For example, AtFT interacts with BRANCHED1 (BRC1) to control branching from axillary buds (Aguilar-Martínez et al., 2007; Niwa et al., 2013; Ho and Weigel, 2014). BRC1 encodes a TCP transcription factor, and down-regulation in axillary buds is important for branch outgrowth (Aguilar-Martínez et al., 2007). Binding of BRC1 to FT prevents the premature transition to flowering in the axils (Niwa et al., 2013). The Slsp mutation alters polar auxin transport and auxin responses in tomato (Pnueli et al., 2001; Silva et al., 2018), specifically af-fecting AUX/IAA and ARF transcript abundance at sympodial meristems (Silva et al., 2018). This suggests that SP influences tomato growth patterns by mediating auxin responses. Thus, changes in CETS expression may perturb genetic networks to broadly influence developmental patterns.
Cotton (Gossypium hirsutum and G. barbadense) is the world’s most important fiber crop as well as being a source of oilseed and feed. Domesticated cotton is cultivated as a day-neutral annual row crop, but wild progenitors are photoperiodic trees and shrubs, and residual perennial growth traits challenge crop management. The complex shoot architectures of wild and domesticated cotton are regulated by the cotton FT and TFL1 homologs, SINGLE FLOWER TRUSS (SFT) and SP, respectively (McGarry et al., 2016). GhSFT overexpression uncoupled flowering from photo-period and accelerated the transition to flowering such that normal sympodial iterations terminated prematurely with floral clusters; silencing GhSP caused the monopodial main stem and all axillary meristems to terminate prematurely with floral buds. Combining GhSFT overexpression with GhSP silencing yielded highly determinate yet fertile cotton with dramatically less fo-liage and synchronized flowering and fruiting. These findings suggested that GhSFT and GhSP navigate meristems between indeterminate vegetative growth and determinate and repro-ductive growth (McGarry et al., 2016).
To identify the genetic networks specifying cotton growth habits, we used comparative co-expression, transcriptomics, and functional analyses. Distinct clusters of cotton genes were co-expressed with GhSFT and GhSP, and, remarkably, these shared related ontologies with networks impacting to-mato architectures. Using transcriptomics, we determined that GhSFT- and GhSP-influenced architectures significantly impacted multiple metabolic pathways. We functionally val-idated the RNA sequencing (RNA-Seq) results by testing the effects of GhSFT and GhSP levels on the expression of photosynthesis-related genes using quantitative reverse tran-scription–PCR (RT–qPCR), and on lignin deposition and cell wall biogenesis using microtomy and histochemical staining.
Materials and methods
Plant inoculations and growth conditionsGossypium hirsutum Texas 701 (TX701) and Delta Pine 61 (DP61) seed-lings were germinated in a 25 °C growth chamber under T5 fluorescent lighting and long days (16 h/8 h). At 4 d post-germination, seedlings re-mained uninoculated, or the cotyledons were infiltrated with Agrobacterium tumefaciens GV3101 pMP90 harboring viral constructs. Virus construc-tion and inoculations were as described (McGarry et al., 2016). Disarmed Cotton leaf crumple virus (dCLCrV) was used for gene delivery: dCLCrV was included as a control, and dCLCrV:GhSFT was engineered to overexpress GhSFT. Tobacco rattle virus (TRV) was used for virus-induced gene silencing: TRV was delivered as a control, TRV:GhSFT was used to silence GhSFT, and TRV:GhSP silenced GhSP. Following inoculations, plants were covered with a dome, incubated at room temperature over-night, and returned to the same 25 °C growth chamber.
Sample collection and library preparationAt 15 days post-inoculation (dpi), apices were excised from inoculated seedlings and uninoculated controls, fixed in acetone with vacuum infil-tration, and acetone was changed twice before storing at 4 °C. Acetone-dried apices were trimmed to 5 mm and expanding leaves were removed. Dried samples were frozen in liquid nitrogen, homogenized using a Retsch mill (Retsch GmbH, Haan, Germany), and RNA was isolated by hot borate (Wan and Wilkins 1994) followed by column clean-up (Zymo
Dow
nloaded from https://academ
ic.oup.com/jxb/article/71/19/5911/5879959 by U
niversity of Georgia user on 28 M
ay 2021

SFT and SP networks influence cotton growth patterns | 5913
Research, Irvine, CA, USA). Expression of GhSP and GhSFT was deter-mined by RT–qPCR (McGarry et al., 2016). A 2 µg aliquot of total RNA from uninoculated, dCLCrV:GhSFT-, and TRV:GhSP-infected DP61 and TX701 plants was used to prepare Illumina TruSeq Stranded mRNA libraries (Illumina, Inc., San Diego, CA, USA) as per the manufacturer’s protocols, with three biological replicates per treatment per accession.
Preparation and analysis of meristem transcriptomes were previously described (Prewitt et al., 2018). Briefly, DP61 and TX701 plants were grown under short (10 h/14 h) or long (16 h/8 h) days, and apices were harvested at different developmental stages. Apices were fixed in acetone, and meristems and flanking leaves were dissected with the aid of an SMZ 1500 stereomicroscope (Nikon, Melville, NY, USA). The developmental stages from which meristems were harvested included: (i) the mono-podial main stem from juvenile DP61 (designated ‘DJ’ in Supplementary Fig. S1 at JXB online); (ii) the monopodial main stem from juvenile TX701 (‘TJ’); (iii) the adult monopodial main stem from TX701 grown under non-inductive long days (plants were not flowering; ‘TLM’); (iv) monopodial lateral branches from TX701 grown under non-inductive long days (plants were not flowering; ‘TL20’); (v) the adult monopodial main stem from TX701 grown under inductive short days after the tran-sition to reproductive growth (plants had flowering sympodial branches; ‘TSM’); and (vi) adult sympodial fruiting branches from TX701 grown under inductive short days (flowering sympodial branches; ‘TS20’). In addition, the two immature leaves flanking each meristem were har-vested and analyzed separately (‘DJL’, ‘TJL’, ‘TLML’, ‘TL20L’, ‘TSML’, and ‘TS20L’). Each developmental stage was comprised of three biological replicates, and each replicate consisted of four isolated meristems. RNA was extracted, mRNA amplified with the TargetAmp Amplification kit (Epicenter, Madison, WI, USA), and 125 ng of amplified mRNA was used to prepare Illumina TruSeq mRNA stranded libraries (Illumina, Inc.).
Sequencing, read processing, and data analysisLibraries were sequenced on a HiSeq2000 (the University of Texas Southwestern Genomics Core), and >30 million 50 bp single-end reads were obtained per replicate. Read quality was checked using the FastQC in the Discovery Environment at CyVerse (Goff et al., 2011); the me-dian quality score was ≥35 for 90% of bases in reads. Reads were aligned to the G. hirsutum TM1-1 CRI v1_a1 reference genome (Yang et al., 2019) using the Tuxedo pipeline (TopHat v2.0.9 with Bowtie v2.1.0; Trapnell et al., 2009, 2010) available in the Discovery Environment at CyVerse (Goff et al., 2011). Gene FPKM (fragments per kilobase of exon model per million mapped fragments) values as normalized gene expression levels were calculated with Cufflinks v2.1.1. Cuffdiff v2.1.1 was used to determine significant differences in gene expression between pair-wise comparisons using q≤0.05 where q is the Benjamini–Hochberg correction to reduce false positives. Venn diagrams were constructed in R (R Development Core Team, 2013); enrichment tests for genes up- and down-regulated by treatment but common to both accessions were conducted using Fisher’s exact test with Benjamini–Hochberg multiple testing correction (q≤0.1), and the results were sorted into MapMan bins (Thimm et al., 2004).
Weighted gene co-expression network analysis (WGCNA)The WGCNA package in R (Zhang and Horvath, 2005; Langfelder and Horvath, 2008) was used to construct networks from cotton (18 apex and 36 meristem samples described above) and tomato (32 stem sam-ples; NCBI GEO accession GSE132280; Shalit-Kaneh et al., 2019). Raw reads from cotton and tomato samples were aligned to the G. hirsutum TM-1 TX-JGI assembly v1.0 and annotation v1.1 (Saski et al., 2017) and Solanum lycopersicum SL3.0 (Tomato Genome Consortium et al., 2012) reference genomes, respectively, using TopHat/Bowtie (Trapnell et al., 2009). Normalized gene expression levels were based on FPKM values generated through Cufflinks. Expression data were filtered (FPKM value ≥10, and coefficient of variation >100% for cotton and >50% for tomato) and normalized by log2-transformed FPKM+1 values. The co-expression gene network modules were constructed using the WGCNA step-by-step
network construction; the power transformation was set at 6 using the soft-thresholding method, and other parameters remained at the default settings. The association of SFT and SP genes with co-expression mod-ules was quantified by the correlation between SFT/SP gene expression and the module eigengene. The Gene Ontology (GO) biological pro-cess terms enriched (Benjamini–Hochberg correction, P<0.05) in cotton modules were determined using the PhytoMine tool at Phytozome 12 (https://phytozome.jgi.doe.gov) and ShinyGo v0.60 for tomato modules (Ashburner et al., 2000; The Gene Ontology Consortium, 2019). GO terms were summarized using REViGO (Supek et al., 2011). WGCNA was repeated using the G. hirsutum CRI v1_a1 reference (Yang et al., 2019), with the power transformation set at 7 and mergeCutHeight at 0.15. The association of SFT and SP with co-expression modules was quantified, and the enrichment of GO terms (P<0.05) was deter-mined using the Cotton Functional Genomics Database (http://www.cottonfgd.org/).
Gene expression validationGene expression was validated by RT–qPCR as previously described (McGarry et al., 2016). Primers were designed to anneal near the 3' end of each coding sequence, span an intron, and yield products of ~130 nt (Supplementary Table S1). Amplification was carried out in 10 µl reac-tions using 10-fold dilutions of cDNA with PowerUp™ SYBR Green Master Mix (Applied Biosystems, Foster City, CA, USA) on a ViiA™7 Real-Time PCR System (Applied Biosystems) with a fast cycle (UDG activation at 50 °C for 2 min, initial denaturation at 95 °C for 2 min, followed by 40 cycles at 95 °C for 1 s and 60 °C for 30 s) and melt curve analysis (95 °C for 15 s, 60 °C for 1 min, and 95°C for 15 s). Target and reference gene amplifications used three biological replicates and two technical replicates. Data were analyzed by the ΔΔCt method using GhpolyUBQ as the reference, and gene expression is expressed as fold change relative to uninoculated plants. Variation is expressed as the standard error of the mean.
Tissue sectioning and stainingStems between nodes four and five were obtained from mature uninoculated, TRV-infected, and TRV:GhSP-infected DP61 plants. Stems were stored in 100% ethanol at 4 °C until sectioned with a Microm HM 650V vibratome (Thermo Scientific, Waltham, MA, USA). Transverse 75 µm thick sections were stained with phloroglucinol, calcafluor white, and 0.1% toluidine blue-O. Autofluorescence of lignin polymers and cellulose deposition detected with calcafluor white were visual-ized by UV epifluorescence (excitation wavelengths 340–380 nm and emission wavelengths 435–485 nm) using an Eclipse E600 compound microscope (Nikon, Melville, NY, USA) with SPOT Insight 2 CCD camera (Diagnostic Instruments Inc., Sterling Heights, MI, USA) and an X-cite 120 fluor system (Exfo Life Sciences Division, Quebec, Canada). Phloroglucinol and toluidine blue-O staining were visualized by bright field with the same microscope.
Results
Comparative co-expression analysis identifies distinct SFT and SP genetic networks
Shoot architecture in wild photoperiodic Texas 701 (TX701) and domesticated day-neutral Delta Pine 61 (DP61) cotton is controlled by the complex balance of GhSFT to GhSP (McGarry et al., 2016). Using virus-mediated transient gene manipulation, we showed that overexpressing GhSFT from the dCLCrV vector uncoupled flowering from photoperiod in TX701 and caused sympodial branches to terminate with clusters of flowers instead of initiating the next sympodial unit (McGarry et al., 2016; and included for clarity in Fig. 1). In
Dow
nloaded from https://academ
ic.oup.com/jxb/article/71/19/5911/5879959 by U
niversity of Georgia user on 28 M
ay 2021
5914 | McGarry et al.
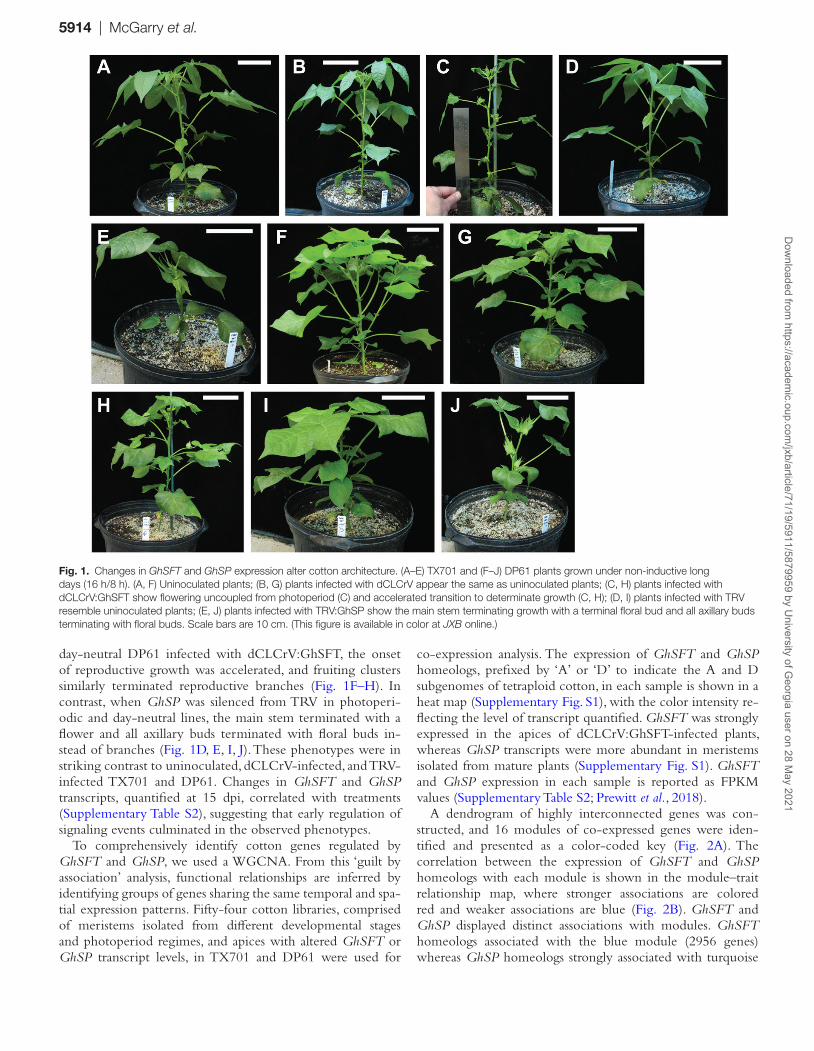
day-neutral DP61 infected with dCLCrV:GhSFT, the onset of reproductive growth was accelerated, and fruiting clusters similarly terminated reproductive branches (Fig. 1F–H). In contrast, when GhSP was silenced from TRV in photoperi-odic and day-neutral lines, the main stem terminated with a flower and all axillary buds terminated with floral buds in-stead of branches (Fig. 1D, E, I, J). These phenotypes were in striking contrast to uninoculated, dCLCrV-infected, and TRV-infected TX701 and DP61. Changes in GhSFT and GhSP transcripts, quantified at 15 dpi, correlated with treatments (Supplementary Table S2), suggesting that early regulation of signaling events culminated in the observed phenotypes.
To comprehensively identify cotton genes regulated by GhSFT and GhSP, we used a WGCNA. From this ‘guilt by association’ analysis, functional relationships are inferred by identifying groups of genes sharing the same temporal and spa-tial expression patterns. Fifty-four cotton libraries, comprised of meristems isolated from different developmental stages and photoperiod regimes, and apices with altered GhSFT or GhSP transcript levels, in TX701 and DP61 were used for
co-expression analysis. The expression of GhSFT and GhSP homeologs, prefixed by ‘A’ or ‘D’ to indicate the A and D subgenomes of tetraploid cotton, in each sample is shown in a heat map (Supplementary Fig. S1), with the color intensity re-flecting the level of transcript quantified. GhSFT was strongly expressed in the apices of dCLCrV:GhSFT-infected plants, whereas GhSP transcripts were more abundant in meristems isolated from mature plants (Supplementary Fig. S1). GhSFT and GhSP expression in each sample is reported as FPKM values (Supplementary Table S2; Prewitt et al., 2018).
A dendrogram of highly interconnected genes was con-structed, and 16 modules of co-expressed genes were iden-tified and presented as a color-coded key (Fig. 2A). The correlation between the expression of GhSFT and GhSP homeologs with each module is shown in the module–trait relationship map, where stronger associations are colored red and weaker associations are blue (Fig. 2B). GhSFT and GhSP displayed distinct associations with modules. GhSFT homeologs associated with the blue module (2956 genes) whereas GhSP homeologs strongly associated with turquoise
Fig. 1. Changes in GhSFT and GhSP expression alter cotton architecture. (A–E) TX701 and (F–J) DP61 plants grown under non-inductive long days (16 h/8 h). (A, F) Uninoculated plants; (B, G) plants infected with dCLCrV appear the same as uninoculated plants; (C, H) plants infected with dCLCrV:GhSFT show flowering uncoupled from photoperiod (C) and accelerated transition to determinate growth (C, H); (D, I) plants infected with TRV resemble uninoculated plants; (E, J) plants infected with TRV:GhSP show the main stem terminating growth with a terminal floral bud and all axillary buds terminating with floral buds. Scale bars are 10 cm. (This figure is available in color at JXB online.)
Dow
nloaded from https://academ
ic.oup.com/jxb/article/71/19/5911/5879959 by U
niversity of Georgia user on 28 M
ay 2021

SFT and SP networks influence cotton growth patterns | 5915
(4392 genes), black (309 genes), and brown (924 genes) mod-ules, and more moderately with the salmon (67 genes) module. GO terms related to photosynthesis were significantly en-riched in the blue (23 genes, P<0.0015) and turquoise (41 genes, P< 2.9×10⁻¹⁵) modules (Supplementary Datasets S1–S3). In addition, GO term ‘response to auxin’ (30 genes, P<8.8×10⁻⁴) was overabundant in the turquoise module. The black module was enriched in GO terms related to calcium
ion (four genes, P=0.001) and H+ transmembrane transport (eight genes, P<0.05). The brown and salmon modules were enriched for GO terms involving the regulation of transcrip-tion (99 genes, P< 3.1×10⁻²⁰ and 15 genes, P<2.6×10⁻⁵, re-spectively), with predicted proteins enriched for NAC, AP2/ERF, and homeobox domains. NAC transcription factors are well-characterized master regulators of lignin and secondary cell wall synthesis (Wang and Dixon, 2012; Taylor-Teeples
Fig. 2. SFT and SP are co-expressed with distinct gene clusters. (A) The dendrogram shows co-expressed clusters of genes. Each leaf of the tree represents a gene; interconnected, highly co-expressed genes form the branches of the tree. Sixteen co-expressed clusters or modules were identified from 54 cotton libraries and are represented by the color-coded bar. (B) The correlation of GhSFT homeologs, represented as ‘A08’ and ‘D08’ to indicate the chromosomes of the A and D subgenomes, and GhSP homeologs, represented as ‘A07’ and ‘D07’, with each module shown in a heat map. Stronger correlations are colored red; P-values are in parentheses. (C) The dendrogram from 32 tomato libraries identified 23 modules of highly co-expressed genes. (D) The module–trait map shows the correlation of SlSFT and SlSP expression with each module. Stronger correlations are in red; P-values are in parentheses.
Dow
nloaded from https://academ
ic.oup.com/jxb/article/71/19/5911/5879959 by U
niversity of Georgia user on 28 M
ay 2021
5916 | McGarry et al.
et al., 2015) while AP2/ERF and homeobox transcription fac-tors regulate diverse developmental programs (Sluis and Hake, 2015). This analysis emphasizes that GhSFT and GhSP interact with multiple and diverse clusters of genes, and suggests that GhSFT and GhSP affect metabolic and developmental pat-terns through these genetic networks.
The activities of SFT and SP homologs are broadly con-served in other species (Lifschitz et al., 2014), and we questioned if this implied interactions with conserved genetic networks. To test this, we used WGCNA to identify genes co-expressed with SlSFT (Solyc03g063100) and SlSP (Solyc06g074350) in 32 libraries constructed from mature stems of tomato plants in florigenic or non-florigenic states (Shalit-Kaneh et al., 2019). A dendrogram of 23 color-coded modules was generated (Fig. 2C), and the correlation of SlSFT and SlSP expression with each was determined (Fig. 2D). As with cotton, SlSFT and SlSP associated with multiple modules (Supplementary Datasets S4, S5). SlSP was strongly co-expressed with brown (794 genes), green (634 genes), black (499 genes), and ma-genta (293 genes) modules, whereas SlSFT weakly associated with brown, green, dark red (48 genes), and green-yellow (142 genes) modules. The brown, black, and green modules were significantly enriched with GO terms related to su-crose transport (three genes, P<0.05), cell wall biogenesis (26 genes, P<1.5×10⁻¹⁵), lignin metabolism (10 genes, P<7.2×10–
8), and regulation of transcription (58 genes, P<2.0×10⁻⁸; Supplementary Datasets S4, S5). While the analyses in cotton and tomato are based on different tissues and maturities, the WGCNA shows that SFT and SP interact with distinct groups of genes and some of these are involved in related metabolic pathways in cotton and tomato, implying some conservation of SFT and SP genetic networks in these two species.
Exaggerated changes to GhSFT or GhSP expression perturb genetic networks affecting developmental patterns
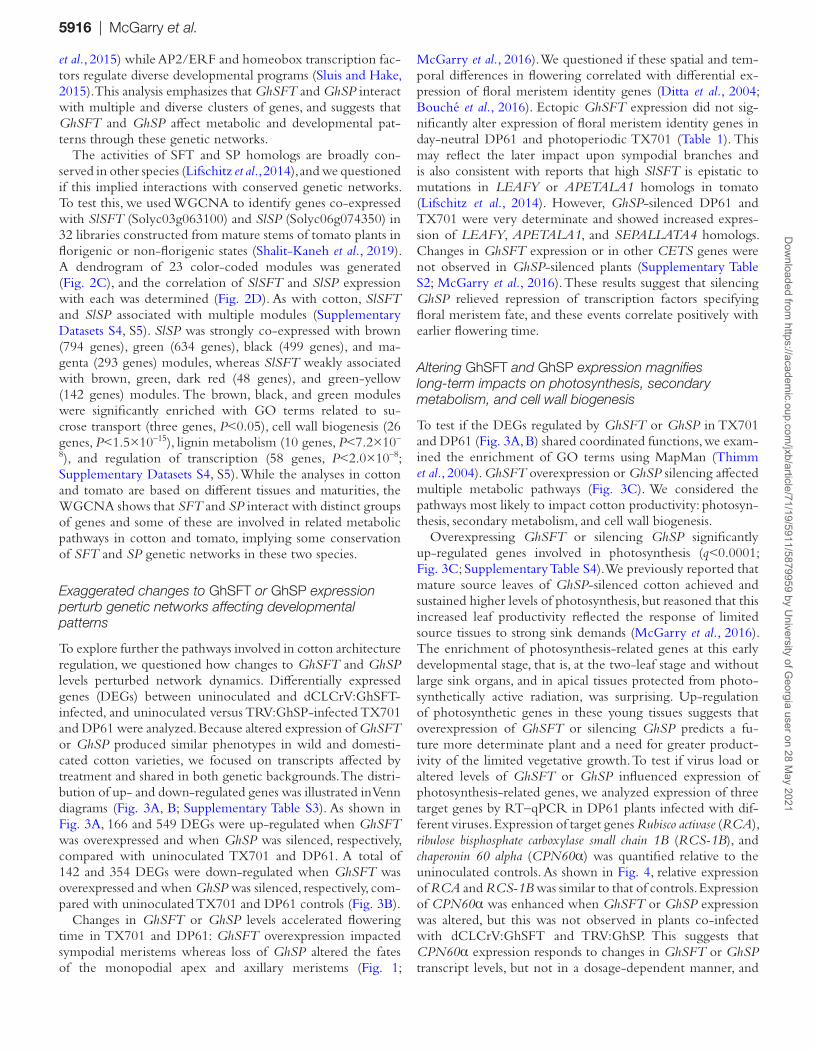
To explore further the pathways involved in cotton architecture regulation, we questioned how changes to GhSFT and GhSP levels perturbed network dynamics. Differentially expressed genes (DEGs) between uninoculated and dCLCrV:GhSFT-infected, and uninoculated versus TRV:GhSP-infected TX701 and DP61 were analyzed. Because altered expression of GhSFT or GhSP produced similar phenotypes in wild and domesti-cated cotton varieties, we focused on transcripts affected by treatment and shared in both genetic backgrounds. The distri-bution of up- and down-regulated genes was illustrated in Venn diagrams (Fig. 3A, B; Supplementary Table S3). As shown in Fig. 3A, 166 and 549 DEGs were up-regulated when GhSFT was overexpressed and when GhSP was silenced, respectively, compared with uninoculated TX701 and DP61. A total of 142 and 354 DEGs were down-regulated when GhSFT was overexpressed and when GhSP was silenced, respectively, com-pared with uninoculated TX701 and DP61 controls (Fig. 3B).
Changes in GhSFT or GhSP levels accelerated flowering time in TX701 and DP61: GhSFT overexpression impacted sympodial meristems whereas loss of GhSP altered the fates of the monopodial apex and axillary meristems (Fig. 1;
McGarry et al., 2016). We questioned if these spatial and tem-poral differences in flowering correlated with differential ex-pression of floral meristem identity genes (Ditta et al., 2004; Bouché et al., 2016). Ectopic GhSFT expression did not sig-nificantly alter expression of floral meristem identity genes in day-neutral DP61 and photoperiodic TX701 (Table 1). This may reflect the later impact upon sympodial branches and is also consistent with reports that high SlSFT is epistatic to mutations in LEAFY or APETALA1 homologs in tomato (Lifschitz et al., 2014). However, GhSP-silenced DP61 and TX701 were very determinate and showed increased expres-sion of LEAFY, APETALA1, and SEPALLATA4 homologs. Changes in GhSFT expression or in other CETS genes were not observed in GhSP-silenced plants (Supplementary Table S2; McGarry et al., 2016). These results suggest that silencing GhSP relieved repression of transcription factors specifying floral meristem fate, and these events correlate positively with earlier flowering time.
Altering GhSFT and GhSP expression magnifies long-term impacts on photosynthesis, secondary metabolism, and cell wall biogenesis
To test if the DEGs regulated by GhSFT or GhSP in TX701 and DP61 (Fig. 3A, B) shared coordinated functions, we exam-ined the enrichment of GO terms using MapMan (Thimm et al., 2004). GhSFT overexpression or GhSP silencing affected multiple metabolic pathways (Fig. 3C). We considered the pathways most likely to impact cotton productivity: photosyn-thesis, secondary metabolism, and cell wall biogenesis.
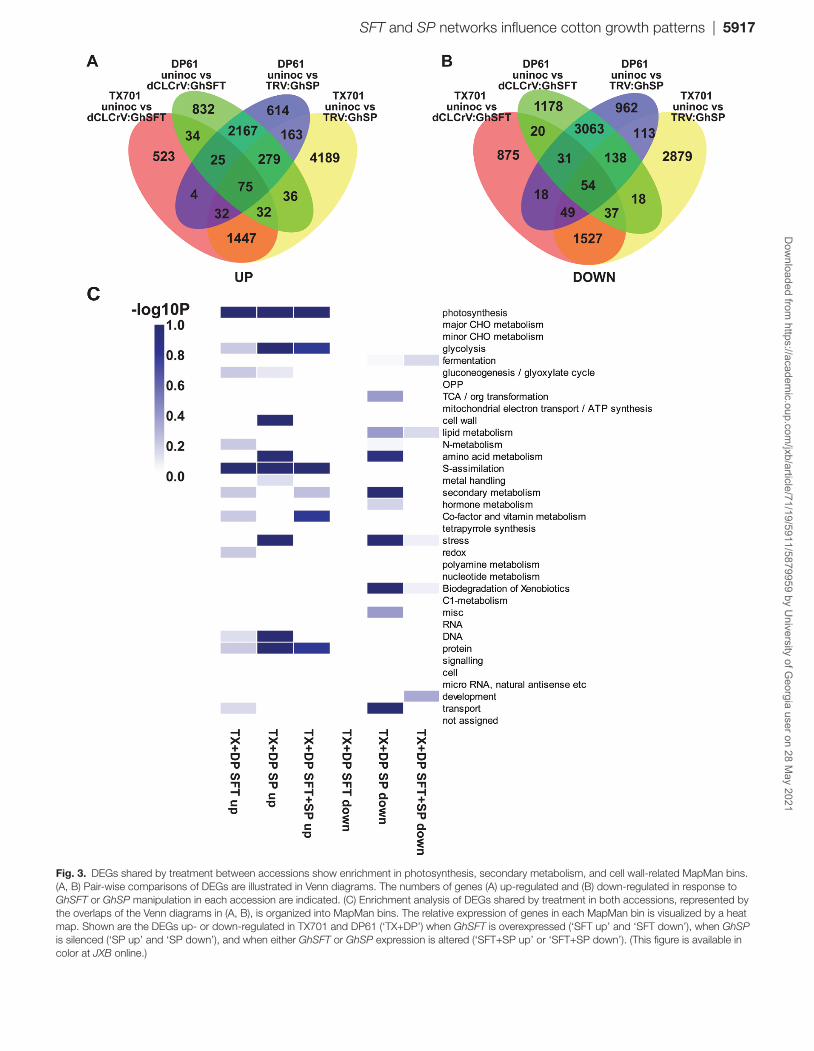
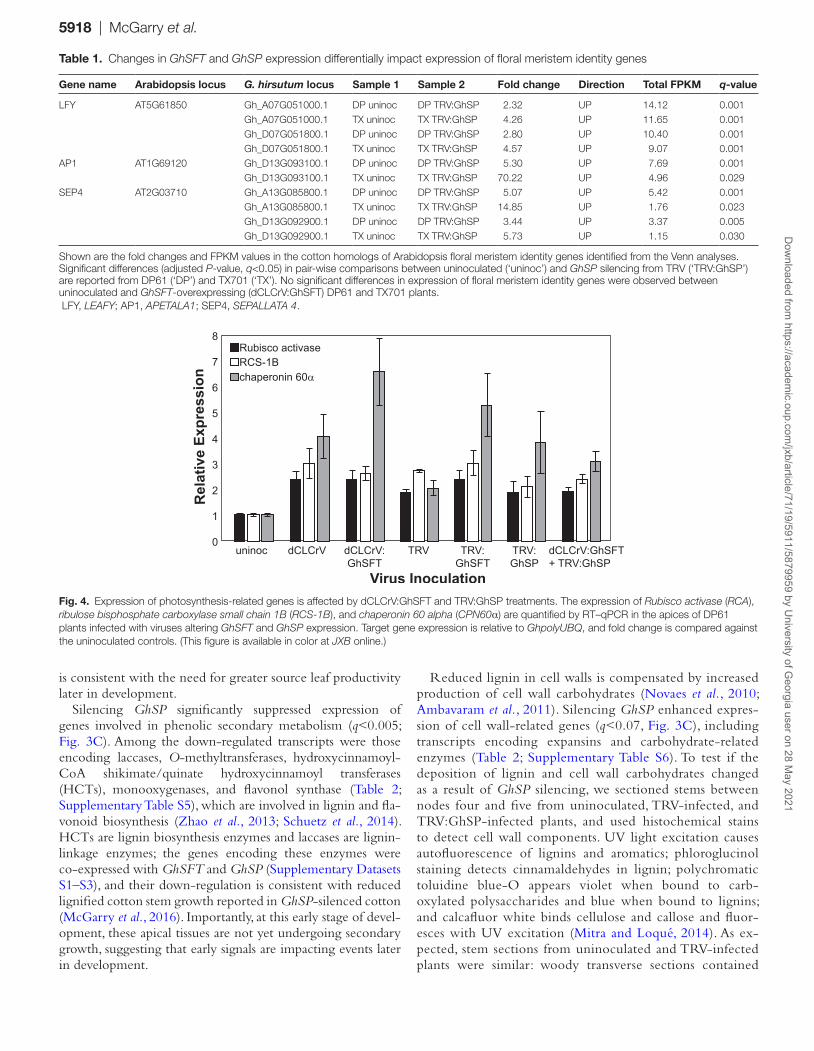
Overexpressing GhSFT or silencing GhSP significantly up-regulated genes involved in photosynthesis (q<0.0001; Fig. 3C; Supplementary Table S4). We previously reported that mature source leaves of GhSP-silenced cotton achieved and sustained higher levels of photosynthesis, but reasoned that this increased leaf productivity reflected the response of limited source tissues to strong sink demands (McGarry et al., 2016). The enrichment of photosynthesis-related genes at this early developmental stage, that is, at the two-leaf stage and without large sink organs, and in apical tissues protected from photo-synthetically active radiation, was surprising. Up-regulation of photosynthetic genes in these young tissues suggests that overexpression of GhSFT or silencing GhSP predicts a fu-ture more determinate plant and a need for greater product-ivity of the limited vegetative growth. To test if virus load or altered levels of GhSFT or GhSP influenced expression of photosynthesis-related genes, we analyzed expression of three target genes by RT–qPCR in DP61 plants infected with dif-ferent viruses. Expression of target genes Rubisco activase (RCA), ribulose bisphosphate carboxylase small chain 1B (RCS-1B), and chaperonin 60 alpha (CPN60α) was quantified relative to the uninoculated controls. As shown in Fig. 4, relative expression of RCA and RCS-1B was similar to that of controls. Expression of CPN60α was enhanced when GhSFT or GhSP expression was altered, but this was not observed in plants co-infected with dCLCrV:GhSFT and TRV:GhSP. This suggests that CPN60α expression responds to changes in GhSFT or GhSP transcript levels, but not in a dosage-dependent manner, and
Dow
nloaded from https://academ
ic.oup.com/jxb/article/71/19/5911/5879959 by U
niversity of Georgia user on 28 M
ay 2021
SFT and SP networks influence cotton growth patterns | 5917
Fig. 3. DEGs shared by treatment between accessions show enrichment in photosynthesis, secondary metabolism, and cell wall-related MapMan bins. (A, B) Pair-wise comparisons of DEGs are illustrated in Venn diagrams. The numbers of genes (A) up-regulated and (B) down-regulated in response to GhSFT or GhSP manipulation in each accession are indicated. (C) Enrichment analysis of DEGs shared by treatment in both accessions, represented by the overlaps of the Venn diagrams in (A, B), is organized into MapMan bins. The relative expression of genes in each MapMan bin is visualized by a heat map. Shown are the DEGs up- or down-regulated in TX701 and DP61 (‘TX+DP’) when GhSFT is overexpressed (‘SFT up’ and ‘SFT down’), when GhSP is silenced (‘SP up’ and ‘SP down’), and when either GhSFT or GhSP expression is altered (‘SFT+SP up’ or ‘SFT+SP down’). (This figure is available in color at JXB online.)
Dow
nloaded from https://academ
ic.oup.com/jxb/article/71/19/5911/5879959 by U
niversity of Georgia user on 28 M
ay 2021
5918 | McGarry et al.
is consistent with the need for greater source leaf productivity later in development.
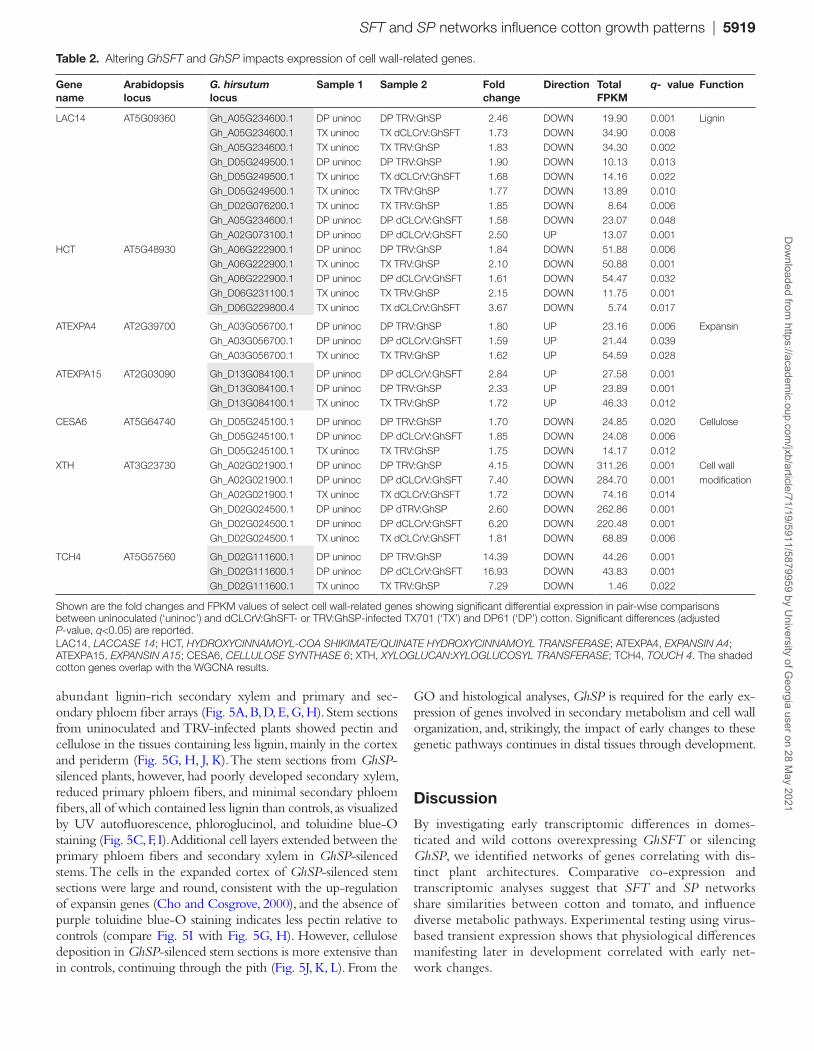
Silencing GhSP significantly suppressed expression of genes involved in phenolic secondary metabolism (q<0.005; Fig. 3C). Among the down-regulated transcripts were those encoding laccases, O-methyltransferases, hydroxycinnamoyl-CoA shikimate/quinate hydroxycinnamoyl transferases (HCTs), monooxygenases, and flavonol synthase (Table 2; Supplementary Table S5), which are involved in lignin and fla-vonoid biosynthesis (Zhao et al., 2013; Schuetz et al., 2014). HCTs are lignin biosynthesis enzymes and laccases are lignin-linkage enzymes; the genes encoding these enzymes were co-expressed with GhSFT and GhSP (Supplementary Datasets S1–S3), and their down-regulation is consistent with reduced lignified cotton stem growth reported in GhSP-silenced cotton (McGarry et al., 2016). Importantly, at this early stage of devel-opment, these apical tissues are not yet undergoing secondary growth, suggesting that early signals are impacting events later in development.
Reduced lignin in cell walls is compensated by increased production of cell wall carbohydrates (Novaes et al., 2010; Ambavaram et al., 2011). Silencing GhSP enhanced expres-sion of cell wall-related genes (q<0.07, Fig. 3C), including transcripts encoding expansins and carbohydrate-related enzymes (Table 2; Supplementary Table S6). To test if the deposition of lignin and cell wall carbohydrates changed as a result of GhSP silencing, we sectioned stems between nodes four and five from uninoculated, TRV-infected, and TRV:GhSP-infected plants, and used histochemical stains to detect cell wall components. UV light excitation causes autofluorescence of lignins and aromatics; phloroglucinol staining detects cinnamaldehydes in lignin; polychromatic toluidine blue-O appears violet when bound to carb-oxylated polysaccharides and blue when bound to lignins; and calcafluor white binds cellulose and callose and fluor-esces with UV excitation (Mitra and Loqué, 2014). As ex-pected, stem sections from uninoculated and TRV-infected plants were similar: woody transverse sections contained
Fig. 4. Expression of photosynthesis-related genes is affected by dCLCrV:GhSFT and TRV:GhSP treatments. The expression of Rubisco activase (RCA), ribulose bisphosphate carboxylase small chain 1B (RCS-1B), and chaperonin 60 alpha (CPN60α) are quantified by RT–qPCR in the apices of DP61 plants infected with viruses altering GhSFT and GhSP expression. Target gene expression is relative to GhpolyUBQ, and fold change is compared against the uninoculated controls. (This figure is available in color at JXB online.)
Table 1. Changes in GhSFT and GhSP expression differentially impact expression of floral meristem identity genes
Gene name Arabidopsis locus G. hirsutum locus Sample 1 Sample 2 Fold change Direction Total FPKM q-value
LFY AT5G61850 Gh_A07G051000.1 DP uninoc DP TRV:GhSP 2.32 UP 14.12 0.001Gh_A07G051000.1 TX uninoc TX TRV:GhSP 4.26 UP 11.65 0.001Gh_D07G051800.1 DP uninoc DP TRV:GhSP 2.80 UP 10.40 0.001Gh_D07G051800.1 TX uninoc TX TRV:GhSP 4.57 UP 9.07 0.001
AP1 AT1G69120 Gh_D13G093100.1 DP uninoc DP TRV:GhSP 5.30 UP 7.69 0.001Gh_D13G093100.1 TX uninoc TX TRV:GhSP 70.22 UP 4.96 0.029
SEP4 AT2G03710 Gh_A13G085800.1 DP uninoc DP TRV:GhSP 5.07 UP 5.42 0.001Gh_A13G085800.1 TX uninoc TX TRV:GhSP 14.85 UP 1.76 0.023Gh_D13G092900.1 DP uninoc DP TRV:GhSP 3.44 UP 3.37 0.005Gh_D13G092900.1 TX uninoc TX TRV:GhSP 5.73 UP 1.15 0.030
Shown are the fold changes and FPKM values in the cotton homologs of Arabidopsis floral meristem identity genes identified from the Venn analyses. Significant differences (adjusted P-value, q<0.05) in pair-wise comparisons between uninoculated (‘uninoc’) and GhSP silencing from TRV (‘TRV:GhSP’) are reported from DP61 (‘DP’) and TX701 (‘TX’). No significant differences in expression of floral meristem identity genes were observed between uninoculated and GhSFT-overexpressing (dCLCrV:GhSFT) DP61 and TX701 plants. LFY, LEAFY; AP1, APETALA1; SEP4, SEPALLATA 4.
Dow
nloaded from https://academ
ic.oup.com/jxb/article/71/19/5911/5879959 by U
niversity of Georgia user on 28 M
ay 2021
SFT and SP networks influence cotton growth patterns | 5919
abundant lignin-rich secondary xylem and primary and sec-ondary phloem fiber arrays (Fig. 5A, B, D, E, G, H). Stem sections from uninoculated and TRV-infected plants showed pectin and cellulose in the tissues containing less lignin, mainly in the cortex and periderm (Fig. 5G, H, J, K). The stem sections from GhSP-silenced plants, however, had poorly developed secondary xylem, reduced primary phloem fibers, and minimal secondary phloem fibers, all of which contained less lignin than controls, as visualized by UV autofluorescence, phloroglucinol, and toluidine blue-O staining (Fig. 5C, F, I). Additional cell layers extended between the primary phloem fibers and secondary xylem in GhSP-silenced stems. The cells in the expanded cortex of GhSP-silenced stem sections were large and round, consistent with the up-regulation of expansin genes (Cho and Cosgrove, 2000), and the absence of purple toluidine blue-O staining indicates less pectin relative to controls (compare Fig. 5I with Fig. 5G, H). However, cellulose deposition in GhSP-silenced stem sections is more extensive than in controls, continuing through the pith (Fig. 5J, K, L). From the
GO and histological analyses, GhSP is required for the early ex-pression of genes involved in secondary metabolism and cell wall organization, and, strikingly, the impact of early changes to these genetic pathways continues in distal tissues through development.
Discussion
By investigating early transcriptomic differences in domes-ticated and wild cottons overexpressing GhSFT or silencing GhSP, we identified networks of genes correlating with dis-tinct plant architectures. Comparative co-expression and transcriptomic analyses suggest that SFT and SP networks share similarities between cotton and tomato, and influence diverse metabolic pathways. Experimental testing using virus-based transient expression shows that physiological differences manifesting later in development correlated with early net-work changes.
Table 2. Altering GhSFT and GhSP impacts expression of cell wall-related genes.
Gene name
Arabidopsis locus
G. hirsutum locus
Sample 1 Sample 2 Fold change
Direction Total FPKM
q- value Function
LAC14 AT5G09360 Gh_A05G234600.1 DP uninoc DP TRV:GhSP 2.46 DOWN 19.90 0.001 LigninGh_A05G234600.1 TX uninoc TX dCLCrV:GhSFT 1.73 DOWN 34.90 0.008Gh_A05G234600.1 TX uninoc TX TRV:GhSP 1.83 DOWN 34.30 0.002Gh_D05G249500.1 DP uninoc DP TRV:GhSP 1.90 DOWN 10.13 0.013Gh_D05G249500.1 TX uninoc TX dCLCrV:GhSFT 1.68 DOWN 14.16 0.022Gh_D05G249500.1 TX uninoc TX TRV:GhSP 1.77 DOWN 13.89 0.010Gh_D02G076200.1 TX uninoc TX TRV:GhSP 1.85 DOWN 8.64 0.006Gh_A05G234600.1 DP uninoc DP dCLCrV:GhSFT 1.58 DOWN 23.07 0.048Gh_A02G073100.1 DP uninoc DP dCLCrV:GhSFT 2.50 UP 13.07 0.001
HCT AT5G48930 Gh_A06G222900.1 DP uninoc DP TRV:GhSP 1.84 DOWN 51.88 0.006Gh_A06G222900.1 TX uninoc TX TRV:GhSP 2.10 DOWN 50.88 0.001Gh_A06G222900.1 DP uninoc DP dCLCrV:GhSFT 1.61 DOWN 54.47 0.032Gh_D06G231100.1 TX uninoc TX TRV:GhSP 2.15 DOWN 11.75 0.001Gh_D06G229800.4 TX uninoc TX dCLCrV:GhSFT 3.67 DOWN 5.74 0.017
ATEXPA4 AT2G39700 Gh_A03G056700.1 DP uninoc DP TRV:GhSP 1.80 UP 23.16 0.006 ExpansinGh_A03G056700.1 DP uninoc DP dCLCrV:GhSFT 1.59 UP 21.44 0.039Gh_A03G056700.1 TX uninoc TX TRV:GhSP 1.62 UP 54.59 0.028
ATEXPA15 AT2G03090 Gh_D13G084100.1 DP uninoc DP dCLCrV:GhSFT 2.84 UP 27.58 0.001Gh_D13G084100.1 DP uninoc DP TRV:GhSP 2.33 UP 23.89 0.001Gh_D13G084100.1 TX uninoc TX TRV:GhSP 1.72 UP 46.33 0.012
CESA6 AT5G64740 Gh_D05G245100.1 DP uninoc DP TRV:GhSP 1.70 DOWN 24.85 0.020 CelluloseGh_D05G245100.1 DP uninoc DP dCLCrV:GhSFT 1.85 DOWN 24.08 0.006Gh_D05G245100.1 TX uninoc TX TRV:GhSP 1.75 DOWN 14.17 0.012
XTH AT3G23730 Gh_A02G021900.1 DP uninoc DP TRV:GhSP 4.15 DOWN 311.26 0.001 Cell wall modificationGh_A02G021900.1 DP uninoc DP dCLCrV:GhSFT 7.40 DOWN 284.70 0.001
Gh_A02G021900.1 TX uninoc TX dCLCrV:GhSFT 1.72 DOWN 74.16 0.014Gh_D02G024500.1 DP uninoc DP dTRV:GhSP 2.60 DOWN 262.86 0.001Gh_D02G024500.1 DP uninoc DP dCLCrV:GhSFT 6.20 DOWN 220.48 0.001Gh_D02G024500.1 TX uninoc TX dCLCrV:GhSFT 1.81 DOWN 68.89 0.006
TCH4 AT5G57560 Gh_D02G111600.1 DP uninoc DP TRV:GhSP 14.39 DOWN 44.26 0.001Gh_D02G111600.1 DP uninoc DP dCLCrV:GhSFT 16.93 DOWN 43.83 0.001Gh_D02G111600.1 TX uninoc TX TRV:GhSP 7.29 DOWN 1.46 0.022
Shown are the fold changes and FPKM values of select cell wall-related genes showing significant differential expression in pair-wise comparisons between uninoculated (‘uninoc’) and dCLCrV:GhSFT- or TRV:GhSP-infected TX701 (‘TX’) and DP61 (‘DP’) cotton. Significant differences (adjusted P-value, q<0.05) are reported. LAC14, LACCASE 14; HCT, HYDROXYCINNAMOYL-COA SHIKIMATE/QUINATE HYDROXYCINNAMOYL TRANSFERASE; ATEXPA4, EXPANSIN A4; ATEXPA15, EXPANSIN A15; CESA6, CELLULOSE SYNTHASE 6; XTH, XYLOGLUCAN:XYLOGLUCOSYL TRANSFERASE; TCH4, TOUCH 4. The shaded cotton genes overlap with the WGCNA results.
Dow
nloaded from https://academ
ic.oup.com/jxb/article/71/19/5911/5879959 by U
niversity of Georgia user on 28 M
ay 2021

5920 | McGarry et al.
GhSFT overexpression and GhSP silencing enhanced de-terminate growth patterns. Our results suggest that GhSP, like AtTFL1, repressed expression of floral meristem identity genes (Table 1; Ratcliffe et al., 1998; Hanzawa et al., 2005; Baumann et al., 2015). Expression of the same meristem iden-tity genes was not enhanced with high levels of GhSFT. This suggested that the determinate growth patterns observed resulted through different signaling pathways. WGCNA
further emphasized distinctions in SFT and SP networks, with co-expressed genes sharing different GOs. Taken together, we show that GhSFT and GhSP regulate cotton architecture through distinct genetic networks.
Network analyses show that GhSFT and GhSP affect metabolic pathways and, importantly, we demonstrate that transcriptome changes occurring in young tissues early in development are maintained in different and more mature
Fig. 5. Silencing GhSP alters the composition of cell walls. Transverse 75 µm thick stem sections, obtained between nodes 4 and 5 of the main stem, from mature (~100 d post-germination) uninoculated (A, D, G, J), TRV-infected (B, E, H, K), and TRV:GhSP-infected (C, F, I, L) DP61 plants were visualized using histochemical stains to detect cell wall polymers. UV excitation of lignin polymers is visualized by autofluorescence (A–C); phloroglucinol staining of lignin is observed with bright-field microscopy (D–F); toluidine blue-O staining is blue when bound to lignin and violet when bound to carboxylated polysaccharides (G–I); calcafluor white binds cellulose and callose and fluoresces with UV excitation (J–L). Scale bars are 100 µm. For reference, tissues in (A) are marked with ‘c’ for cortex, ‘1p’ for primary phloem fibers, ‘2p’ for secondary phloem and secondary phloem fibers, and ‘2x’ for secondary xylem.
Dow
nloaded from https://academ
ic.oup.com/jxb/article/71/19/5911/5879959 by U
niversity of Georgia user on 28 M
ay 2021
SFT and SP networks influence cotton growth patterns | 5921
organs. GhSP expression significantly correlated with the expression of genes encoding transcription factors including NAC, AP2/ERF, and homeodomain proteins. NAC tran-scription factors are master regulators of secondary cell wall biogenesis (Zhao and Dixon, 2011). Silencing GhSP sig-nificantly reduced expression of lignin and flavonoid bio-synthesis genes while enhancing expression of other cell wall-related genes (Table 2). Together, these findings are consistent with the histological results in mature and distal stem sections: secondary growth was underdeveloped and cells from primary tissues were larger with less lignin and pectin compared with controls (Fig. 5). These results con-trast with reports in tomato where overexpressing SlSFT enhanced stem vascularization and stimulated expression of secondary cell wall-related genes (Shalit-Kaneh et al., 2019). We did not detect significant enrichment of sec-ondary cell wall-related genes in dCLCrV:GhSFT plants but, with a woody stem, cotton already has high expres-sion of these transcripts. GhSFT and GhSP transcripts were co-expressed with photosynthesis-related genes, and this finding is supported with MapMan analysis and RT–qPCR shown here, and photosynthesis measurements in leaves of mature plants (McGarry et al., 2016), and is consistent with the co-expression of SlSFT and SlSP with sucrose trans-porters in tomato stems. Notably, expression of CPN60α was enhanced when GhSFT or GhSP expression was altered (Fig. 4), consistent with the significant impact this chap-erone has for continued plant growth and development. The Arabidopsis CPN60α loss-of-function schlepperless and temperature-sensitive CPN60α2 allele show that disrup-tions to embryonic photosynthesis negatively impact post-germinative growth (Apuya et al., 2001; Sela et al., 2020). Collectively, these findings suggest a conserved mechanism for the determinacy status of the shoot apex to signal fu-ture source–sink relationships in developing vegetative (i.e. photosynthetic) organs.
Controlling indeterminate and determinate growth is im-portant for crop productivity and management. Indeed, the compact growth habits of several cotton branching mu-tants facilitate high-density planting, and these shorter sym-podial branches are attributed to mutations in the GhSP coding sequence (Si et al., 2018; Chen et al., 2019). Our use of TRV:GhSP-silenced plants allowed us to silence both homeologs simultaneously and thus investigate unique aspects of determinate growth, including termination of the main stem and arrested secondary growth, which are not observed among branching mutants. Our virus-based transient manipu-lation of GhSFT and GhSP expression enabled us to query how the balance of these gene products regulates determinate and indeterminate growth patterns in different G. hirsutum ac-cessions unamenable to standard transgenic strategies. We show that GhSFT and GhSP broadly regulate cotton architecture and accomplish this through interactions with multiple and different genetic networks early in development. The coord-inated actions of SFT and SP are needed to specify appro-priate building blocks, and fine-tuning their expression offers exciting applications for biotechnology and improving cotton agriculture.
Supplementary data
Supplementary data are available at JXB online.Fig. S1. Sample dendrogram and trait heat maps.Table S1. Oligonucleotides used for RT-qPCR. Table S2. Changes in GhSFT and GhSP expression are
quantified and correlate with the different virus treatments. Table S3. Overlapping TX701 and DP61 genes up- and
down-regulated with GhSFT and GhSP are identified from the Venn diagrams.
Table S4. Significantly differentially expressed genes related to photosynthesis are identified from the MapMan analysis.
Table S5. Significantly differentially expressed genes related to secondary metabolism are identified from the MapMan analysis.
Table S6. Significantly differentially expressed genes related to cell walls are identified from MapMan analysis.
Dataset S1. Cotton module–trait correlation values, Gene Ontology, and predicted protein domain enrichment analyses of cotton gene modules highly co-expressed with GhSFT or GhSP.
Dataset S2. Cotton module–trait correlation values and en-richment of Gene Ontology of cotton gene modules highly co-expressed with GhSFT.
Dataset S3. Cotton module–trait correlation values and en-richment of Gene Ontology of cotton gene modules highly co-expressed with GhSP.
Dataset S4, Tomato module–trait correlation values and Gene Ontology of tomato gene modules co-expressed with SlSFT.
Dataset S5. Tomato module–trait correlation values and Gene Ontology of tomato modules co-expressed with SlSP.
Data availability
Transcriptome data are deposited in the NCBI Gene Expression Omnibus (GSE144546).
Acknowledgements
We thank Dr Richard Dixon for use of the vibratome, Mr Emmanuel Ortiz for instructions on using the vibratome with woody specimens, and Dr Jaime Barros-Rios for suggestions to detect cell wall polymers. This research was supported by United States–Israel Binational Agricultural Research and Development Fund BARD Project number US-4535-12 (BGA) and Cotton Inc. Cooperative Agreement 16-414 (BGA and RCM). The authors have no conflicts of interest to declare.
Author contributions
BGA and RCM designed the experiments; RCM conducted the experi-ments; RCM, XR, QL, and EvdK analyzed the data; RCM wrote the paper with input from all authors.
ReferencesAbe M, Kobayashi Y, Yamamoto S, Daimon Y, Yamaguchi A, Ikeda Y, Ichinoki H, Notaguchi M, Goto K, Araki T. 2005. FD, a bZIP protein mediating signals from the floral pathway integrator FT at the shoot apex. Science 309, 1052–1056.
Aguilar-Martínez JA, Poza-Carrión C, Cubas P. 2007. Arabidopsis BRANCHED1 acts as an integrator of branching signals within axillary buds. The Plant Cell 19, 458–472.
Dow
nloaded from https://academ
ic.oup.com/jxb/article/71/19/5911/5879959 by U
niversity of Georgia user on 28 M
ay 2021
5922 | McGarry et al.
Ahn JH, Miller D, Winter VJ, Banfield MJ, Lee JH, Yoo SY, Henz SR, Brady RL, Weigel D. 2006. A divergent external loop confers antagon-istic activity on floral regulators FT and TFL1. The EMBO Journal 25, 605–614.
Ambavaram MM, Krishnan A, Trijatmiko KR, Pereira A. 2011. Coordinated activation of cellulose and repression of lignin biosynthesis pathways in rice. Plant Physiology 155, 916–931.
Apuya NR, Yadegari R, Fischer RL, Harada JJ, Zimmerman JL, Goldberg RB. 2001. The Arabidopsis embryo mutant schlepperless has a defect in the chaperonin-60a gene. Plant Physiology 126, 717–730.
Ashburner M, Ball CA, Blake JA, et al. 2000. Gene ontology: tool for the unification of biology. The Gene Ontology Consortium. Nature Genetics 25, 25–29.
Baumann K, Venail J, Berbel A, Domenech MJ, Money T, Conti L, Hanzawa Y, Madueno F, Bradley D. 2015. Changing the spatial pattern of TFL1 expression reveals its key role in the shoot meristem in control-ling Arabidopsis flowering architecture. Journal of Experimental Botany 66, 4769–4780.
Blackman BK, Strasburg JL, Raduski AR, Michaels SD, Rieseberg LH. 2010. The role of recently derived FT paralogs in sunflower domestication. Current Biology 20, 629–635.
Bouché F, Lobet G, Tocquin P, Périlleux C. 2016. FLOR-ID: an inter-active database of flowering-time gene networks in Arabidopsis thaliana. Nucleic Acids Research 44, D1167–D1171.
Chen W, Yao J, Li Y, et al. 2019. Nulliplex-branch, a TERMINAL FLOWER 1 ortholog, controls plant growth habit in cotton. Theoretical and Applied Genetics 132, 97–112.
Cho HT, Cosgrove DJ. 2000. Altered expression of expansin modulates leaf growth and pedicel abscission in Arabidopsis thaliana. Proceedings of the National Academy of Sciences, USA 97, 9783–9788.
Ditta G, Pinyopich A, Robles P, Pelaz S, Yanofsky MF. 2004. The SEP4 gene of Arabidopsis thaliana functions in floral organ and meristem identity. Current Biology 14, 1935–1940.
Goff SA, Vaughn M, McKay S, et al. 2011. The iPlant collaborative: cyberinfrastructure for plant biology. Frontiers in Plant Science 2, 34.
Hanano S, Goto K. 2011. Arabidopsis TERMINAL FLOWER1 is involved in the regulation of flowering time and inflorescence development through transcriptional repression. The Plant Cell 23, 3172–3184.
Hanzawa Y, Money T, Bradley D. 2005. A single amino acid converts a repressor to an activator of flowering. Proceedings of the National Academy of Sciences, USA 102, 7748–7753.
Ho WW, Weigel D. 2014. Structural features determining flower-promoting activity of Arabidopsis FLOWERING LOCUS T. The Plant Cell 26, 552–564.
Jaeger KE, Wigge PA. 2007. FT protein acts as a long-range signal in Arabidopsis. Current Biology 17, 1050–1054.
Langfelder P, Horvath S. 2008. WGCNA: an R package for weighted cor-relation network analysis. BMC Bioinformatics 9, 559.
Lifschitz E, Ayre BG, Eshed Y. 2014. Florigen and anti-florigen—a sys-temic mechanism for coordinating growth and termination in flowering plants. Frontiers in Plant Science 5, 1–14.
Lifschitz E, Eviatar T, Rozman A, Shalit A, Goldshmidt A, Amsellem Z, Alvarez JP, Eshed Y. 2006. The tomato FT ortholog triggers systemic sig-nals that regulate growth and flowering and substitute for diverse environ-mental stimuli. Proceedings of the National Academy of Sciences, USA 103, 6398–6403.
Liu B, Watanabe S, Uchiyama T, et al. 2010. The soybean stem growth habit gene Dt1 is an ortholog of Arabidopsis TERMINAL FLOWER1. Plant Physiology 153, 198–210.
McGarry RC, Prewitt SF, Culpepper S, Eshed Y, Lifschitz E, Ayre BG. 2016. Monopodial and sympodial branching architecture in cotton is differentially regulated by the Gossypium hirsutum SINGLE FLOWER TRUSS and SELF-PRUNING orthologs. New Phytologist 212, 244–258.
Mitra PP, Loqué D. 2014. Histochemical staining of Arabidopsis thaliana secondary cell wall elements. Journal of Visual Experiments 87, e51381.
Niwa M, Daimon Y, Kurotani K, et al. 2013. BRANCHED1 interacts with FLOWERING LOCUS T to repress the floral transition of the axillary meri-stems in Arabidopsis. The Plant Cell 25, 1228–1242.
Novaes E, Kirst M, Chiang V, Winter-Sederoff H, Sederoff R. 2010. Lignin and biomass: a negative correlation for wood formation and lignin content in trees. Plant Physiology 154, 555–561.
Pin PA, Benlloch R, Bonnet D, Wremerth-Weich E, Kraft T, Gielen JJL, Nilsson O. 2010. An antagonistic pair of FT homologs mediates the control of flowering time in sugar beet. Science 330, 1397–1400.
Pnueli L, Gutfinger T, Hareven D, Ben-Naim O, Ron N, Adir N, Lifschitz E. 2001. Tomato SP-interacting proteins define a conserved signaling system that regulates shoot architecture and flowering. The Plant Cell 13, 2687–2702.
Prewitt SF, Ayre BG, McGarry RC. 2018. Cotton CENTRORADIALIS/TERMINAL FLOWER 1/SELF-PRUNING genes functionally diverged to dif-ferentially impact plant architecture. Journal of Experimental Botany 69, 5403–5417.
Ratcliffe OJ, Amaya I, Vincent CA, Rothstein S, Carpenter R, Coen ES, Bradley DJ. 1998. A common mechanism controls the life cycle and architecture of plants. Development 125, 1609–1615.
R Development Core Team. 2013. R: a language and environment for stat-istical computing. Vienna, Austria: R Foundation for Statistical Computing.
Rick CM. 1978. The tomato. Scientific American 239, 76–87.
Saski CA, Scheffler BE, Hulse-Kemp AM, et al. 2017. Sub genome an-chored physical frameworks of the allotetraploid Upland cotton (Gossypium hirsutum L.) genome, and an approach toward reference-grade assemblies of polyploids. Scientific Reports 7, 15274.
Schuetz M, Benske A, Smith RA, Watanabe Y, Tobimatsu Y, Ralph J, Demura T, Ellis B, Samuels AL. 2014. Laccases direct lignification in the discrete secondary cell wall domains of protoxylem. Plant Physiology 166, 798–807.
Sela A, Piskurewicz U, Megies C, Mène-Saffrané L, Finazzi G, Lopez-Molina L. 2020. Embryonic photosynthesis affects post-germination plant growth. Plant Physiology 182, 2166–2181.
Shalit A, Rozman A, Goldshmidt A, Alvarez JP, Bowman JL, Eshed Y, Lifschitz E. 2009. The flowering hormone florigen functions as a general systemic regulator of growth and termination. Proceedings of the National Academy of Sciences, USA 106, 8392–8397.
Shalit-Kaneh A, Eviatar-Ribak T, Horev G, Suss N, Aloni R, Eshed Y, Lifschitz E. 2019. The flowering hormone florigen accelerates secondary cell wall biogenesis to harmonize vascular maturation with reproductive de-velopment. Proceedings of the National Academy of Sciences, USA 116, 16127–16136.
Shannon S, Meeks-Wagner DR. 1991. A mutation in the Arabidopsis TFL1 gene affects inflorescence meristem development. The Plant Cell 3, 877–892.
Si Z, Liu H, Zhu J, et al. 2018. Mutation of SELF-PRUNING homologs in cotton promotes short-branching plant architecture. Journal of Experimental Botany 69, 2543–2553.
Silva WB, Vicente MH, Robledo JM, Reartes DS, Ferrari RC, Bianchetti R, Araújo WL, Freschi L, Peres LEP, Zsögön A. 2018. SELF-PRUNING acts synergistically with DIAGEOTROPICA to guide auxin responses and proper growth form. Plant Physiology 176, 2904–2916.
Sluis A, Hake S. 2015. Organogenesis in plants: initiation and elaboration of leaves. Trends in Genetics 31, 300–306.
Supek F, Bošnjak M, Škunca N, Šmuc T. 2011. REVIGO summarizes and visualizes long lists of gene ontology terms. PLoS One 6, e21800.
Taoka K, Ohki I, Tsuji H, et al. 2011. 14-3-3 proteins act as intracellular receptors for rice Hd3a florigen. Nature 476, 332–335.
Taylor-Teeples M, Lin L, de Lucas M, et al. 2015. An Arabidopsis gene regulatory network for secondary cell wall synthesis. Nature 517, 571–575.
The Gene Ontology Consortium. 2019. The gene ontology resource: 20 years and still GOing strong. Nucleic Acids Research 47, D330–D338.
Thimm O, Bläsing O, Gibon Y, Nagel A, Meyer S, Krüger P, Selbig J, Müller LA, Rhee SY, Stitt M. 2004. MAPMAN: a user-driven tool to dis-play genomics data sets onto diagrams of metabolic pathways and other biological processes. The Plant Journal 37, 914–939.
Tomato Genome Consortium. 2012. The tomato genome sequence pro-vides insights into fleshy fruit evolution. Nature 485, 635–641.
Trapnell C, Pachter L, Salzberg SL. 2009. TopHat: discovering splice junctions with RNA-Seq. Bioinformatics 25, 1105–1111.
Trapnell C, Williams BA, Pertea G, Mortazavi A, Kwan G, van Baren MJ, Salzberg SL, Wold BJ, Pachter L. 2010. Transcript assembly and quantification by RNA-Seq reveals unannotated tran-scripts and isoform switching during cell differentiation. Nature Biotechnology 28, 511–515.
Dow
nloaded from https://academ
ic.oup.com/jxb/article/71/19/5911/5879959 by U
niversity of Georgia user on 28 M
ay 2021
SFT and SP networks influence cotton growth patterns | 5923
Wan CY, Wilkins TA. 1994. A modified hot borate method significantly en-hances the yield of high-quality RNA from cotton (Gossypium hirsutum L.). Analytical Biochemistry 223, 7–12.
Wang HZ, Dixon RA. 2012. On–off switches for secondary cell wall bio-synthesis. Molecular Plant 5, 297–303.
Wang Z, Zhou Z, Liu Y, et al. 2015. Functional evolution of phosphatidylethanolamine binding proteins in soybean and Arabidopsis. The Plant Cell 27, 323–336.
Wigge PA, Kim MC, Jaeger KE, Busch W, Schmid M, Lohmann JU, Weigel D. 2005. Integration of spatial and temporal information during floral induction in Arabidopsis. Science 309, 1056–1059.
Yang Z, Ge X, Yang Z, et al. 2019. Extensive intraspecific gene order and gene structural variations in upland cotton cultivars. Nature Communications 10, 2989.
Yeager AF. 1927. Determinate growth in tomato. Journal of Heredity 18, 263–265.
Zhang BP, Horvath S. 2005. A general framework for weighted gene co-expression network analysis. Statistical Applications in Genetics and Molecular Biology 4, Article 17.
Zhao Q, Dixon R. 2011. Transcriptional networks for lignin biosyn-thesis: more complex than we thought? Trends in Plant Science 16, 227–233.
Zhao Q, Nakashima J, Chen F, Yin Y, Fu C, Yun J, Shao H, Wang X, Wang Z-Y, Dixon RA. 2013. LACCASE is neces-sary and nonredundant with PEROXIDASE for lignin polymeriza-tion during vascular development in Arabidopsis. The Plant Cell 25, 3976–3987.
Dow
nloaded from https://academ
ic.oup.com/jxb/article/71/19/5911/5879959 by U
niversity of Georgia user on 28 M
ay 2021