Embed Size (px)
Citation preview

Single-Family Credit Risk Transfer HandbookSTACR and ACIS
Freddie Mac | 2019
Executive Message
Single-Family Credit Risk Transfer Handbook
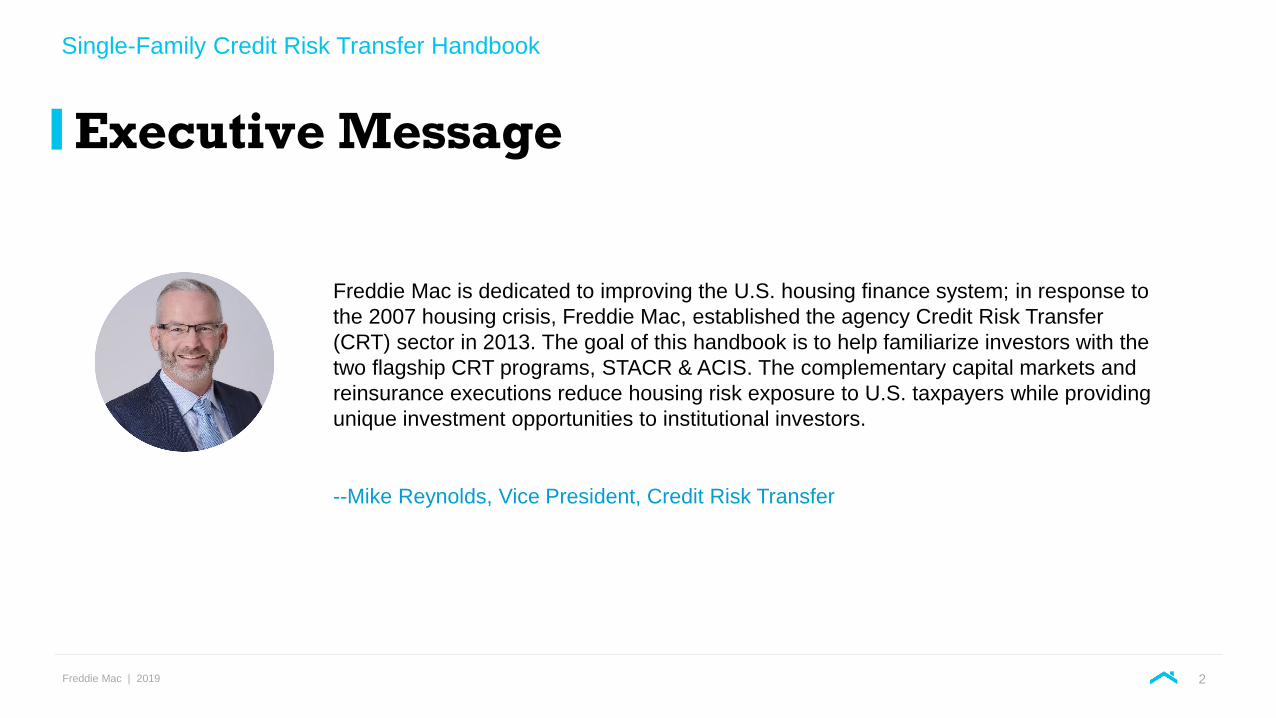
Freddie Mac is dedicated to improving the U.S. housing finance system; in response to
the 2007 housing crisis, Freddie Mac, established the agency Credit Risk Transfer
(CRT) sector in 2013. The goal of this handbook is to help familiarize investors with the
two flagship CRT programs, STACR & ACIS. The complementary capital markets and
reinsurance executions reduce housing risk exposure to U.S. taxpayers while providing
unique investment opportunities to institutional investors.
--Mike Reynolds, Vice President, Credit Risk Transfer
2

ContentsHow Freddie Mac Makes Home Possible 4
Single-Family Credit Risk Transfer (CRT) 7
1. CRT Overview 8
2. Transaction Overview 13
3. Loss Overview 23
4. Investors & Liquidity 26
Credit Risk Management Framework 33
1. Overview 34
2. Loss Mitigation 40
3. Home Possible 47
Collateral Performance 50
U.S. Housing Market Overview 62
Resources 68
Appendix 74
1. Transaction Considerations 76

How Freddie Mac Makes Home Possible
Single-Family Credit Risk Transfer Handbook
Freddie Mac | 2019
Freddie Mac’s Role in U.S. Housing Finance
How Freddie Mac Makes Home Possible
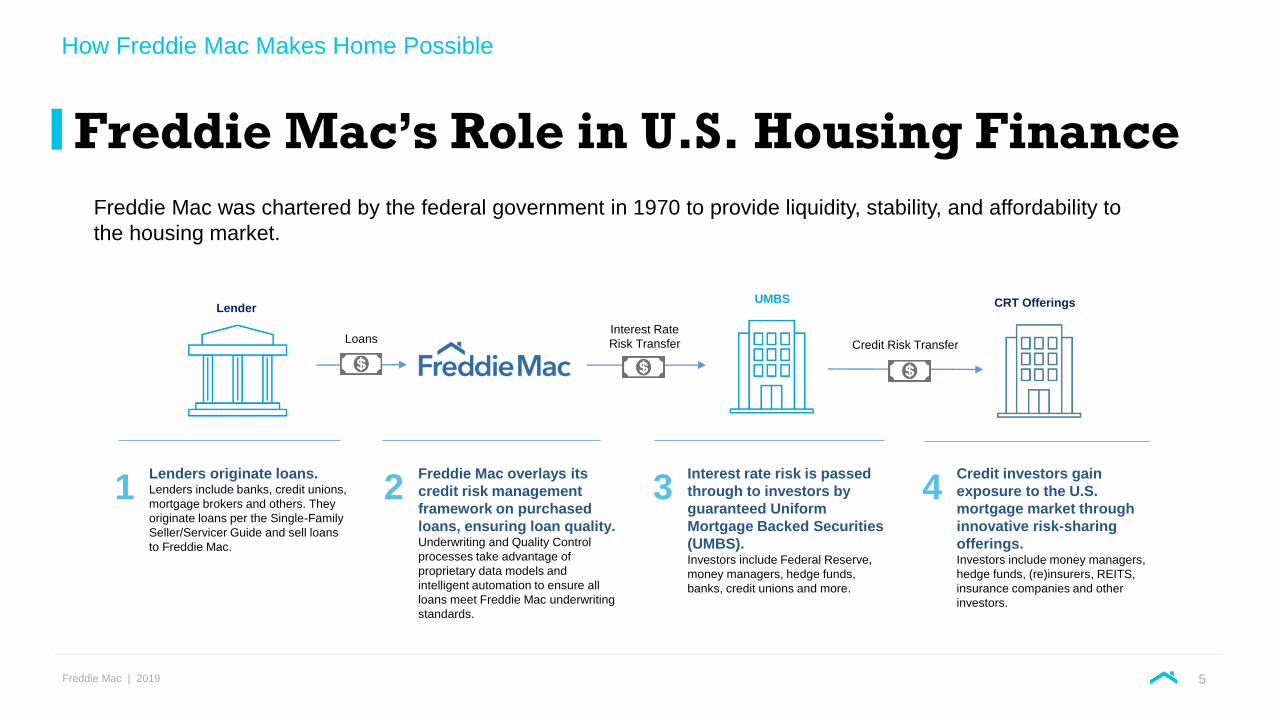
Freddie Mac was chartered by the federal government in 1970 to provide liquidity, stability, and affordability to
the housing market.
5
1Lenders originate loans. Lenders include banks, credit unions,
mortgage brokers and others. They
originate loans per the Single-Family
Seller/Servicer Guide and sell loans
to Freddie Mac.
2Freddie Mac overlays its
credit risk management
framework on purchased
loans, ensuring loan quality. Underwriting and Quality Control
processes take advantage of
proprietary data models and
intelligent automation to ensure all
loans meet Freddie Mac underwriting
standards.
3Interest rate risk is passed
through to investors by
guaranteed Uniform
Mortgage Backed Securities
(UMBS).Investors include Federal Reserve,
money managers, hedge funds,
banks, credit unions and more.
4Credit investors gain
exposure to the U.S.
mortgage market through
innovative risk-sharing
offerings.Investors include money managers,
hedge funds, (re)insurers, REITS,
insurance companies and other
investors.
Lender
Interest Rate
Risk Transfer Credit Risk Transfer
UMBS CRT Offerings
Loans

Freddie Mac | 2019
Sustainable Business Model
How Freddie Mac Makes Home Possible
6
Credit Risk TransferStructured Agency Credit Risk (STACR®) Trust: Freddie
Mac’s flagship securitization credit risk sharing vehicle.
STACR transactions transfer risk to the private capital markets
through the issuance of unsecured and non-guaranteed notes.
The bankruptcy-remote trust makes periodic payments of
principal and interest on the notes to investors.
Agency Credit Insurance Structure (ACIS®): Freddie Mac’s
flagship insurance-based credit risk sharing vehicle. ACIS
transactions are insurance policies issued by or ceded to
global (re)insurance companies to cover a portion of credit risk
on the STACR or standalone reference pools. Freddie Mac
pays monthly premiums to (re)insurers, based on their tranche
participation, in exchange for claim coverage on their portion of
the reference pool.
Interest Rate Risk TransferUniform Mortgage Backed Securities (UMBS): pass-
through securities representing an undivided interest in a
pool of residential mortgages which transfer interest rate risk
to investors. Freddie Mac guarantees the timely payment of
interest and scheduled principal on all UMBS’ issued by
Freddie Mac. Old
Mo
de
lN
ew
Mo
de
l
Buy and Hold Credit Risk
Mortgage
Lenders
Interest Rate Risk
InvestorsFreddie Mac
Credit Risk
Interest Rate Risk
Credit Risk
Credit Risk
Interest Rate Risk
Freddie Mac
Buy and Transfer Credit Risk
Mortgage
Lenders
Credit Risk
Interest Rate Risk
InvestorsFreddie Mac
Credit Risk
Interest Rate Risk
Freddie Mac
Mortgage

Single-Family Credit Risk Transfer (CRT)
Single-Family Credit Risk Transfer Handbook

1. CRT OverviewSingle-Family Credit Risk Transfer (CRT)

Freddie Mac | 2019
Highlights
CRT Overview
9
110+CRT transactions to date
240+CRT Unique Investors
$51 Billion Issued in securitization and
insurance coverage
$1.4 TrillionMortgages Credit Protected
As the founder of the GSE CRT market, Freddie Mac is constantly innovating to improve the housing finance
system. Since inception, Freddie Mac’s award-winning CRT program has accomplished the following:
2015
RMBS Deal of the Year RMBS Deal of the YearRMBS Deal of the Year
2016 2019
As of 9/30/2019

Freddie Mac | 2019
Offerings
CRT Overview
10
Securities (Re)Insurance Contracts Insured-Placed MI
STACR®
Structured Agency Credit Risk
ACIS®
Agency Credit Insurance Structure
AFRMSM
ACIS Forward Risk Mitigation
IMAGINSM
Integrated Mortgage InsuranceSM
Issuance/Insurance Type REMIC Notes Trust Notes Debt Notes Aggregate Excess of Loss Credit (Re)insurance Mortgage Insurance
Primary ParticipantsMoney Managers, Hedge Funds, REITs,
Sovereign Funds, Insurance Companies(Re)insurance Companies
(Re)insurance/Mortgage
Insurance Companies
Bond/Policy StructureMulti-Class: Investment Grade, Non-
Investment Grade, Not RatedMulti-Class
(Re)insurance Policy
Multi-Class Forward
(Re)insurance Policy
Insured-Placed
Mortgage Insurance
Flagship Series Collateral Offering
DNA On-the-run loans with original loan-to-value ratios of 61-80% STACR/ACIS
HQA On-the-run loans with original loan-to-value ratios of 81-97% STACR/ACIS
Additional Series Collateral Offering
FTR Off-the-run STACR/ACIS
SAP 15-year loans ACIS

Freddie Mac | 2019
Evolution of an Asset Class
CRT Overview
2014
Building Tools:
- Introduce HQ series (>80%
LTV)
- Sell more mezzanine risk
2011 & 2012
Inception:
- Freddie Mac establishes team
to generate CRT concepts
- FHFA publishes strategic plan
for CRT and guidelines
governing GSE risk sharing
2015
Achieve Scale & Depth:
- New CRT offerings: Seller Facing
CRT (front-end CRT) and Freddie
Mac Whole Loan SecuritiesSM (WLS)
- All CRT programs begin transferring
actual loss in lieu of fixed severity
(removes mark to market volatility)
2013
Establish the Market:
- Pioneer the first STACR (debt) and ACIS
(reinsurance) transactions
- Historical loan level data released
- First STACR transaction (debt)
- Focused on 60-80% LTV fixed-rate collateral
2016 & 2017
Further Development:
- Home Affordable Refinance Program® (HARP)
Historical Data release
- Expand ACIS to include 15-year fixed rate loans
- Introduce front end CRT (ACIS/Deep MI) to
transfer risk simultaneously upon acquisition
- Inaugural STACR SPI transaction
- Inaugural STACR HARP transaction
2018
Continued Expansion:
- Inaugural STACR Trust transaction
- STACR extends term to 30 years and sells
Class B-2 notes with 10 bps Credit
Enhancement
- Integrated Mortgage InsuranceSM
(IMAGINSM) launches, bringing new capital
sources for HLTV lending
2019
Progress:
- STACR REMIC
- Introduction of Off-the-Run (FTR)
series including sales of seasoned
B2 notes
- Clarity investor tool released
11

Freddie Mac | 2019
STACR/ACIS CRT Growth
CRT Overview
Cumulative single-family transferred credit risk based on outstanding balance at period end ($ Billions)
Total single-family credit guarantee portfolio with
transferred credit risk ($ Billions)
Data includes STACR, ACIS, and Deep MI Freddie Mac CRT products as of June 30, 2019
$385
$598
$858
$1,144 $1,270
$329 $457 $648 $838 $911
19%
26%
35%
44%47%
0%
5%
10%
15%
20%
25%
30%
35%
40%
45%
50%
$0
$200
$400
$600
$800
$1,000
$1,200
$1,400
2015 2015 2017 2018 2019 YTD*
Reference pool UPB at issuance
Reference pool UPB outstanding
Outstanding reference pool UPB as a percentage of total single-familyportfolio
$24.5 $24.8 $26.4
$28.1 $28.1
$1.9 $1.6 $2.4 $1.7 $1.3
$3.9 $4.4 $5.3 $6.1 $6.7 $5.6 $5.5 $5.9 $5.8 $5.9
Q2 2018 Q3 2018 Q4 2018 Q1 2019 Q2 2019
Mezzanine loss positions: Transferred to third parties
First loss positions: Retained by Freddie Mac
First loss positions: Transferred to third parties
Mezzanine loss positions: Retained by Freddie Mac
12

2. Transaction Overview
Single-Family Credit Risk Transfer (CRT) Business

Freddie Mac | 2019
CRT Business Process
Transaction Overview
Borrower
Institutions make loans to
homeowners; Freddie
Mac purchases or
guarantees those loans
UMBS
Loans purchased are
grouped and sold to
UMBS investors, reducing
interest rate risk held by
Freddie Mac
CRT Eligibility
Loans sold in UMBS
securities that meet CRT
eligibility criteria are
included in a CRT
reference pool
Transaction
Once the reference pool
is finalized, credit risk is
transferred to investors
through STACR & ACIS
transactions
14

Freddie Mac | 2019
Reference Pool Creation Illustration
Transaction Overview
15
Total Loans
Securitized in
UMBS Q1
$81 billion
Reference
Pool
Eligibility
Criteria
Initial
Cohort
$28 billion
Loan
Performance
Removals
➢ Incomplete data reconciliation
➢ Corrected data
➢ Repurchased
➢ Removed by QC
process
➢ Paid in full
➢ Failed delinquency
criteria
➢ Bankruptcy
➢ 100% fully amortizing
➢ Fixed-rate
➢ 1-to-4 unit
➢ First lien mortgage loans
➢ Original terms of 241-360
months
➢ No loans originated under
Relief Refinance programs
➢ Meets transaction specific
LTV criteria (61-80 LTV for
DNA; 81-97 LTV for HQA)
Reference
Pool
$26 billion
STACR &
ACIS
Transaction

Freddie Mac | 2019
STACR & ACIS Capital Structure
Transaction Overview
16
Hypothetical Allocation of Principal Payments
Specified Credit and Modification Events
Class M-1H
Class M-2H
Class B-1H
Class B-2H
Class B-3H (Reference Tranche Only)
STACR NotesRetained
Credit Risk
Class A-H
(Reference Tranche Only)
STACR M-1
STACR M-2
STACR B-1
STACR B-2
ACIS M-1
ACIS M-2
ACIS B-1
ACIS B-2
ACIS Contracts
Reference Pool
STACR & ACIS are complementary programs issued from the same reference pool for On-the-Run transactions
Freddie Mac | 2019
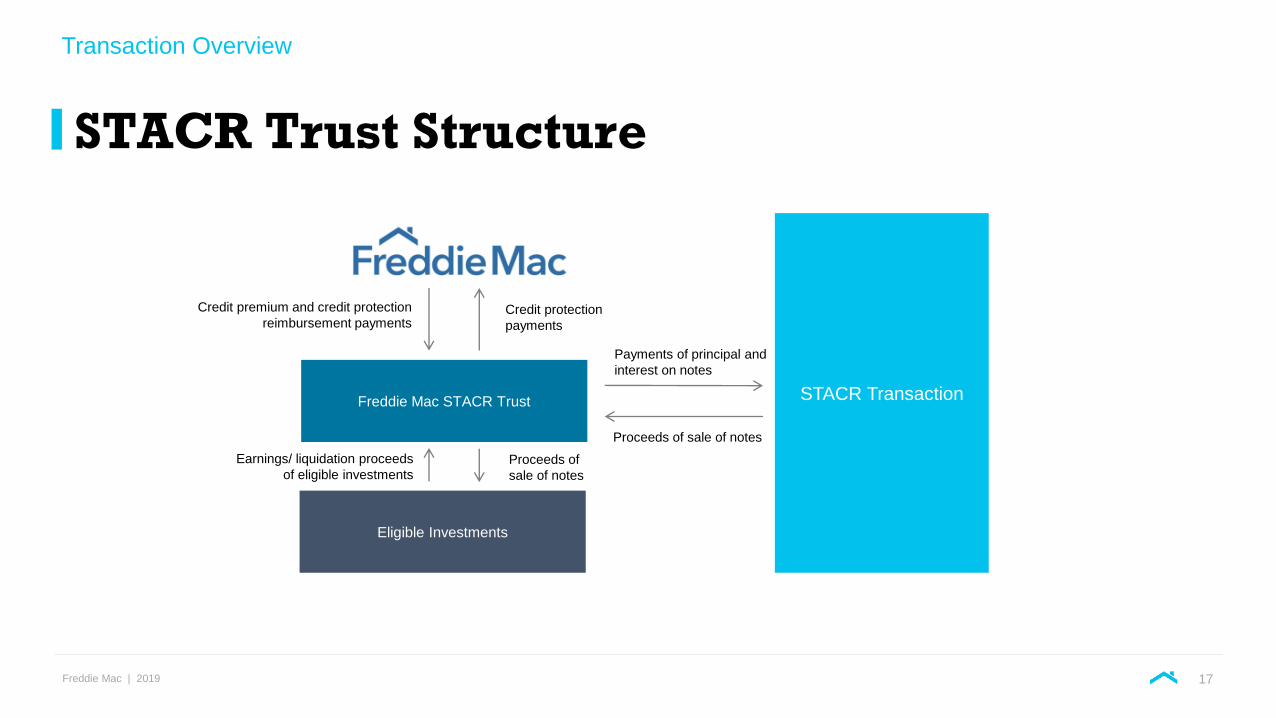
STACR Trust Structure
Transaction Overview
17
Payments of principal and
interest on notes
Freddie Mac STACR Trust
Eligible Investments
Credit protection
payments
Credit premium and credit protection
reimbursement payments
Earnings/ liquidation proceeds
of eligible investments
Proceeds of sale of notes
Proceeds of
sale of notes
STACR Transaction

Freddie Mac | 2019
Aligns with key principles of STACR program
Most features of STACR securities will remain largely unchanged:
STACR REMIC
Transaction Overview
18
Freddie Mac continues efforts to make a positive impact on the CRT market with the introduction of STACR REMIC
STACR Trust STACR REMIC
▪ Reduces counterparty risk exposure
to Freddie Mac
▪ Avoids any disruption of the TBA
market
▪ No tax withholding
▪ REIT friendly
▪ No Commodity Pool Operator (CPO)
requirements
▪ Benefits to international investors:
▪ Regulation S Offering
▪ No tax withholding
Incremental Enhancements
▪ Uncapped 1M LIBOR floater
▪ Reference pool selection criteria
▪ Freddie Mac retained credit risk
▪ Capital structure
▪ Cash flows
▪ Loss Calculations

Freddie Mac | 2019
STACR REMIC Structure
Transaction Overview
19
Hypothetical Allocation of Principal Payments
Specified Credit and Modification Events
Class M-1H
Class M-2H
Class B-1H
Class B-2H
Class B-3H
(Reference Tranche Only)
STACR Notes
Offered at ClosingRetained
Credit Risk
Class A-H
(Reference Tranche Only)
Class M-1
Class M-2
Class B-1
Class B-2
Reference Pool
Trust issues Notes
Receives cash Proceeds
Capital Contribution Amount
Transfer Amount
Return Reimbursement Amount
Freddie Mac STACR REMIC Trust
Liquidation Proceeds
cover Return Amounts
Earnings and
Liquidation Proceeds
Trust pays interest
(uncapped LIBOR floater)
Trust repays principal
less credit and applicable
modification lossesCash
Proceeds
IO Q-REMIC Interests
Eligible Investments

Freddie Mac | 2019
ACIS Structure
Transaction Overview
20
(Re)insurers have option to contract directly or indirectly (via cell company) with Freddie Mac
Cell issues quota share reinsurance contract to the reinsurers
Net amount of claims and
premiums flow through cell
Direct
Cut
Through
Indirect Policy
Freddie Mac executes a primary
insurance policy with a cell company
Cell Company
(Re)insurer #1
Collateral
Trust
(Re)insurer #2
Collateral
Trust
(Re)insurer #3
Collateral
Trust
(Re)insurer #4
Collateral
Trust
Direct Policy
(Re)insurer #1
Collateral
Trust
Freddie Mac executes a primary
insurance policy directly with (re)insurers
(Re)insurer #2
Collateral
Trust
(Re)insurer #3
Collateral
Trust
(Re)insurer #4
Collateral
Trust

Freddie Mac | 2019
Transaction Example & Program Comparisons
Transaction Overview
21
For Illustrative Purposes Only
STACR ACIS
Maturity 30-year loan term 12.5 year
Early
Termination
Earlier of: (a) 10% or less pool
factor or (b) on or after 120th
payment date (10 years)
5 year; If not called at year 5
reverts to STACR language
Qualified
Buyer
Qualified Institutional Buyer
“QIB”
Approved Counterparty
Coupon 1 Month Libor plus spread Fixed rate
Liquidity 8-10 broker/dealers make
active markets daily
Investor posts collateral for a
portion of risk insured; buy and
hold position with the ability to
seek further reinsurance from a
third party; interest paid based on
notional amount
Triggers • Minimum Credit
Enhancement Test
• Delinquency Test
• Cumulative Net Loss Test
Same as STACR
Other • 144A Compliant
• Minimum Denomination
$10,000
• Minimum Increment $1
N/A
Early
Redemption*Maturity*
Tranche Loss CoverageExpected
RatingsBalance WAL
Principal
WindowWAL
Principal
Window
Attach Detach STACR ACIS 10% 10% 10% 10%
M-1 3.50% 4.25% Investment Grade $110m $36m 1.2 6−25 1.2 6–25
M-2 1.10% 3.50% Rated $352m $115m 5.7 25–120 5.8 25–132
B-1 0.60% 1.10% Rated/Not Rated $73m $24m 10.0 120–120 12.9 132–182
B-2 0.10% 0.60% Not Rated $73m $24m 10.0 120– 20 18.8 182–292
Total $608m $199m*Assume stated CPR & 0 CDR; WAL in years,
principal window in months

Freddie Mac | 2019
Introduces operational efficiencies to the mortgage market
Eliminates duplicative processes and shortens underwriting time
Single underwriting guide and credit box for the lender
Lenders and servicers work solely and directly with Freddie Mac
Lowers costs for lenders & borrowers
Reduces the traditional sales/operational costs of traditional MI
Diversifies private capital sources
Level playing field for lenders of all sizes – same pricing for all lenders
Enables better management of taxpayer exposure
Freddie Mac works with highly rated and diversified global reinsurers who place aside
secured collateral to pay claim liabilities
No ability for the insurer/reinsurer to unilaterally rescind coverage
IMAGIN Overview
Transaction Overview
22
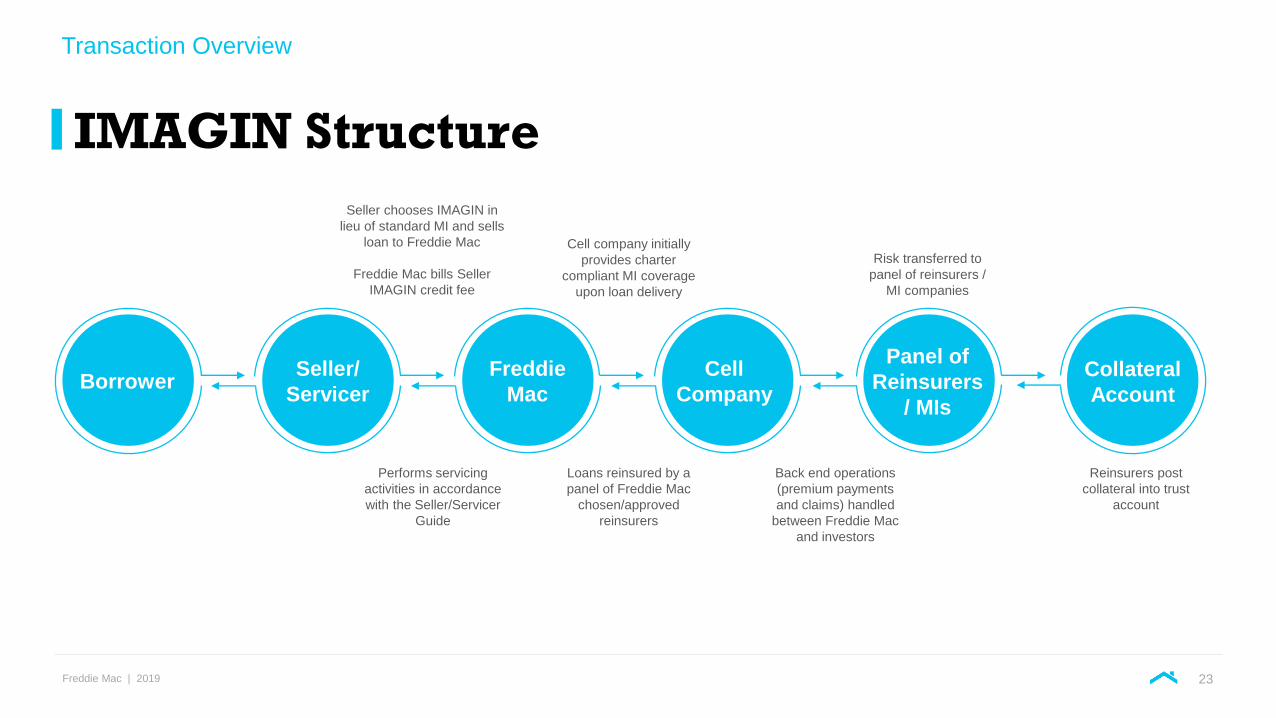
IMAGIN is an enhanced form of front-end mortgage insurance negotiated by Freddie Mac on behalf of borrowers
Freddie Mac | 2019
IMAGIN Structure
Transaction Overview
23
Seller chooses IMAGIN in
lieu of standard MI and sells
loan to Freddie Mac
Freddie Mac bills Seller
IMAGIN credit fee
Cell company initially
provides charter
compliant MI coverage
upon loan delivery
Risk transferred to
panel of reinsurers /
MI companies
Performs servicing
activities in accordance
with the Seller/Servicer
Guide
Loans reinsured by a
panel of Freddie Mac
chosen/approved
reinsurers
Reinsurers post
collateral into trust
account
Back end operations
(premium payments
and claims) handled
between Freddie Mac
and investors
BorrowerSeller/
Servicer
Freddie
Mac
Cell
Company
Panel of
Reinsurers
/ MIs
Collateral
Account

Freddie Mac | 2019
IMAGIN Comparison
Transaction Overview
Feature BPMI LPMI IMAGIN
Buyer of MI Lender Lender Freddie Mac
MI Premium Paid By Borrower Lender Freddie Mac
Payment of Coverage One-time or monthly insurance paymentOne-time, monthly, or annual payment which
is built into the note rate
Similar to LPMI, the cost of IMAGIN is
embedded in the borrower note rate
Lower Mortgage Payment Through
Cancellation of the MIYes No No
MI CancellationAutomatic cancellation once LTV drops below
78%None – MI coverage exists for life of loan None – MI coverage exists for 10-year term
MI Rescissions & Denials Yes Yes No
Length/Term of Coverage Terminates upon cancellation Life of loan 10-year term
PolicyApproved MI companies – Selected by
borrower/lender
Approved MI companies – Selected by
borrower/lenderNegotiated by Freddie Mac
Origination Guidelines GSE and MI Guidelines GSE and MI Guidelines Freddie Mac Guidelines
Loan Quality Reviews GSE and MI Guidelines GSE and MI Guidelines Freddie Mac Quality Control
Loan Performance Reporting Servicer works with both GSE and MI Servicer works with both GSE and MI Servicer works directly with Freddie Mac
Loss Mitigation and Property Disposition
Approvals
GSE and MI Loss Mitigation and Approval
requirements
GSE and MI Loss Mitigation and Approval
requirements
Freddie Mac Loss Mitigation and Approval
requirements
Claim Filing Servicer files claims Servicer files claims Freddie Mac files claims
24

3. Loss OverviewSingle-Family Credit Risk Transfer (CRT) Business

Freddie Mac | 2019
Disposition Loss
Loss Overview
26
Allocation of Disposition Loss*
Disposition
Loss =
1 (+) UPB at time of removal from the Reference Pool (including prior principal forgiveness)
2 (-) Net Sales Proceeds
3 (+)Delinquent Accrued Interest (Non-Capitalized)
Interest Bearing UPB * min(Note Rate – 35bps, Accounting Net Yield) * (# of Months Delinquent/12)
4 (+) Taxes and Insurance
5 (+) Legal Costs
6 (+)Maintenance and Preservation Costs (e.g. Property Inspection, HOA, Utilities, Rental Receipts,
REO Management, etc.)
7 (-) MI Proceeds (Total Claim Amount * Coverage %)
8 (+) Miscellaneous Expenses (e.g. BPO, other sales expenses not included in item 2 above)
9 (-)Miscellaneous Credits (e.g. Positive Escrow, Insurance Refunds, Hazard Claim Proceeds, Make
Whole Events, etc.)
*For Illustrative Purposes Only
1. Class B-3 Principal
2. Class B-2 Principal
3. Class B-1 Principal
4. Class M-2 Principal
5. Class M-1 Principal
6. Class A Principal

Freddie Mac | 2019
Modification Loss
Loss Overview
27
Allocation of Modification Loss*
Modification
Loss =
1 (+)Modification Costs
e.g. Interest Short Fall (Passed to investors on a monthly basis included in modification loss amount)
2 (+) Bankruptcy Cramdown Costs (Passed to investors on a monthly basis included in write down loss amount)
*For Illustrative Purposes Only
1. Class B-3 Interest
2. Class B-3 Principal
3. Class B-2 Interest
4. Class B-2 Principal
5. Class B-1 Interest
6. Class B-1 Principal
7. Class M-2 Interest
8. Class M-2 Principal
9. Class M-1 Interest
10. Class M-1 Principal
Modification Hierarchy Investor Impact Borrower Impact
Term Extension No ImpactLoan term is extended to reduce borrower
monthly payments
Interest Rate Reduction Loss of interest from rate change Reduces monthly payment
Principal ForbearanceLoss of interest as principal with forbearance is
non-interest bearing
Suspension of mortgage payments for a specific
period of time which is paid as a balloon payment
upon termination of the loan

4. Investors & Liquidity
Single-Family Credit Risk Transfer (CRT) Business

Freddie Mac | 2019
Investor Participation at Issuance
Investors & Liquidity
29
Money ManagerHedge Fund Insurance REIT Sovereign Fund
In addition to the participation shown above, ACIS is generally responsible for 25% of each tranche issued for (Re)insurer participation
6% 6%
92%85% 92% 78%
2%7% 8%
5%
4% 10%
2018 DNA 2019 DNA 2018 HQA 2019 HQA
M-1
45%
70%83% 79%
40%
19%
17%7%
14%11%
15%
2018 DNA 2019 DNA 2018 HQA 2019 HQA
B-1
46%33% 42% 33%
48%58% 47%
54%
1%6% 7%12% 13%
2018 DNA 2019 DNA 2018 HQA 2019 HQA
M-2
72% 74%63%
73%
25% 23% 37% 25%
4% 4%
2018 DNA 2019 DNA 2018 HQA 2019 HQA
B-2
Data as End of Q2

Freddie Mac | 2019
Investor Count per Tranche
Investors & Liquidity
30
101316192225283134
19-HQA1 19-DNA2 19-HQA2 19-DNA3
B1
101316192225283134
19-HQA1 19-DNA2 19-HQA2 19-DNA3
M1
101316192225283134
19-HQA1 19-DNA2 19-HQA2 19-DNA3
M2
101316192225283134
19-HQA1 19-DNA2 19-HQA2 19-DNA3
B2
Freddie Mac | 2019
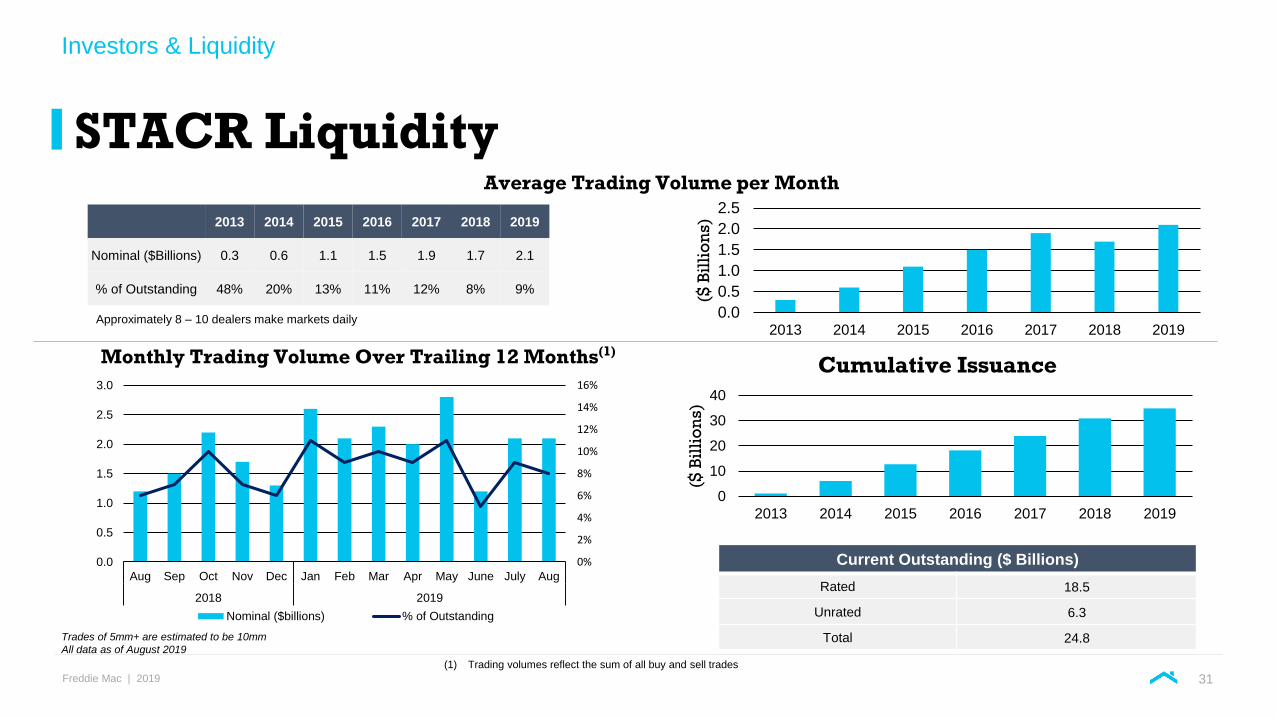
STACR Liquidity
Investors & Liquidity
31(1) Trading volumes reflect the sum of all buy and sell trades
Current Outstanding ($ Billions)
Rated 18.5
Unrated 6.3
Total 24.8
2013 2014 2015 2016 2017 2018 2019
Nominal ($Billions) 0.3 0.6 1.1 1.5 1.9 1.7 2.1
% of Outstanding 48% 20% 13% 11% 12% 8% 9%
Average Trading Volume per Month
Monthly Trading Volume Over Trailing 12 Months(1)
0.0
0.5
1.0
1.5
2.0
2.5
2013 2014 2015 2016 2017 2018 2019
($ B
illi
on
s)
Trades of 5mm+ are estimated to be 10mm
All data as of August 2019
Approximately 8 – 10 dealers make markets daily
0%
2%
4%
6%
8%
10%
12%
14%
16%
0.0
0.5
1.0
1.5
2.0
2.5
3.0
Aug Sep Oct Nov Dec Jan Feb Mar Apr May June July Aug
2018 2019
Nominal ($billions) % of Outstanding
0
10
20
30
40
2019201820172016201520142013
($ B
illi
on
s)
Cumulative Issuance
Freddie Mac | 2019
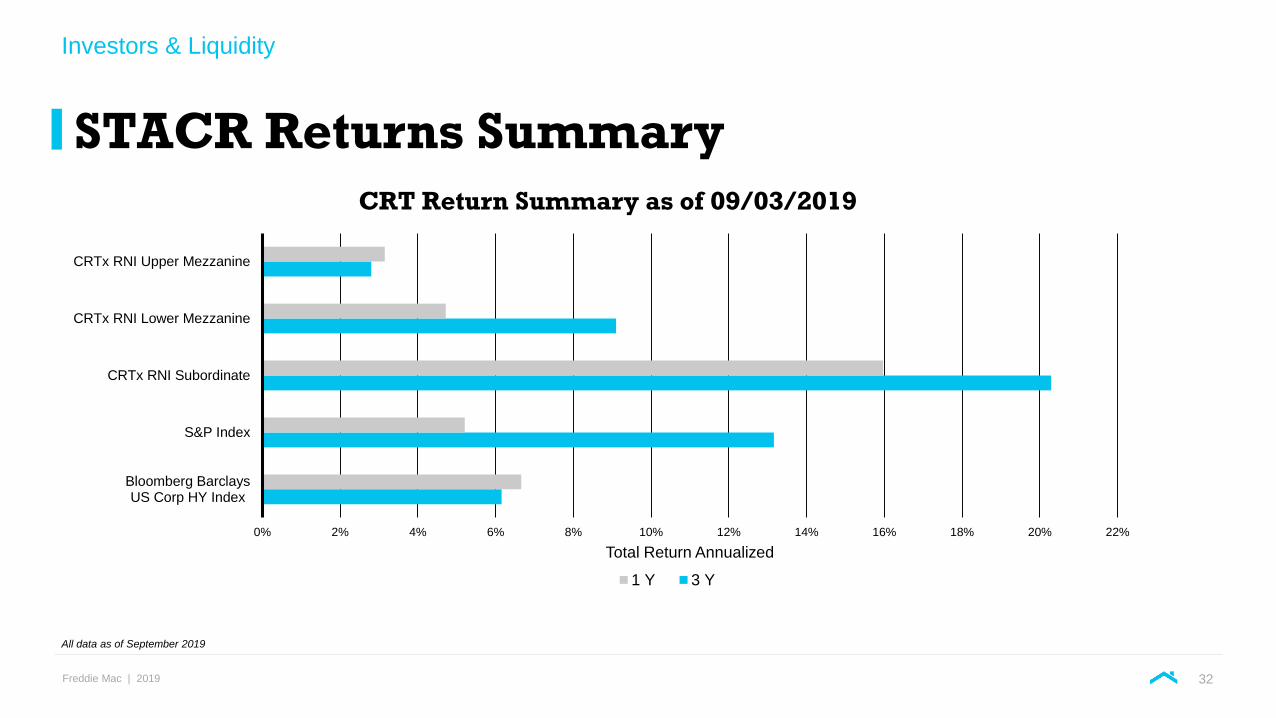
0% 2% 4% 6% 8% 10% 12% 14% 16% 18% 20% 22%
Bloomberg BarclaysUS Corp HY Index
S&P Index
CRTx RNI Subordinate
CRTx RNI Lower Mezzanine
CRTx RNI Upper Mezzanine
Total Return Annualized
CRT Return Summary as of 09/03/2019
1 Y 3 Y
STACR Returns Summary
Investors & Liquidity
32
All data as of September 2019

Freddie Mac | 2019
ACIS Returns Summary
Investors & Liquidity
33
ACIS premiums, losses, and returns on ongoing transactions are based on actual cashflow emergence to date. ACIS returns on collateral are tax adjusted and will vary by counterparty. Assumes US tax rates.
Aon’s Reinsurance Aggregate (ARA) Return on Equity measures net income attributable to common shareholders as a ratio to average common shareholders’ equity based on the following constituent reinsurers:
Alleghany, Arch, Argo, Aspen, AXIS, Beazley, Everest Re, Fairfax, Hannover Re, Hiscox, Lancashire, MAPFRE, Markel, Munich Re, Partner Re, QBE, RenRe, SCOR, Swiss Re, Validus, and XL Catlin
ACIS Returns to date as of
8/26/2019
10.7%11.3%
10.1%
8.4%
2.7%
4.2%
16.2%
2013 2014 2015 2016 2017 2018 ACIS CollateralReturns To Date
Aon's Reinsurance Aggregate (ARA) Return on Common Equity
ACIS Returns on Collateral vs. Reinsurer Returns on Common Equity

Freddie Mac | 2019
100% 100% 100% 100% 100%
40%
100% 100% 100% 100% 100%
60%
100% 100% 100%
2013 2014 2015 2016 2017 2018
M1 M2 M3
0
5
10
15
20
25
30
35
0-1 Years 1-3 Years 3-6 Years 6-10 Years
Nu
mb
er
of B
ond
s
WAL
NAIC Designation
NAIC 1 NAIC 2 NAIC 3Source: https://crt.freddiemac.com/_assets/docs/offerings/stacr/2018-stacr-debt-note-naic-designations.xlsx
Note: The National Association of Insurance Commissioners 2018 Mortgage Reference Securities Report is not a substitute for or functional equivalent of the credit ratings of rating agencies and is not produced to permit investors to compare the likelihood of default or of full and
timely payment between one or more securities.
*Security weighted average life calculated as of January 07, 2019 assuming 10 CPR and 0 CDR.
MACR Bonds are not included
STACR NAIC Designation & Rating Agency Upgrades
Investors & Liquidity
34
✓ 64 STACR bonds have an NAIC designation
DNA/HQA M1, M2, M3 Upgrades by Issuance Year
✓ 0 bonds have been downgraded
✓ Over 125 upgrades from Original to Current rating for the
entire STACR program

Credit Risk Management Framework
Single-Family Credit Risk Transfer Handbook

1. Credit Risk Management Overview
Credit Risk Management Framework

Freddie Mac | 2019
Credit Risk Management Overview
Credit Risk Management Overview
37
Freddie Mac – Risk Management
CRT is supported by an advanced risk management framework
▪ Documentation Standards and Credit
Eligibility Requirements
▪ Delegated Underwriting Guidelines
▪ Seller Representations and Warranties
▪ Loan AdvisorSM
▪ Post-Close Credit Review
▪ Quality Assurance
▪ Compliance Review
▪ Performing Loan and Non-Performing
Loan Quality Control Review
▪ Due Diligence Review
▪ Underwriting Defects Repurchase Process
▪ Seller In-House Quality Control
▪ Seller Servicer Approval Standards
▪ Loan Servicer Performance Monitoring
and Scorecard
▪ CORE Reviews
Underwriting Standards Quality Control Seller/Servicer Management

Freddie Mac | 2019
By the end of 2019, Freddie
Mac’s goal is to have 100% of
loans processed through Loan
Product Advisor or Loan
Quality Advisor*
Loan Advisor Exclusionary List
ensures only approved seller-
servicers have access to the
tools
Loans sold to Freddie Mac
must have documented
evidence of the mortgagor’s
ability to repay and of the value
of the property
Appraisal independence rules
insulate the appraiser from
influence by other parties
involved in processing or
originating the loan
Representations & Warranties
require the seller-servicer to
repurchase the loan if there is a
material underwriting defect
discovered, subject to certain
limits
Underwriting Standards
Credit Risk Management Overview
38
Loan AdvisorFreddie Mac Loan Advisor℠ is a smart, end-to-end technology solution built to provide greater certainty about the quality of loans and
offer insight into loans' purchase eligibility early in the loan production process. Loan Advisor’s advanced analytics and modeling
capabilities automate processes, catch errors and identify opportunities to reduce risk.
Loan Product
Advisor®
Condo Project
Advisor®
Loan Collateral
Advisor®
Loan Quality
Advisor®
Loan Closing
Advisor®
Loan Selling
Advisor®
Quality Control
Advisor®
Loan Coverage
Advisor®
Business
Intelligence
Correspondent
Assignment
Center
*does not include bulk deals
Freddie Mac | 2019
Underwriting Standards
Credit Risk Management Overview
39
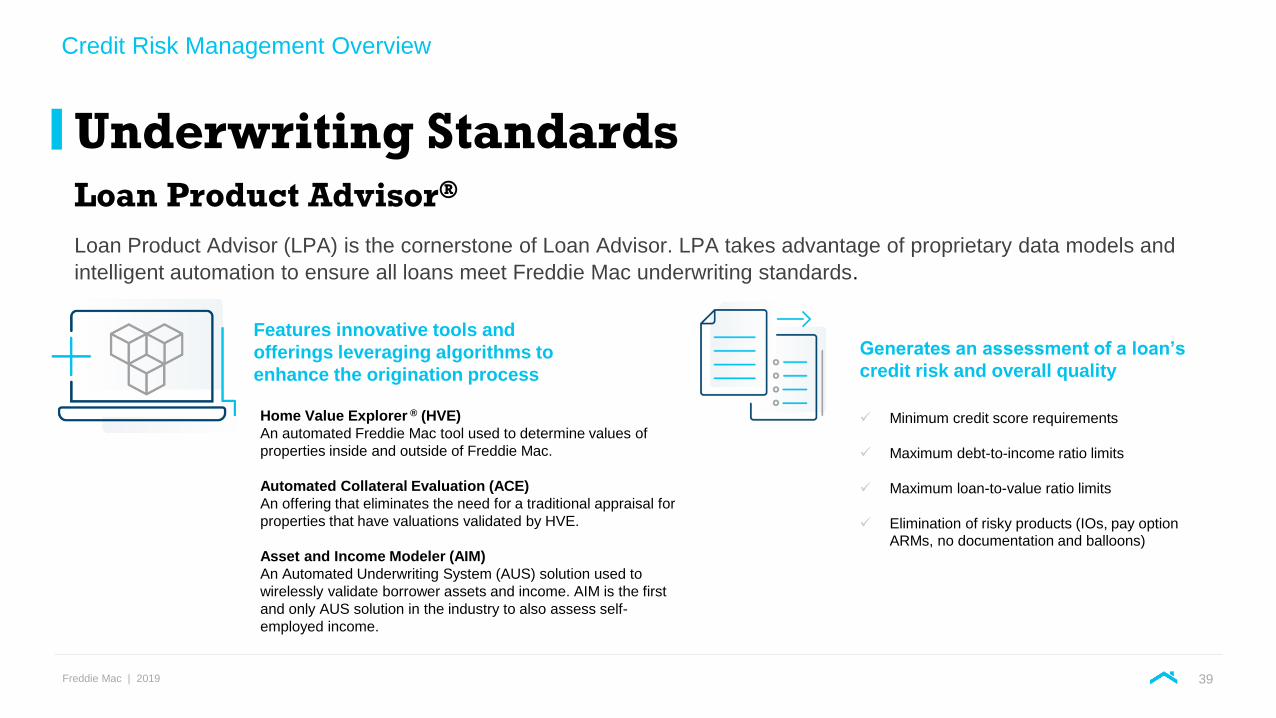
Loan Product Advisor®
Loan Product Advisor (LPA) is the cornerstone of Loan Advisor. LPA takes advantage of proprietary data models and
intelligent automation to ensure all loans meet Freddie Mac underwriting standards.
Generates an assessment of a loan’s
credit risk and overall quality
✓ Minimum credit score requirements
✓ Maximum debt-to-income ratio limits
✓ Maximum loan-to-value ratio limits
✓ Elimination of risky products (IOs, pay option
ARMs, no documentation and balloons)
Features innovative tools and
offerings leveraging algorithms to
enhance the origination process
Home Value Explorer ® (HVE)
An automated Freddie Mac tool used to determine values of
properties inside and outside of Freddie Mac.
Automated Collateral Evaluation (ACE)
An offering that eliminates the need for a traditional appraisal for
properties that have valuations validated by HVE.
Asset and Income Modeler (AIM)
An Automated Underwriting System (AUS) solution used to
wirelessly validate borrower assets and income. AIM is the first
and only AUS solution in the industry to also assess self-
employed income.

Freddie Mac | 2019
Performing Loan QC
▪ Regularly perform QC on a random and targeted basis to test the quality of recently purchased loans, including added
focus on key elements of particular interest or concern (e.g., loan attributes or sellers).
▪ Freddie Mac benchmarks every loan we purchase against our valuation model and appraisals are assessed within our
automated system, Loan Collateral Advisor® for instantaneous feedback to the originator.
▪ CRT transactions perform a separate Due Diligence review
Non-Performing Loan QC ▪ Freddie Mac also reviews mortgage loans that default within the first few years after purchase or guarantee.
Seller In-House QC
▪ Each loan seller must have an in-house QC program that has written procedures and operates independently of the
sellers’ origination and underwriting functions.
▪ Freddie Mac reviews, monitors, and provides feedback on sellers’ QC and origination practices, including performing on-
site reviews of its largest sellers.
Quality Control (QC)
Credit Risk Management Overview
40
Freddie Mac performs QC on all purchased loans, including those that are credit enhanced by any of the CRT programs. Losses are
mitigated through a comprehensive QC program across performing and non-performing loans, including third-party QC processes by lenders.

Freddie Mac | 2019
Account Plans▪ Focused on covered National, Regional and Community Servicers, Independent Mortgage Bankers, Specialty Servicers,
Master Servicers and Subservicers.
▪ Sets goals and objectives, establishes agreed-upon action plans and milestones.
File Reviews, Rewards and Remedies
▪ Identifies servicing performance gaps and trends, encourages and rewards quality servicing.
▪ Helps identify and resolve issues and provides consequences for poor data quality and servicing processes.
Servicer Success Scorecard
▪ Covers Master, Interim, Sub and Consolidated servicing modes
▪ Performance evaluation specific to servicer segments (ranked groups), uses synthetics and ranks.
▪ Provides loan level data and analyses.
▪ SHARPSM – Servicer Honors and Rewards Program enables eligible servicing clients to receive annual rewards based on
completion of the Servicer Success Scorecard.
Counterparty Operational Risk Evaluation (CORE)
▪ Identifies SF counterparty operational risk issues and monitors remediation.
▪ Provides assessment of Counterparty’s compliance with Guide Requirements.
▪ Conducts on-site due diligence of Servicers’ preparedness for large MSR transfers.
▪ Works closely with account managers and Single-Family Operations to ensure review scope addresses new/ emerging risks.
Seller/Servicer Management
Credit Risk Management Overview
41
Freddie Mac believes that a well-rounded view of servicing performance supports a broad and in-depth analysis of
both performing and non-performing loans.

2. Loss MitigationCredit Risk Management Framework

Freddie Mac | 2019
Liquidation
Options
Loan
Modification
Options
Payment
Relief
Options
Loss Mitigation Waterfall
Loss Mitigation
1. Forbearance
2. Repayment Plan
3. Deferred
Payment Alternative
4. Flex Modification
5. Standard Short Sale
6. Deed-in-Lieu
1. Forbearance
Relief option that provides a temporary reduction or
suspension of payments to give Borrowers a period of
time to improve their financial situation.
2. Repayment
Plan
Borrowers that have had a short term hardship, and now
have the ability to begin making payments again, but
either do not want or do not require a loan modification
3. Deferred
Payment
Alternative
A relief option for Borrowers with a resolved hardship,
who are 30 or 60 days delinquent, but have recently
made at least 2 consecutive monthly payments (rolling
delinquency). Past due payments are deferred (non-
interest bearing) and will be due at maturity.
4. Flex
Modification
An affordable modification that provides significant
payment relief to eligible borrowers, leverages
requirements of the Freddie Mac Standard and
Streamlined Modifications
5. Standard
Short Sale
Borrowers that wish to gracefully exit the home by selling
the property for less than the total amount necessary to
satisfy the mortgage. Cash or note contribution may be
required in some instances.
6. Standard
Deed-in-Lieu
Borrowers that wish to gracefully exit the home by
voluntarily conveying clear and marketable title of the
property to Freddie Mac in exchange for a discharge of
debt.
Current 30 Days 60 Days 90 Days 180 Days Foreclosure
43

Freddie Mac | 2019
REO Overview
Loss Mitigation
Mission: effectively manage Freddie Mac’s credit losses in a way that maximizes financial recoveries and
supports community stabilization.
44
Credit Loss ManagementImprove Collateral Values
Manage Expenses
Maximize Remedies
Community StabilizationPreserve, Maintain, & Repair
Price Homes At Fair Market Value
Non-Profit / Owner Occupant Priority

Freddie Mac | 2019
REO Business Model & Process
Loss Mitigation
45
REO Support &
Financial Functions
Managed By
Freddie Mac Staff
Freddie Mac staff perform
oversight monitoring, support,
and financial functions.
REO Core Process
Outsourced With
Freddie Mac
Oversight
The outsourcer and their vendors
are required to use Freddie Mac
systems, follow detailed policies &
procedures, and utilize proprietary
methodologies for valuation,
pricing, and repair decisioning.
Freddie Mac utilizes an asset management firm to perform the core REO disposition activities using their vendor network.
Asset Management Firm
(Outsourced)
Listing
Brokers
Freddie Mac: Oversight | Support | Financial Functions
P&M
VendorsGeneral
Contractors
Eviction
Attorneys
Title & Closing
Agents

Freddie Mac | 2019
REO Core Competencies
Loss Mitigation
46
Efficient & Controlled ProcessesMature, efficient, and controlled disposition processes that helped us effectively
manage our REO portfolio during the last financial crisis. Processes are continually
refined as business and market conditions change.
Valuation & Pricing MethodologiesExtensive disposition data and analytics used to develop pricing models and disposition
strategies to maximize collateral recoveries.
Risk ManagementProven financial, liability and reputation risk management practices.
“Good Neighbor Policy”REO homes are properly maintained and priced to protect communities. Nonprofit /
Owner Occupant exclusive purchase opportunities.
Experienced StaffExperienced and tenured staff & management team.
Core Competencies
Efficient &
Controlled
Processes
Valuation &
Pricing
Methodologies
Risk Management
“Good
Neighbor
Policy”
Experienced
Staff

Freddie Mac | 2019
Servicing Guidelines for Disaster Relief
Loss Mitigation
A property located in a county, parish or municipality has been declared by the President of the United States to be
a Major Disaster Area where federal aid in the form of Individual Assistance is being made available (Eligible
Disaster Area).
47
Freddie Mac Disaster Policy goes into effect when:
Servicers must assist borrowers with Freddie Mac-owned mortgages who work or reside in the designated eligible disaster area
Suspend Payments for up to 12 months
Suspend Reportingdelinquencies to credit bureaus
Waive Fees for being late and assessment of new penalties during
forbearance, trial, or repayment plan periods
Disburse Insuranceproceeds

Freddie Mac | 2019
Servicing Disaster Relief Timeline
Loss Mitigation
Disaster Modifications General Modifications
Extend Modification Disaster Relief Modification Flex Modification
Borrower resumes close to contractual payment Borrower resumes contractual payment Targeting a payment reduction of 20% or greater
Advanced escrow and escrow shortage is spread over up to
60 months in a repayment planDelinquencies (including advanced escrow) are capitalized Delinquencies (including advanced escrow) are capitalized
Term is only extended by number of payments missedTerm is extended only enough to achieve equal to, or just less
than, contractual paymentTerm is extended up to 480 months
May provide interest rate relief
Only available for borrowers affected by disaster May result in principal forbearance
48
Disaster strikes90 day forbearance
begins
Servicer establishes
Qualified Right party
Contact (QRPC) to
determine effect of
disaster on homeowner
Servicer works with
borrower to transition
from forbearance into
the appropriate
modification option to
cure the delinquency;
(forbearance can
continue for a maximum
of 12 months)
If borrower was current
or less than 31 days
delinquent at time of the
disaster and the servicer
has established QRPC
three main modifications
are available:

3. Home PossibleCredit Risk Management Framework

Freddie Mac | 2019
Home Possible® Overview
Home Possible
50
Home Possible® offers flexibility to meet a variety of borrowers’ needs.
Borrower Profile
First-time homebuyers, move-up
borrowers, and retirees
Effective July 28, 2019 all HP loans will
have the same income limits of 80%
AMI, regardless of where the mortgage
premise is located
Key Features
Purchase and no cash out refinancing.
Maximum 97 percent LTV/ TLTV/HTLTV. 105
percent TLTV with Affordable Second.®
Sweat equity allowed for the entire amount of
down payment and closing costs.
Mortgage insurance options
Loan Product Advisor or manual underwriting
No reserves required for 1-unit properties for
manually underwritten mortgages.
Maximum credit fee in price of 1.5 percent, with
no credit fee in price on many loans.
Borrower Benefits
Stable monthly payments with fixed-rate
mortgages
Flexible sources of funds for down payment
Reduced mortgage insurance coverage for
LTV ratios greater than 90%
Minimum down payment of 3% allowed.

Freddie Mac | 2019
Home Possible® Overview
Home Possible
51
Feature Home Possible Standard Conventional
Eligible Mortgages15, 20, and 30-year fixed
5/1, 5/5, 7/1 and 10/1 CMT- and LIBOR-indexed
ARMS
15, 20, and 30-year fixed
5/1, 5/5, 7/1 and 10/1 CMT- and LIBOR-indexed
ARMS
Maximum LTV1 Unit: 97%
2-4 Unit: 95%95%
Maximum TLTV105% affordable second
97% secondary financing95%
Occupancy 1 to 4 unit primary residencePrimary residence, second home, or investment
property
Property Type1 to 4 unit: Single-Family, Condos, PUDs,
Manufactured Housing (1-unit primary residences only)
1 to 4 unit: Single-Family, Condos, PUDs,
Manufactured Housing
Other Income Boarder income (1-unit properties only) All income considered
Mortgage InsuranceLender Paid Single Premium MI and Financed Single
Premium MI allowedLender Paid or Borrower Paid
Underwriting MethodLoan Product Advisor® (LPA) or Manual – LPA flags
Home Possible eligible loansLPA or LQA
No Credit Score BorrowersBorrowers with no credit score can be evaluated
through LPA
At least one borrower on the transaction must have a
usable credit score
Income LimitDetermined by LPA;
Non-LPA HP eligibility is determined by the HP Income
and Eligibility Tool
No Income Limits
Geographic Limit No Geographic Limits No Geographic Limits
Mortgage Insurance Coverage Levels
Home Possible
Fixed Rate >20yrs
Non-Home Possible
Fixed Rate >20yrs
Standard Custom* Standard Custom*
>80% & ≤85%
LTV12% 6% 12% 6%
>85% & ≤90%
LTV25% 12% 25% 12%
>90% & ≤95%
LTV25% 16% 30% 16%
>95% & ≤97%
LTV25% 18% 35% 18%
*If custom mortgage insurance is chosen, in addition to all other applicable
delivery fees, the custom mortgage insurance delivery fee applies, including on
Home Possible Mortgages

Collateral Performance
Single-Family Credit Risk Transfer Handbook

Freddie Mac | 2019
Credit Quality of Single Family Portfolio
Collateral Performance
53
Serious Delinquencies
0%
2%
4%
6%
8%
10%
12%
14%
16%
18%
20%
1 6 11 16 21 26 31 36 41 46 51 56 61 66 71 76 81 86 91 96
Pre-Crisis Cumulative D90 by Vintage
1999 2000 2001 2002 2003
2004 2005 2006 2007 2008
0.0%
0.5%
1.0%
1.5%
2.0%
2.5%
3.0%
1 6 11 16 21 26 31 36 41 46 51 56 61 66 71 76 81 86 91 96
Post-Crisis Cumulative D90 by Vintage
2002 2009 2010 2011 2012
2013 2014 2015 2016 2017
Despite falling house prices in their early years, the performance of the 2009 and 2010 vintages are dramatically better than pre-crisis
vintages.
Source: Data included in tables were derived from Freddie Mac’s Single Family Loan Level Dataset (SF LLD) as of February 2019 refresh: Originations: 1999-December 31, 2017. Performance data: 1999 - June 30, 2018, Losses reported for loans
liquidated as of Q12018.
(1) Loans with an LTV between 60% and 97%, Fixed Rate with term between 241-360.

Freddie Mac | 2019
0.10% 0.14%0.26%
0.44%
0.89%
2.57%
3.85%3.89%
2.02%
0.37%0.15%
0.07% 0.02% 0.01% 0.01% 0.00% 0.00% 0.00%0.0%
0.5%
1.0%
1.5%
2.0%
2.5%
3.0%
3.5%
4.0%
4.5%
2000 2001 2002 2003 2004 2005 2006 2007 2008 2009 2010 2011 2012 2013 2014 2015 2016 2017
Cu
mu
lati
ve
Ne
t L
os
s
Reference Pool Proxy
DNA Proxy Cohort Performance Example
Collateral Performance
54
Class M-1 takes 100% loss(1)
Class M-2 takes 100% loss(1)
Class B-1 takes 100% loss(1)
Class B-2 takes 100% loss(1)
For Illustrative Purposes Only
(1) Assuming no principal payments

Freddie Mac | 2019
0.00
0.10
0.20
0.30
0.40
0.50
0.60
0.70
0.80
0.90
1 2 3 4 5 6 7 8 9 10 11 12 13 14 15 16 17 18 19 20 21 22 23 24 25 26 27 28 29 30 31 32 33 34 35 36 37 38 39 40 41 42 43 44 45 46 47 48 49 50
Cumulative Net Loss (bps)15DNA115DNA215DNA316DNA116DNA216DNA316DNA417DNA117DNA217DNA318DNA118DNA218DNA319DNA119DNA2
0.00%
0.05%
0.10%
0.15%
0.20%
0.25%
0.30%
0.35%
90+ Days Delinquent (% by Current Balance)
90-119 120-179 180+ BK/FC/REO
DNA Performance
Collateral Performance
55
0
5
10
15
20
25
30
35
Voluntary Prepayment Rate (% by Balance) 13-DN113-DN214-DN114-DN214-DN314-DN415-DN115-DNA115-DNA215-DNA316-DNA116-DNA216-DNA316-DNA417-DNA117-DNA217-DNA318-DNA118-DNA218-DNA319-DNA119-DNA2
Source: Freddie Mac monthly remittance data. All data as of August 2019

Freddie Mac | 2019
DNA Third-Party Base Expected Default and Loss
Collateral Performance
56
28 19 20 23 23 18 18 25 16 1223 17
91
75
153
80 82
123
67
82
108
41
78 81
0
25
50
75
100
125
150
175
200
BAML CreditSuisse
JPMorgan
BAML CreditSuisse
JPMorgan
BAML CreditSuisse
JPMorgan
BAML CreditSuisse
JPMorgan
18-DNA3 19-DNA1 19-DNA2 19-DNA3
Collateral Expected Default and Loss at Issuance to Maturity
Cumulative Loss Cumulative Default B2 Attachment B1 Attachment
**Disclaimer: The estimates shown above are for informational purposes only and delivered solely as reference material with respect to Freddie Mac. There is no assurance that the actual losses of the Reference Obligations will mirror the estimates shown above. The information
contained in these materials may be based on assumptions regarding market conditions and other matters that may be of a proprietary nature to the model owners and unknown to Freddie Mac. The model owners have consented to Freddie Mac’s use and presentation of the
estimates shown here, but do not make any representations that the information is accurate or complete. Neither Freddie Mac, nor the model owners, take responsibility for or make representations regarding the reasonableness of the underlying assumptions that form the basis of
the estimates shown here or the likelihood that the estimates shown will coincide with actual market conditions or events and the estimates should not be relied upon for such purposes.
Freddie Mac | 2019
DNA Outstanding Balances & Loss Estimates
Collateral Performance
57
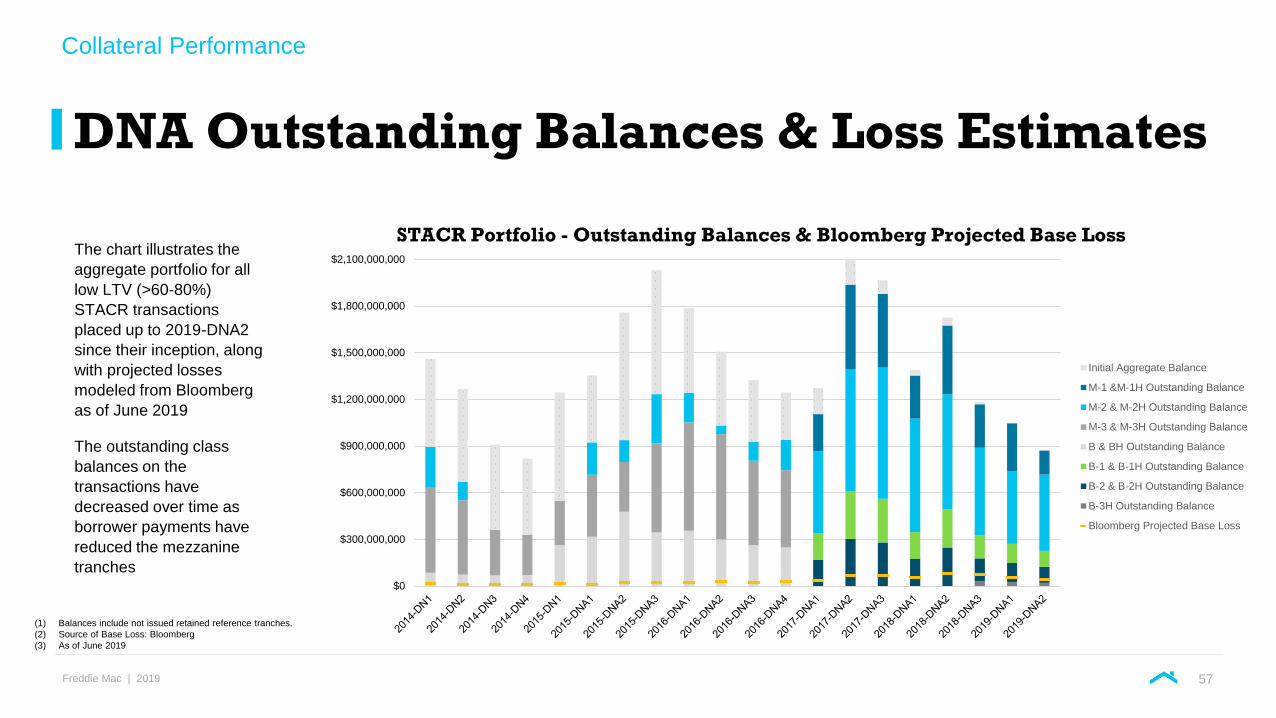
The chart illustrates the
aggregate portfolio for all
low LTV (>60-80%)
STACR transactions
placed up to 2019-DNA2
since their inception, along
with projected losses
modeled from Bloomberg
as of June 2019
The outstanding class
balances on the
transactions have
decreased over time as
borrower payments have
reduced the mezzanine
tranches
(1) Balances include not issued retained reference tranches.
(2) Source of Base Loss: Bloomberg
(3) As of June 2019
$0
$300,000,000
$600,000,000
$900,000,000
$1,200,000,000
$1,500,000,000
$1,800,000,000
$2,100,000,000
STACR Portfolio - Outstanding Balances & Bloomberg Projected Base Loss
Initial Aggregate Balance
M-1 &M-1H Outstanding Balance
M-2 & M-2H Outstanding Balance
M-3 & M-3H Outstanding Balance
B & BH Outstanding Balance
B-1 & B-1H Outstanding Balance
B-2 & B-2H Outstanding Balance
B-3H Outstanding Balance
Bloomberg Projected Base Loss
Freddie Mac | 2019
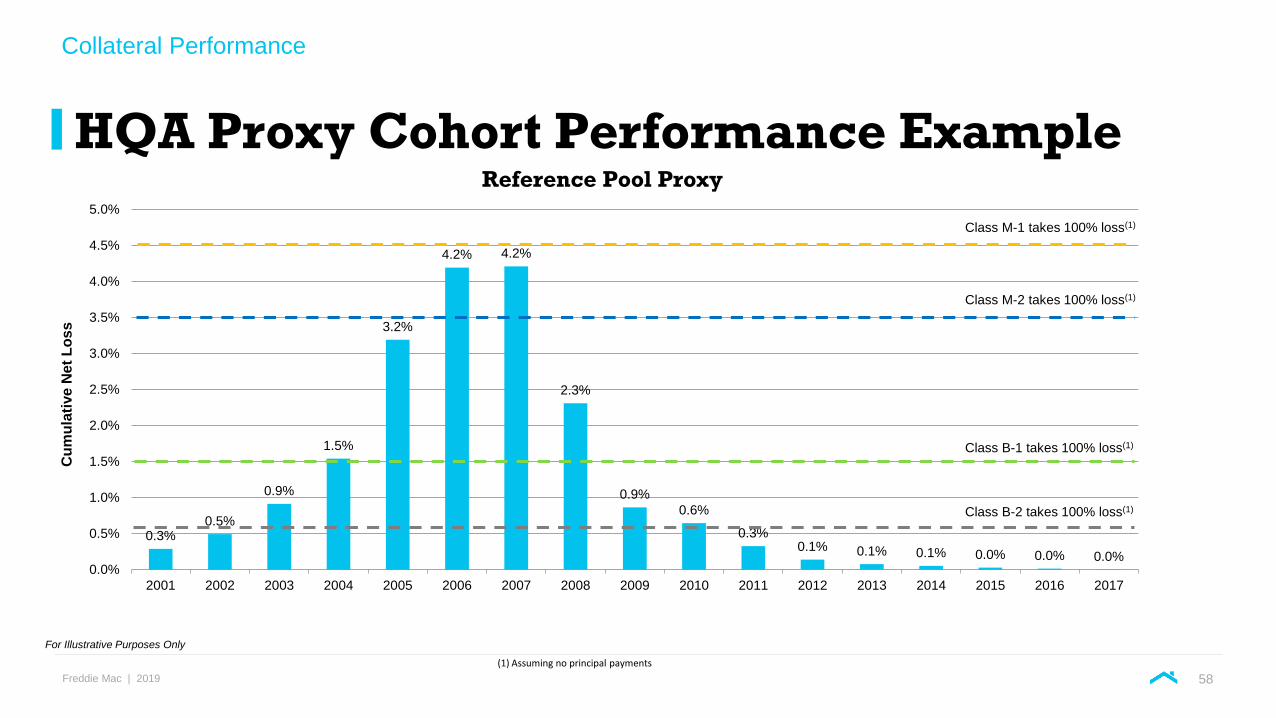
0.3%0.5%
0.9%
1.5%
3.2%
4.2% 4.2%
2.3%
0.9%
0.6%
0.3%0.1% 0.1% 0.1% 0.0% 0.0% 0.0%
0.0%
0.5%
1.0%
1.5%
2.0%
2.5%
3.0%
3.5%
4.0%
4.5%
5.0%
2001 2002 2003 2004 2005 2006 2007 2008 2009 2010 2011 2012 2013 2014 2015 2016 2017
Cu
mu
lati
ve
Ne
t L
os
s
Reference Pool Proxy
HQA Proxy Cohort Performance Example
Collateral Performance
58
Class M-1 takes 100% loss(1)
Class M-2 takes 100% loss(1)
Class B-1 takes 100% loss(1)
Class B-2 takes 100% loss(1)
For Illustrative Purposes Only
(1) Assuming no principal payments

Freddie Mac | 2019
0.0%0.1%0.2%0.3%0.4%0.5%0.6%0.7%0.8%0.9%1.0%1.1%
90+ Days Delinquent (% by Current Balance)
90-119 days 120-179 days 180+ days BK/ REO/ FCL
HQA Performance
Collateral Performance
59
Source: Freddie Mac monthly remittance data. All data as of August 2019
0
0.1
0.2
0.3
0.4
0.5
0.6
0.7
0.8
1 2 3 4 5 6 7 8 9 10 11 12 13 14 15 16 17 18 19 20 21 22 23 24 25 26 27 28 29 30 31 32 33 34 35 36 37 38 39 40 41 42 43 44 45 46 47
Cumulative Net Loss (bps) 15-HQA1
15-HQA2
16-HQA1
16-HQA2
16-HQA3
16-HQA4
17-HQA1
17-HQA2
17-HQA3
18-HQA1
18-HQA2
19-HQA1
19-HQA2
0
5
10
15
20
25
30
35
Voluntary Prepayment Rate (% by Balance)
15-HQ1
15-HQ2
15-HQA1
15-HQA2
16-HQA1
16-HQA2
16-HQA3
16-HQA4
17-HQA1
17-HQA2
17-HQA3
18-HQA1
18-HQA2
19-HQA1
19-HQA2
Freddie Mac | 2019
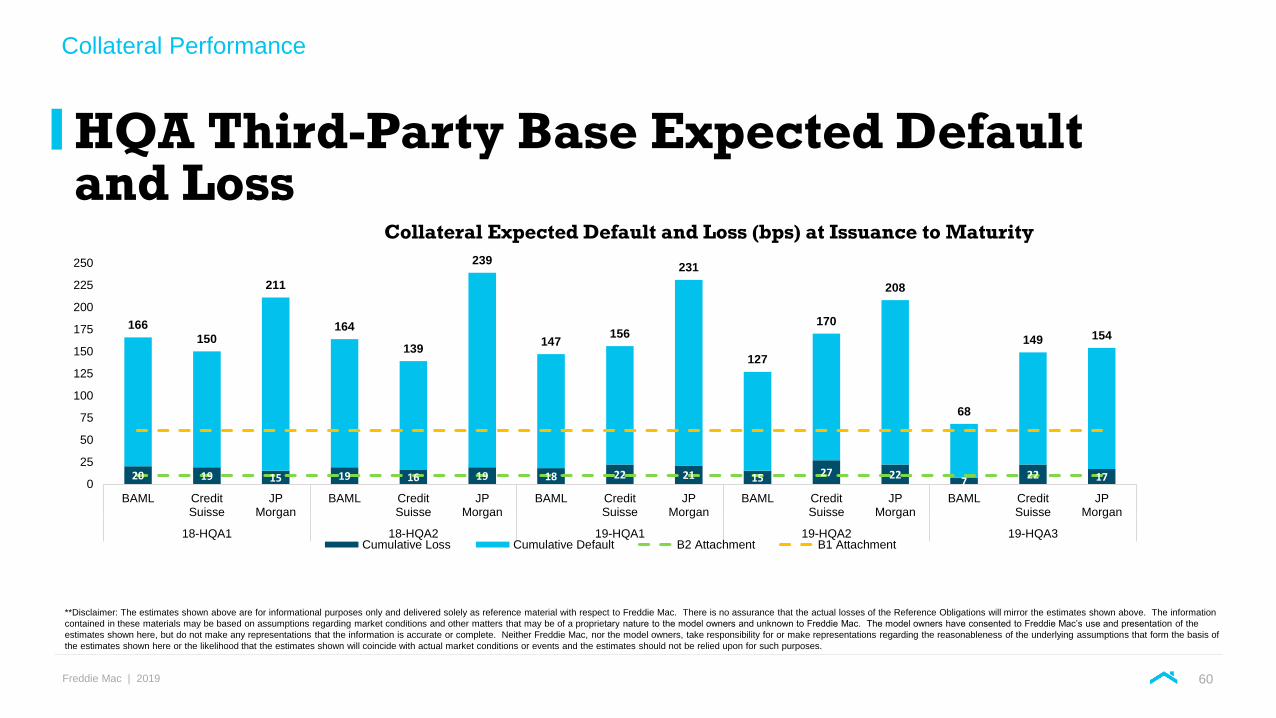
HQA Third-Party Base Expected Default and Loss
Collateral Performance
60
20 19 15 19 16 19 18 22 21 15 27 227
22 17
166
150
211
164
139
239
147156
231
127
170
208
68
149 154
0
25
50
75
100
125
150
175
200
225
250
BAML CreditSuisse
JPMorgan
BAML CreditSuisse
JPMorgan
BAML CreditSuisse
JPMorgan
BAML CreditSuisse
JPMorgan
BAML CreditSuisse
JPMorgan
18-HQA1 18-HQA2 19-HQA1 19-HQA2 19-HQA3
Collateral Expected Default and Loss (bps) at Issuance to Maturity
Cumulative Loss Cumulative Default B2 Attachment B1 Attachment
**Disclaimer: The estimates shown above are for informational purposes only and delivered solely as reference material with respect to Freddie Mac. There is no assurance that the actual losses of the Reference Obligations will mirror the estimates shown above. The information
contained in these materials may be based on assumptions regarding market conditions and other matters that may be of a proprietary nature to the model owners and unknown to Freddie Mac. The model owners have consented to Freddie Mac’s use and presentation of the
estimates shown here, but do not make any representations that the information is accurate or complete. Neither Freddie Mac, nor the model owners, take responsibility for or make representations regarding the reasonableness of the underlying assumptions that form the basis of
the estimates shown here or the likelihood that the estimates shown will coincide with actual market conditions or events and the estimates should not be relied upon for such purposes.

Freddie Mac | 2019
HQA Outstanding Balances & Loss Estimates
Collateral Performance
61
The chart illustrates the
aggregate portfolio for all high
LTV (>80-97%) STACR
transactions placed up to
2018-HQA3 since their
inception, along with projected
losses modeled from
Bloomberg as of September
2019
The outstanding class
balances on high LTV (>80-
97%) STACR transactions
have decreased over time as
borrower payments have
reduced the mezzanine
tranches
(1) Balances include not issued retained reference tranches.
(2) Source of Base Loss: Bloomberg
(3) As of September 2019
$0
$250
$500
$750
$1,000
$1,250
$1,500
$1,750
$2,000
$2,250
STACR Portfolio - Outstanding Balances & Bloomberg Projected Base Loss
Initial Aggregate Balance
M-1 & M-1H Outstanding Balance
M-2 & M-2H Outstanding Balance
M-3 & M-3H Outstanding Balance
B & BH Outstanding Balance
B-1 & B-1H Outstanding Balance
B-2 & B-2H Outstanding Balance
B-3H Outstanding Balance
Bloomberg Projected Base Loss

Freddie Mac | 2019
47 47 49 51 53 53 54
47
55 55 56 58 59 59 60 62 6366 67 68 71 73
75 74 75 75 76 76 76 74 76 75 75 76 75 75 75 75 75 76 76 76 76 76
Original LTV vs. Estimated LTV
(DN Series)
Estimated LTV Original LTV
65 61
65 67 61
68 68 69 71 71 71 74 75 76 80 82
85 89
92 92 92 92 92 92 92 92 92 92 92 92 92 92 92 93 93 93
Original LTV vs. Estimated LTV
(HQ Series)
Estimated LTV Original LTV
Estimated LTV Numbers
Collateral Performance
62
*Same reference pool. **Weighted average life was 28 months at issuance, typical transaction is between 9-12 months.
On-going positive house price
appreciation allows borrowers
to build equity; thereby,
reducing loan-to-value ratio and
credit risk.
▪ Home Value Explorer® (HVE®) is a
Freddie Mac AVM tool that
generates an estimate of property
value
▪ HVE provides extensive coverage
of all 50 states and more than
3,100 counties with its database of
~100 million property records.
▪ For more information on HVE visit:
www.freddiemac.com/hve/hve* *
All data as of August 2019
Freddie Mac | 2019
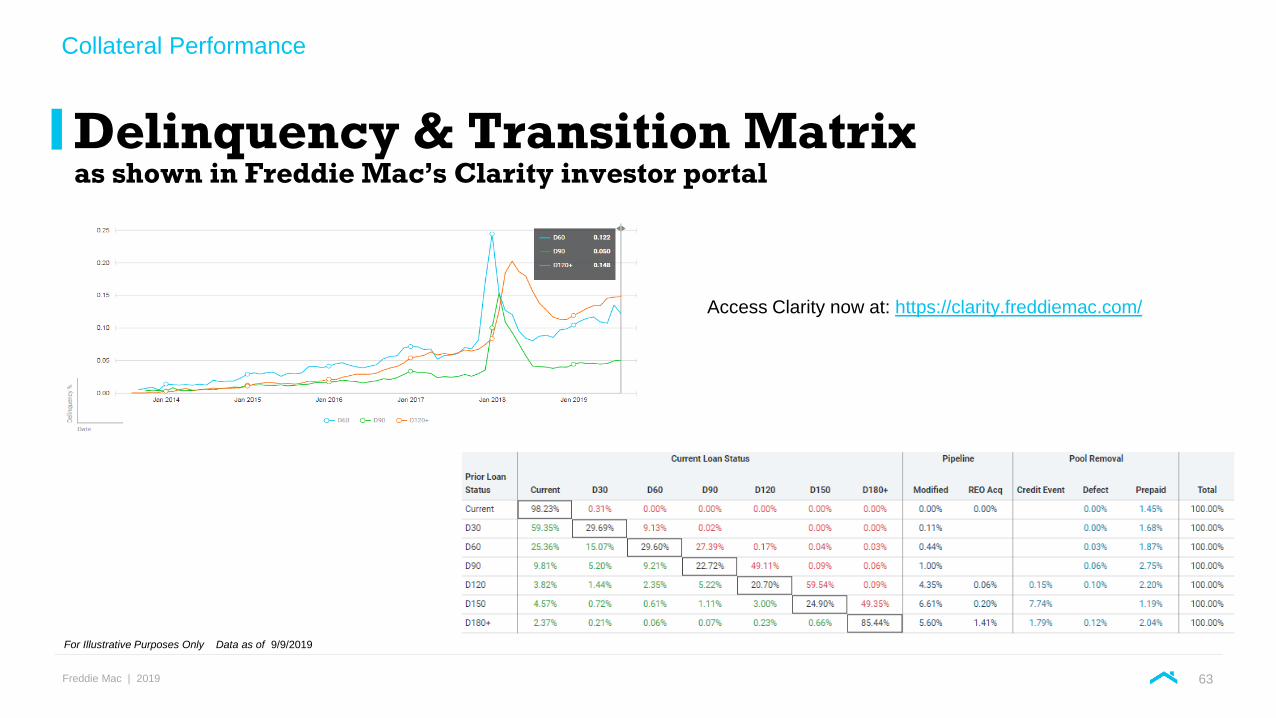
Delinquency & Transition Matrix as shown in Freddie Mac’s Clarity investor portal
Collateral Performance
63
Access Clarity now at: https://clarity.freddiemac.com/
For Illustrative Purposes Only Data as of 9/9/2019

U.S. Housing Market Overview
Single-Family Credit Risk Transfer Handbook

Freddie Mac | 2019
(1) Based on the company’s purchases of loans and issuances of mortgage-related securities. For the periods presented, a borrower may be counted more than once if the company purchased more than one loan (purchase or refinance mortgage) relating to the same borrower.
(2) Consists of both home retention actions and foreclosure alternatives.
(3) * Categories are not mutually exclusive, and a borrower in one category may also be included in another category in the same or another period. For example, a borrower helped through a home retention action in one period may subsequently lose his or her home through a
foreclosure alternative in a later period.
Freddie Mac Housing Market Support
U.S. Housing Market Overview
65
Single-family loan workouts2
Th
ou
san
ds
Th
ou
san
ds
Families helped to own or rent a home1
739 820 866
343
745828
884
445
937 663 442
257
24212311
2192
1045
2016 2017 2018 2019 YTD*
Multifamily rental units Single-Family Purchase borrowers
Single-Family Refinance borrowers
43 45
60
17
12 10
11
4
515
16
4
9
5
3
1
69
75
90
26
2016 2017 2018 2019 YTD*
Short sales and deed-in-lieu of foreclosure transactions* Forbearance agreements*
Repayment plans* Loan modifications*
YTD* As of June 30, 2019

Freddie Mac | 2019
0.6 0.8 0.8 0.8 1.0 1.1 1.1 1.2 1.2
1.5 1.1
0.50.9
1.0 0.70.5
0.90.6
2.11.9
1.3
1.8
2.11.8
1.6
2.0
1.8
2012 2013 2014 2015 2016 2017 2018F 2019F 2020F
0
5
10
15
20
25
1990 1992 1994 1996 1998 2000 2002 2004 2006 2008 2010 2012 2014 2016 2018
$10.4
$15.8
$26.1
Home Equity
Single-family Mortgage Debt Outstanding
Source: Freddie Mac August 2019 Economic and Housing Research Outlook. Includes only 1st lien loans
Refi
Purchase
(1) Value of U.S. housing stock includes homes with and without underlying mortgages. U.S. home equity is the difference between the value of the U.S.
housing stock and the amount of U.S. single-family mortgage debt outstanding.
Source: US Census Bureau, Freddie Mac July 2019 Economic and Housing Research Outlook.
Note: Dashed line indicates forecasted data
Size of the US Residential Mortgage Market ($ Trillions)
Source: Federal Reserve Flow of Funds, Inside Mortgage Finance, Fannie Mae, Freddie Mac, eMBS and Urban Institute. Last updated
June 2019. Note: Unsecuritized first liens includes loans held by commercial banks, GSEs, savings intuitions, and credit unions.
U.S. Housing Market Size and Sales
U.S. Housing Market Overview
66
Source: Federal Reserve Board’s Flow of Funds Accounts, Table B. 101. Data as of March 31, 2019.
Annual Single-family mortgage originations ($ Trillions)
Home Sales (Existing + New)
Total value of U.S. real estate held by households1 ($ Trillions)
3.5
4.0
4.5
5.0
5.5
6.0
6.5
7.0
7.5
8.0
8.5
9.0
Mill
ion
Units

Freddie Mac | 2019
-1.0
-0.5
0.0
0.5
1.0
1.5
2.0
2000 2001 2003 2004 2006 2007 2009 2010 2012 2013 2015 2016 2018
For-Rent Inventory (Millions)
For-Sale Inventory (Millions)
62
63
64
65
66
67
68
69
70
2000 2001 2002 2003 2004 2005 2006 2007 2008 2009 2010 2011 2012 2013 2014 2015 2016 2017 2018 2019
110
120
130
140
150
160
170
180
190
200
2005 2006 2007 2008 2009 2010 2011 2012 2013 2014 2015 2016 2017 2018 2019
Negative values reflect undersupply. The under/oversupply of vacant housing was estimated based on the average vacancy rate from 1Q
1994 to 4Q 2003. Source: Freddie Mac calculations using US Census Bureau data. Data as of June 30, 2018.
Source: US Census Bureau Note: Data as of July 25, 2018.
Homeownership rates are low despite
low unemployment levels:
• Many more millennial renters
• High student debt loan burden
• Limited access to credit
• Affordability
• Prices increasing quicker than wages
64.1%
Cumulative increase of 17.8% since June 2006 (NSA Series)
2019 Q2 Not Seasonally Adjusted
(NSA) Index Growth: (2.68%)
2019 Q2 Seasonally Adjusted (SA)
Index Growth: (0.81%)
Freddie Mac House
Price Index
(December
2000=100)
Based on Freddie Mac’s single-family credit guarantee portfolio. Quarterly growth rates are calculated as a 3-month change based on the final
month of each quarter. Historical growth rates change as new data becomes available. Values for the most recent periods typically see the
largest changes. Cumulative increase, based on the NSA series, calculated as the percent change from June 2006 to June 2019.
Source: Freddie Mac.
National Home Prices
Note: Serious delinquency is defined as 90 days or more past due or in the foreclosure process. Not seasonally adjusted.
Source: “Housing Finance At a Glance: A Monthly Chartbook”, Housing Finance Policy Center, February 2019; Fannie
Mae, Freddie Mac, MBA Delinquency Survey and Urban Institute.
Serious Delinquency Rates Single-Family-Loans
Housing Market Trends
U.S. Housing Market Overview
67
Vacant Housing Over/Undersupply
-0.9
0%
2%
4%
6%
8%
10%
2006 2007 2008 2009 2010 2011 2012 2013 2014 2015 2016 2017 2018 2019
Fannie Freddie FHA VA
3.76%
1.96%
0.76%0.69%
Homeownership Rate %

Freddie Mac | 2019
Home Price Increase Outpaces Income
U.S. Housing Market Overview
68
Source: http://www.freddiemac.com/singlefamily/comparing.html
House prices in the U.S.
have increased at a rapid
pace over the last few years,
growing about twice as fast
as the long-run average;
household income has not
kept pace creating an
affordability challenge
There are differences across MSAs in terms of house prices and incomes; using
an internal Freddie Mac model we compared the 50 largest MSAs. We
estimated a long-term fundamental value and compared it to the Freddie Mac
House Price Index (FMHPI), below are the MSAs where the FMHPI is 20%
higher than its long-term fundamental value for at least two consecutive quarters:
01. Austin, TX 04. Houston, TX 07. Nashville, TN
02. Dallas, TX 05. Las Vegas, NV 08. San Antonio, TX
03. Denver, CO 06. Miami, FL 09. Tampa, FL

Freddie Mac | 2019
Economic and Housing Market Outlook
U.S. Housing Market Overview
69
Major Economic Indicators2018 2019 2020
Indicator Q1 Q2 Q3 Q4 Q1 Q2 Q3 Q4 Q1 Q2 Q3 Q4 2017 2018 2019 2020
Real GDP Growth (%) 2.60 3.50 2.90 1.10 3.10 2.10 1.80 1.90 1.90 1.80 1.70 1.70 2.80 2.50 2.22 1.77
Consumer Prices (%)a 3.20 2.10 2.00 1.50 0.90 2.90 2.40 2.30 2.20 2.10 2.00 1.90 2.10 2.20 2.12 2.05
Unemployment Rate (%)b 4.10 3.90 3.80 3.80 3.90 3.60 3.70 3.70 3.70 3.80 3.80 3.90 4.38 3.90 3.73 3.80
30-Year Fixed Mtg. Rate (%)b 4.30 4.54 4.57 4.80 4.40 4.01 3.60 3.60 3.60 3.60 3.70 3.80 4.00 4.55 3.90 3.68
5/1 Hybrid Treas. Indexed ARM Rate (%)b 3.60 3.76 3.88 4.10 3.90 3.63 3.40 3.40 3.40 3.40 3.50 3.60 3.20 3.84 3.58 3.48
10-Year Const. Mat. Treas. Rate (%)b 2.80 2.90 2.90 3.00 2.70 2.30 1.80 1.80 1.80 1.80 1.80 1.80 2.33 2.90 2.15 1.80
1-Year Const. Mat. Treas. Rate (%)b 1.90 2.30 2.50 2.70 2.50 2.30 1.80 1.80 1.70 1.70 1.70 1.70 1.23 2.35 2.10 1.70
Federal Funds Effective Rate (%) b. 1.45 1.74 1.92 2.20 2.40 2.40 2.13 2.13 2.00 2.00 1.90 1.90 1.00 1.83 2.27 1.95
Housing and Mortgage Markets
Housing Startsc 1.32 1.26 1.23 1.19 1.21 1.26 1.26 1.27 1.27 1.28 1.28 1.29 1.20 1.25 1.25 1.28
Total Home Sales (Incl. Condos)d 6.15 6.04 5.91 5.72 5.88 5.92 5.96 6.00 6.03 6.04 6.03 6.05 6.12 5.96 5.94 6.04
FMHPI House Price Appreciation (%)e 1.95 0.98 1.04 0.81 0.99 0.80 0.77 0.77 0.77 0.77 0.59 0.50 7.20 4.87 3.37 2.64
1-4 Family Mortgage Originationsf
Conventional $289 $350 $341 $302 $280 $445 $487 $417 $361 $382 $378 $319 $1,400 $1,282 $1,630 $1,440
FHA & VA $88 $90 $94 $82 $75 $100 $130 $111 $96 $101 $101 $85 $410 $354 $415 $383
Total $377 $440 $435 $384 $355 $545 $617 $528 $457 $483 $479 $404 $1,810 $1,636 $2,045 $1,823
Refinancing Share - Originations (%)g 40 29 25 26 36 38 49 45 42 36 29 25 37 30 43 33
Residential Mortgage Debt (%)h 2.9 3.1 3.0 2.1 2.3 3.0 2.9 2.9 2.9 2.9 2.8 2.8 3.0 2.8 2.9 2.9
Note: Quarterly and annual forecasts (or estimates) are shown in shaded areas; totals may not add due to rounding; annual forecast data are averages of quarterly values, except GDP and CPI which are reported as Q4 over Q4.
a. Calculations based on quarterly averages of monthly index levels; index levels based on the seasonally-adjusted, all-urban consumer price index; reported as an annual rate.
b. Quarterly average of monthly unemployment rates (seasonally-adjusted); Quarterly average of monthly interest rates (not seasonally-adjusted); reported as an annual rate.
c. Millions of housing units; quarterly averages of monthly, seasonally-adjusted levels (reported at an annual rate).
d. Millions of housing units; total sales are the sum of new and existing detached single-family homes; quarterly averages of monthly, seasonally-adjusted levels (reported at an annual rate).
e. Quarterly growth rate of Freddie Mac's House Price Index; seasonally-adjusted; annual rates for yearly data.
f. Billions of dollars (not seasonally-adjusted). Includes only 1st lien mortgage originations.
g. Home Mortgage Disclosure Act for 1st lien single-family mortgages (not seasonally-adjusted); Annual share is dollar-weighted average of quarterly shares.
h. Federal Reserve Board; growth rate of single-family residential mortgage debt (households and nonprofit organizations; home mortgages; liability, seasonally-adjusted), reported as annual rate.
Prepared by the Economic & Housing Research group; Send comments and questions to [email protected].
http://www.freddiemac.com/research/forecast/20190828_low_mortgage_rates_strong_labor_markets.page?

ResourcesSingle-Family Credit Risk Transfer Handbook

Freddie Mac | 2019
Data Transparency
Resources
71
Freddie Mac has made available the Single-Family Loan-Level Dataset as part of a larger effort to increase transparency; The dataset
includes loan-level origination and monthly loan performance data on over 26.6 million loans.
http://www.freddiemac.com/research/datasets/sf_loanlevel_dataset.page
Additionally, Freddie Mac releases a STACR Loan-Level Dataset for all deals on a monthly basis.
Access the data files, disclosure file layout, and glossary here:
https://crt.freddiemac.com/offerings/stacr.aspx#overview-details
In 2019, CLARITY launched brining further insight into Freddie Mac’s CRT program. Origination and Performance metrics are available
with new enhancements scheduled.
https://clarity.freddiemac.com/
Additional information about Freddie Mac’s Single-Family CRT offerings including: issuance calendars, historical performance
presentations, NAIC designations and more can be found at:
https://crt.freddiemac.com/

Freddie Mac | 2019
Market Support Tools
Resources
72
Freddie Mac’s credit risk offerings have deep market support. Analyze and Model transactions using these tools:
Freddie Mac
CLARITY
Credit Suisse
Locus Tool
Milliman
M-Pire
J.P. Morgan
Morgan Markets
RiskSpan
Edge
LSEG
Yield Book
Bloomberg
Terminal/BTM Model
CoreLogic
Property Data Leader

Freddie Mac | 2019
Clarity
Resources
73
Freddie Mac’s data intelligence portal for investors
Clarity’s preset configurations offer quick, clear
views into Freddie Mac CRT data and make it
easy for any user to get valuable insights
quickly. Easily export and download charts to
your desktop – it’s that simple
Clarity’s data visualizations enhance
understanding with crisp, clear information
design that makes it easy to spot trends and
zero in on key figures.
The Clarity you see today is just the beginning.
We’re already working on initiatives to bring
you more features, more functionality and more
flexibility to get exactly the analysis and insights
you need to stay on top of a dynamic market.
Advanced Filters For Quick Performance Analysis
Data Visualizations Bring Raw Numbers To Life
Up Next: Even More Clarity
Clear. Concise. Immediate. Illuminating.
Access Clarity Now

Freddie Mac | 2019
Disaster Relief Servicing Resources
Resources
74
Freddie Mac Disaster Relief Reference Guide
http://www.freddiemac.com/learn/pdfs/service/disaster_mod.pdf
Natural Disaster Relief web page:
http://www.freddiemac.com/singlefamily/service/natural_disasters.html
Managing Hazard Insurance Losses reference:
http://www.freddiemac.com/learn/pdfs/service/mhil.pdf
Guide Chapter 8404
https://guide.freddiemac.com/app/guide/chapter/8404
Seller/Servicer Guide
https://guide.freddiemac.com/app/guide/

AppendixSingle-Family Credit Risk Transfer Handbook

Freddie Mac | 2019
Qualified Mortgage
Appendix
76
In 2014, new CFPB rules went into effect to provide homeowners and consumers shopping for a home mortgage with new rights and
greater protection from harmful practices. Now, nearly every mortgage a lender makes must now be evaluated based on the borrower’s
ability to repay. These new rules defined a new class of mortgages called “Qualified Mortgages” or “QM.”
QM Common Rules:
▪ A loan a borrower should be able to repay – lenders must assess a borrower’s ability to repay, in general the borrower must have a DTI of 43% or less including mortgage payments.
▪ Safer and easier to understand – no risky features like negative amortization or interest-only payments and terms of 30 years or less
▪ Fairer deal – limit the points and fees lenders can charge when they want to make a qualified mortgage to 3 percent
“GSE Patch”:
▪ If a loan made to a borrower is eligible for purchase by one of the GSEs or insured by FHA, VA, or USDA the loan may have a DTI higher than 43% with no maximum.
▪ This option exists until it expires on January 10, 2021 or when the GSEs exit conservatorship whichever occurs first; the FHA, VA, and USDA rules are permanent.
▪ Currently, there is no option for higher DTI loans past 2021 for the GSEs, but the CFPB is currently considering options

Transaction Considerations
Appendix

Freddie Mac | 2019
Enhanced Relief Refinance
Transaction Considerations
78
Enhanced Relief Refinance (ERR) is Freddie Mac’s high LTV ratio refinance program which was developed at the direction of the FHFA
ERR provides refinance opportunities to borrowers with existing Freddie Mac guaranteed mortgage loans who are making their mortgage
payments on time but whose LTV ratio for a new mortgage exceeds the maximum allowed for standard refinance products under our Guide
ERR substitution in CRT pools is subject to CFTC approval; after approval, loans in the reference pool that refinance through ERR will
replace the original loans in the reference pool.
If Freddie Mac does not get CFTC approval then the loans in this pool that refinance through ERR will be treated as a prepayment
Replacement loans refinanced through ERR will not constitute a Modification Event
Eligibility limited to:
▪ Loans owned or securitized by Freddie Mac that were funded on or after October 1, 2017
▪ Have been originated at least 15 months prior to refinance date
▪ No 30-day delinquency in the past 6 months and no more than one 30-day delinquency in the preceding 12 months
Freddie Mac | 2019
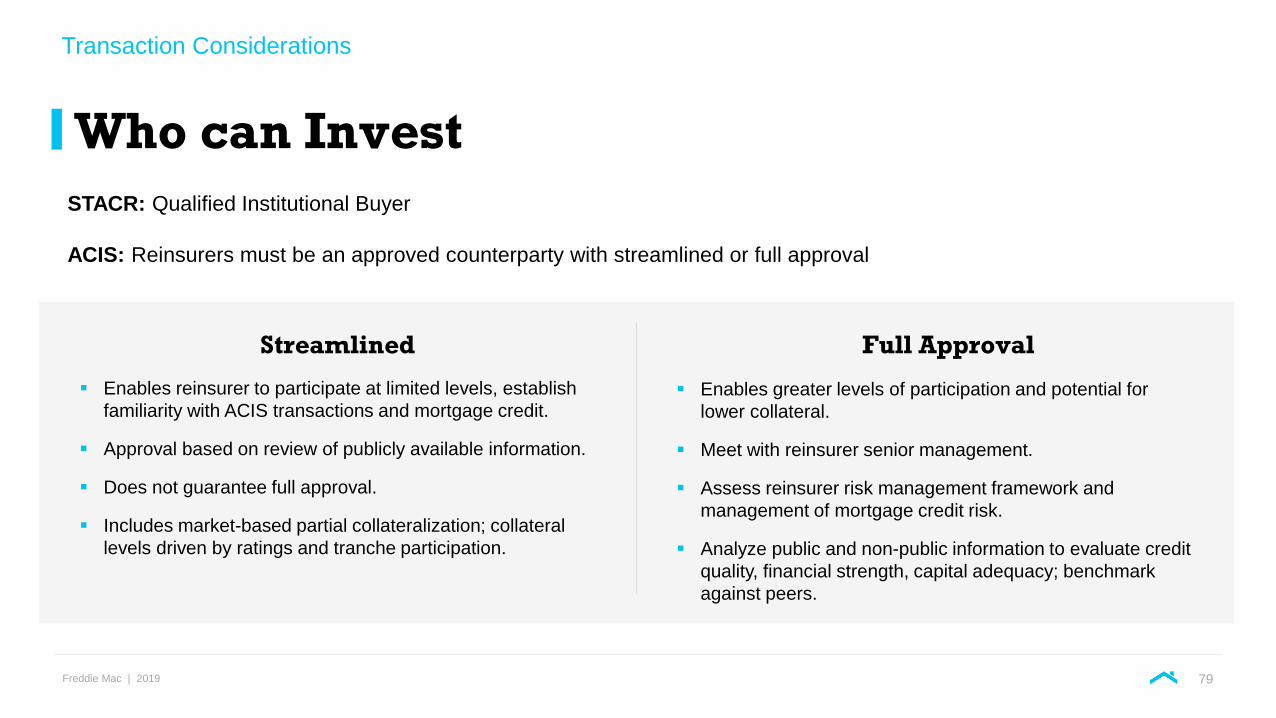
Who can Invest
Transaction Considerations
79
STACR: Qualified Institutional Buyer
ACIS: Reinsurers must be an approved counterparty with streamlined or full approval
▪ Enables greater levels of participation and potential for
lower collateral.
▪ Meet with reinsurer senior management.
▪ Assess reinsurer risk management framework and
management of mortgage credit risk.
▪ Analyze public and non-public information to evaluate credit
quality, financial strength, capital adequacy; benchmark
against peers.
▪ Enables reinsurer to participate at limited levels, establish
familiarity with ACIS transactions and mortgage credit.
▪ Approval based on review of publicly available information.
▪ Does not guarantee full approval.
▪ Includes market-based partial collateralization; collateral
levels driven by ratings and tranche participation.
Streamlined Full Approval

Freddie Mac | 2019
Michael S. ReynoldsVice President, CRT
(571) 382-4852
Christian ValenciaDirector, STACR
(571) 382-3727
Jeffrey ShueDirector, ACIS
(571) 382-3023
Charlotte Gladwin Director, STACR
(571) 382-3732
Michael MuraiManager, STACR
(571) 382-5702
Sonya ShethManager, Fixed Income Marketing
(571) 382-4376
Freddie Mac Key Contacts
Transaction Considerations
80

Freddie Mac | 2019
Safe Harbor Statements
Transaction Considerations
Freddie Mac obligationsFreddie Mac’s securities are obligations of Freddie Mac only. The securities, including any
interest or return of discount on the securities, are not guaranteed by and are not debts or
obligations of the United States or any federal agency or instrumentality other than Freddie
Mac.
No offer or solicitation of securities This presentation includes information related to, or referenced in the offering documentation
for, certain Freddie Mac securities, including offering circulars and related supplements and
agreements. Freddie Mac securities may not be eligible for offer or sale in certain jurisdictions
or to certain persons. This information is provided for your general information only, is current
only as of its specified date and does not constitute an offer to sell or a solicitation of an offer to
buy securities. The information does not constitute a sufficient basis for making a decision with
respect to the purchase or sale of any security. All information regarding or relating to Freddie
Mac securities is qualified in its entirety by the relevant offering circular and any related
supplements. Investors should review the relevant offering circular and any related
supplements before making a decision with respect to the purchase or sale of any security. In
addition, before purchasing any security, please consult your legal and financial advisors for
information about and analysis of the security, its risks and its suitability as an investment in
your particular circumstances.
Forward-looking statements Freddie Mac's presentations may contain forward-looking statements, which may include
statements pertaining to the conservatorship, the company’s current expectations and
objectives for its Single-family Guarantee, Multifamily and Capital Markets segments, its efforts
to assist the housing market, liquidity and capital management, economic and market
conditions and trends, market share, the effect of legislative and regulatory developments and
new accounting guidance, credit quality of loans the company owns or guarantees, the costs
and benefits of the company’s credit risk transfer transactions, and results of operations and
financial condition on a GAAP, Segment Earnings, non-GAAP and fair value basis. Forward-
looking statements involve known and unknown risks and uncertainties, some of which are
beyond the company’s control. Management’s expectations for the company’s future
necessarily involve a number of assumptions, judgments and estimates, and various factors,
including changes in market conditions, liquidity, mortgage spreads, credit outlook, actions by
the U.S. government (including FHFA, Treasury and Congress), and the impacts of legislation
or regulations and new or amended accounting guidance, could cause actual results to differ
materially from these expectations. These assumptions, judgments, estimates and factors are
discussed in the company’s Annual Report on Form 10-K for the year ended December 31,
2018, Quarterly Reports on Form 10-Q, and Current Reports on Form 8-K, which are available
on the Investor Relations page of the company’s website at www.freddiemac.com/investors
and the SEC’s website at www.sec.gov. The company undertakes no obligation to update
forward-looking statements it makes to reflect events or circumstances occurring after the date
of this presentation.
81

Freddie Mac | 2019
Disclaimer
Transaction Considerations
Notice to all Investors:
This presentation (“Presentation”) is not an offer to sell any Freddie Mac securities. Offers for any given security are
made only through applicable offering circulars and any related supplements, which incorporate Freddie Mac's
Annual Report on Form 10-K for the year ended December 31, 2018, filed with the SEC on February 14, 2019, and
all documents that Freddie Mac files with the SEC pursuant to Section 13(a), 13(c) or 14 of the Exchange Act,
excluding any information "furnished" to the SEC on Form 8-K. Content in this Presentation is not reflective of
current markets/spreads and is not indicative of any future Freddie Mac offerings. Please use this Presentation for
informational purposes only.
Notice to United Kingdom Investors:
This Presentation is only being distributed to and is directed at: (a) investment professionals falling within Article 19
of the Financial Services and Markets Act 2000 (Financial Promotion) Order 2005 (the "FPO"); (b) high net worth
entities falling within Article 49 of the FPO; and (c) other persons in respect of whom exemptions under the FPO are
available. The investments to which this Presentation relates are available only to, and any agreement to acquire
such investments, will be made only with, such persons. Any other person should not act or rely on this
Presentation or any of its contents.
This Presentation is not intended to be an offer of transferable securities to the public in the United Kingdom or any
European Union jurisdiction, in accordance with the Prospectus Directive (2003/71/EC, as amended). In any event,
this Presentation is made available only in circumstances in which a prospectus requirement under such Directive
does not apply, including but not limited to the distribution of this Presentation to qualified investors only.
Notice to Canadian Investors:
This Presentation is confidential and may not be reproduced or transferred, in whole or in part, to any other party
that is not an employee, officer, director, or authorized agent of the recipient without the express written consent of
Freddie Mac. Each person accepting these materials agrees to return them promptly upon request.
The material provided herein is for informational purposes only and delivered solely as reference material with
respect to Freddie Mac. The Presentation does not constitute an offer to sell or a solicitation of an offer to buy any
securities of Freddie Mac. Any offering of securities of Freddie Mac will occur only in accordance with the terms
and conditions set forth in an offering circular (“Offering Circular”). Investors are strongly urged to carefully review
the Offering Circular (including the risk factors described therein) and to discuss any prospective investment in
Freddie Mac with their legal and tax advisers in order to make an independent determination of the suitability and
consequences of an investment.
No person has been authorized to give any information or to make any representation, warranty, statement or
assurance not contained in the Offering Circular and, if given or made, such other information or representation,
warranty, statement or assurance must not be relied upon.
Prospective investors should inform themselves and take appropriate advice as to any applicable legal
requirements and any applicable taxation and exchange control regulations in the countries of their citizenship,
residence or domicile which might be relevant to the subscription, purchase, holding, exchange, redemption or
disposal of any securities of Freddie Mac.
Targets shown in this Presentation are objectives and should not be construed as providing any assurance or
guarantee as to the results that may be realized in the future from investment in any asset or asset class described
in the Presentation. Please be advised that any targets shown in the Presentation are subject to change at any
time and are current as of the date of this Presentation only. In addition, the information contained herein includes
observations and/or assumptions and involves significant elements of subjective judgment and analysis. No
representations are made as to the accuracy of such observations and assumptions and there can be no
assurances that actual events will not differ materially from those assumed. In the event any of the assumptions
used in the Presentation do not prove to be true, results are likely to vary substantially from those discussed therein.
Notice to Spain Investors:
No action has been or will be taken by Freddie Mac that would permit a public offering of the STACR securities in
Spain. Neither the STACR securities nor the offering have been or will be registered or approved by the Spanish
Securities Market Commission (Comisión Nacional del Mercado de Valores) and, therefore, no prospectus has
been or will be registered or approved by the CNMV for the purposes of this offering.
A prospective investor in securities of Freddie Mac must conduct its own independent review and due diligence to
make its own assessment of the merits and risks of making an investment in, perform its own legal, accounting and
tax analysis and conclude that the investment in the securities of Freddie Mac (i) is fully consistent with the
investor’s financial requirements and financial condition, investment objectives and risk tolerance; (ii) complies and
is fully consistent with all investment policies, guidelines and restrictions applicable to the investor; and (iii) is a fit,
proper and suitable investment for the investor.
82